corrective action plan - marylandmde.maryland.gov/programs/land/oilcontrol/documents/ha co - bel...
TRANSCRIPT

CORRECTIVE ACTION PLAN
Bel Air Xtra Fuels
MDE Case #2011-0112-HA
2476 Churchville Road
Bel Air, MD
Prepared for:
DRAKE PETROLEUM COMPANY, INC.
P.O. Box 488.
Newburgh, NY, 12550
Prepared by:
GROUNDWATER & ENVIRONMENTAL SERVICES, INC.
2142 Priest Bridge Court, Suite 1
Crofton, Maryland 21114
October 2011

Corrective Action Plan Bel Air Xtra Fuels 2476 Churchville Rd, Bel Air, MD
CORRECTIVE ACTION PLAN
BEL AIR XTRA FUELS 2476 CHURCHVILLE ROAD
BEL AIR, MARYLAND MDE CASE #2011-0112-HA
October 31, 2011
Prepared for: Prepared by: Eric Harvey Mid-Atlantic Environmental Compliance & Remediation Manager Drake Petroleum Company, Inc. P.O. Box 488 Nick Kurtz Newburgh, NY, 12550 Environmental Scientist Dan Drennan, EIT Project Engineer Reviewed by: __________________________ Andrea Taylorson-Collins Project Manager
Richard Evans, PE Director of Engineering
Groundwater & Environmental Services, Inc. 2142 Priest Bridge Court, Suite 1
Crofton, MD 21114 (800) 220-3606

TABLE OF CONTENTS
1.0 INTRODUCTION............................................................................................................................. 1 1.1 Site Description ............................................................................................................................ 1 1.2 Site History / Investigations.......................................................................................................... 2 1.3 Geology / Hydrogeology .............................................................................................................. 4 1.4 Soil Quality................................................................................................................................... 4 1.5 Groundwater Quality .................................................................................................................... 5 2.0 SUMMARY OF FEASIBILITY TESTING ................................................................................... 6 2.1 Methodology................................................................................................................................. 6 2.2 Testing Activities.......................................................................................................................... 7 2.2.1 Step Test – Groundwater Methodology (P&T)................................................................... 7 2.2.2 Soil Vapor Extraction (SVE) Test Methodology................................................................ 7 2.2.3 Vacuum Enhanced Groundwater Extraction (VEGE) Test Methodology.......................... 7 2.3 Feasibility Test Results................................................................................................................. 8 2.3.1 Feasibility Testing at MW-10 ............................................................................................. 8 2.3.2 Feasibility Testing at TF-1.................................................................................................. 9 2.3.3 Feasibility Testing at MW-7 ............................................................................................. 10 2.3.4 Feasibility Testing at MW-12 ........................................................................................... 11 2.4 Feasibility Test Summary and Conclusions ............................................................................... 12 3.0 REMEDIAL TECHNOLOGY FEASIBILITY EVALUATION ................................................ 13 4.0 RISK EVALUATION..................................................................................................................... 15 5.0 PROPOSED REMEDIAL STRATEGY ....................................................................................... 16 5.1 Proposed Recovery Well Network ............................................................................................. 16 5.2 System Components ................................................................................................................... 17 5.3 Remedial System Permitting ...................................................................................................... 17 6.0 MONITORING, REPORTING AND CASE CLOSURE............................................................ 18 6.1 Monitoring Schedule .................................................................................................................. 18 6.2 Reporting Schedule..................................................................................................................... 18 6.3 Case Closure ............................................................................................................................... 18

Corrective Action Plan Bel Air Xtra Fuels 2476 Churchville Rd, Bel Air, MD
TABLES Table 1 – Historic Groundwater Monitoring Well and Tank Field Monitoring Well Gauging Table 2 – Soil Quality Data Summary Table 3 – Groundwater Quality Data Summary Table 4 – Potable Well Sampling Results Summary
FIGURES Figure 1 – Site Location Map Figure 2 – One-Half Mile Radius Map Figure 3 – Site Map Figure 4 – Groundwater Monitoring Map Figure 5 – Proposed Recovery Well Network Map Figure 6 – Estimated VEGE ROI Map Figure 7 – P&T System Conceptual Flow Process Diagram
APPENDICES
Appendix A – Soil Boring Logs (MW-12, MW-13, MW-14 and MW-16) Appendix B – Laboratory Analytical Reports and Chain of Custody Documentation Appendix C – Maryland Well Records
ATTACHEMENTS
Attachment 1-Field Data Attachment 2-Vacuum versus Flow Graphs Attachment 3-ROI Graphs
Attachment 4-Vapor Analytical Data Summary Attachment 5-Dissolved Phase Laboratory Analytical Data Attachment 6-Determination of Harshness

Corrective Action Plan Bel Air Xtra Fuels 2476 Churchville Rd, Bel Air, MD
1
1.0 INTRODUCTION Groundwater & Environmental Services, Inc. (GES), on behalf of Drake Petroleum Company, Inc. (Drake), is pleased to submit a Corrective Action Plan (CAP) for the station located at 2476 Churchville Road in Bel Air, Maryland (the Site) (Figure 1). The Maryland Department of the Environment (MDE) Case number assigned to the site is 2011-0112-HA. The objective of this CAP is to provide a remedial approach to address on-site groundwater impacts and to comply with the MDE directives dated June 1, 2011 and July 20, 2011. Furthermore, this CAP will define a proposed remedial plan and remedial endpoints based on risk to human health and the environment, including consideration of hydrocarbon source areas and on-site/off-site remedial efforts to date. 1.1 Site Description The site is located at 2476 Churchville Road in Bel Air, Harford County, Maryland. The Site, currently an Xtra Fuels gasoline, diesel and kerosene station and convenience store, is located in a commercial strip mall parking lot, Campus Hills Shopping Center. Campus Hills Shopping Center contains a Food Lion grocery store, Gardiners Furniture and various other small businesses located north of the Site. A parking lot for the Food Lion grocery store is located east of the Site, followed by an open field. A parking lot containing the La Tolteca restaurant is located west of the Site, followed by other restaurant properties. There are residential homes with located south of the Site, across Churchville Road. Site topography slopes to the northeast. A One Half Mile Radius Map is attached as Figure 2. In May, 1989, Easton Petroleum removed six (6) steel USTs: four (4) 2,000 gallon gasoline USTs a 1,000 gallon used oil UST and a 1,000 gallon heating oil UST. In 1989, Easton Petroleum installed five (5) USTs adjacent to the former tank field. The current UST system is single walled, composite steel/fiberglass reinforced plastic tanks with single walled fiberglass piping. There is one (1) 10,000 gallon gasoline UST, two (2) 8,000 gallon gasoline USTs an 8,000 gallon diesel UST and an 8,000 gallon kerosene UST. The UST system was tested in July and August 2011 and the results of the testing were submitted to the MDE in August 2011. The tank field is located adjacent to the western side of the property building. A well search of the area using the MDE well database revealed the existence of 92 potable wells located within one mile of the Site, including a municipal supply well. Residential potable wells are located cross gradient of the Site across Churchville Road. Those that could be visually verified are illustrated on Figure 2. The Site itself is supplied by municipal water. The Site and the surrounding area are served by a mixture of aboveground and underground utilities. Along Churchville Road there are overhead electrical lines and underground communication lines. Underground electrical lines are located on the west, south and east sides of the property. The underground electric lines run from the kerosene dispenser island on the west side of the property south to the station sign then east to eastern edge of the property where they turn north to an area light. Storm drains were located along the northern boundary of the Site between the Campus Hills shopping center parking lot and the station building. The Site is served by Campus Hills Water Works which obtains water from five municipal water wells located in the Port Deposit, Gneiss and Wissachickon aquifers. Water and sewer connections were noted to enter the station building from the north but were unable to be traced during a private utility mark out conducted on August 11, 2009. No signs of natural gas lines were noted during the utility mark out. Locations of Site utilities are illustrated on the Site Map, Figure 3.

Corrective Action Plan Bel Air Xtra Fuels 2476 Churchville Rd, Bel Air, MD
2
1.2 Site History SITE HISTORY:
1988 The Maryland Department of the Environment (MDE) opens case number 1989-0972-HA in response to a compliance inspection indicating damaged fill caps on the UST system owned and operated by Easton Petroleum Company, Inc. (Easton Petroleum).
1989 First generation underground storage tanks (USTs) were removed and five (5) single-walled composite steel/fiberglass USTs installed on behalf of Easton Petroleum: one (1) 10,000-gallon gasoline, two (2) 8,000-gallon gasoline, one (1) 8,000-gallon diesel, and one (1) 8,000-gallon kerosene.
04/91 Four (4) groundwater monitoring wells were installed on behalf of Easton Petroleum as part of a Phase I and Phase II Environmental Site Assessment (ESA). Liquid non-aqueous phase liquids (LNAPL) were observed during this investigation and the MDE responded by issuing Notice of Violation NOV-91-182 to Easton Petroleum Company, Inc. The MDE required installation of additional groundwater monitoring well and a remediation system.
03/92 A groundwater remediation system was installed using ten (10) groundwater monitoring wells, two (2) groundwater recovery wells (R-1 and R-2), an oil/water separator tank, a pre-aerator, and two (2) liquid granular activated carbon (GAC) treatment units.
12/92 Harford County Health Department (HCHD) requested potable well sampling in the vicinity of the site. Sampling was conducted and Volatile Organic Carbons (VOCs) related to gasoline were not detected. The results were reported to MDE and follow-up was requested.
07/93 The remediation system was upgraded to include two (2) aeration units, as approved by the MDE. 09/93 Notice of Violation NV-91-182B issued due to free-phase petroleum product present in
groundwater monitoring wells MW-1 and MW-2 and monthly reports not being submitted as required.
10/93 Proposal submitted to MDE for installation of a groundwater recovery well adjacent to groundwater monitoring well MW-1 and installation of a passive bailer in groundwater monitoring well MW-2.
01/94 Installation of the new groundwater recovery well RW-3. 04/94 Groundwater recovery well RW-3 connected to established remediation system. Passive bailer
installed in groundwater monitoring well MW-2 for LNAPL removal. 06/95 Soil Vapor Extraction (SVE) pilot test conducted and groundwater monitoring well MW-9 was
installed. 11/95 A SVE test was conducted with groundwater depression. 12/96 MDE requests remediation system discharge location to be moved to a down-gradient storm drain. 01/97 Groundwater monitoring well MW-2 is paved over with asphalt and is no longer accessible. 05/97 Request from the MDE to install Oxygen Release Compound (ORC) filter socks in two
groundwater monitoring wells, MW-7 and MW-9. 10/97 Pumps removed from groundwater recovery wells RW-1 and RW-3 and the system was
reconfigured to include groundwater extraction from groundwater monitoring wells MW-1, MW-9, and groundwater recovery well RW-3; replaced the former 55-gallon aerator units with a shallow tray aerator unit to enhance treatment of the recovered groundwater.
06/00 Site is documented by the MDE to be temporarily out of service. 10/00 The MDE approves a request for the implementation of cleaning groundwater recovery wells RW-
1 and RW-2, and initiating Enhanced Fluid Recovery (EFR) events on groundwater recovery wells RW-1 and RW-3 and groundwater monitoring wells MW-1, MW-2, and MW-7.

Corrective Action Plan Bel Air Xtra Fuels 2476 Churchville Rd, Bel Air, MD
3
11/00 Well, pump, and remediation system cleaning conducted along with EFR event. 03/01 MDE received notification that Keyon Oil leases Site and returned out-of-service USTs to active
status. 05/01 MDE approves an Envirojet event and groundwater and vapor extraction from groundwater
monitoring well MW-7, and the accumulation of LNAPL in groundwater recovery well RW-3 and former groundwater recovery well RW-1.
02/02 Easton Petroleum request to shut the recovery system down due to drought conditions. 03/02 MDE grants system shut down until the water levels have recovered, at which time it will return to
operation as per Notice of Violation NV-91-182C. 07/02 A notice was sent to Easton Petroleum from the MDE, requesting all monitoring data from the
time of system shut-down to the present. 10/04 MDE was notified that Easton Petroleum forfeited status to operate a business in the state of
Maryland. 01/05 As the current UST owner, Drake Petroleum Company (Drake), began sampling the network of 12
groundwater monitoring wells and four groundwater recovery wells in accordance with Code of Maryland Regulations (COMAR) 26.10.02.03-.03-6.
05/05 Groundwater sampling data submitted on behalf of Drake per MDE request. 05/05 Receptor survey and UST system testing was conducted on behalf of Drake. 07/05 Report of receptor survey and UST system testing data submitted to MDE as part of emergency
regulations. 04/07 GES on behalf of Drake requests the MDE remove Drake from Responsible Party status. 05/09 GES on behalf of Drake submitted proof that the Site is connected to public water. Site potable
sampling terminated. 10/09 Groundwater monitoring well network abandoned with the exception of groundwater monitoring
wells MW-7 and MW-9, so these wells could be used for HRGUA sampling. 11/09 New groundwater monitoring wells MW-10 and MW-11 installed for HRGUA sampling. 02/10 Site Characterization Report submitted to MDE documenting results of the installation of
groundwater monitoring wells MW-10 and MW-11. 07/10 Warren Equities submits letter to MDE stating that Drake is not the responsible party for MDE
case #9-0972HA. 10/10 MDE sends a Non-Compliance letter to Warren Equities. 11/10 Warren Equities submits letter to MDE stating that Drake is not the responsible party for MDE
case #9-0972HA. 12/10 Site Characterization Report submitted to MDE. 01/11 MDE requests a Site Characterization Report Addendum including results of down gradient
characterization activities and two (2) quarterly post site characterization monitoring events. 06/11 GES on behalf of Drake submits Work Plan for vertical delineation of apparent source to MDE. 07/11 MDE approved the GES and Drake potable well sampling letter for 2317 and 2319 Churchville
Road. 07/11 MDE issued Conditional Work Plan Approval. 08/11 Drake submitted UST testing results to MDE. 08/11 GES submitted additional information regarding the installation of the nested wells, per MDE’s
request. MDE approved the installation on August 26, 2011. 08/11 Access agreement was signed between Drake and the Campus Hills Shopping Center property
owner to install groundwater monitoring wells off-site. 08/11 GES installed four new groundwater monitoring wells (MW-12, MW-13, MW-14 and MW-16)
on August 24 through 29, 2011.

Corrective Action Plan Bel Air Xtra Fuels 2476 Churchville Rd, Bel Air, MD
4
08/11 GES submitted a request to reduce the size of groundwater monitoring well PMW-13 from four-inches to one-inch diameter based on space and safety constraints at this location and the recovery of groundwater monitoring well MW-8 on this date.
08/11 Potable well at 2319 Churchville Road was sampled. 08/11 SHA issued a right-of-way permit for the proposed nested well in the shoulder of Churchville
Road on August 31, 2011. 09/11 Potable well at 2317 Churchville Road was sampled. 09/11 Feasibility Testing was conducted on September 8 and 9, 2011. 09/11 Potable well sampling results letter was submitted to the property owner at 2319 Churchville
Road. 09/11 Seven (7) groundwater monitoring wells, two (2) tank field wells and two (2) temporary
groundwater monitoring wells were gauged and seven (7) groundwater monitoring wells and one (1) tank field well were sampled.
09/11 Potable well sampling results were submitted to the property owner of 2317 Churchville Road. 09/11 GES, on behalf of Drake, requested a Corrective Action Plan (CAP) extension due to driller
cancellation of the proposed nested wells in the Churchville Road right of way. 1.3 Geology / Hydrogeology The Site lies in the eastern portion of Maryland’s Piedmont Physiographic Province. According to the Maryland Geologic Survey, the Site is underlain by the Port Deposit Gneiss a moderately to strongly deformed intrusive complex composed of gneissic biotite quartz diorite, hornblende-biotite quartz diorite, and biotite granodiorite; all rocks foliated and some strongly sheared; age 550 +/- 50 m.y. by radiogenic dating. Depth to groundwater across the site varies from approximately 8.44 (MW-9) to 18.80 (former MW-3) feet below ground surface (bgs). Historical liquid level gauging data is summarized in Table 1. Based on groundwater elevation data recorded on September 12, 2011, groundwater flows to the west/ southwest at a hydraulic gradient of 0.02 feet per foot. A groundwater monitoring map illustrating inferred groundwater contours is included as Figure 4. Regional topography is relatively flat, however the Site gently slopes to the northeast away from Churchville Road. The closest surface water body is an unnamed stream located approximately 750 feet to the northwest of the Site, that feeds into a pond located approximately one-half mile north of the Site. 1.4 Soil Quality On August 24 through 29, 2011, B.L. Myers Brothers (B.L. Myers), a Maryland-licensed drilling company, installed two (2) additional groundwater monitoring wells (MW-12 and MW-14) and two (2) temporary groundwater monitoring wells (MW-13 and MW-16) at the Site. Groundwater monitoring well locations are illustrated on Figure 3. B.L. Myers began by hand clearing each location to a depth of five (5) feet bgs using air-knife technology to provide utility clearance. The two (2) locations were then converted to groundwater monitoring wells using a convertible hollow stem auger and air rotary drill rig. Groundwater monitoring wells MW-12 and MW-14 were installed to a total depth of 25 feet bgs and constructed with 20 feet of 4-inch diameter PVC 0.020-slot screened casing, five (5) feet of 4-inch diameter PVC solid casing and a flush-mounted bolting well cover. The two (2) locations were then converted to groundwater monitoring wells using a Geoprobe ®. Groundwater monitoring wells MW-13 and MW-16 were installed to a total depth of 19 and 18 feet bgs, respectively, and constructed with 15

Corrective Action Plan Bel Air Xtra Fuels 2476 Churchville Rd, Bel Air, MD
5
feet of 1-inch diameter PVC 0.020-slot screened casing, and both were completed to grade with 1-inch diameter PVC solid casing and a flush-mounted bolting well cover. Sampling depths, lithological descriptions, Photoionization Detector (PID) readings, well construction details, and any other conditions noted during drilling activities are presented in the boring logs attached as Appendix A. Soil samples were collected by GES during the groundwater monitoring well installation activities of MW-10, MW-11, MW-12, MW-13, MW-14, and MW-16 in 2009 and 2011. A review of the recent soil data collected from the installation of these groundwater monitoring wells indicates adsorbed-phase gasoline petroleum hydrocarbons are mainly concentrated around groundwater monitoring well MW-10, located approximately ten (10) feet west of the tank field. Total BTEX concentrations ranged from non-detect (MW-12, MW-13, MW-14 and MW-16) to 1,492 micrograms per kilogram (µg/kg) (MW-10). Methyl-t-butyl-ether (MTBE) concentrations ranged from non-detect (MW-13) to 54,400 µg/kg (MW-10). Total Phase Hydrocarbon- Diesel Range Organics (TPH-DRO) concentrations ranged from non-detect (MW-10, MW-11, MW-12, MW-14) to 161,000 µg/kg. Total Phase Hydrocarbons - Gasoline Range Organics (TPH-GRO) concentrations ranged from non-detect (MW-11, MW-12, MW-14, MW-13, and MW-16) to 50.9 mg/kg (MW-10). Soil sampling results indicate hydrocarbon impacts are located at or below the water table. A Soil Quality Data Summary is documented in Table 2 and contains MDE standards (June 2008) for the protection of groundwater and non-residential standards. The Laboratory Analytical Reports for soil samples collected from the installation of groundwater monitoring wells MW-12, MW-13, MW-14 and MW-16 are included as Appendix B. 1.5 Groundwater Quality Historic gauging data and groundwater analytical data for the former groundwater monitoring wells and the existing groundwater monitoring well MW-7 and MW-9 since January 2001 is summarized in Table 3. Most recently, groundwater samples were collected from the groundwater monitoring wells and one tank field well on September 12, 2011. The groundwater samples were couriered to Accutest Laboratories in Dayton, New Jersey to be analyzed for full volatile organic compounds (VOCs), including fuel oxygenates in accordance with United States Environmental Protection Agency (USEPA) Method 8260 and TPH-DRO, TPH-GRO via USEPA method 8015. Maximum concentrations were reported as follows: 2,680 μg/L benzene in MW-10; 28,360 µg/L total BTEX in MW-10; 95,900 µg/L MTBE in MW-12; 24,800 µg/L TPH-DRO in MW-7; and 161,000 µg/L in MW-12. Groundwater quality data agrees with soil quality data, with maximum concentrations from gasoline constituents found in groundwater monitoring wells MW-10 and MW-12 located immediately west of the tank field. Two (2) area potable water supply wells were sampled per the June 2011 MDE directive. The results for all constituents were below the MDE drinking water standards for both wells sampled at 2317 and 2319 Churchville Road. Potable well results are summarized in Table 4. Additional investigation is recommended to determine the source of the detected petroleum constituents concentrations. Once access is established to install a nested deep and shallow well on the property of 2319 Churchville Road, the results of this investigation will be submitted as an Addendum to this CAP, under separate cover.

Corrective Action Plan Bel Air Xtra Fuels 2476 Churchville Rd, Bel Air, MD
6
2.0 SUMMARY OF FEASIBILITY TESTING A remedial feasibility test was conducted on September 8-9, 2011 to evaluate potential remedial options. Groundwater monitoring well MW-10, TF-1, MW-7, and MW-12 were utilized as extraction points for the feasibility test. SVE, Pump & Treat (P&T), and Vacuum-Enhanced Groundwater Extraction (VEGE) feasibility tests were conducted during the two (2) day test. The primary objective of remedial feasibility testing activities was to evaluate an appropriate remediation technology. Additionally, several specific data collection objectives were to be accomplished through feasibility testing. The data to be collected during feasibility testing included the following:
feasibility of VEGE technology; groundwater recovery rates under non-vacuum pumping conditions; vacuum-enhanced groundwater recovery rates; SVE extraction radii-of-influence; vapor flow rates during SVE tests; vacuum versus vapor flow relationships for individual extraction wells; vapor VOC/TPH concentrations during SVE and VEGE; and groundwater quality during pumping conditions in groundwater monitoring wells MW-10 and
MW-12.
2.1 Methodology Feasibility test activities were conducted using GES’ Data Acquisition Processing Laboratory (DAPL). The DAPL unit is a self-contained platform that provides on-site computerized real-time data acquisition and processing evaluation. The DAPL unit is fully equipped with pumps, vacuum blowers, sensors and hardware needed to conduct multiple remediation technologies and various groundwater recovery tests. On-board sensors monitor and continuously log system operating conditions and field responses, including vacuum/pressure responses, vapor and liquid flow rates and groundwater levels. The on-board computer manages and integrates the incoming data and conducts real-time calculations and analyses to allow for immediate evaluation of test conditions. This allows for flexibility in customizing the test to site conditions. P&T, SVE, and VEGE tests were conducted on groundwater monitoring wells MW-10 and MW-12, while SVE only tests were conducted on TF-1 and MW-7. Groundwater monitoring wells MW-7, MW-10, MW-12 and tank field well TF-1 were selected as testing wells due to their location within the area of concern, and proximity to other groundwater monitoring wells and tank field wells for the collection of pneumatic and hydraulic data. Applied vacuum, airflow rates, and VOC concentrations, were monitored at the extraction points during each study. Airflow readings were monitored using a Magnehelic gauge, which measures differential pressure. VOC concentrations were monitored with a calibrated PID. Induced influences (e.g., vacuum response and groundwater level fluctuations) were recorded in designated observation wells surrounding the extraction well. Vacuum response was recorded using vacuum transducers installed in the observation wells and extraction well. Magnehelic gauges calibrated in inches of water column (i.w.) were connected to the observation wells to serve as a manual check to ensure accurate data collection. Water level fluctuations were recorded using pressure transducers installed in the observation wells and the extraction well.

Corrective Action Plan Bel Air Xtra Fuels 2476 Churchville Rd, Bel Air, MD
7
2.2 Testing Activities During the SVE, P&T, and VEGE feasibility tests, the resulting induced vacuum (pneumatic influence) and liquid level drawdown (hydraulic influence) was measured at each of the surrounding observation wells. Static soil pressure conditions (positive or negative) may exist due to natural pressures that occur in the soil pore space relative to atmospheric and groundwater conditions. The soil pressure readings were recorded using Magnehelic differential pressure gauges/transducers, which were connected to each observation well. Each observation well was temporarily sealed from the atmosphere to record the pneumatic influence reading. Groundwater elevations were monitored at the observation wells through down-well pressure transducers connected to a centralized electronic data logger. Hydraulic influence readings were recorded from the data logger. The vapor stream was periodically screened for VOCs during the SVE and VEGE feasibility tests using a hand-held photoionization detector (PID). A combination explosimeter was used to monitor percent of the lower explosion limit (LEL). Prior to test activities, the PID was calibrated using zero parts per million (ppm) and 100 ppm isobutylene gas. During the SVE feasibility tests and the VEGE feasibility tests vapor samples were collected for analyses of BTEX, MTBE and TPH (C1-C4) and (>C5-C10) in accordance with EPA Method TO3 by Accutest Laboratories. To provide system design data regarding influent groundwater quality and chemistry, groundwater samples were collected during pumping activities on groundwater monitoring wells MW-10 and MW-12. The groundwater samples were analyzed for BTEX, MTBE, TPH-GRO, TPH-DRO, total dissolved solids (TDS), total suspended solids (TSS), lead, and total and dissolved calcium (Ca), iron (Fe), manganese (Mn) and magnesium (Mg). Laboratory analytical results from the feasibility tests are presented in Appendix A. Further details for each feasibility test are presented below: 2.2.1 Step Test - Groundwater Pump & Treat (P&T) Test Methodology Groundwater was removed from groundwater monitoring wells MW-10 and MW-12 by a pneumatic pump on September 8 and 9, 2011. Data collected during the tests was used to evaluate groundwater flow rates and the associated drawdown capacities under non-vacuum conditions, to calculate hydraulic characteristics, and to compare to subsequent vacuum-enhanced groundwater extraction tests. A groundwater sample was collected from MW-10 and MW-12 for laboratory analysis. 2.2.2 Soil Vapor Extraction (SVE) Test Methodology A stepped SVE test was conducted on groundwater monitoring wells MW-7, MW-10, and tank field well TF-1 on September 8, 2011 and on groundwater monitoring well MW-12 on September 9, 2011. Vacuum was applied to the wells in several steps. During the tests, vacuum propagation and groundwater levels were monitored to estimate vacuum influence and groundwater uplifting. Vapor concentrations were monitored during each step to record a baseline for VOC concentrations and a vapor sample was collected during the step test at each well. 2.2.3 Vacuum Enhanced Groundwater Extraction (VEGE) Test Methodology A stepped VEGE test was conducted on groundwater monitoring well MW-10 on September 8, 2011 and on MW-12 on September 9, 2011. During the stepped VEGE test, vacuum was applied to the extraction well in several steps while groundwater was extracted via a pneumatic pump. Vacuum influence and groundwater drawdown were monitored at the nearby observation wells to record vacuum influence and to estimate hydraulic and pneumatic characteristics. Vapor concentrations were monitored during the VEGE test and a vapor sample was collected for laboratory analysis.

Corrective Action Plan Bel Air Xtra Fuels 2476 Churchville Rd, Bel Air, MD
8
2.3 Feasibility Test Results 2.3.1 Feasibility Testing at MW-10 Groundwater monitoring well MW-10 was constructed in 2009 with 4-inch diameter PVC. It was measured to have a total depth of 24.4 feet bgs prior to testing. The static water level was 13.4 feet bgs. Groundwater monitoring wells MW-7, MW-9, MW-11, MW-12, MW-13, MW-14, and MW-16 and tank field wells TF-1 and TF-2 served as observation wells. These wells ranged in distance to groundwater monitoring well MW-10 from 10 to 68 feet. The DTW in the groundwater monitoring wells ranged from 10.24 to 14.77 feet bgs. A Site Map is presented as Figure 3. On September 8, 2011 feasibility testing on groundwater monitoring well MW-10 began with a low vacuum SVE test lasting approximately 57 minutes. Vacuum was applied at 32 inches of water (i.w.) to the extraction well. The second SVE step lasted approximately 22 minutes with vacuum applied at 50 i.w. to the extraction well. The vapor flow rate during the first step was approximately 5.59 standard cubic feet per minute (scfm) and the vapor flow rate during the second step increased to 6.36 scfm. The vapor-phase hydrocarbon recovery rate during the second step was calculated to be 0.1 pounds per day (lbs/day). At the conclusion of the SVE test, effective vacuum influence (i.e., greater than 0.10 i.w.) was observed at four (4) observation wells, reaching a maximum of 3.16 i.w. in MW-12, approximately 10 feet from the extraction well. Upwelling in the extraction well reached 3.18 feet during the SVE test. Following the SVE test, the groundwater P&T test was conducted via a groundwater pumping test (lasting approximately 53 minutes) to expose previously-saturated hydrocarbon-impacted soils and determine the groundwater recovery rate in the absence of vacuum enhancement. A 4-inch diameter, top loading pneumatic pump was placed at the bottom of the well, and the test resulted in a measurable groundwater drawdown of 5.66 feet and an average groundwater recovery rate of 1.08 gallons per minute (gpm). At the conclusion of the groundwater pumping test, drawdown was observed in five (5) observation wells, with a maximum of 0.37 feet in groundwater monitoring well MW-12 (approximately 10 feet from the extraction well). During VEGE test activities at groundwater monitoring well MW-10, vacuum was applied in four (4) steps. The first step (approximately 48 minutes in duration), a vacuum of 50 i.w. was applied to MW-10. The second step (approximately 38 minutes in duration), a vacuum of 77 i.w. was applied to the extraction well. For the third step, a vacuum of 116 i.w. was applied to MW-10 for approximately 34 minutes. The final step lasted approximately 30 minutes with a vacuum of 210 i.w. applied to MW-10. The first vacuum step yielded a vapor flow rate of approximately 8.1 scfm. Drawdown at the extraction well was 5.65 feet bgs with an average groundwater extraction rate of 1.91 gpm. A groundwater sample was collected during the first VEGE step for laboratory analysis. The second vacuum step yielded a vapor flow rate of approximately 11.0 scfm. Drawdown at the extraction was 5.69 feet bgs with an average groundwater extraction rate of 2.07 gpm. A vapor sample was collect during the second step and the vapor-phase hydrocarbon recovery rate was calculated to be 0.4 lbs/day. The third vacuum step yielded a vapor flow rate of approximately 18.6 scfm. Drawdown at the extraction well increased to approximately 4.59 feet bgs due to the higher applied vacuum. The average groundwater extraction rate was 2.75 gpm for the third step. The final step yielded a vapor flow rate of approximately 28.2 scfm. Groundwater level at the extraction well rose to 2.20 feet above the static water elevation and the average groundwater flow rate decreased to 2.29 gpm. At the conclusion of VEGE testing at groundwater monitoring well MW-10, groundwater drawdown was observed at six (6) observation wells (MW-12, TF-1, MW-13, MW-16, MW-7, and MW-9). The maximum drawdown of 0.96 feet was observed in groundwater monitoring well MW-12 (approximately 10 feet away). The calculated groundwater area of influence at MW-10 extended to 32 feet. Vacuum

Corrective Action Plan Bel Air Xtra Fuels 2476 Churchville Rd, Bel Air, MD
9
influences were observed at eight (8) observation wells. The maximum vacuum influence of 9.85 i.w. was observed at MW-12. The vacuum radius of influence (ROI) was calculated to be 57 feet, assuming 0.10 i.w. to be the minimal effective vacuum influence. A summary of the test results is presented below. Field data is presented in Attachment 1, and vacuum-versus-flow graphs and ROI graphs are presented in Attachment 2 and Attachment 3, respectively. A vapor analytical data summary is presented in Attachment 4. Influent groundwater laboratory analytical data indicated concentrations of 24,450 micrograms per liter (μg/L), 46,900 μg/L, 135 milligrams per liter (mg/L), and 18.4 mg/L for BTEX, MTBE, TPH-GRO, and TPH-DRO, respectively. The dissolved-phase laboratory analytical data are summarized in Attachment 5. A determination of hardness is presented in Attachment 6.
Type of Test
Time Period (min)
Applied Vacuum
(i.w.)
Vapor Recovery
Rate (scfm)
Vapor PID
Reading (ppmv)
>C4-C10 Hydrocarbon
Conc. (mg/m3)
Vapor-Phase Hydrocarbon
Recovery Rate
(lbs/day)
Liquid Level Change in Recovery
Well (feet)
Groundwater Recovery
Rate (gpm)
SVE – Step 1 57 32 5.6 232.5 - - +1.93 -
SVE – Step 2 22 50 6.4 284 125 0.1 +3.18 -
P&T 53 - - - - - -5.66 1.08
VEGE – Step 1 48 50 8.1 208 - - -5.65 1.91
VEGE – Step 2 38 77 11.0 180 347 0.4 -5.69 2.07
VEGE – Step 3 34 116 18.6 160 - - -4.59 2.75
VEGE – Step 4 30 210 28.2 174 - - +2.20 2.29 Note: Hydrocarbon recovery rate (lb/day) = conc. (mg/m3) x flow (scfm) x 1lb/454,000mg x 0.0283m3/ft3 x 1440 min/day ppm-v = parts per million (volume) mg/m3 = milligrams per cubic meter
2.3.2 Feasibility Testing at TF-1 Following feasibility testing on MW-10, a stepped SVE test was conducted on tank field well TF-1. The first step lasted approximately 25 minutes with a vacuum of 15 i.w. applied to the recovery well. The second step lasted approximately 12 minutes with a vacuum of 35 i.w. applied to the recovery well. The final step lasted approximately 7 minutes with a vacuum of 55 i.w. applied to TF-1. The vapor flow rates during the first, second, and third vacuum steps were 58.7, 97.7, and 124.4 scfm, respectively. The vapor-phase hydrocarbon recovery rate during the second step was calculated to be 5.7 lbs/day. At the conclusion of the third vacuum step, upwelling in the extraction well reached 1.01 feet. Vacuum influence was observed at all 6 observation wells (TF-2, MW-7, MW-8, MW-10, MW-11, MW-13, and MW-16), with a maximum of 0.44 i.w. observed at tank field well TF-2 (55 feet from the extraction well). Significant vacuum influence was observed at groundwater monitoring well MW-7 (0.36 i.w.) during testing. The vacuum ROI was calculated to be 54 feet, assuming 0.10 i.w. to be the minimal effective vacuum influence.

Corrective Action Plan Bel Air Xtra Fuels 2476 Churchville Rd, Bel Air, MD
10
A summary of the test results is presented below. Field data is presented in Attachment 1, and vacuum-versus-flow graphs and ROI graphs are presented in Attachment 2 and Attachment 3, respectively. A vapor analytical data summary is presented in Attachment 4.
Type of Test
Time Period (min)
Applied Vacuum
(i.w.)
Vapor Recovery
Rate (scfm)
Vapor PID
Reading (ppmv)
>C4-C10 Hydrocarbon
Conc. (mg/m3)
Vapor-Phase Hydrocarbon
Recovery Rate
(lbs/day)
Liquid Level Change in Recovery
Well (feet)
Groundwater Recovery
Rate (gpm)
SVE – Step 1 25 15 58.7 368 - - +0.26 -
SVE – Step 2 12 35 97.7 389 557 5.7 +0.63 -
SVE – Step 3 7 55 124.4 270 - - +1.01 - Note: Hydrocarbon recovery rate (lb/day) = conc. (mg/m3) x flow (scfm) x 1lb/454,000mg x 0.0283m3/ft3 x 1440 min/day ppm-v = parts per million (volume) mg/m3 = milligrams per cubic meter 2.3.3 Feasibility Testing at MW-7 Following the feasibility testing on TF-1, a stepped SVE test was conducted at MW-7. The first step lasted approximately 21 minutes with a vacuum of 32 i.w. applied to the recovery well. The second step lasted approximately 24 minutes with a vacuum of 50 i.w. applied to the recovery well. The final step lasted approximately 28 minutes with a vacuum of 68 i.w. applied to MW-7. The vapor flow rates during the first, second, and third vacuum steps were 3.0, 3.9, and 4.2 scfm, respectively. The vapor-phase hydrocarbon recovery rate during the first step was calculated to be 0.3 lbs/day. No significant vacuum influences were observed in any of the four observation wells (TF-2, MW-11, MW-10, and MW-9). At the conclusion of the third vacuum step, upwelling in the extraction well reached 3.21 feet. The vacuum ROI is estimated to be less than 24 feet, the distance to the closest observation well (TF-2), assuming 0.10 i.w. to be the minimal effective vacuum influence. A summary of the test results is presented below. Field data is presented in Attachment 1, and vacuum-versus-flow graphs and ROI graphs are presented in Attachment 2 and Attachment 3, respectively. A vapor analytical data summary is presented in Attachment 4.
Type of Test
Time Period (min)
Applied Vacuum
(i.w.)
Vapor Recovery
Rate (scfm)
Vapor PID
Reading (ppmv)
>C4-C10 Hydrocarbon
Conc. (mg/m3)
Vapor-Phase Hydrocarbon Recovery Rate
(lbs/day)
Liquid Level
Change in Recovery Well (feet)
Groundwater Recovery
Rate (gpm)
SVE – Step 1 21 32 3.0 404 1280 0.3 +1.15 -
SVE – Step 2 24 50 3.9 357 - - +2.14 -
SVE – Step 3 28 68 4.2 303 - - +3.21 - Note: Hydrocarbon recovery rate (lb/day) = conc. (mg/m3) x flow (scfm) x 1lb/454,000mg x 0.0283m3/ft3 x 1440 min/day ppm-v = parts per million (volume) mg/m3 = milligrams per cubic meter
Corrective Action Plan Bel Air Xtra Fuels 2476 Churchville Rd, Bel Air, MD
11
2.3.4 Feasibility Testing at MW-12 Groundwater monitoring well MW-12 was constructed in 2011 with 4-inch diameter PVC. It was measured to have a total depth of 25.0 feet bgs prior to testing. The static water level was 13.15 feet bgs. Groundwater monitoring wells MW-7, MW-8, MW-9, MW-10, MW-11, MW-13, and MW-14 and tank field well TF-1 served as observation wells. These wells ranged in distance to groundwater monitoring well MW-12 from 10 to 61 feet. The DTW in the groundwater monitoring wells ranged from 10.66 to 14.56 feet bgs. A Site Map is presented as Figure 3. On September 9, 2011 feasibility testing on groundwater monitoring well MW-12 began with a low vacuum SVE test lasting approximately 31 minutes. Vacuum was applied at 32 inches of water (i.w.) to the extraction well. The second SVE step lasted approximately 35 minutes with vacuum applied at 50 i.w. to the extraction well. The vapor flow rate during the first step was approximately 6.2 scfm and the vapor flow rate during the second step increased to 7.36 scfm. The vapor-phase hydrocarbon recovery rate during the second step was calculated to be 0.1 lbs/day. Vacuum influence was observed with a maximum of 0.38 i.w. in MW-10, approximately 10 feet from the extraction well. At the conclusion of the second vacuum step, upwelling in the extraction well reached 3.59 feet. Following the SVE test, a groundwater pumping test (lasting approximately 40 minutes) was conducted to expose previously-saturated hydrocarbon-impacted soils and determine the groundwater recovery rate in the absence of vacuum enhancement. A 4-inch diameter, top loading pneumatic pump was placed at the bottom of the well, and the test resulted in a measurable groundwater drawdown of 7.61 feet and an average groundwater recovery rate of 1.34 gallons per minute (gpm). At the conclusion of the groundwater pumping test, drawdown was observed in three (3) observation wells, with a maximum of 0.66 feet in groundwater monitoring well MW-10 (approximately 10 feet from the extraction well). During VEGE test activities at groundwater monitoring well MW-12 vacuum was applied in four (4) steps. The first step (approximately 20 minutes in duration), a vacuum of 51 i.w. was applied to MW-12. The second step (approximately 28 minutes in duration), a vacuum of 74 i.w. was applied to the extraction well. For the third step, a vacuum of 136 i.w. was applied to MW-12 for approximately 38 minutes. The final step lasted approximately 42 minutes with a vacuum of 218 i.w. applied to MW-12. The first vacuum step yielded a vapor flow rate of approximately 4.2 scfm. Drawdown at the extraction well remained near the intake of the pump (at approximately 7.61 feet bgs) with an average groundwater extraction rate of 1.55 gpm. The second vacuum step yielded a vapor flow rate of approximately 8.1 scfm. During the second step, drawdown at the extraction well remained near the intake of the pump (at approximately 7.59 feet bgs) with an average groundwater extraction rate of 1.55 gpm. The third vacuum step yielded a vapor flow rate of approximately 15.9 scfm. A vapor sample was collect during the third step and the vapor-phase hydrocarbon recovery rate was calculated to be 0.9 lbs/day. Drawdown at the extraction well remained near the intake of the pump (at approximately 7.50 feet bgs) with an average groundwater extraction rate of 2.03 gpm. The final step yielded a vapor flow rate of approximately 30.9 scfm. The groundwater level at the extraction well rose to 7.45 feet above the static water elevation due to high vacuum and reaching the maximum output of the pneumatic groundwater pump. The average groundwater flow rate was 2.57 gpm. At the conclusion of VEGE testing at groundwater monitoring well MW-12, groundwater drawdown was observed at six (6) observation wells (MW-10, MW-9, MW-13, MW-14, MW-7, and MW-8). The maximum drawdown of 2.02 feet was observed in groundwater monitoring well MW-10 (approximately 10 feet away). The calculated groundwater area of influence at MW-12 extended to 40 feet. Vacuum influences were observed at seven (7) observation wells (MW-10, MW-9, MW-13, MW-14, MW-7, MW-8, and TF-1). The maximum vacuum influence of 9.76 i.w. was observed at MW-10. The calculated vacuum ROI is 49 feet, assuming 0.10 i.w. to be the minimal effective vacuum influence.

Corrective Action Plan Bel Air Xtra Fuels 2476 Churchville Rd, Bel Air, MD
12
A summary of the test results is presented below. Field data is presented in Attachment 1, and vacuum-versus-flow graphs and ROI graphs are presented in Attachment 2 and Attachment 3, respectively. A vapor analytical data summary is presented in Attachment 4. A groundwater sample was collected during this test for laboratory analysis. Influent groundwater laboratory data indicated concentrations of 11,370 μg/L, 89,800 μg/L, 135 mg/L, and 14.3 mg/L for BTEX, MTBE, TPH-GRO, and TPH-DRO, respectively. All dissolved-phase laboratory analytical data are summarized in Attachment 5. A determination of hardness is presented in Attachment 6.
Type of Test
Time Period (min)
Applied Vacuum
(i.w.)
Vapor Recovery
Rate (scfm)
Vapor PID
Reading(ppmv)
>C4-C10 Hydrocarbon
Conc. (mg/m3)
Vapor-Phase Hydrocarbon
Recovery Rate
(lbs/day)
Liquid Level
Change in Recovery
Well (feet)
Groundwater Recovery
Rate (gpm)
SVE – Step 1 31 32 6.2 27.0 - - +2.20 -
SVE – Step 2 35 50 7.4 22.0 58.0 0.1 +3.59 -
P&T 40 - - - - - -7.61 1.34
VEGE – Step 1 20 51 4.2 70.0 - - -7.61 1.55
VEGE – Step 2 28 74 8.1 68.9 - - -7.59 1.55
VEGE – Step 3 38 136 15.9 71.7 248 0.9 -7.50 2.03
VEGE – Step 4 42 218 30.9 50.5 - - -7.45 2.57 Note: Hydrocarbon recovery rate (lb/day) = conc. (mg/m3) x flow (scfm) x 1lb/454,000mg x 0.0283m3/ft3 x 1440 min/day ppm-v = parts per million (volume) mg/m3 = milligrams per cubic meter 2.4 Feasibility Test Summary and Conclusions As previously stated, the primary objective of remediation feasibility test activities was to evaluate the most appropriate remediation strategy for the site. Several specific data collection results were obtained throughout the feasibility testing:
The groundwater recovery rates at groundwater monitoring wells MW-10 and MW-12 were 1.34 and 1.08 gpm under non-vacuum pumping conditions, respectively, but increased considerably (reaching 2.75 and 2.57 gpm, respectively) with applied vacuum.
Groundwater quality in the vicinity of groundwater monitoring wells MW-10 and MW-12 under pumping conditions was evaluated. Laboratory analysis of the groundwater extracted from groundwater monitoring wells MW-10 and MW-12 indicates significant hydrocarbon presence in the dissolved-phase.
The vapor flow rates at groundwater monitoring wells MW-10 and MW-12 ranged from 4.2 to 30.9 scfm. Vacuum/vapor flow relationships were obtained, and vapor flow rates, along with vacuum propagation, increase significantly with increases in applied vacuum.
The vacuum ROI at groundwater monitoring wells MW-10 and MW-12 reached 57 and 49 feet, respectively, assuming 0.10 i.w. to be the minimal effective vacuum influence.
Extracted soil vapor concentrations, recorded during SVE and VEGE feasibility tests utilizing a PID, ranged from 160 to 284 parts per million by volume (ppmv) in groundwater monitoring well MW-10 and from 22.0 to 71.7 ppmv in MW-12.

Corrective Action Plan Bel Air Xtra Fuels 2476 Churchville Rd, Bel Air, MD
13
According to the calculated mass removal rates, less than 1 lb/day of hydrocarbons may initially be recovered from each extraction well during remediation activities.
During vapor extraction on tank field well TF-1, low to moderate vacuum (15 to 55 i.w.) yielded high vapor flow rates (ranging from 58.7 to 124.4 scfm). Mass removal from TF-1 was estimated to be 5.7 lbs/day.
During vapor extraction on groundwater monitoring well MW-7, minimal vapor flow rates were obtained (ranging from 3.0 to 4.2 scfm). The low mass removal rate (0.3 lbs/day) was due in large part to the limited ability to recover vapors from the well.
3.0 REMEDIAL TECHNOLOGY FEASIBILITY EVALUATION
Various remediation technologies were screened to determine the most appropriate method to remediate the dissolved-phase and adsorbed-phase hydrocarbon compounds that exist in the subsurface. Remedial technologies selected for consideration were based on the results of feasibility testing, groundwater monitoring well installation activities, groundwater sampling and gauging activities and historic site activities. The potential remedial technologies and site-specific factors associated with each are discussed below. Monitored Natural Attenuation: Natural attenuation relies upon natural subsurface processes to
reduce contaminant concentrations to acceptable levels. Monitored natural attenuation would not be considered a viable remedial alternative with the high dissolved concentrations. However, natural attenuation may be considered following contaminant concentration reduction by an aggressive, active remediation technology.
Soil Excavation (Ex Situ Treatment): This remedial option requires the excavation and removal of
impacted soil for on site or offsite treatment. A majority of the soil impacts are located greater than 13 feet bgs. Excavation stabilization (e.g., shoring, sheeting) and dewatering would be needed to successfully achieve the depth required to remove the impacts. Soil excavation is not considered a viable technology to remediate the impacted soil due to the volume of soil that would need to be removed, the presence of the existing UST infrastructure, and associated dewatering and excavation stabilization.
Soil Vapor Extraction (SVE): SVE is an in-situ remedial technology that is effective in removing
volatile constituents from the vadose zone. SVE systems utilize blowers to apply vacuums at extraction wells, allowing for the recovery of soil vapors from unsaturated soils. As air moves through contaminated soils in the vadose zone, volatile organic compounds (VOCs), including absorbed- and adsorbed-phase hydrocarbons, are transferred into the vapor stream for recovery. SVE systems also promote aerobic bioremediation due to the introduction of oxygen into subsurface soils. The soil must be sufficiently permeable to permit airflow, and the volatility of the constituent to be removed must be sufficiently high. Vapor flow rates during feasibility testing suggest sufficient soil permeability at this Site. SVE could be used to remove exposed adsorbed-phase hydrocarbons (APH). However, utilizing SVE without groundwater extraction or air sparging is not effective for sites with significant impact in the saturated zone, shallow groundwater, or low permeability materials within the zone of interest. At this Site, the zone of impact extends into the saturated zone, thus rendering an SVE-only system inadequate to address residual hydrocarbon impact.

Corrective Action Plan Bel Air Xtra Fuels 2476 Churchville Rd, Bel Air, MD
14
Total Fluid Extraction or Pump & Treat (P&T): Total fluid extraction is a practical remedial technology to gain hydraulic control and to retard downgradient migration of DPH. However, P&T as a stand-alone remediation technology may lead to many years of system operation and maintenance before cleanup standards are achieved. A groundwater extraction system may remediate the groundwater impacted with DPH and LNAPL, but it will not address APH. Due to the extent of hydrocarbon impacts and time requirements associated with this remediation method, fluid extraction is eliminated as a stand-alone remedial option.
Dual-Phase Extraction (DPE)/Vacuum-Enhanced Groundwater Extraction (VEGE): DPE/VEGE
combines both SVE and fluids extraction remedial technologies. The application of a vacuum to an extraction well creates pressure gradients that enhance total fluid recovery and also serves to remediate impacts in unsaturated and previously-saturated (i.e., prior to fluids recovery) zones. Conventional DPE/VEGE extraction systems typically use pneumatic submersible pumps to extract fluids from the well and a surface blower to extract soil vapors. A range of vacuums can be applied using one of several methodologies to optimize fluid and vapor recovery depending on the formation.
The first option involves the use of low vacuum (<50 i.w.) and submersible pumps (pneumatic or electric). Low vacuum dual-phase/VEGE systems are most effective in high yielding formations. The second option involves the use of mid-range vacuum (50–100 i.w.) and submersible pumps. Mid-range vacuum systems are most effective in medium yielding, medium transmissivity formations. The third type of system involves the use of a high vacuum rotary vane, rotary claw or positive displacement (PD) blower and submersible pumps. Rotary vane, rotary claw and PD blowers are capable of vacuum levels greater than 100 i.w. A high vacuum dual-phase/VEGE system could effectively control the hydraulic gradient and recover the APH, DPH and LNAPL at this site. Soil vapor flow rates significantly increased with high vacuum extraction during the feasibility study. A high vacuum VEGE system is considered a viable remedial alternative to remediate the groundwater and soil at this facility.
Total Phase Extraction (TPE): TPE utilizes a high vacuum blower to extract groundwater and soil
vapor simultaneously through the same extraction pipe. High vacuum blowers are capable of high vacuum levels (approaching 30 in. Hg) and are most effective in lower-yield formations. A typical TPE system is applicable where groundwater recovery rates are less than one gpm and vapor recovery rates are less than 15 scfm per extraction well. A TPE system is not considered viable to remediate impacts at this facility due to the fluid recovery rates.
Air Sparge/Soil Vapor Extraction (AS/SVE): Air sparging involves the delivery of air into the saturated zone to volatilize DPH and APH contaminants. Typically, the volatilized compounds are removed from the vadose zone by an SVE system. The effectiveness of air sparging primarily depends on two key factors: vapor-/dissolved-phase partitioning and permeability of the soil. Air sparging would not be considered due to the low permeability of the soil.
In-Situ Chemical Oxidation: Oxidants, such as ozone, hydrogen peroxide and oxygen, may be added
to the groundwater to promote both biological activity and chemical oxidation. The oxidation process breaks down the chemical bonds of organic compounds and typically renders harmless by-products, depending upon the strength of the oxidant. Chemical oxidation is not considered to be an effective remedial approach at this time due to the low permeability of the soil, the aerial extent of the impacts and proximity to the UST distribution facility.

Corrective Action Plan Bel Air Xtra Fuels 2476 Churchville Rd, Bel Air, MD
15
4.0 RISK EVALUATION SUMMARY
The MDE Oil Control Program (OCP) requires potential risks of harm or loss to be measured at every site that has a reported release. It is anticipated that the determination of these potential risks will aid in establishing the necessity of remediation and, in turn, clean up goals. The MDE MEAT Guidance Document focuses on “seven risk factors”. Consideration and discussion of each of these factors is summarized below:
Light Non-Aqueous Liquid (LNAPL) has been historically detected in former groundwater monitoring wells MW-1 and MW-2, former recovery wells RW-1 and RW-3 and groundwater monitoring well MW-7. The maximum LNAPL was detected in former monitoring well MW-2 on March 3, 1992 with a thickness of 1.35 feet. LNAPL has not been detected on site since June 8, 2006, when a sheen was observed in groundwater monitoring well MW-7.
Current and future use of impacted groundwater – 92 private domestic supply wells are located
within one-half mile of the Site, the closest of which is located approximately 150 feet south of the Site. Available Maryland well records for the area are included in Appendix C. The area domestic supply wells range in depths from 125 feet bgs to 400 feet bgs. The closest city municipal supply well is located approximately 2,200-feet southeast of the Site. The current and future use of impacted groundwater is considered a possible concern if shallow groundwater is not confined from deeper area aquifers used for the supply wells.
Migration of contamination – Three groundwater monitoring wells were installed west of the Site
to delineate off-site groundwater impacts. Dissolved groundwater concentrations in these groundwater monitoring wells indicate that the on-site impact has the potential to migrate off-site, as the off-site groundwater monitoring well MW-14 has detectable concentrations of petroleum constituents.
Human exposure –The risk of human exposure to soil impacts is not a concern due to the depth of
impacts being greater than five (5) feet below grade. The risk of human exposure to impacted groundwater is a possible concern, as there are potable wells in the area. The current investigation has only characterized shallow groundwater impacts to maximum of 30 feet below grade. Potable wells in the area have solid riser to an average depth of 70 feet below grade. Access is currently being established to install a deep (90 feet bgs) and shallow (30 feet bgs) groundwater monitoring well to investigate the communication and possible pathway from the shallow aquifer to the deeper aquifer supplying potable water to the area residents.
Environmental ecological exposure – Ecological receptors in the area appear to be at a minimum,
as no significant ecological areas were identified in the vicinity of the Site. The surrounding area is primarily a mixture of commercial and residential properties; therefore the possibility of harmful exposure to animal or plant life is not considered.
Impact to utilities or buried services – Underground utilities are located along the western,
southern and eastern property boundary as confirmed by utility markouts. Storm drains were located along the northern boundary of the Site between Campus Hills shopping center parking lot and the station building. Due to soil and groundwater impacts at depths greater than five (5) feet bgs and depths of typical utility construction of less than five (5) ft bgs, communication between impacted soil and groundwater and these utilities is unlikely.

Corrective Action Plan Bel Air Xtra Fuels 2476 Churchville Rd, Bel Air, MD
16
Other sensitive receptors – Other sensitive receptors such as surface bodies of water are not likely at risk due to distance from the Site. The nearest surface water is an unnamed stream, located approximately 650 feet northwest of the Site, which feeds into a pond located approximately one-half mile north of the Site.
Of the seven (7) risk factors, only the migration of contamination and human risk through ingestion of groundwater are considered possible risks at this time. The remediation at this Site will be specifically design to address these two (2) risk factors. At the conclusion of remediation activities, the seven (7) risk factors will be readdressed.
5.0 PROPOSED REMEDIAL STRATEGY Based on the results of feasibility testing, groundwater monitoring well installation activities, the remedial option evaluation, soil and groundwater sampling activities, and site remediation goals, the recommended remedial approach is vacuum enhanced groundwater extraction (VEGE). A VEGE system will address the shallow soil and groundwater impacts identified at the Site. Based upon the current soil and groundwater quality and investigations and assessments completed to date, the primary area of concern is the area to the west of the tank field (in the vicinity of groundwater monitoring wells MW-10 and MW-12). Feasibility testing suggests a high-vacuum VEGE system would be effective in removing dissolved-phase and adsorbed-phase hydrocarbons from the area of concern. The recovery well pumps will be set to lower the water table beneath the elevations of greatest impacts and expose previously submerged soil to SVE. For the SVE system, feasibility testing revealed that higher applied vacuum results in significantly higher vapor recovery rates and groundwater recovery rates. The SVE system is to be designed to apply high vacuum to the formation (i.e. greater than 100 i.w.) to maximize effectiveness of the system. To address any hydrocarbon mass that may exist adsorbed to the fill material inside the tank field, it is recommended to operate a temporary SVE system, independent of the VEGE system, that extracts vapors from one tank field well. Feasibility testing on tank field well TF-1 suggests that mass removal can be accomplished by venting the tank field. To provide this additional venting, tank field well TF-2 is proposed to be connected to a temporary blower. The temporary SVE blower is expected to operate at low vacuum (less than 40 i.w.) and extract a high vapor flow rate (approximately 100 scfm). The blower would operate until an asymptotic rate of mass removal is observed. This independent temporary blower will target MTBE concentrations in the area of the active tank field, as requested in the MDE Directive dated June 1, 2011.
5.1 Proposed Recovery Well Network
The VEGE recovery well network is to consist of the two (2) existing groundwater monitoring wells MW-10 and MW-12, as well as four (4) additional four-inch diameter recovery wells installed to approximately 25 feet bgs and screened from above the water table to the bottom of the wells. Figure 5 shows the proposed recovery well network. This well network is evenly distributed and spans the zone of greatest concern. While the ROIs determined during feasibility testing extended greater than 30 feet, the ROI used to determine the extraction well network was 20 feet. Utilizing this dense group of recovery wells will maximize effectiveness, reduce potential dead zones, and minimize the life cycle of the remediation system. The area of expected influence from each recovery well is shown as Figure 6 (Estimated VEGE ROI Map). The system components for the treatment of recovered fluids will be designed to treat the maximum

Corrective Action Plan Bel Air Xtra Fuels 2476 Churchville Rd, Bel Air, MD
17
groundwater recovery rate expected from the recovery well network. While feasibility testing resulted in an initial groundwater recovery rate greater than 2 gpm, the characteristics of the formation suggest that as the area of concern is initially dewatered, the groundwater production rate is likely to decrease. The expected sustained pumping rate from each groundwater extraction well is approximately 1.5 gpm or less. The treatment system shall be designed to handle a sustained influent groundwater recovery rate of approximately 10 gpm, based on the 6-pumping-well recovery well network. Sizing the remediation system to handle 10 gpm ensures that the desired drawdown will be achieved, even while applying high vacuum, and provides the flexibility to expand the recovery well network at a later time.
5.2 System Components
A VEGE system includes a P&T component and a SVE component. The P&T component is to be comprised of a pneumatic pumping system for the recovery of groundwater. The remediation system will house a holding tank, an air stripper for primary water treatment, and solids filtration equipment and liquid granular activated carbon (LGAC) vessels for secondary water treatment. Treatment of the air stripper off-gas will be required initially if the expected discharge rate is greater than 20 lbs/day, and will consist of at least two (2) vapor granular activated carbon (VGAC) vessels connected in series, if required. The SVE component is to be comprised of a SVE vacuum blower for the recovery of soil vapor, a vapor/liquid separator and individual piping to each recovery well. The SVE component will be designed to treat a combined system flow rate of approximately 100 scfm at an anticipated vacuum of greater than 100 i.w. Treatment of the vapor stream will be required initially and will consist of at least two (2) VGAC vessels connected in series. A change in vapor treatment may occur at a later time as mass removal rates change. A conceptual process flow diagram for the system components is presented as Figure 7. These components are representative and revisions may be required during the final design process. Final design specification and engineering calculations for the treatment system will be completed once this CAP is approved. Note that the installation of the system will depend on:
The ability to install a recovery well and trenching network that fits the constraints of limited available space onsite;
Approval of the design by the Building Code Officer; and
Approval to discharge treated groundwater at the desired flow rate.
5.3 Remedial System Permitting
The enclosure will be constructed to comply with all state and local building codes and requirements. In addition to building, electric, and occupancy permits, other permits required by the final design specifications may include:
Air Discharge Permits: Permits from the MDE Air & Radiation Management Administration (ARMA) will be required prior to system installation and operation for both the SVE system and the air stripper discharge. The air discharge permit limits VOC emissions to 20 pounds per day, unless the discharge is reduced by 85 percent or more overall.

Corrective Action Plan Bel Air Xtra Fuels 2476 Churchville Rd, Bel Air, MD
18
Water Discharge Permit: On approval of this Revised CAP, a formal application to discharge the treated groundwater will be submitted to the appropriate authority. Discharge options at the site include one of the area storm drains. If discharge to a storm drain is permitted and accessible, a NPDES General Discharge permit will be required.
Water Appropriations Permit: A Water Appropriations Permit will be required as the planned use of ground water on an annual average is greater than 5,000 gallons per day (gpd).
Construction Permits: Building and electrical permits must be obtained from the County, Town or City municipality prior to installation of any remediation shed or enclosure. Groundwater monitoring well permits are required from the County prior to installation.
Right-of-Way Permits: State or County Right-of-Way permits may be required to perform work in public space to access the storm sewer network.
6.0 MONITORING, REPORTING, AND CASE CLOSURE 6.1 Monitoring Schedule Gauging and sampling of the groundwater monitoring wells is currently conducted on a quarterly basis. GES will continue the same schedule for groundwater gauging and sampling events. The groundwater monitoring wells and tank field monitoring wells will be sampled and analyzed in accordance with USEPA Method 8620 for full suite VOCs including fuel oxygenates, TPH-GRO and TPH-DRO. 6.2 Reporting Schedule GES shall submit Quarterly Monitoring Reports to the MDE summarizing site remediation status. Groundwater gauging data, sampling data and remediation system monitoring data will also be included in the report. The report will show the tabulated data gathered during the system O&M events, dissolved hydrocarbon mass removal calculations. The report will also include a groundwater monitoring map summarizing the groundwater sampling data for that quarter. 6.3 Case Closure The remediation endpoint for LNAPL thickness shall be the removal of LNAPL to less than 0.01 feet in the groundwater monitoring wells and tank field monitoring wells for a period of one year. The remediation goal for adsorbed-phase hydrocarbons shall be consistent with the generic numeric MDE protection of groundwater standards. Soil analytical data collected during groundwater monitoring well installation activities in 2009 and 2011 show that soil concentrations were above these clean-up standards for MTBE around groundwater monitoring wells MW-10, MW-11, MW-12, MW-14, and MW-16. Benzene concentrations only exceeded soil standards in groundwater monitoring well MW-10. The remediation system will be designed to reduce MTBE and benzene concentration in the soil in the area of these groundwater monitoring wells currently exceeding the protection of groundwater standards. Since the Site is located in a potential groundwater use area, groundwater remedial goals will be evaluated against site specific risk as it pertains to established MDE regulations. In addition, hydrocarbon recovery rates will be evaluated to determine if recovery is still obtainable and/or if asymptotic recovery has been achieved.

Corrective Action Plan Drake Bel Air 2476 Churchville Rd, Bel Air, MD
TABLES

Table 1
LIQUID LEVEL DATA SUMMARY
Bel Air Xtra Fuels2476 Churchville Rd
Bel Air, Maryland
Well IDTop of Casing
Elevation (feet)Date
Depth to Water (feet)
Depth to LNAPL (feet)
LNAPL Thickness (feet)
Groundwater Elevation (feet)
FRW-1 401.19 01/15/2001 NR - - -401.19 04/25/2005 9.10 - - 392.09401.19 05/04/2005 9.27 - - 391.92401.19 12/14/2005 13.61 - - 387.58401.19 03/07/2006 10.90 - - 390.29401.19 06/08/2006 12.72 - - 388.47401.19 12/05/2006 11.12 - - 390.07401.19 03/07/2007 10.44 - - 390.75401.19 07/06/2007 11.54 - - 389.65401.19 09/13/2007 14.74 - - 386.45401.19 12/20/2007 15.10 - - 386.09401.19 03/17/2008 13.40 - - 387.79401.19 06/10/2008 12.65 - - 388.54401.19 11/19/2009 10.50 - - 390.69401.19 12/28/2009 10.50 - - 390.69
FRW-2 400.36 01/15/2001 NR - - -400.36 04/25/2005 8.94 - - 391.42400.36 05/04/2005 8.74 - - 391.62400.36 12/14/2005 12.88 - - 387.48400.36 03/07/2006 10.53 - - 389.83400.36 06/08/2006 12.88 - - 387.48400.36 12/05/2006 10.55 - - 389.81400.36 03/07/2007 10.05 - - 390.31400.36 07/06/2007 11.19 - - 389.17400.36 09/13/2007 13.53 - - 386.83400.36 12/20/2007 15.30 - - 385.06400.36 03/17/2008 13.12 - - 387.24400.36 06/10/2008 11.88 - - 388.48400.36 11/19/2009 11.60 - - 388.76400.36 12/28/2009 11.60 - - 388.76
MW-1 403.01 01/15/2001 NR - - -403.01 04/25/2005 10.94 - - 392.07403.01 05/04/2005 11.06 - - 391.95403.01 12/14/2005 15.41 - - 387.60403.01 03/07/2006 12.98 - - 390.03403.01 06/08/2006 15.51 - - 387.50403.01 09/12/2006 14.40 - - 388.61403.01 12/05/2006 13.07 - - 389.94
Well Abandoned
Well Abandoned
Page 1 of 6

Table 1
LIQUID LEVEL DATA SUMMARY
Bel Air Xtra Fuels2476 Churchville Rd
Bel Air, Maryland
Well IDTop of Casing
Elevation (feet)Date
Depth to Water (feet)
Depth to LNAPL (feet)
LNAPL Thickness (feet)
Groundwater Elevation (feet)
MW-1 403.01 03/07/2007 12.80 - - 390.21(cont.) 403.01 07/06/2007 13.75 - - 389.26
403.01 09/13/2007 16.20 - - 386.81403.01 12/20/2007 18.10 - - 384.91403.01 03/17/2008 15.51 - - 387.50403.01 06/10/2008 14.55 - - 388.46403.01 11/19/2009 14.80 - - 388.21403.01 12/28/2009 14.80 - - 388.21
MW-2 403.40 01/15/2001 NR - - -403.40 04/25/2005 10.67 - - 392.73403.40 05/04/2005 11.50 - - 391.90403.40 12/14/2005 15.66 - - 387.74403.40 03/07/2006 8.71 - - 394.69403.40 06/08/2006 14.78 - - 388.62403.40 12/05/2006 13.11 - - 390.29403.40 03/07/2007 12.28 - - 391.12403.40 07/06/2007 9.61 - - 393.79403.40 09/13/2007 15.11 - - 388.29403.40 12/20/2007 18.63 - - 384.77403.40 03/17/2008 12.75 - - 390.65403.40 06/10/2008 14.05 - - 389.35403.40 11/19/2009 14.10 - - 389.30403.40 12/28/2009 14.10 - - 389.30
MW-3 403.71 01/15/2001 NR - - -403.71 04/25/2005 11.46 - - 392.25403.71 05/04/2005 11.73 - - 391.98403.71 12/14/2005 16.11 - - 387.60403.71 03/07/2006 13.47 - - 390.24403.71 06/08/2006 15.13 - - 388.58403.71 12/05/2006 13.47 - - 390.24403.71 03/07/2007 13.23 - - 390.48403.71 07/06/2007 14.46 - - 389.25403.71 09/13/2007 16.98 - - 386.73403.71 12/20/2007 18.80 - - 384.91403.71 03/17/2008 16.31 - - 387.40403.71 06/10/2008 15.10 - - 388.61403.71 11/19/2009 14.74 - - 388.97403.71 12/28/2009 14.74 - - 388.97
Well Abandoned
Well Abandoned
Page 2 of 6

Table 1
LIQUID LEVEL DATA SUMMARY
Bel Air Xtra Fuels2476 Churchville Rd
Bel Air, Maryland
Well IDTop of Casing
Elevation (feet)Date
Depth to Water (feet)
Depth to LNAPL (feet)
LNAPL Thickness (feet)
Groundwater Elevation (feet)
MW-3 403.71 04/23/2010 10.10 - - 393.61
MW-4 402.12 01/15/2001 NR - - -402.12 04/25/2005 10.07 - - 392.05402.12 05/04/2005 10.31 - - 391.81402.12 03/07/2006 NR - - -
MW-5 403.10 01/15/2001 NR - - -403.10 04/25/2005 11.32 - - 391.78403.10 05/04/2005 11.51 - - 391.59403.10 12/14/2005 15.75 - - 387.35403.10 03/07/2006 13.27 - - 389.83403.10 06/08/2006 14.70 - - 388.40403.10 12/05/2006 13.31 - - 389.79403.10 03/07/2007 13.00 - - 390.10403.10 07/06/2007 14.00 - - 389.10403.10 09/13/2007 16.41 - - 386.69403.10 12/20/2007 18.20 - - 384.90403.10 03/17/2008 15.97 - - 387.13403.10 06/10/2008 14.72 - - 388.38403.10 11/19/2009 14.50 - - 388.60403.10 12/28/2009 14.50 - - 388.60
MW-6 400.13 04/25/2005 8.68 - - 391.45400.13 05/04/2005 8.77 - - 391.36400.13 03/07/2006 NR - - -400.13 06/08/2006 11.85 - - 388.28400.13 09/12/2006 11.00 - - 389.13400.13 12/05/2006 10.60 - - 389.53400.13 03/07/2007 10.16 - - 389.97400.13 07/06/2007 10.97 - - 389.16400.13 09/13/2007 13.10 - - 387.03400.13 12/20/2007 14.90 - - 385.23400.13 03/17/2008 12.95 - - 387.18400.13 06/10/2008 11.69 - - 388.44400.13 11/19/2009 11.55 - - 388.58400.13 12/28/2009 11.55 - - 388.58
(cont.)
Well Abandoned
Well Abandoned
Well Abandoned
Page 3 of 6

Table 1
LIQUID LEVEL DATA SUMMARY
Bel Air Xtra Fuels2476 Churchville Rd
Bel Air, Maryland
Well IDTop of Casing
Elevation (feet)Date
Depth to Water (feet)
Depth to LNAPL (feet)
LNAPL Thickness (feet)
Groundwater Elevation (feet)
MW-7 402.73 01/15/2001 NR - - -402.73 04/25/2005 10.88 - - 391.85402.73 05/04/2005 10.91 - - 391.82402.73 12/14/2005 15.21 - - 387.52402.73 03/07/2006 12.80 - - 389.93402.73 06/08/2006 14.15 - - 388.58402.73 09/12/2006 13.92 - - 388.81402.73 12/05/2006 12.88 - - 389.85402.73 03/07/2007 12.55 - - 390.18402.73 07/06/2007 13.46 - - 389.27402.73 09/13/2007 15.80 - - 386.93402.73 12/20/2007 17.18 - - 385.55402.73 03/17/2008 15.52 - - 387.21402.73 06/10/2008 14.25 - - 388.48402.73 11/19/2009 14.52 - - 388.21402.73 12/28/2009 11.91 - - 390.82402.73 02/15/2010 11.72 - - 391.01402.73 04/23/2010 10.10 - - 392.63402.73 04/11/2011 13.08 - - 389.65402.73 09/12/2011 14.25 - - 388.48
MW-8 401.13 09/12/2011 13.83 - - 387.30
MW-9A 400.00 04/25/2005 8.61 - - 391.39400.00 05/04/2005 8.65 - - 391.35400.00 03/07/2006 10.25 - - 389.75400.00 06/08/2006 DRY - - -400.00 12/05/2006 10.37 - - 389.63400.00 03/07/2007 9.99 - - 390.01400.00 07/06/2007 10.72 - - 389.28400.00 09/13/2007 DRY - - -400.00 12/20/2007 DRY - - -400.00 03/17/2008 12.66 - - 387.34400.00 06/10/2008 11.44 - - 388.56400.00 11/19/2009 DRY - - -
MW-9 399.97 01/15/2001 NR - - -399.97 04/25/2005 8.53 - - 391.44399.97 05/04/2005 8.44 - - 391.53399.97 03/07/2006 NR - - -399.97 06/08/2006 12.41 - - 387.56
Well Abandoned
Page 4 of 6

Table 1
LIQUID LEVEL DATA SUMMARY
Bel Air Xtra Fuels2476 Churchville Rd
Bel Air, Maryland
Well IDTop of Casing
Elevation (feet)Date
Depth to Water (feet)
Depth to LNAPL (feet)
LNAPL Thickness (feet)
Groundwater Elevation (feet)
MW-9 399.97 09/12/2006 11.15 - - 388.82(cont.) 399.97 12/05/2006 11.37 - - 388.60
399.97 03/07/2007 10.93 - - 389.04399.97 07/06/2007 11.70 - - 388.27399.97 09/13/2007 13.92 - - 386.05399.97 12/20/2007 15.70 - - 384.27399.97 03/17/2008 13.70 - - 386.27399.97 06/10/2008 12.48 - - 387.49399.97 12/28/2009 11.92 - - 388.05399.97 02/15/2010 10.31 - - 389.66399.97 04/23/2010 8.78 - - 391.19399.97 04/11/2011 11.52 - - 388.45399.97 09/12/2011 12.75 - - 387.22
MW-10 400.36 11/19/2009 12.61 - - 387.75400.36 12/28/2009 11.84 - - 388.52400.36 02/15/2010 10.40 - - 389.96400.36 04/23/2010 8.78 - - 391.58400.36 04/11/2011 11.75 - - 388.61400.36 09/12/2011 12.98 - - 387.38
MW-11 401.07 12/28/2009 11.85 - - 389.22401.07 02/15/2010 10.93 - - 390.14401.07 04/23/2010 9.45 - - 391.62401.07 04/11/2011 12.28 - - 388.79401.07 09/12/2011 13.47 - - 387.60
MW-12 400.12 09/12/2011 12.85 - - 387.27
MW-13 401.90 09/12/2011 14.35 - - 387.55
MW-14 400.45 09/12/2011 12.67 - - 387.78
MW-16 401.03 09/12/2011 13.47 - - 387.56
PW-A - 03/07/2006 - - - -- 09/13/2007 - - - -
RW-3 403.14 01/15/2001 NR - - -403.14 04/25/2005 11.06 - - 392.08403.14 05/04/2005 11.24 - - 391.90403.14 12/14/2005 15.57 - - 387.57
Page 5 of 6
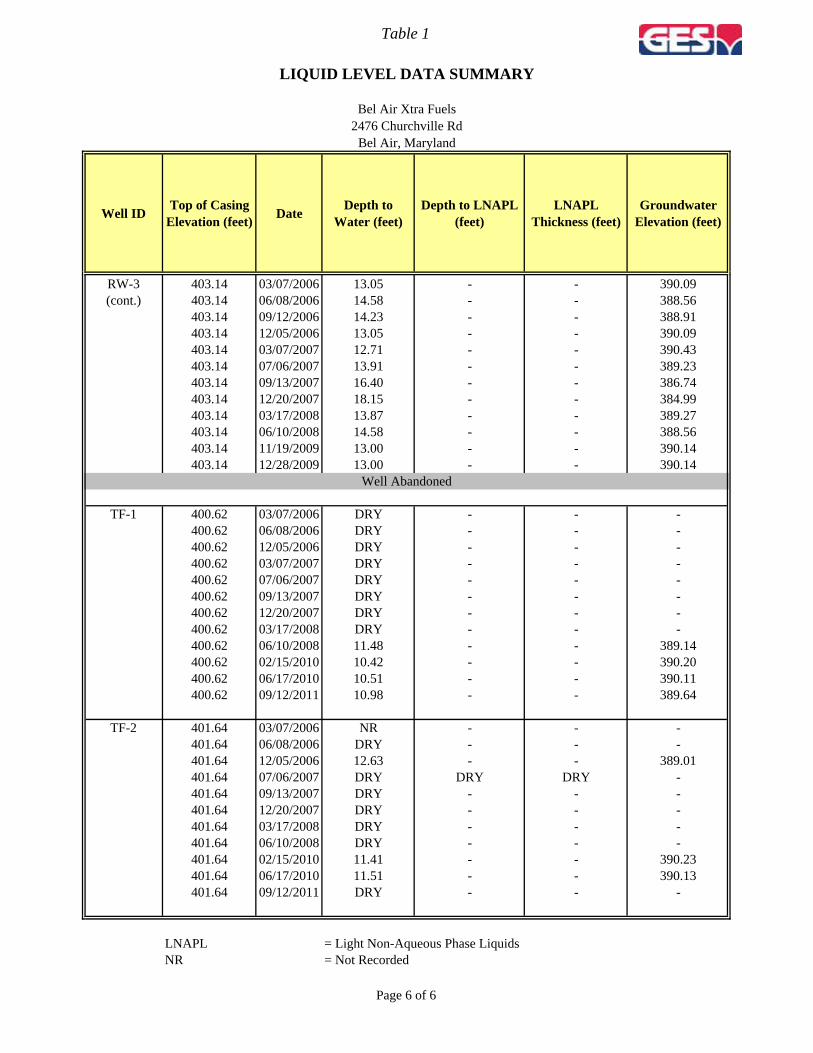
Table 1
LIQUID LEVEL DATA SUMMARY
Bel Air Xtra Fuels2476 Churchville Rd
Bel Air, Maryland
Well IDTop of Casing
Elevation (feet)Date
Depth to Water (feet)
Depth to LNAPL (feet)
LNAPL Thickness (feet)
Groundwater Elevation (feet)
RW-3 403.14 03/07/2006 13.05 - - 390.09(cont.) 403.14 06/08/2006 14.58 - - 388.56
403.14 09/12/2006 14.23 - - 388.91403.14 12/05/2006 13.05 - - 390.09403.14 03/07/2007 12.71 - - 390.43403.14 07/06/2007 13.91 - - 389.23403.14 09/13/2007 16.40 - - 386.74403.14 12/20/2007 18.15 - - 384.99403.14 03/17/2008 13.87 - - 389.27403.14 06/10/2008 14.58 - - 388.56403.14 11/19/2009 13.00 - - 390.14403.14 12/28/2009 13.00 - - 390.14
TF-1 400.62 03/07/2006 DRY - - -400.62 06/08/2006 DRY - - -400.62 12/05/2006 DRY - - -400.62 03/07/2007 DRY - - -400.62 07/06/2007 DRY - - -400.62 09/13/2007 DRY - - -400.62 12/20/2007 DRY - - -400.62 03/17/2008 DRY - - -400.62 06/10/2008 11.48 - - 389.14400.62 02/15/2010 10.42 - - 390.20400.62 06/17/2010 10.51 - - 390.11400.62 09/12/2011 10.98 - - 389.64
TF-2 401.64 03/07/2006 NR - - -401.64 06/08/2006 DRY - - -401.64 12/05/2006 12.63 - - 389.01401.64 07/06/2007 DRY DRY DRY -401.64 09/13/2007 DRY - - -401.64 12/20/2007 DRY - - -401.64 03/17/2008 DRY - - -401.64 06/10/2008 DRY - - -401.64 02/15/2010 11.41 - - 390.23401.64 06/17/2010 11.51 - - 390.13401.64 09/12/2011 DRY - - -
LNAPL = Light Non-Aqueous Phase LiquidsNR = Not Recorded
Well Abandoned
Page 6 of 6

Table 2
SOIL ANALYTICAL DATA SUMMARY
Bel Air Xtra Fuels2476 Churchville Rd
Bel Air, Maryland
Soil
Sam
ple
ID
Dat
e
Dep
th
(f
t)
Ben
zene
(µ
g/kg
)
Tol
uene
(µ
g/kg
)
Eth
ylbe
nzen
e
(µ
g/kg
)
Tot
al X
ylen
es
(µ
g/kg
)
Tot
al B
TE
X
(µg/
kg)
MT
BE
(µg/
kg)
TP
H-D
RO
(µg/
kg)
TP
H-G
RO
(µg/
kg)
- 1.9 27,000 15,000 3,000 - 12 230,000 230,000
- 1.9 27,000 15,000 3,000 - 12 620,000 620,000
MW-12 16.0-18.0 08/24/2011 16-18 ND<0.18 ND<0.52 ND<0.20 ND<0.25 ND<1.15 2,420 ND<380 ND<2,500
MW-13 17.5-19.0 08/29/2011 17.5-19 ND<0.18 ND<0.53 ND<0.21 ND<0.26 ND<1.18 ND<0.25 161,000 ND<2,400
MW-14 17.0-19.0 08/24/2011 17-19 ND<0.18 ND<0.51 ND<0.20 ND<0.25 ND<1.14 104 ND<350 ND<2,400
MW-16 17.0-18.0 08/29/2011 17-18 ND<0.17 ND<0.48 ND<0.19 ND<0.24 ND<1.08 365 27,200 ND<2,400
MW-10 11/19/09 18-20 44.9 612 109 726 1,492 54,400 <3.8 50.9
MW-11 12/14/09 23 - 25 <0.46 <0.39 <0.50 0.70 0.70 52.8 <3.7 <1.5
Bolded values indicate concentrations above MDE standards. ft = FeetND< = Analyte was not detected, the method detection limit is given. MW = Monitoring WellJ = Indicates an estimated value, between the detection limit and the reporting limit µg/kg= micrograms per kilogramTotal BTEX = Sum of Benzene, Toluene, Ethylbenzene and Total Xylenes TPH-DRO = Total Petroleum Hydrocarbons - Diesel Range OrganicsMTBE = Methyl-tertiary Butyl Ether TPH-GRO = Total Petroleum Hydrocarbons - Gasoline Range OrganicsMDE Standards are Clean Up Standards for Soil and Groundwater, June 2008
MDE Protection of Groundwater Standards
MDE Non- Residential Standards
Page 1 of 1

Table 3
HISTORIC GROUNDWATER DATA
Bel Air Xtra Fuels2476 Churchville Rd
Bel Air, Maryland
Mon
itor
ing
Wel
l
Dat
e
Ben
zen
e (µ
g/L
)
Tol
uen
e (µ
g/L
)
Eth
ylb
enze
ne
(µg/
L)
Tot
al X
ylen
es (
µg/
L)
Tot
al B
TE
X (
µg/
L)
MT
BE
(µ
g/L
)
TB
A (
µg/
L)
TP
H-D
RO
(µ
g/L
)
TP
H-G
RO
(µ
g/L
)
5 1,000 700 10,000 NA 20 NA 47 47FRW-1 01/15/2001 770 2,100 1,900 12,000 16,770 750 - 43,000 53,000
04/25/2005 50 7.0 47 57 161.0 110 - - -12/14/2005 153 18.6 299 246 716.6 188 - 4,750 6,23012/05/2006 63.7 12.6 105 62.6 243.9 125 - 1.57 2.4507/06/2007 25.1 4.0 111 116 256.1 18.3 25.5 60,800 1,65006/10/2008 57.5 3.3 183 79.8 323.6 72.9 86.9 4,550 4,040
FRW-2 01/15/2001 <2.0 <2.0 <2.0 <2.0 <8.0 120 - 600 60004/25/2005 1.0 <0.7 1.0 1.0 3.0 14 - - -12/14/2005 <1.0 <1.0 <1.0 <1.0 <4.0 <1.0 - 439 <200
12/05/2006 ND(1.0) ND(1.0) ND(1.0) ND(1.0) ND(4.0) ND(1.0) - ND(0.10) ND(0.20)07/06/2007 ND<1.0 0.24 J ND<1.0 ND<1.0 0.24 ND<1.0 ND<25 477 ND<20006/10/2008 ND<1.0 ND<1.0 ND<1.0 ND<1.0 ND<4.0 ND<1.0 ND<25 191 ND<200
MW-1 01/15/2001 13,000 11,000 1,300 9,700 35,000 8,400 - 11,000 89,00004/25/2005 3,700 8,000 1,700 13,000 26,400 650 - - -12/14/2005 0.7 1.4 0.57 24 26.67 0.78 - 3,760 84103/07/2006 130 266 57.6 230 683.6 104 - - -09/12/2006 4.6 ND<1.0 ND<1.0 ND<1.0 4.6 246 - - -12/05/2006 11.8 4.9 3.9 8.3 28.9 25.1 - 0.526 0.240
03/07/2007 0.82 J 0.68 J 0.20 J 1.1 2.80 ND<1.0 - - -07/06/2007 1.2 1.7 1.9 4.9 9.7 1.2 ND<25 1,540 ND<200
09/13/2007 ND<1.0 ND<1.0 ND<1.0 ND<1.0 ND<4.0 0.77 J - - -03/17/2008 0.44 J 1.9 1.1 13.0 16.44 5.1 - - -06/10/2008 5.2 2.0 0.89 J 2.0 10.09 4.3 ND<25 833 ND<200
MW-2 01/15/2001 <2.0 <2.0 <2.0 <2.0 <8.0 13 - <600 <20004/25/2005 4.0 5.0 8.0 21 38.0 2.0 - - -12/14/2005 2.2 5.0 6.5 11.4 25.1 3.4 - 8,400 <200
12/05/2006 3.5 17.2 4.6 5.6 30.9 0.44 - 0.620 ND(0.20)07/06/2007 ND<1.0 2.7 ND<1.0 ND<1.0 2.7 ND<1.0 ND<25 1,660 ND<20006/10/2008 ND<1.0 1.1 ND<1.0 ND<1.0 1.1 ND<1.0 ND<25 2,080 ND<200
MW-3 01/15/2001 <1.0 <1.0 <1.0 <1.0 <4.0 3.0 - <500 <10004/25/2005 <0.5 <0.7 <0.8 <0.8 <2.8 2.0 - - -12/14/2005 <1.0 <1.0 <1.0 <1.0 <4.0 <1.0 - <100 <20012/05/2006 ND(1.0) ND(1.0) ND(1.0) ND(1.0) ND(4.0) 2.1 - ND(0.11) ND(0.20)07/06/2007 ND<1.0 ND<1.0 ND<1.0 ND<1.0 ND<4.0 0.35 J ND<25 ND<100 ND<20006/10/2008 ND<1.0 ND<1.0 ND<1.0 ND<1.0 ND<4.0 0.36 J ND<25 212 ND<200
MW-4 01/15/2001 <1.0 <1.0 <1.0 <1.0 <4.0 <1.0 - <500 <10004/25/2005 5.0 <0.7 <0.8 1 6.0 39 - - -
GW Clean-up Standards for Type I and II Aquifers
Page 1 of 4

Table 3
HISTORIC GROUNDWATER DATA
Bel Air Xtra Fuels2476 Churchville Rd
Bel Air, Maryland
Mon
itor
ing
Wel
l
Dat
e
Ben
zen
e (µ
g/L
)
Tol
uen
e (µ
g/L
)
Eth
ylb
enze
ne
(µg/
L)
Tot
al X
ylen
es (
µg/
L)
Tot
al B
TE
X (
µg/
L)
MT
BE
(µ
g/L
)
TB
A (
µg/
L)
TP
H-D
RO
(µ
g/L
)
TP
H-G
RO
(µ
g/L
)
5 1,000 700 10,000 NA 20 NA 47 47GW Clean-up Standards
for Type I and II AquifersMW-5 01/15/2001 150 25 11 150 336 1,500 - 2,700 5,400
05/04/2005 11 <0.7 <0.8 <0.8 11 300 - - -12/14/2005 7.5 0.39 0.92 1.6 10.41 186 - 597 54312/05/2006 18.2 ND(2.5) 3.9 5.1 27.2 280 - 0.194 0.47807/06/2007 18.1 ND<2.0 ND<2.0 1.3 J 19.4 729 69.6 314 84606/10/2008 6.6 ND<1.0 ND<1.0 ND<1.0 6.6 78.9 72.4 291 213
MW-6 05/04/2005 <3.0 <4.0 <4.0 <5.0 <16.0 6,400 - - -09/12/2006 ND<1.0 ND<1.0 ND<1.0 ND<1.0 ND<4.0 380 - - -12/05/2006 ND(10) ND(10) ND(10) ND(10) ND(40) 1,130 - ND(0.11) 1.02
03/07/2007 ND<1.0 ND<1.0 ND<1.0 ND<1.0 ND<4.0 ND<1.0 - - -07/06/2007 10.7 ND<10 ND<10 ND<10 10.7 3,050 1,080 ND<100 2,53009/13/2007 ND<1.0 ND<1.0 ND<1.0 ND<1.0 ND<4.0 30.0 - - -03/17/2008 ND<1.0 ND<1.0 ND<1.0 ND<1.0 ND<4.0 26.3 - - -06/10/2008 ND<1.0 ND<1.0 ND<1.0 ND<1.0 ND<4.0 151 91.1 ND<100 273
MW-7 01/15/2001 1,600 4,600 450 9,700 16,350 220,000 - 30,000 190,00004/25/2005 2,000 9,600 2,000 18,000 31,600 84,000 - - -03/07/2006 2,600 12,800 2,690 23,300 41,390 31,400 - - -09/12/2006 1,180 7,530 1,820 17,500 28,030 40,200 - - -12/05/2006 1,640 7,150 1,820 15,400 26,010 26,100 - 13.2 10003/07/2007 654 4,700 1,060 9,910 16,324 21,400 - - -07/06/2007 874 3,900 1,250 10,100 16,124 24,400 9,790 13,700 65,60009/13/2007 1,170 9,360 1,480 12,200 24,210 26,100 - - -03/17/2008 637 2,420 933 11,400 15,390 16,600 - - -06/10/2008 1,500 6,400 843 12,200 20,943 31,000 8,770 23,300 77,80012/28/2009 398 1,970 995 5,600 8,963 4,950A 7,270 - 36,20002/15/2010 1,000 3,410 1,550 9,340 15,300 5,000 7,220 8,350 48,70004/23/2010 863 2,720 1,660 10,400 15,643 4,390 5,360 43.2 15.504/11/2011 867 2,560 1,750 7,460 12,637 1,590 2,320 17,400 50,80009/12/2011 336 1,360 1,210 4,540 7,446 771 599 24,800 28,300
MW-8 09/12/2011 0.56 J ND<0.15 ND<0.21 ND<0.17 0.56 54.9 28.7 ND<3.5 ND<16
MW-9A 05/04/2005 5.0 12 <8.0 <8.0 17.0 16,000 - - -12/05/2006 ND(1.0) ND(1.0) ND(1.0) ND(1.0) ND(4.0) 602 - 0.307 0.91707/06/2007 ND<100 ND<100 ND<100 ND<100 ND<400 24,100 10,700 193 19,80009/13/2007 DRY DRY DRY DRY DRY DRY DRY DRY DRY06/10/2008 ND<1.0 ND<1.0 ND<1.0 ND<1.0 ND<4.0 0.83 J ND<25 ND<100 ND<200
MW-9 01/15/2001 3.0 <1.0 <1.0 <1.0 3.0 2,300 - <500 1,40005/04/2005 180 120 120 280 700 56,000 - - -
Page 2 of 4

Table 3
HISTORIC GROUNDWATER DATA
Bel Air Xtra Fuels2476 Churchville Rd
Bel Air, Maryland
Mon
itor
ing
Wel
l
Dat
e
Ben
zen
e (µ
g/L
)
Tol
uen
e (µ
g/L
)
Eth
ylb
enze
ne
(µg/
L)
Tot
al X
ylen
es (
µg/
L)
Tot
al B
TE
X (
µg/
L)
MT
BE
(µ
g/L
)
TB
A (
µg/
L)
TP
H-D
RO
(µ
g/L
)
TP
H-G
RO
(µ
g/L
)
5 1,000 700 10,000 NA 20 NA 47 47GW Clean-up Standards
for Type I and II AquifersMW-9 09/12/2006 0.25 J ND<1.0 ND<1.0 ND<1.0 0.25 205 - - -(cont.) 12/05/2006 67.3 16.1 80.0 115 278.4 50,900 - 1.51 52.9
03/07/2007 5.9 0.80 J 0.92 J 5.0 12.62 3,210 - - -07/06/2007 118 20.3 J 222 631 991.3 7,150 20,900 1,590 10,60009/13/2007 9.4 0.76 J 12.8 27.9 50.86 473 - - -03/17/2008 0.36 J ND<1.0 ND<1.0 ND<1.0 0.36 243 - - -06/10/2008 0.48 J ND<1.0 ND<1.0 ND<1.0 0.48 175 8,630 182 1,13012/28/2009 <1.0 <1.0 <1.0 0.34 0.34 0.68 25.3 - <3202/15/2010 22.9 4.2 80.3 19.5 126.9 79.8 13,900 858 1,38004/23/2010 19.5 5.4 22.3 60.6 107.8 187 4,830 0.367 0.848
04/11/2011 ND<0.23 ND<0.30 ND<0.27 ND<0.25 ND<1.05 15.5 1,040 ND<39 ND<1109/12/2011 0.57 J ND<0.15 1.7 ND<0.17 2.27 10.8 834 439 ND<16
MW-10 12/28/2009 1,200 13,800 2,590 17,000 34,590 163,000A 316,000 - 245,00002/15/2010 2,310 11,800 2,650 15,500 32,260 139,000 173,000 12,800 246,00004/23/2010 1,780 14,700 3,010 19,200 38,690 162,000 179,000 15.2 19204/11/2011 2,570 6,450 3,040 14,300 26,360 75,800 108,000 15,300 149,00009/12/2011 2,680 7,970 2,970 14,800 28,360 65,900 87,100 20,100 148,000
MW-11 12/28/2009 513 317 278 726 1,834 1,590 2,220 - 9,43002/15/2010 1,010 1,550 759 2,510 5,829 2,690 2,110 4,430 24,30004/23/2010 936 772 724 1,990 4,422 1,920 914 5.53 12.104/11/2011 175 125 140 245 685 1,480 2,500 2,210 5,44009/12/2011 16.4 2.3 10.4 21.6 50.7 596 665 1,660 1,230
MW-12 09/12/2011 1,150 4,460 2,140 10,700 18,450 95,900 126,000 16,800 161,000
MW-14 09/12/2011 8.8 ND<0.73 ND<1.1 ND<0.87 8.8 5,360 15,300 537 6,150
PW-A 03/07/2006 ND<0.50 ND<0.50 ND<0.50 ND<0.50 ND<2.00 ND<0.50 - - -09/13/2007 ND<0.50 ND<0.50 ND<0.50 ND<0.50 ND<2.00 ND<0.50 - - -
RW-3 01/15/2001 700 190 <2.0 780 1,670 5,700 - 5,500 11,00004/25/2005 52 59 120 800 1,031 490 - - -12/14/2005 160 57.7 46.1 389 652.8 134 - 1,770 3,63003/07/2006 55 21.9 55.3 255 387.2 419 - - -09/12/2006 10.5 7.4 27.7 145 190.6 54.0 - - -12/05/2006 48.1 49.4 62.6 188 348.1 271 - 0.890 2.71
03/07/2007 0.50 J 0.29 J 1.4 5.9 8.09 6.6 - - -07/06/2007 477 150 258 715 1,600 299 96.0 J 1,990 6,19009/13/2007 236 35.2 68.5 196 535.7 172 - - -03/17/2008 70.1 24.7 121 358 573.8 75.5 - - -
Page 3 of 4

Table 3
HISTORIC GROUNDWATER DATA
Bel Air Xtra Fuels2476 Churchville Rd
Bel Air, Maryland
Mon
itor
ing
Wel
l
Dat
e
Ben
zen
e (µ
g/L
)
Tol
uen
e (µ
g/L
)
Eth
ylb
enze
ne
(µg/
L)
Tot
al X
ylen
es (
µg/
L)
Tot
al B
TE
X (
µg/
L)
MT
BE
(µ
g/L
)
TB
A (
µg/
L)
TP
H-D
RO
(µ
g/L
)
TP
H-G
RO
(µ
g/L
)
5 1,000 700 10,000 NA 20 NA 47 47GW Clean-up Standards
for Type I and II AquifersRW-3 06/10/2008 63.6 14.3 59.7 202 339.6 243 70.5 3,690 5,160(cont.)TF-1 03/07/2006 DRY DRY DRY DRY DRY DRY DRY DRY DRY
12/05/2006 DRY DRY DRY DRY DRY DRY DRY DRY DRY03/07/2007 DRY DRY DRY DRY DRY DRY DRY DRY DRY07/06/2007 DRY DRY DRY DRY DRY DRY - DRY DRY09/13/2007 DRY DRY DRY DRY DRY DRY DRY DRY DRY03/17/2008 DRY DRY DRY DRY DRY DRY DRY DRY DRY02/15/2010 0.23 J 4.3 1.8 87.7 94.03 0.83 J ND<2.0 4,750 1,14009/12/2011 3.4 127 28.2 1,270 1,428.6 3.6 ND<3.7 - 4,410
TF-2 07/06/2007 DRY DRY DRY DRY DRY DRY DRY DRY DRY09/13/2007 DRY DRY DRY DRY DRY DRY DRY DRY DRY03/17/2008 DRY DRY DRY DRY DRY DRY DRY DRY DRY02/15/2010 ND<0.23 0.55 J 0.96 J 5.3 6.81 7.7 ND<2.0 2,160 ND<3209/12/2011 DRY DRY DRY DRY DRY DRY DRY DRY DRY
Notes:ND = Not detected above laboratory method detection limitsNR = Not reportedNA = Not Available or not analyzed for that specific compound<# or (#) = Less than the method detection limit of #μg/l = micrograms per literBTEX = Benzene, toluene, ethylbenzene, xylenesMTBE = Methyl tert-Butyl EtherTPH-GRO = Total Petroleum Hydrocarbons - Gasoline Range OrganicsTPH-DRO = Total Petroleum Hydrocarbons - Diesel Range OrganicsTBA = tert-Butyl AlcoholDRY = Insufficient water for samplingJ = Estimated Concentration- = Data not available
Page 4 of 4

Table 4
POTABLE GROUNDWATER DATA
Bel Air Xtra Fuels2476 Churchville Rd
Bel Air, Maryland
Mon
itor
ing
Wel
l
Dat
e
Ben
zen
e (µ
g/L
)
Tol
uen
e (µ
g/L
)
Eth
ylb
enze
ne
(µg/
L)
Tot
al X
ylen
es (
µg/
L)
Tot
al B
TE
X (
µg/
L)
MT
BE
(µ
g/L
)
TB
A (
µg/
L)
DIP
E (
µg/
L)
ET
BE
(µ
g/L
)
TA
ME
(µ
g/L
)
5 1,000 700 10,000 NA 20 NA NA NA NA
2319 CHURCHVILLE RD 08/29/2011 ND<0.034 ND<0.067 ND<0.20 ND<0.044 ND<0.345 0.45 J ND<0.16 ND<0.10 ND<0.076 ND<0.14
2317 CHURCHVILLE RD 09/08/2011 ND<0.034 ND<0.067 ND<0.20 ND<0.044 ND<0.345 0.98 ND<1.2 ND<0.10 ND<0.076 ND<0.14
Notes:ND = Not detected above laboratory method detection limitsNR = Not reportedNA = Not Available or not analyzed for that specific compound<# = Less than the method detection limit of #μg/l = micrograms per literBTEX = Benzene, toluene, ethylbenzene, xylenesMTBE = Methyl tert-Butyl EtherDIPE = Diisopropyl EtherETBE = Ethyl tert-Butyl EtherTAME = tert-Amyl Methyl EtherTPH-GRO = Total Petroleum Hydrocarbons - Gasoline Range OrganicsTPH-DRO = Total Petroleum Hydrocarbons - Diesel Range OrganicsTBA = tert-Butyl AlcoholDRY = Insufficient water for samplingJ = Estimated Concentration- = Data not available
GW Clean-up Standards for Type I and II Aquifers
Page 1 of 1

Corrective Action Plan Drake Bel Air 2476 Churchville Rd, Bel Air, MD
FIGURES

M:\G
raph
ics\
0400
-Cro
fton\
Dra
ke P
etro
leum
\Bel
Air\
Bel
Air
SLM
.dw
g, M
odel
, EV
ega,
1:1

M:\G
raph
ics\
0400
-Cro
fton\
Dra
ke P
etro
leum
\Bel
Air\
Bel
Air
LAM
.dw
g, B
-600
, EV
ega,
1:1


WELL IDENTIFICATION GROUNDWATER ELEVATION (Feet) BENZENE CONCENTRATION (µg/L) TOTAL BTEX CONCENTRATION (µg/L) MTBE CONCENTRATION (µg/L) TPH-DRO CONCENTRATION (µg/L) TPH-GRO CONCENTRAITON (µg/L)
µg/L MICROGRAMS PER LITER BTEX BENZENE, TOLUENE, ETHYLBENZENE, XYLENES MTBE METHY tert-BUTYL ETHER TPH TOTAL PETROLEUM HYDROCARBONS DRO DIESEL RANGE ORGANICS GRO GASOLINE RANGE ORGANICS ND< # WHERE AN ANALYTE IS NOT DETECTED, THE REPORTING LIMIT IS GIVEN J AN ESITMATED VALUE BETWEEN REPORTING LIMIT AND
METHOD DETECTION LIMIT NS NOT SAMPLED
- DATA NOT AVAILABLE
GROUNDWATER CONTOUR INTERVAL (feet) INFERRED GW CONTOUR INTERVAL (feet) Note: TF-1 and MW-14 were not used in contouring as they did not
agree with regional groundwater flow. TPH-DRO was not collected from TF-1 due to insufficient amount of water.
DRAFTED BY:
NK GROUNDWATER MONITORING MAP
September 12, 2011 CHECKED BY:
MKM
REVIEWED BY:
BEL AIR XTRA FUELS 2476 CHURCHVILLE ROAD
BEL AIR, MARYLAND ATC
Groundwater & Environmental Services, Inc.2142 Priest Bridge Ct. Suite 1, Crofton, Maryland 21114
SCALE IN FEET DATE FIGURE 09-23-11 4
NORTH
0 40
Well ID GW Elevation
Benzene BTEX MTBE
TPH-DRO TPH-GRO
MW-7 388.48
336 7,446 771
24,800 28,300
MW-10 387.38 2,680
28,360 65,900 20,100
148,000
MW-11 387.60
16.4 50.7 596
1,660 1,230
MW-13 387.55
MW-16 387.56
MW-8 387.30 0.56 J 0.56 54.9
ND<3.5 ND<16
TF-2 DRY DRY DRY DRY DRY DRY
TF-1 389.64
3.4 1,428.6
3.6 -
4,410
MW-9 387.22 0.57 J 2.27 10.8 439
ND<16
MW-12 387.27 1,150
18,450 95,900 16,800
161,000
MW-14 387.78
8.8 8.8
5,360 537
6,150


M:\G
raph
ics\
0400
-Cro
fton\
Dra
ke P
etro
leum
\Bel
Air\
Eng
inee
ring\
Bel
Air
PID
-VE
-GW
ES
.dw
g, M
odel
, EV
ega,
1:1

Corrective Action Plan Drake Bel Air 2476 Churchville Rd, Bel Air, MD
APPENDIX A
SOIL BORING LOGS (MW-12, MW-13, MW-14 AND MW-16)

WELL DIA.:
PROJECT:ADDRESS:JOB NO.Logged By:Dates Drilled:Drilling Company:
Page 1 of 1
Depth Sample LithologyField Screen:
Comments
Groundwater and Environmental Services, Inc.
(feet)BlowCounts
RecoverySampleInterval
CASING EL.:
ID NO.
TOTAL DEPTH:
(feet)Total Organic
0
Completion Details(inches)
Stratigraphy
BOREHOLE DIA.:Drilling Method:Sampling Method:Soil Class. System:Field Screening:
WATER DEPTH:
Well Permit #:
WELL LOG
Volatiles (ppm)40
Water LevelSymbol Key:
p. 1 of 1
Sample Location
Proportion Descriptions:Trace = <10% Some = <50%
And = 50%Little = <25%
LEGEND
Groundwater & Environmental Services, Inc.2142 Priest Bridge Court, Crofton, Maryland 800.220.3606 Fax 410.721.3733Well ID:
fbg = feet below gradeNA = not availableppm = parts per millionin. = inches
0
5
10
15
20
25
Scott Andresini
25'Drake Bel Air
2476 Churchville Road, Bel Air, Maryland
0402652 4"
8/24/2011B.L. Myers
MW-12
8"
Hollow Stem Auger/Air Rotary
Direct Push Split SpoonUnified Soil Classification SystemPID, 10.2 eV Lamp (results in ppm)
13.68
MW-12
Fill Material - Reddishbrown to light brownclayey silt, no odor,slightly moist.
No Recovery
Tan SILTS with SAND.Whiteish horizontal SILTbands, dry with no odor
Brownish-grey SILT withfine SAND. Slight odor,dry
Brown SILTS with littleSAND, trace gravel. Drywith slight odor.
Grey-brown SILTS withlittle SAND, trace gravel.Dry with slight odor.
Grey saprolitic SITLS withlittle SANDS and littlegravels. Saturated.
8'-10'
10'-12'
12'-14'
14'-16'
16'-18'
18'-20'
5.1
8.9
134
164
158
Fill
Silty Sand
Sandy Silt
DirectPush-NoBlowCounts
Concrete 0-0.5'
BentoniteSeal 1-2'
#2 SandPack 3-25'
Solid Sch.40 PVC
Riser 0-5'
20-Slot Sch.40 PVC
Screen 5-25'
Cap 25'
Air-knifed 0-8' for utilityclearance
Static waterdepth
(13.68')
Sampledcollected 16-
18'
Samplerefusal
NoRecovery
6"
8"
12"
24"
20"

WELL DIA.:
PROJECT:ADDRESS:JOB NO.Logged By:Dates Drilled:Drilling Company:
Page 1 of 1
Depth Sample LithologyField Screen:
Comments
Groundwater and Environmental Services, Inc.
(feet)BlowCounts
RecoverySampleInterval
CASING EL.:
ID NO.
TOTAL DEPTH:
(feet)Total Organic
0
Completion Details(inches)
Stratigraphy
BOREHOLE DIA.:Drilling Method:Sampling Method:Soil Class. System:Field Screening:
WATER DEPTH:
Well Permit #:
WELL LOG
Volatiles (ppm)40
Water LevelSymbol Key:
p. 1 of 1
Sample Location
Proportion Descriptions:Trace = <10% Some = <50%
And = 50%Little = <25%
LEGEND
Groundwater & Environmental Services, Inc.2142 Priest Bridge Court, Crofton, Maryland 800.220.3606 Fax 410.721.3733Well ID:
fbg = feet below gradeNA = not availableppm = parts per millionin. = inches
0
5
10
15
20
Scott Andresini
19'Drake Bel Air
2476 Churchville Road, Bel Air, Maryland
0402652 1"
8/29/2011B.L. Myers
MW-13
2"
Truck Mounted Geoprobe
Direct Push 4' MacrocoreUnified Soil Classification SystemPID, 10.2 eV Lamp (results in ppm)
16.80
MW-13
Fill Material - Reddishbrown to light brownclayey silt, no odor,slightly moist.
Brown SILTS with traceSAND. Moist to wet, noodor
Brown SILT withdecreasing SAND. Moistwith no odor.
Brown SILT with traceSAND. Moist with noodor.
Brown SILT and SAND.Moist with no odor.
Brownish SILTS andSAND. Moist to wet withtrace gravel.
Dark brown fine SAND,little verticle oxidizedSILTS, moist.
8-12'
12-16'
16-17'6''
17'6''-19'
0.5
0.5
0.6
0.7
0.0
5.1
Fill
Sandy Silt
Silty Sand
DirectPush-NoBlowCounts
Concrete 0-0.5'
BentoniteSeal 0.5-2'
#2 SandPack 2-19'
Solid Sch.40 PVC
Riser 0-4'
20-Slot Sch.40 PVC
Screen 4-19'
Cap 19'
Air-knifed 0-5' for utilityclearance
Static waterdepth
(16.80')
Sampledcollected17'6"-19'
Samplerefusal
42"
48"
18"
18"

WELL DIA.:
PROJECT:ADDRESS:JOB NO.Logged By:Dates Drilled:Drilling Company:
Page 1 of 1
Depth Sample LithologyField Screen:
Comments
Groundwater and Environmental Services, Inc.
(feet)BlowCounts
RecoverySampleInterval
CASING EL.:
ID NO.
TOTAL DEPTH:
(feet)Total Organic
0
Completion Details(inches)
Stratigraphy
BOREHOLE DIA.:Drilling Method:Sampling Method:Soil Class. System:Field Screening:
WATER DEPTH:
Well Permit #:
WELL LOG
Volatiles (ppm)40
Water LevelSymbol Key:
p. 1 of 1
Sample Location
Proportion Descriptions:Trace = <10% Some = <50%
And = 50%Little = <25%
LEGEND
Groundwater & Environmental Services, Inc.2142 Priest Bridge Court, Crofton, Maryland 800.220.3606 Fax 410.721.3733Well ID:
fbg = feet below gradeNA = not availableppm = parts per millionin. = inches
0
5
10
15
20
25
Scott Andresini
25'Drake Bel Air
2476 Churchville Road, Bel Air, Maryland
0402652 4"
8/24/2011B.L. Myers
MW-14
8"
Hollow Stem Auger/Air Rotary
Direct Push Split SpoonUnified Soil Classification SystemPID, 10.2 eV Lamp (results in ppm)
13.34
MW-14
Fill Material - Reddishbrown to light brownclayey silt, no odor,slightly moist.
Brown SAND with traceSILTS. Dry, no odor.
Dark brown saproliticSILT with little SAND.Dry with no odor.
Dark brown saproliticSILT.
Whiteish SAND, moist.
Dark brown SILTS withlittle sands. Mosit withquartz fragments.
Dark brown fine SAND,little verticle oxidizedSILTS, moist.
Brown SAND withincreasing SILT contentwith white horizontal SILTbands. Saturated.
Brown SAND with SILT.White horizontal SILTbands. Saturated. Noodor.
5-7'
7-9'
9-11'
11-13'
13-15'
15-17'
17-19'
0.4
0.4
0.2
0.0
0.5
1.7
8.9
Fill
Sand
Sandy Silt
Sand
Sandy Silt
Silty Sand
DirectPush-NoBlowCounts
Concrete 0-0.5'
BentoniteSeal 0.5-2'
#2 SandPack 3-25'
Solid Sch.40 PVC
Riser 0-5'
20-Slot Sch.40 PVC
Screen 5-25'
Cap 25'
Air-knifed 0-5' for utilityclearance
Static waterdepth
(13.34')
Sampledcollected 17-
19'
Samplerefusal
8"
12"
19"
20"
18"
24"
12"

WELL DIA.:
PROJECT:ADDRESS:JOB NO.Logged By:Dates Drilled:Drilling Company:
Page 1 of 1
Depth Sample LithologyField Screen:
Comments
Groundwater and Environmental Services, Inc.
(feet)BlowCounts
RecoverySampleInterval
CASING EL.:
ID NO.
TOTAL DEPTH:
(feet)Total Organic
0
Completion Details(inches)
Stratigraphy
BOREHOLE DIA.:Drilling Method:Sampling Method:Soil Class. System:Field Screening:
WATER DEPTH:
Well Permit #:
WELL LOG
Volatiles (ppm)40
Water LevelSymbol Key:
p. 1 of 1
Sample Location
Proportion Descriptions:Trace = <10% Some = <50%
And = 50%Little = <25%
LEGEND
Groundwater & Environmental Services, Inc.2142 Priest Bridge Court, Crofton, Maryland 800.220.3606 Fax 410.721.3733Well ID:
fbg = feet below gradeNA = not availableppm = parts per millionin. = inches
0
5
10
15
20
Scott Andresini
18'Drake Bel Air
2476 Churchville Road, Bel Air, Maryland
0402652 1"
8/29/2011B.L. Myers
MW-16
2"
Truck Mounted Geoprobe
Direct Push 4' MacrocoreUnified Soil Classification SystemPID, 10.2 eV Lamp (results in ppm)
14.50
MW-16
Fill Material - Reddishbrown to light brownclayey silt, no odor,slightly moist.
Grey/tan SANDY SILT.Damp, no odor.
Grey/tan SANDY SILT.Damp, no odor.
Grey/tan SANDY SILT.Damp, no odor.
Grey saprolitic SILT.Moist, no odor
Grey-brown saproliticSILT. Moist, no odor.
Grey-brown saproliticSILT. Wet, no odor.
8-12'
12-16'
16-17'6''
17'6''-19'
7.0
5.8
7.6
20.1
21.0
22.6
Fill
Sandy Silt
Silt
DirectPush-NoBlowCounts
Concrete 0-0.5'
BentoniteSeal 0.5-2'
#2 SandPack 2-18'
Solid Sch.40 PVC
Riser 0-3'
20-Slot Sch.40 PVC
Screen 3-18'
Cap 18'
Air-knifed 0-8' for utilityclearance
Static waterdepth
(14.50')
Sampledcollected 17-
18'Samplerefusal
48"
48"
18"
18"

Corrective Action Plan Drake Bel Air 2476 Churchville Rd, Bel Air, MD
APPENDIX B
LABORATORY ANALYTICAL REPORTS AND CHAIN OF CUSTODY DOCUMENTATION

09/09/11
Technical Report for
Drake Petroleum Company, Inc.
GESMD:PC# 007805 Bel Air Xtra Fuels, 2476 Churchville Road, Bel Air, MD
0402652
Accutest Job Number: JA84895
Sampling Dates: 08/24/11 - 08/29/11
Report to:
Groundwater & Environmental Services
ATTN: Nicholas Kurtz
Total number of pages in report:
Certifications: NJ(12129), NY(10983), CA, CT, DE, FL, IL, IN, KS, KY, LA, MA, MD, MI, MT, NC, PA,
RI, SC, TN, VA, WV
This report shall not be reproduced, except in its entirety, without the written approval of Accutest Laboratories.
Test results relate only to samples analyzed.
New Jersey • 2235 Route 130 • Dayton, NJ 08810 • tel: 732-329-0200 • fax: 732-329-3499 • http://www.accutest.com
Test results contained within this data package meet the requirements
of the National Environmental Laboratory Accreditation Conference
and/or state specific certification programs as applicable.
Client Service contact: Tony Esposito 732-329-0200
David N. SpeisVP, Laboratory Director
New Jersey
09/09/11
e-Hardcopy 2.0Automated Report
30
Accutest Laboratories is the sole authority for authorizing edits or modifications to thisdocument. Unauthorized modification of this report is strictly prohibited.
1 of 30
JA84895

Table of Contents-1-
Sections:
Section 1: Sample Summary ................................................................................................... 3Section 2: Sample Results ........................................................................................................ 4
2.1: JA84895-1: MW-14 17-19' ........................................................................................... 52.2: JA84895-2: MW-12 16-18' ........................................................................................... 102.3: JA84895-3: MW-16 17-18' ........................................................................................... 152.4: JA84895-4: MW-13 17.5-19' ........................................................................................ 202.5: JA84895-5: 2319 CHURCHVILLE RD ....................................................................... 25
Section 3: Misc. Forms ............................................................................................................ 283.1: Chain of Custody ........................................................................................................... 29
12
3
2 of 30
JA84895

Accutest LabLink@633162 08:59 09-Sep-2011
Sample Summary
Drake Petroleum Company, Inc.Job No: JA84895
GESMD:PC# 007805 Bel Air Xtra Fuels, 2476 Churchville Road, Bel Air, MDProject No: 0402652
Sample Collected Matrix Client Number Date Time By Received Code Type Sample ID
JA84895-1 08/24/11 14:07 SA 08/30/11 SO Soil MW-14 17-19'
JA84895-2 08/24/11 10:59 SA 08/30/11 SO Soil MW-12 16-18'
JA84895-3 08/29/11 13:57 SA 08/30/11 SO Soil MW-16 17-18'
JA84895-4 08/29/11 11:10 SA 08/30/11 SO Soil MW-13 17.5-19'
JA84895-5 08/29/11 08:10 SA 08/30/11 DW Drinking Water 2319 CHURCHVILLE RD
Soil samples reported on a dry weight basis unless otherwise indicated on result page.
3 of 30
JA84895
1

Accutest LabLink@633162 08:59 09-Sep-2011
Sample Results
Report of Analysis
New Jersey
Section 2
4 of 30
JA84895
2

Accutest LabLink@633162 08:59 09-Sep-2011
Report of Analysis Page 1 of 3
Client Sample ID: MW-14 17-19' Lab Sample ID: JA84895-1 Date Sampled: 08/24/11 Matrix: SO - Soil Date Received: 08/30/11 Method: SW846 8260B Percent Solids: 86.7 Project: GESMD:PC# 007805 Bel Air Xtra Fuels, 2476 Churchville Road, Bel Air, MD
File ID DF Analyzed By Prep Date Prep Batch Analytical BatchRun #1 G141451.D 1 08/31/11 SJM n/a n/a VG6622Run #2 E181940.D 1 09/01/11 OTR n/a n/a VE8012
Initial Weight Final Volume Methanol AliquotRun #1 4.3 gRun #2 10.0 g 10.0 ml 100 ul
VOA Full List + Oxygenates
CAS No. Compound Result RL MDL Units Q
67-64-1 Acetone ND 13 8.9 ug/kg71-43-2 Benzene ND 1.3 0.18 ug/kg108-86-1 Bromobenzene ND 6.7 0.26 ug/kg74-97-5 Bromochloromethane ND 6.7 0.70 ug/kg75-27-4 Bromodichloromethane ND 6.7 0.30 ug/kg75-25-2 Bromoform ND 6.7 1.0 ug/kg74-83-9 Bromomethane ND 6.7 0.53 ug/kg78-93-3 2-Butanone (MEK) ND 13 5.8 ug/kg104-51-8 n-Butylbenzene ND 6.7 0.32 ug/kg135-98-8 sec-Butylbenzene ND 6.7 0.21 ug/kg98-06-6 tert-Butylbenzene ND 6.7 0.19 ug/kg56-23-5 Carbon tetrachloride ND 6.7 0.46 ug/kg108-90-7 Chlorobenzene ND 6.7 0.43 ug/kg75-00-3 Chloroethane ND 6.7 0.55 ug/kg67-66-3 Chloroform ND 6.7 0.65 ug/kg74-87-3 Chloromethane ND 6.7 0.84 ug/kg95-49-8 o-Chlorotoluene ND 6.7 0.50 ug/kg106-43-4 p-Chlorotoluene ND 6.7 0.28 ug/kg108-20-3 Di-Isopropyl ether ND 6.7 0.17 ug/kg96-12-8 1,2-Dibromo-3-chloropropane ND 13 2.0 ug/kg124-48-1 Dibromochloromethane ND 6.7 0.23 ug/kg106-93-4 1,2-Dibromoethane ND 1.3 0.32 ug/kg95-50-1 1,2-Dichlorobenzene ND 6.7 0.37 ug/kg541-73-1 1,3-Dichlorobenzene ND 6.7 0.26 ug/kg106-46-7 1,4-Dichlorobenzene ND 6.7 0.23 ug/kg75-71-8 Dichlorodifluoromethane ND 6.7 0.43 ug/kg75-34-3 1,1-Dichloroethane ND 6.7 0.29 ug/kg107-06-2 1,2-Dichloroethane ND 1.3 0.24 ug/kg75-35-4 1,1-Dichloroethene ND 6.7 0.82 ug/kg156-59-2 cis-1,2-Dichloroethene ND 6.7 0.43 ug/kg156-60-5 trans-1,2-Dichloroethene ND 6.7 0.57 ug/kg78-87-5 1,2-Dichloropropane ND 6.7 0.36 ug/kg
ND = Not detected MDL - Method Detection Limit J = Indicates an estimated valueRL = Reporting Limit B = Indicates analyte found in associated method blankE = Indicates value exceeds calibration range N = Indicates presumptive evidence of a compound
5 of 30
JA84895
22.1

Accutest LabLink@633162 08:59 09-Sep-2011
Report of Analysis Page 2 of 3
Client Sample ID: MW-14 17-19' Lab Sample ID: JA84895-1 Date Sampled: 08/24/11 Matrix: SO - Soil Date Received: 08/30/11 Method: SW846 8260B Percent Solids: 86.7 Project: GESMD:PC# 007805 Bel Air Xtra Fuels, 2476 Churchville Road, Bel Air, MD
VOA Full List + Oxygenates
CAS No. Compound Result RL MDL Units Q
142-28-9 1,3-Dichloropropane ND 6.7 0.50 ug/kg594-20-7 2,2-Dichloropropane ND 6.7 0.23 ug/kg563-58-6 1,1-Dichloropropene ND 6.7 0.28 ug/kg10061-01-5 cis-1,3-Dichloropropene ND 6.7 0.20 ug/kg10061-02-6 trans-1,3-Dichloropropene ND 6.7 0.45 ug/kg100-41-4 Ethylbenzene ND 1.3 0.20 ug/kg87-68-3 Hexachlorobutadiene ND 6.7 0.70 ug/kg98-82-8 Isopropylbenzene ND 6.7 0.18 ug/kg99-87-6 p-Isopropyltoluene ND 6.7 0.40 ug/kg1634-04-4 Methyl Tert Butyl Ether 104 1.3 0.24 ug/kg108-10-1 4-Methyl-2-pentanone(MIBK) ND 6.7 3.5 ug/kg74-95-3 Methylene bromide ND 6.7 0.76 ug/kg75-09-2 Methylene chloride 4.1 6.7 0.31 ug/kg J91-20-3 Naphthalene ND 6.7 1.4 ug/kg103-65-1 n-Propylbenzene ND 6.7 0.46 ug/kg100-42-5 Styrene ND 6.7 0.25 ug/kg75-65-0 Tert Butyl Alcohol 3870 a 1600 380 ug/kg994-05-8 tert-Amyl Methyl Ether 3.4 6.7 0.20 ug/kg J637-92-3 tert-Butyl Ethyl Ether ND 6.7 0.19 ug/kg630-20-6 1,1,1,2-Tetrachloroethane ND 6.7 0.25 ug/kg79-34-5 1,1,2,2-Tetrachloroethane ND 6.7 0.24 ug/kg127-18-4 Tetrachloroethene ND 6.7 0.26 ug/kg108-88-3 Toluene ND 1.3 0.51 ug/kg87-61-6 1,2,3-Trichlorobenzene ND 6.7 0.59 ug/kg120-82-1 1,2,4-Trichlorobenzene ND 6.7 0.46 ug/kg71-55-6 1,1,1-Trichloroethane ND 6.7 0.32 ug/kg79-00-5 1,1,2-Trichloroethane ND 6.7 0.58 ug/kg79-01-6 Trichloroethene ND 6.7 0.33 ug/kg75-69-4 Trichlorofluoromethane ND 6.7 0.65 ug/kg96-18-4 1,2,3-Trichloropropane ND 6.7 1.4 ug/kg95-63-6 1,2,4-Trimethylbenzene ND 6.7 1.5 ug/kg108-67-8 1,3,5-Trimethylbenzene ND 6.7 0.17 ug/kg75-01-4 Vinyl chloride ND 6.7 0.62 ug/kg
m,p-Xylene ND 1.3 0.42 ug/kg95-47-6 o-Xylene ND 1.3 0.25 ug/kg1330-20-7 Xylene (total) ND 1.3 0.25 ug/kg
CAS No. Surrogate Recoveries Run# 1 Run# 2 Limits
1868-53-7 Dibromofluoromethane 104% 98% 67-131%
ND = Not detected MDL - Method Detection Limit J = Indicates an estimated valueRL = Reporting Limit B = Indicates analyte found in associated method blankE = Indicates value exceeds calibration range N = Indicates presumptive evidence of a compound
6 of 30
JA84895
22.1

Accutest LabLink@633162 08:59 09-Sep-2011
Report of Analysis Page 3 of 3
Client Sample ID: MW-14 17-19' Lab Sample ID: JA84895-1 Date Sampled: 08/24/11 Matrix: SO - Soil Date Received: 08/30/11 Method: SW846 8260B Percent Solids: 86.7 Project: GESMD:PC# 007805 Bel Air Xtra Fuels, 2476 Churchville Road, Bel Air, MD
VOA Full List + Oxygenates
CAS No. Surrogate Recoveries Run# 1 Run# 2 Limits
17060-07-0 1,2-Dichloroethane-D4 78% 102% 66-130%2037-26-5 Toluene-D8 110% 94% 76-125%460-00-4 4-Bromofluorobenzene 102% 91% 53-142%
(a) Result is from Run# 2
ND = Not detected MDL - Method Detection Limit J = Indicates an estimated valueRL = Reporting Limit B = Indicates analyte found in associated method blankE = Indicates value exceeds calibration range N = Indicates presumptive evidence of a compound
7 of 30
JA84895
22.1

Accutest LabLink@633162 08:59 09-Sep-2011
Report of Analysis Page 1 of 1
Client Sample ID: MW-14 17-19' Lab Sample ID: JA84895-1 Date Sampled: 08/24/11 Matrix: SO - Soil Date Received: 08/30/11 Method: SW846 8015C Percent Solids: 86.7 Project: GESMD:PC# 007805 Bel Air Xtra Fuels, 2476 Churchville Road, Bel Air, MD
File ID DF Analyzed By Prep Date Prep Batch Analytical BatchRun #1 PF92006.D 1 09/01/11 XPL n/a n/a GPF2505Run #2
Initial Weight Final Volume Methanol AliquotRun #1 10.0 g 10.0 ml 100 ulRun #2
CAS No. Compound Result RL MDL Units Q
TPH-GRO (C6-C10) ND 13 2.4 mg/kg
CAS No. Surrogate Recoveries Run# 1 Run# 2 Limits
98-08-8 aaa-Trifluorotoluene 79% 66-119%
ND = Not detected MDL - Method Detection Limit J = Indicates an estimated valueRL = Reporting Limit B = Indicates analyte found in associated method blankE = Indicates value exceeds calibration range N = Indicates presumptive evidence of a compound
8 of 30
JA84895
22.1

Accutest LabLink@633162 08:59 09-Sep-2011
Report of Analysis Page 1 of 1
Client Sample ID: MW-14 17-19' Lab Sample ID: JA84895-1 Date Sampled: 08/24/11 Matrix: SO - Soil Date Received: 08/30/11 Method: SW846 8015C SW846 3545A Percent Solids: 86.7 Project: GESMD:PC# 007805 Bel Air Xtra Fuels, 2476 Churchville Road, Bel Air, MD
File ID DF Analyzed By Prep Date Prep Batch Analytical BatchRun #1 ZZ65143.D 1 09/06/11 VDT 09/01/11 OP51617 GZZ2210Run #2
Initial Weight Final VolumeRun #1 10.4 g 1.0 mlRun #2
CAS No. Compound Result RL MDL Units Q
TPH-DRO (C10-C28) ND 11 0.35 mg/kg
CAS No. Surrogate Recoveries Run# 1 Run# 2 Limits
84-15-1 o-Terphenyl 62% 19-151%16416-32-3 Tetracosane-d50 62% 18-146%438-22-2 5a-Androstane 56% 14-147%
ND = Not detected MDL - Method Detection Limit J = Indicates an estimated valueRL = Reporting Limit B = Indicates analyte found in associated method blankE = Indicates value exceeds calibration range N = Indicates presumptive evidence of a compound
9 of 30
JA84895
22.1

Accutest LabLink@633162 08:59 09-Sep-2011
Report of Analysis Page 1 of 3
Client Sample ID: MW-12 16-18' Lab Sample ID: JA84895-2 Date Sampled: 08/24/11 Matrix: SO - Soil Date Received: 08/30/11 Method: SW846 8260B Percent Solids: 84.2 Project: GESMD:PC# 007805 Bel Air Xtra Fuels, 2476 Churchville Road, Bel Air, MD
File ID DF Analyzed By Prep Date Prep Batch Analytical BatchRun #1 G141452.D 1 08/31/11 SJM n/a n/a VG6622Run #2 E181941.D 1 09/01/11 OTR n/a n/a VE8012
Initial Weight Final Volume Methanol AliquotRun #1 4.3 gRun #2 10.0 g 10.0 ml 100 ul
VOA Full List + Oxygenates
CAS No. Compound Result RL MDL Units Q
67-64-1 Acetone 44.8 14 9.1 ug/kg71-43-2 Benzene ND 1.4 0.18 ug/kg108-86-1 Bromobenzene ND 6.9 0.27 ug/kg74-97-5 Bromochloromethane ND 6.9 0.72 ug/kg75-27-4 Bromodichloromethane ND 6.9 0.31 ug/kg75-25-2 Bromoform ND 6.9 1.0 ug/kg74-83-9 Bromomethane ND 6.9 0.54 ug/kg78-93-3 2-Butanone (MEK) 17.3 14 6.0 ug/kg104-51-8 n-Butylbenzene ND 6.9 0.32 ug/kg135-98-8 sec-Butylbenzene ND 6.9 0.22 ug/kg98-06-6 tert-Butylbenzene ND 6.9 0.19 ug/kg56-23-5 Carbon tetrachloride ND 6.9 0.48 ug/kg108-90-7 Chlorobenzene ND 6.9 0.44 ug/kg75-00-3 Chloroethane ND 6.9 0.56 ug/kg67-66-3 Chloroform ND 6.9 0.67 ug/kg74-87-3 Chloromethane ND 6.9 0.86 ug/kg95-49-8 o-Chlorotoluene ND 6.9 0.52 ug/kg106-43-4 p-Chlorotoluene ND 6.9 0.29 ug/kg108-20-3 Di-Isopropyl ether 3.4 6.9 0.18 ug/kg J96-12-8 1,2-Dibromo-3-chloropropane ND 14 2.1 ug/kg124-48-1 Dibromochloromethane ND 6.9 0.23 ug/kg106-93-4 1,2-Dibromoethane ND 1.4 0.33 ug/kg95-50-1 1,2-Dichlorobenzene ND 6.9 0.38 ug/kg541-73-1 1,3-Dichlorobenzene ND 6.9 0.27 ug/kg106-46-7 1,4-Dichlorobenzene ND 6.9 0.23 ug/kg75-71-8 Dichlorodifluoromethane ND 6.9 0.44 ug/kg75-34-3 1,1-Dichloroethane ND 6.9 0.30 ug/kg107-06-2 1,2-Dichloroethane ND 1.4 0.25 ug/kg75-35-4 1,1-Dichloroethene ND 6.9 0.85 ug/kg156-59-2 cis-1,2-Dichloroethene ND 6.9 0.44 ug/kg156-60-5 trans-1,2-Dichloroethene ND 6.9 0.59 ug/kg78-87-5 1,2-Dichloropropane ND 6.9 0.37 ug/kg
ND = Not detected MDL - Method Detection Limit J = Indicates an estimated valueRL = Reporting Limit B = Indicates analyte found in associated method blankE = Indicates value exceeds calibration range N = Indicates presumptive evidence of a compound
10 of 30
JA84895
22.2

Accutest LabLink@633162 08:59 09-Sep-2011
Report of Analysis Page 2 of 3
Client Sample ID: MW-12 16-18' Lab Sample ID: JA84895-2 Date Sampled: 08/24/11 Matrix: SO - Soil Date Received: 08/30/11 Method: SW846 8260B Percent Solids: 84.2 Project: GESMD:PC# 007805 Bel Air Xtra Fuels, 2476 Churchville Road, Bel Air, MD
VOA Full List + Oxygenates
CAS No. Compound Result RL MDL Units Q
142-28-9 1,3-Dichloropropane ND 6.9 0.52 ug/kg594-20-7 2,2-Dichloropropane ND 6.9 0.24 ug/kg563-58-6 1,1-Dichloropropene ND 6.9 0.29 ug/kg10061-01-5 cis-1,3-Dichloropropene ND 6.9 0.21 ug/kg10061-02-6 trans-1,3-Dichloropropene ND 6.9 0.46 ug/kg100-41-4 Ethylbenzene ND 1.4 0.20 ug/kg87-68-3 Hexachlorobutadiene ND 6.9 0.72 ug/kg98-82-8 Isopropylbenzene ND 6.9 0.19 ug/kg99-87-6 p-Isopropyltoluene ND 6.9 0.41 ug/kg1634-04-4 Methyl Tert Butyl Ether 2420 a 69 12 ug/kg108-10-1 4-Methyl-2-pentanone(MIBK) ND 6.9 3.6 ug/kg74-95-3 Methylene bromide ND 6.9 0.78 ug/kg75-09-2 Methylene chloride 2.8 6.9 0.32 ug/kg J91-20-3 Naphthalene 8.6 6.9 1.5 ug/kg103-65-1 n-Propylbenzene ND 6.9 0.48 ug/kg100-42-5 Styrene ND 6.9 0.26 ug/kg75-65-0 Tert Butyl Alcohol 24600 a 1700 400 ug/kg994-05-8 tert-Amyl Methyl Ether 25.8 6.9 0.21 ug/kg637-92-3 tert-Butyl Ethyl Ether 1.5 6.9 0.19 ug/kg J630-20-6 1,1,1,2-Tetrachloroethane ND 6.9 0.25 ug/kg79-34-5 1,1,2,2-Tetrachloroethane ND 6.9 0.25 ug/kg127-18-4 Tetrachloroethene ND 6.9 0.26 ug/kg108-88-3 Toluene ND 1.4 0.52 ug/kg87-61-6 1,2,3-Trichlorobenzene ND 6.9 0.60 ug/kg120-82-1 1,2,4-Trichlorobenzene ND 6.9 0.47 ug/kg71-55-6 1,1,1-Trichloroethane ND 6.9 0.33 ug/kg79-00-5 1,1,2-Trichloroethane ND 6.9 0.60 ug/kg79-01-6 Trichloroethene ND 6.9 0.34 ug/kg75-69-4 Trichlorofluoromethane ND 6.9 0.67 ug/kg96-18-4 1,2,3-Trichloropropane ND 6.9 1.5 ug/kg95-63-6 1,2,4-Trimethylbenzene ND 6.9 1.5 ug/kg108-67-8 1,3,5-Trimethylbenzene ND 6.9 0.18 ug/kg75-01-4 Vinyl chloride ND 6.9 0.64 ug/kg
m,p-Xylene ND 1.4 0.43 ug/kg95-47-6 o-Xylene ND 1.4 0.25 ug/kg1330-20-7 Xylene (total) ND 1.4 0.25 ug/kg
CAS No. Surrogate Recoveries Run# 1 Run# 2 Limits
1868-53-7 Dibromofluoromethane 105% 98% 67-131%
ND = Not detected MDL - Method Detection Limit J = Indicates an estimated valueRL = Reporting Limit B = Indicates analyte found in associated method blankE = Indicates value exceeds calibration range N = Indicates presumptive evidence of a compound
11 of 30
JA84895
22.2

Accutest LabLink@633162 08:59 09-Sep-2011
Report of Analysis Page 3 of 3
Client Sample ID: MW-12 16-18' Lab Sample ID: JA84895-2 Date Sampled: 08/24/11 Matrix: SO - Soil Date Received: 08/30/11 Method: SW846 8260B Percent Solids: 84.2 Project: GESMD:PC# 007805 Bel Air Xtra Fuels, 2476 Churchville Road, Bel Air, MD
VOA Full List + Oxygenates
CAS No. Surrogate Recoveries Run# 1 Run# 2 Limits
17060-07-0 1,2-Dichloroethane-D4 78% 102% 66-130%2037-26-5 Toluene-D8 110% 96% 76-125%460-00-4 4-Bromofluorobenzene 100% 93% 53-142%
(a) Result is from Run# 2
ND = Not detected MDL - Method Detection Limit J = Indicates an estimated valueRL = Reporting Limit B = Indicates analyte found in associated method blankE = Indicates value exceeds calibration range N = Indicates presumptive evidence of a compound
12 of 30
JA84895
22.2

Accutest LabLink@633162 08:59 09-Sep-2011
Report of Analysis Page 1 of 1
Client Sample ID: MW-12 16-18' Lab Sample ID: JA84895-2 Date Sampled: 08/24/11 Matrix: SO - Soil Date Received: 08/30/11 Method: SW846 8015C Percent Solids: 84.2 Project: GESMD:PC# 007805 Bel Air Xtra Fuels, 2476 Churchville Road, Bel Air, MD
File ID DF Analyzed By Prep Date Prep Batch Analytical BatchRun #1 PF92007.D 1 09/01/11 XPL n/a n/a GPF2505Run #2
Initial Weight Final Volume Methanol AliquotRun #1 10.0 g 10.0 ml 100 ulRun #2
CAS No. Compound Result RL MDL Units Q
TPH-GRO (C6-C10) ND 14 2.5 mg/kg
CAS No. Surrogate Recoveries Run# 1 Run# 2 Limits
98-08-8 aaa-Trifluorotoluene 80% 66-119%
ND = Not detected MDL - Method Detection Limit J = Indicates an estimated valueRL = Reporting Limit B = Indicates analyte found in associated method blankE = Indicates value exceeds calibration range N = Indicates presumptive evidence of a compound
13 of 30
JA84895
22.2

Accutest LabLink@633162 08:59 09-Sep-2011
Report of Analysis Page 1 of 1
Client Sample ID: MW-12 16-18' Lab Sample ID: JA84895-2 Date Sampled: 08/24/11 Matrix: SO - Soil Date Received: 08/30/11 Method: SW846 8015C SW846 3545A Percent Solids: 84.2 Project: GESMD:PC# 007805 Bel Air Xtra Fuels, 2476 Churchville Road, Bel Air, MD
File ID DF Analyzed By Prep Date Prep Batch Analytical BatchRun #1 ZZ65141.D 1 09/06/11 VDT 09/01/11 OP51617 GZZ2210Run #2
Initial Weight Final VolumeRun #1 10.1 g 1.0 mlRun #2
CAS No. Compound Result RL MDL Units Q
TPH-DRO (C10-C28) ND 12 0.38 mg/kg
CAS No. Surrogate Recoveries Run# 1 Run# 2 Limits
84-15-1 o-Terphenyl 101% 19-151%16416-32-3 Tetracosane-d50 99% 18-146%438-22-2 5a-Androstane 89% 14-147%
ND = Not detected MDL - Method Detection Limit J = Indicates an estimated valueRL = Reporting Limit B = Indicates analyte found in associated method blankE = Indicates value exceeds calibration range N = Indicates presumptive evidence of a compound
14 of 30
JA84895
22.2

Accutest LabLink@633162 08:59 09-Sep-2011
Report of Analysis Page 1 of 3
Client Sample ID: MW-16 17-18' Lab Sample ID: JA84895-3 Date Sampled: 08/29/11 Matrix: SO - Soil Date Received: 08/30/11 Method: SW846 8260B Percent Solids: 83.1 Project: GESMD:PC# 007805 Bel Air Xtra Fuels, 2476 Churchville Road, Bel Air, MD
File ID DF Analyzed By Prep Date Prep Batch Analytical BatchRun #1 G141453.D 1 08/31/11 SJM n/a n/a VG6622Run #2 G141488.D 1 09/01/11 SJM n/a n/a VG6623
Initial WeightRun #1 4.7 gRun #2 1.0 g
VOA Full List + Oxygenates
CAS No. Compound Result RL MDL Units Q
67-64-1 Acetone 16.3 13 8.5 ug/kg71-43-2 Benzene ND 1.3 0.17 ug/kg108-86-1 Bromobenzene ND 6.4 0.25 ug/kg74-97-5 Bromochloromethane ND 6.4 0.66 ug/kg75-27-4 Bromodichloromethane ND 6.4 0.29 ug/kg75-25-2 Bromoform ND 6.4 0.97 ug/kg74-83-9 Bromomethane ND 6.4 0.50 ug/kg78-93-3 2-Butanone (MEK) ND 13 5.5 ug/kg104-51-8 n-Butylbenzene ND 6.4 0.30 ug/kg135-98-8 sec-Butylbenzene ND 6.4 0.20 ug/kg98-06-6 tert-Butylbenzene ND 6.4 0.18 ug/kg56-23-5 Carbon tetrachloride ND 6.4 0.44 ug/kg108-90-7 Chlorobenzene ND 6.4 0.41 ug/kg75-00-3 Chloroethane ND 6.4 0.52 ug/kg67-66-3 Chloroform ND 6.4 0.62 ug/kg74-87-3 Chloromethane ND 6.4 0.80 ug/kg95-49-8 o-Chlorotoluene ND 6.4 0.48 ug/kg106-43-4 p-Chlorotoluene ND 6.4 0.27 ug/kg108-20-3 Di-Isopropyl ether ND 6.4 0.16 ug/kg96-12-8 1,2-Dibromo-3-chloropropane ND 13 1.9 ug/kg124-48-1 Dibromochloromethane ND 6.4 0.22 ug/kg106-93-4 1,2-Dibromoethane ND 1.3 0.30 ug/kg95-50-1 1,2-Dichlorobenzene ND 6.4 0.35 ug/kg541-73-1 1,3-Dichlorobenzene ND 6.4 0.25 ug/kg106-46-7 1,4-Dichlorobenzene ND 6.4 0.22 ug/kg75-71-8 Dichlorodifluoromethane ND 6.4 0.41 ug/kg75-34-3 1,1-Dichloroethane ND 6.4 0.28 ug/kg107-06-2 1,2-Dichloroethane ND 1.3 0.23 ug/kg75-35-4 1,1-Dichloroethene ND 6.4 0.78 ug/kg156-59-2 cis-1,2-Dichloroethene ND 6.4 0.41 ug/kg156-60-5 trans-1,2-Dichloroethene ND 6.4 0.54 ug/kg78-87-5 1,2-Dichloropropane ND 6.4 0.34 ug/kg
ND = Not detected MDL - Method Detection Limit J = Indicates an estimated valueRL = Reporting Limit B = Indicates analyte found in associated method blankE = Indicates value exceeds calibration range N = Indicates presumptive evidence of a compound
15 of 30
JA84895
22.3

Accutest LabLink@633162 08:59 09-Sep-2011
Report of Analysis Page 2 of 3
Client Sample ID: MW-16 17-18' Lab Sample ID: JA84895-3 Date Sampled: 08/29/11 Matrix: SO - Soil Date Received: 08/30/11 Method: SW846 8260B Percent Solids: 83.1 Project: GESMD:PC# 007805 Bel Air Xtra Fuels, 2476 Churchville Road, Bel Air, MD
VOA Full List + Oxygenates
CAS No. Compound Result RL MDL Units Q
142-28-9 1,3-Dichloropropane ND 6.4 0.48 ug/kg594-20-7 2,2-Dichloropropane ND 6.4 0.22 ug/kg563-58-6 1,1-Dichloropropene ND 6.4 0.27 ug/kg10061-01-5 cis-1,3-Dichloropropene ND 6.4 0.19 ug/kg10061-02-6 trans-1,3-Dichloropropene ND 6.4 0.43 ug/kg100-41-4 Ethylbenzene ND 1.3 0.19 ug/kg87-68-3 Hexachlorobutadiene ND 6.4 0.67 ug/kg98-82-8 Isopropylbenzene ND 6.4 0.18 ug/kg99-87-6 p-Isopropyltoluene ND 6.4 0.38 ug/kg1634-04-4 Methyl Tert Butyl Ether 365 a 6.0 1.1 ug/kg108-10-1 4-Methyl-2-pentanone(MIBK) ND 6.4 3.4 ug/kg74-95-3 Methylene bromide ND 6.4 0.73 ug/kg75-09-2 Methylene chloride 2.7 6.4 0.29 ug/kg J91-20-3 Naphthalene ND 6.4 1.4 ug/kg103-65-1 n-Propylbenzene ND 6.4 0.44 ug/kg100-42-5 Styrene ND 6.4 0.24 ug/kg75-65-0 Tert Butyl Alcohol 204 32 7.4 ug/kg994-05-8 tert-Amyl Methyl Ether 19.8 6.4 0.19 ug/kg637-92-3 tert-Butyl Ethyl Ether ND 6.4 0.18 ug/kg630-20-6 1,1,1,2-Tetrachloroethane ND 6.4 0.24 ug/kg79-34-5 1,1,2,2-Tetrachloroethane ND 6.4 0.23 ug/kg127-18-4 Tetrachloroethene ND 6.4 0.24 ug/kg108-88-3 Toluene ND 1.3 0.48 ug/kg87-61-6 1,2,3-Trichlorobenzene ND 6.4 0.56 ug/kg120-82-1 1,2,4-Trichlorobenzene ND 6.4 0.44 ug/kg71-55-6 1,1,1-Trichloroethane ND 6.4 0.31 ug/kg79-00-5 1,1,2-Trichloroethane ND 6.4 0.55 ug/kg79-01-6 Trichloroethene ND 6.4 0.32 ug/kg75-69-4 Trichlorofluoromethane ND 6.4 0.62 ug/kg96-18-4 1,2,3-Trichloropropane ND 6.4 1.4 ug/kg95-63-6 1,2,4-Trimethylbenzene ND 6.4 1.4 ug/kg108-67-8 1,3,5-Trimethylbenzene ND 6.4 0.16 ug/kg75-01-4 Vinyl chloride ND 6.4 0.59 ug/kg
m,p-Xylene ND 1.3 0.40 ug/kg95-47-6 o-Xylene ND 1.3 0.24 ug/kg1330-20-7 Xylene (total) ND 1.3 0.24 ug/kg
CAS No. Surrogate Recoveries Run# 1 Run# 2 Limits
1868-53-7 Dibromofluoromethane 101% 110% 67-131%
ND = Not detected MDL - Method Detection Limit J = Indicates an estimated valueRL = Reporting Limit B = Indicates analyte found in associated method blankE = Indicates value exceeds calibration range N = Indicates presumptive evidence of a compound
16 of 30
JA84895
22.3

Accutest LabLink@633162 08:59 09-Sep-2011
Report of Analysis Page 3 of 3
Client Sample ID: MW-16 17-18' Lab Sample ID: JA84895-3 Date Sampled: 08/29/11 Matrix: SO - Soil Date Received: 08/30/11 Method: SW846 8260B Percent Solids: 83.1 Project: GESMD:PC# 007805 Bel Air Xtra Fuels, 2476 Churchville Road, Bel Air, MD
VOA Full List + Oxygenates
CAS No. Surrogate Recoveries Run# 1 Run# 2 Limits
17060-07-0 1,2-Dichloroethane-D4 72% 102% 66-130%2037-26-5 Toluene-D8 110% 116% 76-125%460-00-4 4-Bromofluorobenzene 102% 106% 53-142%
(a) Result is from Run# 2
ND = Not detected MDL - Method Detection Limit J = Indicates an estimated valueRL = Reporting Limit B = Indicates analyte found in associated method blankE = Indicates value exceeds calibration range N = Indicates presumptive evidence of a compound
17 of 30
JA84895
22.3

Accutest LabLink@633162 08:59 09-Sep-2011
Report of Analysis Page 1 of 1
Client Sample ID: MW-16 17-18' Lab Sample ID: JA84895-3 Date Sampled: 08/29/11 Matrix: SO - Soil Date Received: 08/30/11 Method: SW846 8015C Percent Solids: 83.1 Project: GESMD:PC# 007805 Bel Air Xtra Fuels, 2476 Churchville Road, Bel Air, MD
File ID DF Analyzed By Prep Date Prep Batch Analytical BatchRun #1 PF92008.D 1 09/01/11 XPL n/a n/a GPF2505Run #2
Initial Weight Final Volume Methanol AliquotRun #1 10.0 g 10.0 ml 100 ulRun #2
CAS No. Compound Result RL MDL Units Q
TPH-GRO (C6-C10) ND 14 2.5 mg/kg
CAS No. Surrogate Recoveries Run# 1 Run# 2 Limits
98-08-8 aaa-Trifluorotoluene 81% 66-119%
ND = Not detected MDL - Method Detection Limit J = Indicates an estimated valueRL = Reporting Limit B = Indicates analyte found in associated method blankE = Indicates value exceeds calibration range N = Indicates presumptive evidence of a compound
18 of 30
JA84895
22.3

Accutest LabLink@633162 08:59 09-Sep-2011
Report of Analysis Page 1 of 1
Client Sample ID: MW-16 17-18' Lab Sample ID: JA84895-3 Date Sampled: 08/29/11 Matrix: SO - Soil Date Received: 08/30/11 Method: SW846 8015C SW846 3545A Percent Solids: 83.1 Project: GESMD:PC# 007805 Bel Air Xtra Fuels, 2476 Churchville Road, Bel Air, MD
File ID DF Analyzed By Prep Date Prep Batch Analytical BatchRun #1 ZZ65142.D 1 09/06/11 VDT 09/01/11 OP51617 GZZ2210Run #2
Initial Weight Final VolumeRun #1 10.3 g 1.0 mlRun #2
CAS No. Compound Result RL MDL Units Q
TPH-DRO (C10-C28) 27.2 12 0.37 mg/kg
CAS No. Surrogate Recoveries Run# 1 Run# 2 Limits
84-15-1 o-Terphenyl 64% 19-151%16416-32-3 Tetracosane-d50 66% 18-146%438-22-2 5a-Androstane 57% 14-147%
ND = Not detected MDL - Method Detection Limit J = Indicates an estimated valueRL = Reporting Limit B = Indicates analyte found in associated method blankE = Indicates value exceeds calibration range N = Indicates presumptive evidence of a compound
19 of 30
JA84895
22.3

Accutest LabLink@633162 08:59 09-Sep-2011
Report of Analysis Page 1 of 3
Client Sample ID: MW-13 17.5-19' Lab Sample ID: JA84895-4 Date Sampled: 08/29/11 Matrix: SO - Soil Date Received: 08/30/11 Method: SW846 8260B Percent Solids: 85.7 Project: GESMD:PC# 007805 Bel Air Xtra Fuels, 2476 Churchville Road, Bel Air, MD
File ID DF Analyzed By Prep Date Prep Batch Analytical BatchRun #1 G141454.D 1 08/31/11 SJM n/a n/a VG6622Run #2
Initial WeightRun #1 4.2 gRun #2
VOA Full List + Oxygenates
CAS No. Compound Result RL MDL Units Q
67-64-1 Acetone ND 14 9.2 ug/kg71-43-2 Benzene ND 1.4 0.18 ug/kg108-86-1 Bromobenzene ND 6.9 0.27 ug/kg74-97-5 Bromochloromethane ND 6.9 0.72 ug/kg75-27-4 Bromodichloromethane ND 6.9 0.31 ug/kg75-25-2 Bromoform ND 6.9 1.0 ug/kg74-83-9 Bromomethane ND 6.9 0.55 ug/kg78-93-3 2-Butanone (MEK) ND 14 6.0 ug/kg104-51-8 n-Butylbenzene ND 6.9 0.33 ug/kg135-98-8 sec-Butylbenzene ND 6.9 0.22 ug/kg98-06-6 tert-Butylbenzene ND 6.9 0.19 ug/kg56-23-5 Carbon tetrachloride ND 6.9 0.48 ug/kg108-90-7 Chlorobenzene ND 6.9 0.45 ug/kg75-00-3 Chloroethane ND 6.9 0.57 ug/kg67-66-3 Chloroform ND 6.9 0.67 ug/kg74-87-3 Chloromethane ND 6.9 0.87 ug/kg95-49-8 o-Chlorotoluene ND 6.9 0.52 ug/kg106-43-4 p-Chlorotoluene ND 6.9 0.29 ug/kg108-20-3 Di-Isopropyl ether ND 6.9 0.18 ug/kg96-12-8 1,2-Dibromo-3-chloropropane ND 14 2.1 ug/kg124-48-1 Dibromochloromethane ND 6.9 0.23 ug/kg106-93-4 1,2-Dibromoethane ND 1.4 0.33 ug/kg95-50-1 1,2-Dichlorobenzene ND 6.9 0.38 ug/kg541-73-1 1,3-Dichlorobenzene ND 6.9 0.27 ug/kg106-46-7 1,4-Dichlorobenzene ND 6.9 0.24 ug/kg75-71-8 Dichlorodifluoromethane ND 6.9 0.45 ug/kg75-34-3 1,1-Dichloroethane ND 6.9 0.30 ug/kg107-06-2 1,2-Dichloroethane ND 1.4 0.25 ug/kg75-35-4 1,1-Dichloroethene ND 6.9 0.85 ug/kg156-59-2 cis-1,2-Dichloroethene ND 6.9 0.45 ug/kg156-60-5 trans-1,2-Dichloroethene ND 6.9 0.59 ug/kg78-87-5 1,2-Dichloropropane ND 6.9 0.37 ug/kg
ND = Not detected MDL - Method Detection Limit J = Indicates an estimated valueRL = Reporting Limit B = Indicates analyte found in associated method blankE = Indicates value exceeds calibration range N = Indicates presumptive evidence of a compound
20 of 30
JA84895
22.4

Accutest LabLink@633162 08:59 09-Sep-2011
Report of Analysis Page 2 of 3
Client Sample ID: MW-13 17.5-19' Lab Sample ID: JA84895-4 Date Sampled: 08/29/11 Matrix: SO - Soil Date Received: 08/30/11 Method: SW846 8260B Percent Solids: 85.7 Project: GESMD:PC# 007805 Bel Air Xtra Fuels, 2476 Churchville Road, Bel Air, MD
VOA Full List + Oxygenates
CAS No. Compound Result RL MDL Units Q
142-28-9 1,3-Dichloropropane ND 6.9 0.52 ug/kg594-20-7 2,2-Dichloropropane ND 6.9 0.24 ug/kg563-58-6 1,1-Dichloropropene ND 6.9 0.29 ug/kg10061-01-5 cis-1,3-Dichloropropene ND 6.9 0.21 ug/kg10061-02-6 trans-1,3-Dichloropropene ND 6.9 0.47 ug/kg100-41-4 Ethylbenzene ND 1.4 0.21 ug/kg87-68-3 Hexachlorobutadiene ND 6.9 0.72 ug/kg98-82-8 Isopropylbenzene ND 6.9 0.19 ug/kg99-87-6 p-Isopropyltoluene ND 6.9 0.41 ug/kg1634-04-4 Methyl Tert Butyl Ether ND 1.4 0.25 ug/kg108-10-1 4-Methyl-2-pentanone(MIBK) ND 6.9 3.7 ug/kg74-95-3 Methylene bromide ND 6.9 0.79 ug/kg75-09-2 Methylene chloride ND 6.9 0.32 ug/kg91-20-3 Naphthalene ND 6.9 1.5 ug/kg103-65-1 n-Propylbenzene ND 6.9 0.48 ug/kg100-42-5 Styrene ND 6.9 0.26 ug/kg75-65-0 Tert Butyl Alcohol ND 35 8.0 ug/kg994-05-8 tert-Amyl Methyl Ether ND 6.9 0.21 ug/kg637-92-3 tert-Butyl Ethyl Ether ND 6.9 0.19 ug/kg630-20-6 1,1,1,2-Tetrachloroethane ND 6.9 0.26 ug/kg79-34-5 1,1,2,2-Tetrachloroethane ND 6.9 0.25 ug/kg127-18-4 Tetrachloroethene ND 6.9 0.27 ug/kg108-88-3 Toluene ND 1.4 0.53 ug/kg87-61-6 1,2,3-Trichlorobenzene ND 6.9 0.61 ug/kg120-82-1 1,2,4-Trichlorobenzene ND 6.9 0.47 ug/kg71-55-6 1,1,1-Trichloroethane ND 6.9 0.33 ug/kg79-00-5 1,1,2-Trichloroethane ND 6.9 0.60 ug/kg79-01-6 Trichloroethene ND 6.9 0.34 ug/kg75-69-4 Trichlorofluoromethane ND 6.9 0.67 ug/kg96-18-4 1,2,3-Trichloropropane ND 6.9 1.5 ug/kg95-63-6 1,2,4-Trimethylbenzene ND 6.9 1.6 ug/kg108-67-8 1,3,5-Trimethylbenzene ND 6.9 0.18 ug/kg75-01-4 Vinyl chloride ND 6.9 0.64 ug/kg
m,p-Xylene ND 1.4 0.44 ug/kg95-47-6 o-Xylene ND 1.4 0.26 ug/kg1330-20-7 Xylene (total) ND 1.4 0.26 ug/kg
CAS No. Surrogate Recoveries Run# 1 Run# 2 Limits
1868-53-7 Dibromofluoromethane 101% 67-131%
ND = Not detected MDL - Method Detection Limit J = Indicates an estimated valueRL = Reporting Limit B = Indicates analyte found in associated method blankE = Indicates value exceeds calibration range N = Indicates presumptive evidence of a compound
21 of 30
JA84895
22.4

Accutest LabLink@633162 08:59 09-Sep-2011
Report of Analysis Page 3 of 3
Client Sample ID: MW-13 17.5-19' Lab Sample ID: JA84895-4 Date Sampled: 08/29/11 Matrix: SO - Soil Date Received: 08/30/11 Method: SW846 8260B Percent Solids: 85.7 Project: GESMD:PC# 007805 Bel Air Xtra Fuels, 2476 Churchville Road, Bel Air, MD
VOA Full List + Oxygenates
CAS No. Surrogate Recoveries Run# 1 Run# 2 Limits
17060-07-0 1,2-Dichloroethane-D4 73% 66-130%2037-26-5 Toluene-D8 107% 76-125%460-00-4 4-Bromofluorobenzene 101% 53-142%
ND = Not detected MDL - Method Detection Limit J = Indicates an estimated valueRL = Reporting Limit B = Indicates analyte found in associated method blankE = Indicates value exceeds calibration range N = Indicates presumptive evidence of a compound
22 of 30
JA84895
22.4

Accutest LabLink@633162 08:59 09-Sep-2011
Report of Analysis Page 1 of 1
Client Sample ID: MW-13 17.5-19' Lab Sample ID: JA84895-4 Date Sampled: 08/29/11 Matrix: SO - Soil Date Received: 08/30/11 Method: SW846 8015C Percent Solids: 85.7 Project: GESMD:PC# 007805 Bel Air Xtra Fuels, 2476 Churchville Road, Bel Air, MD
File ID DF Analyzed By Prep Date Prep Batch Analytical BatchRun #1 PF92009.D 1 09/01/11 XPL n/a n/a GPF2505Run #2
Initial Weight Final Volume Methanol AliquotRun #1 10.0 g 10.0 ml 100 ulRun #2
CAS No. Compound Result RL MDL Units Q
TPH-GRO (C6-C10) ND 13 2.4 mg/kg
CAS No. Surrogate Recoveries Run# 1 Run# 2 Limits
98-08-8 aaa-Trifluorotoluene 80% 66-119%
ND = Not detected MDL - Method Detection Limit J = Indicates an estimated valueRL = Reporting Limit B = Indicates analyte found in associated method blankE = Indicates value exceeds calibration range N = Indicates presumptive evidence of a compound
23 of 30
JA84895
22.4

Accutest LabLink@633162 08:59 09-Sep-2011
Report of Analysis Page 1 of 1
Client Sample ID: MW-13 17.5-19' Lab Sample ID: JA84895-4 Date Sampled: 08/29/11 Matrix: SO - Soil Date Received: 08/30/11 Method: SW846 8015C SW846 3545A Percent Solids: 85.7 Project: GESMD:PC# 007805 Bel Air Xtra Fuels, 2476 Churchville Road, Bel Air, MD
File ID DF Analyzed By Prep Date Prep Batch Analytical BatchRun #1 3Z34267.D 1 09/06/11 VDT 09/01/11 OP51617 G3Z1050Run #2
Initial Weight Final VolumeRun #1 10.2 g 1.0 mlRun #2
CAS No. Compound Result RL MDL Units Q
TPH-DRO (C10-C28) 161 11 0.37 mg/kg
CAS No. Surrogate Recoveries Run# 1 Run# 2 Limits
84-15-1 o-Terphenyl 87% 19-151%16416-32-3 Tetracosane-d50 82% 18-146%438-22-2 5a-Androstane 86% 14-147%
ND = Not detected MDL - Method Detection Limit J = Indicates an estimated valueRL = Reporting Limit B = Indicates analyte found in associated method blankE = Indicates value exceeds calibration range N = Indicates presumptive evidence of a compound
24 of 30
JA84895
22.4

Accutest LabLink@633162 08:59 09-Sep-2011
Report of Analysis Page 1 of 3
Client Sample ID: 2319 CHURCHVILLE RD Lab Sample ID: JA84895-5 Date Sampled: 08/29/11 Matrix: DW - Drinking Water Date Received: 08/30/11 Method: EPA 524.2 REV 4.1 Percent Solids: n/a Project: GESMD:PC# 007805 Bel Air Xtra Fuels, 2476 Churchville Road, Bel Air, MD
File ID DF Analyzed By Prep Date Prep Batch Analytical BatchRun #1 1B59730.D 1 09/01/11 MFH n/a n/a V1B2746Run #2
Purge VolumeRun #1 5.0 mlRun #2
VOA List
CAS No. Compound Result MCL RL MDL Units Q
67-64-1 Acetone ND 5.0 1.5 ug/l78-93-3 2-Butanone ND 5.0 0.91 ug/l71-43-2 Benzene ND 5.0 0.50 0.034 ug/l108-86-1 Bromobenzene ND 0.50 0.086 ug/l74-97-5 Bromochloromethane ND 0.50 0.15 ug/l75-27-4 Bromodichloromethane ND 0.50 0.063 ug/l75-25-2 Bromoform ND 0.50 0.11 ug/l74-83-9 Bromomethane ND 0.50 0.21 ug/l104-51-8 n-Butylbenzene ND 0.50 0.086 ug/l135-98-8 sec-Butylbenzene ND 0.50 0.19 ug/l98-06-6 tert-Butylbenzene ND 0.50 0.052 ug/l75-15-0 Carbon disulfide ND 0.50 0.042 ug/l108-90-7 Chlorobenzene ND 100 0.50 0.067 ug/l75-00-3 Chloroethane ND 0.50 0.22 ug/l67-66-3 Chloroform 0.12 0.50 0.075 ug/l J74-87-3 Chloromethane 0.25 0.50 0.082 ug/l J95-49-8 o-Chlorotoluene ND 0.50 0.093 ug/l106-43-4 p-Chlorotoluene ND 0.50 0.058 ug/l56-23-5 Carbon tetrachloride ND 5.0 0.50 0.086 ug/l75-34-3 1,1-Dichloroethane ND 0.50 0.072 ug/l75-35-4 1,1-Dichloroethylene ND 7.0 0.50 0.20 ug/l563-58-6 1,1-Dichloropropene ND 0.50 0.13 ug/l96-12-8 1,2-Dibromo-3-chloropropane ND 0.20 1.0 0.23 ug/l106-93-4 1,2-Dibromoethane ND 0.050 0.50 0.069 ug/l107-06-2 1,2-Dichloroethane ND 5.0 0.50 0.073 ug/l78-87-5 1,2-Dichloropropane ND 5.0 0.50 0.12 ug/l142-28-9 1,3-Dichloropropane ND 0.50 0.073 ug/l594-20-7 2,2-Dichloropropane ND 0.50 0.18 ug/l124-48-1 Dibromochloromethane ND 0.50 0.092 ug/l74-95-3 Dibromomethane ND 0.50 0.12 ug/l75-71-8 Dichlorodifluoromethane ND 1.0 0.20 ug/l541-73-1 m-Dichlorobenzene ND 0.50 0.049 ug/l
ND = Not detected MDL - Method Detection Limit J = Indicates an estimated valueMCL = Maximum Contamination Level (40 CFR 141) B = Indicates analyte found in associated method blankE = Indicates value exceeds calibration range N = Indicates presumptive evidence of a compound
25 of 30
JA84895
22.5

Accutest LabLink@633162 08:59 09-Sep-2011
Report of Analysis Page 2 of 3
Client Sample ID: 2319 CHURCHVILLE RD Lab Sample ID: JA84895-5 Date Sampled: 08/29/11 Matrix: DW - Drinking Water Date Received: 08/30/11 Method: EPA 524.2 REV 4.1 Percent Solids: n/a Project: GESMD:PC# 007805 Bel Air Xtra Fuels, 2476 Churchville Road, Bel Air, MD
VOA List
CAS No. Compound Result MCL RL MDL Units Q
95-50-1 o-Dichlorobenzene ND 600 0.50 0.069 ug/l106-46-7 p-Dichlorobenzene ND 75 0.50 0.062 ug/l156-60-5 trans-1,2-Dichloroethylene ND 100 0.50 0.11 ug/l156-59-2 cis-1,2-Dichloroethylene ND 70 0.50 0.14 ug/l10061-01-5 cis-1,3-Dichloropropene ND 0.50 0.085 ug/l10061-02-6 trans-1,3-Dichloropropene ND 0.50 0.051 ug/l108-20-3 Di-Isopropyl ether ND 0.50 0.10 ug/l100-41-4 Ethylbenzene ND 700 0.50 0.20 ug/l637-92-3 Ethyl tert Butyl Ether ND 0.50 0.076 ug/l87-68-3 Hexachlorobutadiene ND 2.0 0.077 ug/l110-54-3 Hexane ND 0.50 0.13 ug/l591-78-6 2-Hexanone ND 2.0 0.37 ug/l98-82-8 Isopropylbenzene ND 0.50 0.16 ug/l99-87-6 p-Isopropyltoluene ND 0.50 0.096 ug/l75-09-2 Methylene chloride ND 5.0 0.50 0.13 ug/l1634-04-4 Methyl Tert Butyl Ether 0.45 0.50 0.058 ug/l J108-10-1 4-Methyl-2-pentanone ND 2.0 0.28 ug/l91-20-3 Naphthalene ND 0.50 0.12 ug/l103-65-1 n-Propylbenzene ND 0.50 0.064 ug/l100-42-5 Styrene ND 100 0.50 0.052 ug/l994-05-8 tert-Amyl Methyl Ether ND 0.50 0.14 ug/l630-20-6 1,1,1,2-Tetrachloroethane ND 0.50 0.065 ug/l71-55-6 1,1,1-Trichloroethane ND 200 0.50 0.078 ug/l79-34-5 1,1,2,2-Tetrachloroethane ND 0.50 0.10 ug/l79-00-5 1,1,2-Trichloroethane ND 5.0 0.50 0.12 ug/l87-61-6 1,2,3-Trichlorobenzene ND 0.50 0.058 ug/l96-18-4 1,2,3-Trichloropropane ND 0.50 0.24 ug/l120-82-1 1,2,4-Trichlorobenzene ND 70 0.50 0.14 ug/l95-63-6 1,2,4-Trimethylbenzene ND 0.50 0.089 ug/l108-67-8 1,3,5-Trimethylbenzene ND 0.50 0.19 ug/l127-18-4 Tetrachloroethylene ND 5.0 0.50 0.085 ug/l108-88-3 Toluene ND 1000 0.50 0.067 ug/l79-01-6 Trichloroethylene ND 5.0 0.50 0.083 ug/l75-69-4 Trichlorofluoromethane ND 1.0 0.13 ug/l75-65-0 Tertiary Butyl Alcohol ND 5.0 1.2 ug/l75-01-4 Vinyl chloride ND 2.0 0.50 0.12 ug/l
m,p-Xylene ND 1.0 0.26 ug/l95-47-6 o-Xylene ND 0.50 0.044 ug/l1330-20-7 Xylenes (total) ND 10000 0.50 0.044 ug/l
ND = Not detected MDL - Method Detection Limit J = Indicates an estimated valueMCL = Maximum Contamination Level (40 CFR 141) B = Indicates analyte found in associated method blankE = Indicates value exceeds calibration range N = Indicates presumptive evidence of a compound
26 of 30
JA84895
22.5

Accutest LabLink@633162 08:59 09-Sep-2011
Report of Analysis Page 3 of 3
Client Sample ID: 2319 CHURCHVILLE RD Lab Sample ID: JA84895-5 Date Sampled: 08/29/11 Matrix: DW - Drinking Water Date Received: 08/30/11 Method: EPA 524.2 REV 4.1 Percent Solids: n/a Project: GESMD:PC# 007805 Bel Air Xtra Fuels, 2476 Churchville Road, Bel Air, MD
VOA List
CAS No. Surrogate Recoveries Run# 1 Run# 2 Limits
2199-69-1 1,2-Dichlorobenzene-d4 93% 78-114%460-00-4 4-Bromofluorobenzene 93% 77-115%
ND = Not detected MDL - Method Detection Limit J = Indicates an estimated valueMCL = Maximum Contamination Level (40 CFR 141) B = Indicates analyte found in associated method blankE = Indicates value exceeds calibration range N = Indicates presumptive evidence of a compound
27 of 30
JA84895
22.5

Accutest LabLink@633162 09:00 09-Sep-2011
Misc. Forms
Custody Documents and Other Forms
Includes the following where applicable:
• Chain of Custody
New Jersey
Section 3
28 of 30
JA84895
3

JA84895: Chain of CustodyPage 1 of 2
29 of 30
JA84895
33.1

Accutest Laboratories Sample Receipt Summary
Accutest LaboratoriesV:732.329.0200
2235 US Highway 130F: 732.329.3499
Dayton, New Jerseywww/accutest.com
Accutest Job Number JA84895 Client:
Date / Time Received: 8/30/2011
Delivery Method:
Project:
No. Coolers: 1 Airbill #'s:
Cooler Security
1. Custody Seals Present:
Y or N
2. Custody Seals Intact:
3. COC Present:
4. Smpl Dates/Time OK
2. Cooler temp verification:
Cooler Temperature Y or N
1. Temp criteria achieved:
3. Cooler media:
IR Gun
Ice (Bag)
Quality Control Preservatio Y or N N/A
1. Trip Blank present / cooler:
2. Trip Blank listed on COC:
3. Samples preserved properly:
4. VOCs headspace free:
Sample Integrity - Documentation Y or N
1. Sample labels present on bottles:
2. Container labeling complete:
3. Sample container label / COC agree:
Sample Integrity - Condition Y or N
1. Sample recvd within HT:
3. Condition of sample:
2. All containers accounted for:
Sample Integrity - Instructions
1. Analysis requested is clear:
2. Bottles received for unspecified tests
3. Sufficient volume recvd for analysis:
4. Compositing instructions clear:
5. Filtering instructions clear:
Intact
Y or N
Comments
Y or N N/A
JA84895: Chain of CustodyPage 2 of 2
30 of 30
JA84895
33.1

Corrective Action Plan Drake Bel Air 2476 Churchville Rd, Bel Air, MD
APPENDIX C
POTABLE WELL LOGS


Corrective Action Plan Drake Bel Air 2476 Churchville Rd, Bel Air, MD
ATTACHMENTS

Attachment 1Summary of Remedial Feaibility Testing Field NotesDrake Bel Air Xtra Fuels 2476 Churchville RdBel Air, MD
Time: 10:31 Time: 10:54 Time: 12:07 Time: 12:49 Time: 13:27 Time: 14:06 Time: 14:39
Extraction Well: MW-10 Date: 9/8/2011 Date: 9/8/2011 Date: 9/8/2011 Date: 9/8/2011 Date: 9/8/2011 Date: 9/8/2011 Date: 9/8/2011
Initial DTW: 13.40' bgs PID conc (ppm): 232 @ 10:20 PID conc (ppm): 284 PID conc (ppm): NM PID conc (ppm): 208 @ 12:25 PID conc (ppm): 180 PID conc (ppm): 160 PID conc (ppm): 174Total Depth of Well: 24.40' LEL (%): 0 @ 9:55 LEL (%): NM LEL (%): NM LEL (%): 0 @ 12:25 LEL (%): 0 LEL (%): NM LEL (%): 0Screen Interval: 5-25' O2 (%): 13.3 @ 9:55 O2 (%): 9.3 O2 (%): NM O2 (%): 11.2 @ 12:25 O2 (%): 11.0 O2 (%): NM O2 (%): 12.0Initial screen interval available: 8.40' Vapor flow (scfm): 6.7 Vapor flow (scfm): 6.2 Vapor flow (scfm): NA Vapor flow (scfm): 7.60 Vapor flow (scfm): 10.95 Vapor flow (scfm): 18.55 Vapor flow (scfm): 28.22Well Diameter: 4" Gw flow (gpm): NA Gw flow (gpm): NA Gw flow (gpm): 1.08 Gw flow (gpm): 1.91 Gw flow (gpm): 2.07 Gw flow (gpm): 2.75 Gw flow (gpm): 2.29
Totalizer (gal): 0 Totalizer (gal): 0 Totalizer (gal): 54 Totalizer (gal): 142 Totalizer (gal): 227 Totalizer (gal): 326 Totalizer (gal): 397Vac. applied on well (i.w.): 31 Vac. applied on well (i.w.): 50 Vac. applied on well (i.w.): 0 Vac. applied on well (i.w.): 50 Vac. applied on well (i.w.): 77 Vac. applied on well (i.w.): 116 Vac. applied on well (i.w.): 210Vac.at well ("Hg): 2.76 Vac.at well ("Hg): 3.45 Vac.at well ("Hg): 0.06 Vac.at well ("Hg): 2.93 Vac.at well ("Hg): 3.40 Vac.at well ("Hg): 9.41 Vac.at well ("Hg): 14.76Liquid Level Change (ft):+1.93 Liquid Level Change (ft): +3.18 Liquid Level Change (ft): -5.66 Liquid Level Change (ft): -5.65 Liquid Level Change (ft): -5.69 Liquid Level Change (ft): -4.59 Liquid Level Change (ft): + 2.20
Radial Screen Initial Influence Water table Influence Water table Influence Water table Influence Water table Influence Water table Influence Water table Influence Water table
distance interval depth to vacuum upwelling (+) or vacuum upwelling (+) or vacuum upwelling (+) or vacuum upwelling (+) or vacuum upwelling (+) or vacuum upwelling (+) or vacuum upwelling (+) or
Well from MW-10 range water reading drawdown (-) reading drawdown (-) reading drawdown (-) reading drawdown (-) reading drawdown (-) reading drawdown (-) reading drawdown (-)
ID (feet) (feet) (feet) (i.w.) (feet) (i.w.) (feet) (i.w.) (feet) (i.w.) (feet) (i.w.) (feet) (i.w.) (feet) (i.w.) (feet)
MW-12 10 5-25' 13.28 -1.84 -0.30 -3.16 -0.06 0.00 -0.37 -3.30 -0.70 -4.40 -0.86 -7.84 -1.05 -9.85 -0.96
TF-1 28 NA 10.24 NM NM 0.00 -0.10 NM -0.10 NM NM 0.00 -0.16 -0.02 -0.18 -0.07 -0.19
MW-13 43 4-19' 14.77 -0.06 0.02 -0.05 -0.01 -0.05 0.05 -0.09 0.03 -0.12 0.00 -0.18 -0.01 -0.23 -0.07
MW-16 45 3-18' 13.97 -0.48 -0.01 -0.75 0.03 -0.32 -0.05 -1.28 -0.05 -0.88 -0.04 -1.63 -0.05 -1.75 -0.05
MW-11 48 4-24' 14.00 0.00 0.00 NM 0.03 NM 0.03 0.00 0.04 0.00 0.00 -0.04 0.00 -0.08 0.00
TF-2 48 NA 12.88 NM NM NM 0.00 NM 0.00 NM NM NM NM NM NM -0.08 0.00
MW-7 51 NA 14.66 NM NM NM 0.01 NM -0.01 NM NM NM NM NM NM 0.00 -0.03
MW-9 53 NA 13.15 -0.15 -0.03 -0.35 -0.01 -0.04 -0.01 -0.15 -0.11 -0.17 -0.19 -0.23 -0.29 -0.70 -0.46
MW-14 68 5-25' 13.07 -0.50 0.05 -0.52 0.04 0.00 0.02 -0.36 0.02 -1.20 0.03 -2.60 0.07 -3.60 0.06
NA- not available VEGE - vacuum-enhanced groundwater extraction scfm - standard cubic feet per minute i.w. - inches of water
NM - not measured SVE- soil vapor extraction ppm - parts per million "Hg - inches of mercuryDTW - depth to water AS - air sparge gpm - gallons per minute
September 8 & 9, 2011
GW PUMPING (11:16 - 12:09) VEGE Step #4 (14:09 - 14:39)SVE Step #2 (10:34 - 10:56)SVE Step #1 (9:33 - 10:34) VEGE Step #1 (12:09 - 12:56) VEGE Step #2 (12:56 - 13:36) VEGE Step #3 (13:36 - 14:09)

Attachment 1Summary of Remedial Feaibility Testing Field NotesDrake Bel Air Xtra Fuels 2476 Churchville RdBel Air, MD
Time: 15:50 Time: 16:16 Time: 16:44
Extraction Well: TF-1 Date: 9/8/2011 Date: 9/8/2011 Date: 9/8/2011
Initial DTW: 10.43' bgs PID conc (ppm): 368 PID conc (ppm): 389 PID conc (ppm): 270 @ 16:35Total Depth of Well: 11.6' LEL (%): 0 LEL (%): 0 LEL (%): 0 @ 16:35Screen Interval: Unknown O2 (%): 16.1 O2 (%): 18.0 O2 (%): 18.6 @ 16:35Initial screen interval available: Unknown Vapor flow (scfm): 58.70 Vapor flow (scfm): 97.70 Vapor flow (scfm): 124.37Well Diameter: Unknown Gw flow (gpm): NA Gw flow (gpm): NA Gw flow (gpm): NA
Totalizer (gal): 0 Totalizer (gal): 0 Totalizer (gal): 0Vac. applied on well (i.w.): 15 Vac. applied on well (i.w.): 35 Vac. applied on well (i.w.): 55Vac.at well ("Hg): 0.46 Vac.at well ("Hg): 0.77 Vac.at well ("Hg): 0.94Liquid Level Change (ft): +0.26 Liquid Level Change (ft): +0.63 Liquid Level Change (ft): +1.01
Radial Screen Initial Influence Water table Influence Water table Influence Water table
distance interval depth to vacuum upwelling (+) or vacuum upwelling (+) or vacuum upwelling (+) or
Well from TF-1 range water reading drawdown (-) reading drawdown (-) reading drawdown (-)
ID (feet) (feet) (feet) (i.w.) (feet) (i.w.) (feet) (i.w.) (feet)
MW-16 17 3-18' 13.97 -0.35 0.01 -0.20 0.04 -0.39 0.05
MW-11 23 4-24' 14.00 -0.01 0.02 -0.02 0.01 -0.03 0.01
MW-13 24 4-19' 14.99 NM 0.10 NM 0.11 NM 0.25
MW-8 35 NA 14.31 -0.05 0.01 -0.07 0.02 -0.19 0.04
MW-10 38 5-25' 13.39 -0.03 0.10 -0.05 0.17 -0.09 0.23
MW-7 46 NA 14.69 -0.04 0.00 -0.22 0.05 -0.36 0.07
TF-2 55 NA 12.88 -0.18 0.00 -0.32 0.00 -0.44 0.00
NA- not available VEGE - vacuum-enhanced groundwater extraction scfm - standard cubic feet per minute i.w. - inches of water
NM - not measured SVE- soil vapor extraction ppm - parts per million "Hg - inches of mercuryDTW - depth to water AS - air sparge gpm - gallons per minute
September 8 & 9, 2011
SVE Step #1 (15:33 - 15:54) SVE Step #3 (16:18 - 16:45)SVE Step #2 (15:54 - 16:18)

Attachment 1Summary of Remedial Feaibility Testing Field NotesDrake Bel Air Xtra Fuels 2476 Churchville RdBel Air, MD
Time: 17:34 Time: 17:49 Time: 17:55
Extraction Well: MW-7 Date: 9/8/2011 Date: 9/8/2011 Date: 9/8/2011
Initial DTW: 14.62' bgs PID conc (ppm): 404 PID conc (ppm): 357 PID conc (ppm): 403Total Depth of Well: Unknown LEL (%): 0 LEL (%): 0 LEL (%): 0Screen Interval: Unknown O2 (%): 8.9 O2 (%): 11.4 O2 (%): 10.6Initial screen interval available: Unknown Vapor flow (scfm): 2.99 Vapor flow (scfm): 3.86 Vapor flow (scfm): 4.20Well Diameter: Unknown Gw flow (gpm): NA Gw flow (gpm): NA Gw flow (gpm): NA
Totalizer (gal): 0 Totalizer (gal): 0 Totalizer (gal): 0Vac. applied on well (i.w.): 32 Vac. applied on well (i.w.): 50 Vac. applied on well (i.w.): 68Vac.at well ("Hg): 2.22 Vac.at well ("Hg): 3.40 Vac.at well ("Hg): 4.71Liquid Level Change (ft): +1.15 Liquid Level Change (ft): +2.14 Liquid Level Change (ft): +3.21
Radial Screen Initial Influence Water table Influence Water table Influence Water tabledistance interval depth to vacuum upwelling (+) or vacuum upwelling (+) or vacuum upwelling (+) or
Well from MW-7 range water reading drawdown (-) reading drawdown (-) reading drawdown (-)ID (feet) (feet) (feet) (i.w.) (feet) (i.w.) (feet) (i.w.) (feet)
TF-2 24 NA 12.88 -0.03 0.00 0.00 0.00 0.01 0.00
MW-11 37 4-24' 13.97 0.00 -0.01 0.00 -0.03 0.00 -0.02
TF-1 45 NA 10.43 -0.02 0.21 -0.02 0.15 NM NM
MW-10 51 5-25' 13.40 0.03 -0.01 0.03 -0.01 0.02 0.01
MW-16 52 3-18' 13.97 NM 0.05 NM 0.05 NM NM
MW-9 61 NA 13.15 0.06 -0.05 0.07 -0.02 0.03 0.01
NA- not available VEGE - vacuum-enhanced groundwater extraction scfm - standard cubic feet per minute i.w. - inches of waterNM - not measured SVE- soil vapor extraction ppm - parts per million "Hg - inches of mercuryDTW - depth to water AS - air sparge gpm - gallons per minute
September 8 & 9, 2011
SVE Step #3 (17:50 - 17:57)SVE Step #2 (17:38 - 17:50)SVE Step #1 (17:14 - 17:38)

Attachment 1Summary of Remedial Feaibility Testing Field NotesDrake Bel Air Xtra Fuels 2476 Churchville RdBel Air, MD
Time: 8:55 Time: 9:31 Time: 10:28 Time: 10:48 Time: 11:17 Time: 11:56 Time: 12:38
Extraction Well: MW-12 Date: 9/9/2011 Date: 9/9/2011 Date: 9/9/2011 Date: 9/9/2011 Date: 9/9/2011 Date: 9/9/2011 Date: 9/9/2011
Initial DTW: 13.15' bgs PID conc (ppm): 27 PID conc (ppm): 22 PID conc (ppm): NM PID conc (ppm): 68.5 PID conc (ppm): 68.9 PID conc (ppm): 71.7 @ 11:40 PID conc (ppm): 50.5Total Depth of Well: 25.0' LEL (%): 0 LEL (%): 0 LEL (%): NM LEL (%): 0 LEL (%): NM LEL (%): 0 @ 11:40 LEL (%): 0Screen Interval: 5-25' O2 (%): 20.0 O2 (%): 19.4 O2 (%): NM O2 (%): 16.9 O2 (%): NM O2 (%): 14.2 @ 11:40 O2 (%): 16.3Initial screen interval available: 8.15' Vapor flow (scfm): 6.23 Vapor flow (scfm): 7.36 Vapor flow (scfm): NA Vapor flow (scfm): 4.20 Vapor flow (scfm): 8.10 Vapor flow (scfm): 15.87 Vapor flow (scfm): 30.93Well Diameter: 4" Gw flow (gpm): NA Gw flow (gpm): NA Gw flow (gpm): 1.34 Gw flow (gpm): 1.55 Gw flow (gpm): 1.55 Gw flow (gpm): 2.03 Gw flow (gpm): 2.57
Totalizer (gal): 0 Totalizer (gal): 0 Totalizer (gal): 51 Totalizer (gal): 82 Totalizer (gal): 127 Totalizer (gal): 206 Totalizer (gal): 314Vac. applied on well (i.w.): 32 Vac. applied on well (i.w.): 49 Vac. applied on well (i.w.): 0 Vac. applied on well (i.w.): 51 Vac. applied on well (i.w.): 74 Vac. applied on well (i.w.): 136 Vac. applied on well (i.w.): 218Vac.at well ("Hg): 2.06 Vac.at well ("Hg): 3.25 Vac.at well ("Hg): 0.03 Vac.at well ("Hg): 3.50 Vac.at well ("Hg): 4.67 Vac.at well ("Hg): 9.98 Vac.at well ("Hg): 15.30Liquid Level Change (ft):+2.22 Liquid Level Change (ft): +3.59 Liquid Level Change (ft): -7.61 Liquid Level Change (ft): -7.61 Liquid Level Change (ft): -7.59 Liquid Level Change (ft): -7.50 Liquid Level Change (ft): -7.45
Radial Screen Initial Influence Water table Influence Water table Influence Water table Influence Water table Influence Water table Influence Water table Influence Water table
distance interval depth to vacuum upwelling (+) or vacuum upwelling (+) or vacuum upwelling (+) or vacuum upwelling (+) or vacuum upwelling (+) or vacuum upwelling (+) or vacuum upwelling (+) or
Well from MW-10 range water reading drawdown (-) reading drawdown (-) reading drawdown (-) reading drawdown (-) reading drawdown (-) reading drawdown (-) reading drawdown (-)
ID (feet) (feet) (feet) (i.w.) (feet) (i.w.) (feet) (i.w.) (feet) (i.w.) (feet) (i.w.) (feet) (i.w.) (feet) (i.w.) (feet)
MW-10 10 5-25' 13.26 -0.20 -0.02 -0.38 -0.14 -0.03 -0.66 -0.39 -0.82 -0.99 -1.04 -5.48 -1.58 -9.76 -2.02
TF-1 36 NA 10.66 0.00 0.00 0.00 0.00 0.00 0.00 0.00 0.00 -0.01 NM -0.02 -0.01 -0.02 NM
MW-9 44 NA 13.07 -0.02 -0.01 -0.05 -0.01 -0.01 0.00 -0.03 -0.03 -0.07 -0.01 -0.31 -0.04 -0.56 -0.07
MW-13 53 4-19' 14.56 0.01 -0.02 0.01 0.01 0.02 -0.04 0.02 -0.01 0.02 -0.02 0.01 -0.06 0.00 -0.06
MW-16 53 3-18' 13.77 NM NM NM -0.01 NM -0.01 NM -0.01 NM NM NM -0.01 NM NM
MW-11 55 4-24' 13.80 NM NM 0.00 0.03 NM 0.03 0.00 0.02 NM NM -0.03 0.01 -0.01 0.00
MW-14 56 5-25' 12.96 -0.02 0.00 -0.06 0.02 -0.02 0.01 -0.03 0.04 -0.09 0.05 -0.75 -0.01 -1.55 -0.02
MW-7 61 NA 14.47 NM NM 0.00 0.00 NM 0.00 NM NM NM NM -0.03 -0.02 -0.02 -0.03
MW-8 61 NA 14.12 NM NM -0.02 0.00 NM 0.00 0.00 0.00 NM NM -0.27 -0.01 -0.46 -0.03
NA- not available VEGE - vacuum-enhanced groundwater extraction scfm - standard cubic feet per minute i.w. - inches of water
NM - not measured SVE- soil vapor extraction ppm - parts per million "Hg - inches of mercuryDTW - depth to water AS - air sparge gpm - gallons per minute
September 8 & 9, 2011
GW PUMPING (9:50 - 10:30)SVE Step #2 (8:58 - 9:33)SVE Step #1 (8:27 - 8:58) VEGE Step #1 (10:30 - 10:49) VEGE Step #2 (10:49 - 11:17) VEGE Step #3 (11:19 - 11:57) VEGE Step #4 (11:57 - 12:39)

Vapor Extraction Well: MW-10 SVE & VEGE Vapor FlowInitial DTW (feet): 13.40 ("Hg) (scfm)Initial screen interval available (feet): 8.40 2.8 5.6
3.5 6.42.9 8.13.9 11.09.4 18.614.8 28.2
Vapor Extraction Well: TF-1 SVE Vapor FlowInitial DTW (feet): 10.24 ("Hg) (scfm)Initial screen interval available (feet): Unknown 0.5 58.7
0.8 97.70.9 124.4
Vapor Extraction Well: MV-7 SVE Vapor FlowInitial DTW (feet): 14.66 ("Hg) (scfm)Initial screen interval available (feet): Unknown 2.2 3.0
3.4 3.94.7 4.2
Vapor Extraction Well: MW-12 SVE & VEGE Vapor FlowInitial DTW (feet): 13.15 ("Hg) (scfm)Initial screen interval available (feet): 8.15 2.1 6.2
3.3 7.43.5 4.24.7 8.110.0 15.915.3 30.9
VEGE - vacuum enhanced groundwater extraction scfm - standard cubic feet per minuteSVE - soil vapor extraction "Hg - inches of mercuryDTW - depth to water
2476 Churchville Rd
Attachment 2Vacuum vs. Vapor Flow Graphs
Drake Bel AirXtra Fuels
Vacuum on well
Vacuum on well
Bel Air, MD
September 8 & 9, 2011
Vacuum on well
Vacuum on well
MW-10: Vapor Flow vs. Vacuum
0
5
10
15
20
25
30
0.0 5.0 10.0 15.0 20.0Vacuum ("Hg)
Va
po
r F
low
Ra
te (
sc
fm)
TF-1: Vapor Flow vs. Vacuum
0
20
40
60
80
100
120
140
0.0 0.2 0.4 0.6 0.8 1.0Vacuum ("Hg)
Va
po
r F
low
Ra
te
(sc
fm)
MW-12: Vapor Flow vs. Vacuum
0
5
10
15
20
25
30
35
0.0 5.0 10.0 15.0 20.0Vacuum ("Hg)
Va
po
r F
low
Ra
te
(sc
fm)
MW-7: Vapor Flow vs. Vacuum
0123456789
10
0.0 2.0 4.0 6.0 8.0 10.0Vacuum ("Hg)
Va
po
r F
low
Ra
te
(sc
fm)

ROI estimated based on assuming 0.10 inches of water vacuum to be the minimal effective vacuum influence. VEGE - vacuum enhanced groundwater extractioni.w. - inches of water
ROI estimated based on assuming 0.10 inches of water vacuum to be the minimal effective vacuum influence. VEGE - vacuum enhanced groundwater extractioni.w. - inches of water
Bel Air, MD
September 8 & 9, 2011
Attachment 3Feasibility Testing Vacuum Radius-of-Influence Graphs
Drake Bel Air - Xtra Fuels
2476 Churchville Rd
Distance vs. Observed VacuumVEGE Test on MW-10
0.01
0.10
1.00
10.00
100.00
0 10 20 30 40 50 60 70
Distance From Extraction Well (feet)
Vac
uu
m (
i.w.)
Distance vs. Observed VacuumSVE Test on MW-TF-1
0.01
0.10
1.00
10.00
100.00
0 10 20 30 40 50 60 70Distance From Extraction Well (feet)
Vac
uu
m (
i.w.)

Bel Air, MD
September 8 & 9, 2011
Attachment 3Feasibility Testing Vacuum Radius-of-Influence Graphs
Drake Bel Air - Xtra Fuels
2476 Churchville Rd
NOTE: No significant vacuum was observed. Therefore the ROI is estimated at "Less than 24 feet".ROI estimated based on assuming 0.10 inches of water vacuum to be the minimal effective vacuum influence. VEGE - vacuum enhanced groundwater extractioni.w. - inches of water
ROI estimated based on assuming 0.10 inches of water vacuum to be the minimal effective vacuum influence.
VEGE - vacuum enhanced groundwater extraction
i.w. - inches of water
Distance vs. Observed VacuumSVE Test on MW-7
0.01
0.10
1.00
10.00
100.00
0 10 20 30 40 50 60 70
Distance From Extraction Well (feet)
Vac
uu
m (
i.w.)
Distance vs. Observed VacuumVEGE Test on MW-12
0.01
0.10
1.00
10.00
100.00
0 10 20 30 40 50 60 70
Distance From Extraction Well (feet)
Vac
uu
m (
i.w.)

Extraction Well ID Type of Test
Vac. On Well (i.w.)
Vac. On Well ("Hg)
Vapor Flowrate
(scfm)
Groundwater Flowrate
(gpm)
Groundwater Drawdown
(ft)
PID Reading (ppmv)
BTEX Conc.
(mg/m3)
MTBE Conc.
(mg/m3)
C1-C4 Hydrocarbon
Conc. (mg/m3)
>C4-C10 Hydrocarbon
Conc. (mg/m3)
BTEX Recovery (lb/day)
MTBE Recovery (lb/day)
C1-C4 Hydrocarbon
Recovery (lb/day)
>C4-C10 Hydrocarbon
Recovery (lb/day)
SVE - Step 1 26.51 1.95 5.59 - +1.93 232.5 NS NS NS NS NM NM NM NM
SVE - Step 2 44.73 3.29 6.70 - +3.18 284 4.84 12 36.4 125 0.0 0.0 0.0 0.1
GWE - - - 1.08 -5.66 - - - - - - - - -
VEGE - Step 1 42.96 3.16 8.10 1.91 -5.65 208 NS NS NS NS NM NM NM NM
VEGE - Step 2 52.75 3.88 10.95 2.07 -5.69 180 16.46 41.5 73.9 347 0.0 0.0 0.1 0.3
VEGE - Step 3 115.97 8.53 18.55 2.75 -4.59 160 NS NS NS NS NM NM NM NM
VEGE - Step 4 202.16 14.87 28.22 2.29 +2.20 174 NS NS NS NS NM NM NM NM
SVE - Step 1 6.25 0.46 58.70 - +0.26 368 NS NS NS NS NM NM NM NM
SVE - Step 2 11.15 0.82 97.70 - +0.63 389 38.1 0.61 60.4 557 0.3 0.0 0.5 4.9
SVE - Step 3 13.19 0.97 124.37 - +1.01 270 NS NS NS NS NM NM NM NM
SVE - Step 1 29.37 2.16 2.99 - +1.15 404 28.4 43.6 131 1,280 0.0 0.0 0.0 0.3
SVE - Step 2 46.22 3.40 3.86 - +2.14 357 NS NS NS NS NM NM NM NM
SVE - Step 3 65.12 4.79 4.20 - +3.21 403 NS NS NS NS NM NM NM NM
SVE - Step 1 26.24 1.93 6.13 - +2.22 27 NS NS NS NS NM NM NM NM
SVE - Step 2 44.86 3.30 7.36 - +3.59 22 10.91 14 18.5 58.0 0.0 0.0 0.0 0.0
GWE - - - 1.34 -7.61 - NS NS NS NS NM NM NM NM
VEGE - Step 1 47.58 3.50 4.20 1.55 7.61 70.0 NS NS NS NS NM NM NM NM
VEGE - Step 2 64.85 4.77 8.10 1.55 -7.59 68.9 NS NS NS NS NM NM NM NM
VEGE - Step 3 135.81 9.99 15.87 2.03 -7.50 71.7 6.97 106 237 248 0.0 0.2 0.3 0.4
VEGE - Step 4 208.41 15.33 30.93 2.57 -7.45 50.5 NS NS NS NS NM NM NM NM
Notes: i.w. = inches of water "Hg = inches of Mercuryscfm = standard cubic feet per minutegpm = gallons per minutepsi = pounds per square inchppmv = parts per million (volume)mg/m3 = milligrams per cubic meterlb/day = pounds per dayrecovery (lb/day) = conc. (mg/m3) x flow (scfm) x 1lb/454,000mg x 0.0283m3/ft3 x 1440 min/dayNS= Not sampled; NM = Not measuredBDL= Below analytical method detection limitE = Indicates value exceeds calibration range
TF-1
MW-7
MW-12
Attachment 4
Pilot Test Vapor Analytical Data Summary
Bel Air, MD
Drake Bel Air - Xtra Fuels
2476 Churchville Rd
September 8 & 9, 2011
MW-10

Parameter (units)MW-10
VEGE Step 1MW-12GWE
Benzene (µg/L) 2,090 1,120Toluene (µg/L) 7,720 1,730Ethylbenzene (µg/L) 2,740 1,670Xylenes (µg/L) 11,900 6,850BTEX (µg/L) 24,450 11,370MTBE (µg/l) 46,900 89,800TPH-GRO (mg/L) 135 135TPH-DRO (mg/L) 18.4 14.3Total Calcium (mg/l) 84.2 80.4Total Iron (mg/l) 23.0 40.4Total Lead (mg/l) <0.003 0.0049Total Magnesium (mg/l) 36 51.7Total Manganese (mg/l) 16.1 25.6Oil and Grease (mg/l) NA NATotal Dissolved Solids (TDS) (mg/l) 972 1210Total Suspended Solids (TSS) (mg/l) 14.0 433
NA= Not analyzedµg/l= micrograms per litermg/l= milligrams per literBTEX= Sum of benzene, toluene, ethylbenzene and total xylenesMTBE= methyl tert butyl etherTPH-GRO= Total petroleum hydrocarbons as gasoline range organicsTPH-DRO= Total petroleum hydrocarbons as diesel range organicsTDS= Total Dissolved SolidsTSS= Total Suspended Solids
September 8 & 9, 2011
2476 Churchville RdBel Air, MD
Attachment 5Feasibility Test Groundwater Analytical Results
Drake Bel Air - Xtra Fuels

Hardness- Hardness
causing Molecular Equivalent Concentration as CaCO3cation weight weight (mg/L) (mg/L)
Calcium 40.08 20.04 84.2 210Magnesium 24.31 12.15 36.0 148
Iron 55.85 27.93 23.0 41.2Manganese 54.94 27.47 16.10 29.3
Total Hardness as CaCO3 = 429
Hardness- Hardness
causing Molecular Equivalent Concentration as CaCO3cation weight weight (mg/L) (mg/L)
Calcium 40.08 20.04 80.4 201Magnesium 24.31 12.15 51.7 213
Iron 55.85 27.93 40.4 72.3Manganese 54.94 27.47 25.60 46.6
Total Hardness as CaCO3 = 532
NOTES:Samples were collected from monitoring well MW-10 on September 8, 2011 and from monitoring well MW-12 on September 9, 2011.
mg/L - milligrams per liter
CaCO3 - calcium carbonate
Hardness (as CaCO3) = Conc. (mg/l) x 50 / (equivalent weight)
2476 Churchville Rd
Attachment 6Feasibility Test Groundwater Analytical Results:
Drake Bel Air - Xtra Fuels
Total Hardness in Groundwater
MW-10
MW-12
September 8 & 9, 2011
Bel Air, MD