corporate presentation tsx: bne november 2019 · bonterra will generate significant discretionary...
TRANSCRIPT

1
November 2019TSX: BNECORPORATE PRESENTATION

2
Forward Looking InformationCertain statements contained in this Presentation include statements which contain words such as “anticipate”, “could”, “should”, “expect”, “seek”, “may”,“intend”, “likely”, “will”, “believe” and similar expressions, statements relating to matters that are not historical facts, and such statements of our beliefs,intentions and expectations about development, results and events which will or may occur in the future, constitute “forward-looking information” within themeaning of applicable Canadian securities legislation and are based on certain assumptions and analysis made by us derived from our experience andperceptions. Forward-looking information in this Presentation includes, but is not limited to: expected cash provided by continuing operations; future capitalexpenditures, including the amount and nature thereof; oil and natural gas prices and demand; expansion and other development trends of the oil and gasindustry; business strategy and outlook; expansion and growth of our combined business and operations; and maintenance of existing supplier and partnerrelationships; supply channels; accounting policies; credit risks; and other such matters. Forward-looking information in this Presentation also includes, but is notlimited to, the timing and amount of future dividend payments by Bonterra.
All such forward-looking information is based on certain assumptions and analyses made by us in light of our experience and perception of historical trends,current conditions and expected future developments, as well as other factors we believe are appropriate in the circumstances. The risks, uncertainties, andassumptions are difficult to predict and may affect operations, and may include, without limitation: foreign exchange fluctuations; equipment and labourshortages and inflationary costs; general economic conditions; industry conditions; changes in applicable environmental, taxation and other laws and regulationsas well as how such laws and regulations are interpreted and enforced; the ability of oil and natural gas companies to raise capital; the effect of weatherconditions on operations and facilities; the existence of operating risks; volatility of oil and natural gas prices; oil and gas product supply and demand; risksinherent in the ability to generate sufficient cash flow from operations to meet current and future obligations; increased competition; stock market volatility;opportunities available to or pursued by us; and other factors, many of which are beyond our control. The foregoing factors are not exhaustive.
Actual results, performance or achievements could differ materially from those expressed in, or implied by, this forward-looking information and, accordingly, noassurance can be given that any of the events anticipated by the forward-looking information will transpire or occur, or if any of them do so, what benefits will bederived there from. Except as required by law, Bonterra disclaims any intention or obligation to update or revise any forward-looking information, whether as aresult of new information, future events or otherwise.
The term barrels of oil equivalent (BOE) may be misleading, particularly if used in isolation. A BOE conversion ratio of six thousand cubic feet per barrel(6mcf/bbl) of natural gas to barrels of oil equivalence is based on an energy equivalency conversion method primarily applicable at the burner tip and does notrepresent a value equivalency at the wellhead. All BOE conversions in the report are derived from converting gas to oil in the ratio mix of six thousand cubic feetof gas to one barrel of oil.
The forward-looking information contained herein is expressly qualified by this cautionary statement.

3
Forward Looking Information
DRILLING LOCATIONS:
This presentation discloses drilling locations in three categories: (i) proved locations; (ii) probable locations; and (iii) unbooked locations. Proved locations andprobable locations, which are sometimes collectively referred to as “booked locations”, are derived from the Company’s most recent independent reserves evaluationas prepared by Sproule as of December 31, 2018 and account for drilling locations that have associated proved or probable reserves, as applicable.
Unbooked locations are internal estimates based on the Company’s prospective acreage and an assumption as to the number of wells that can be drilled per sectionbased on industry practice and internal review. Unbooked locations do not have attributed reserves or resources. Of the 700+ Net drilling locations identified herein,294 are net proved locations, 4 are net probable locations and 400+ are net unbooked locations. Unbooked locations have specifically been identified by managementas an estimation of our multi-year drilling activities based on evaluation of applicable geologic, seismic, and engineering, production and reserves data on prospectiveacreage and geologic formations. There is no certainty that we will drill all unbooked drilling locations and if drilled there is no certainty that such locations will resultin additional oil and gas reserves, resources or production. The locations that Bonterra drills will ultimately depend upon the availability of capital, regulatoryapprovals, seasonal restrictions, oil and natural gas prices, costs, actual drilling results and other factors. While certain of the unbooked drilling locations have beenderisked by drilling existing wells in relative close proximity to such unbooked drilling locations, the majority of other unbooked drilling locations are farther away fromexisting wells where management has less information about the characteristics of the reservoir and therefore there is more uncertainty whether wells will be drilledin such locations and if drilled there is more uncertainty that such wells will result in additional oil and gas reserves, resources or production.

4
Current Corporate Snapshot
(1)Based on Share Price of $3.50
Financial TSX: BNE
Common Shares Outstanding 33.3 million
Insider Ownership 25%
Current Monthly Dividend $0.01 per share
Current Annualized Yield (1) 3.4%
Tax Pools at Q3 2019 $359 million
Tax Horizon ~2020
Q3 2019 Exit Net Debt ~$308 million
Bank Line $325 million ($283 million drawn at Q3 2019 exit)
Operational
Average Production (Q3 2019) 12,136 boepd
2019 Production Guidance ~12,400 boepd
Oil and Liquids Weighting 69% (62% oil & 7% liquids)
Natural Gas Weighting 31%
Average Corporate Production Decline Rate ~20%
Reserve Life Index (PDP) 8 years
Reserve Life Index (1P) 17 years
Reserve Life Index (2P) 21 years
4

5
Consistent Strategy
DIVIDENDPlus
GROWTH
DEBT REPAYMENT
FREE CASH FLOW GENERATION
A proven track record built on generating long-term, sustainable value through a combination of growth plus
returning capital to shareholders via dividends
Excess free cash flow will be directed to reduce overall debt, and then assess increases to the
dividend or capital budget
Low corporate decline rate ensures minimal capital required to sustain
production, which supports maximizing free cash flow
Bonterra’s focus will remain on generating strong, sustainable free cash flow which can be used
to reduce debt, and as leverage is reduced look to increase the dividend

6
Bonterra: Focused on Fundamentals
Disciplined Oil Exposure
Low CostOperations
VALUE CREATION
Focus onBalance Sheet
Concentrated Asset Base
Significant Low Risk Drilling Inventory:
Established and Controlled Infrastructure:
~20% Corporate Decline
Free Cash Flow Generation
Bonterra’s proven track record has been built on a model of generating long-term, sustainable
value through a combination of returning capital to shareholders via dividends and modest growth
Light oil focused with Pembina & Willesden Green Areas representing ~97% of production
700+ net locations identified and 298 net locations booked (43%)(1)
Minimal facility capital required to scale up production; 92% of production is operated
Strategy underway to reduce debt to funds flow ratio through capital allocation,
dividend adjustment, cost control
leads to low maintenance
capex
(1)Please see disclaimers for drilling locations in forward looking statements.

7
Returning Capital to Shareholders
• Bonterra remains a yield company focused on per share value creationachieved by paying dividends and growing production, reserves and cash flow per share
• Financial flexibility allows Bonterrato adjust the dividend in responseto broader commodity pricefluctuations
• Focus on generating free cash flowthat can be allocated to debt repayment, growth capital orpotentially adjusting the dividend upward
• Relative to pure growth-oriented companies, Bonterra shareholders realize a return via monthly dividends, coupled with opportunities for corporate growth that can lead to multiple expansion
Yield + sustainability strategy affords flexibility to adapt to commodity price environment
while continuing to return capital to shareholders
$0
$20
$40
$60
$80
$100
$120
$140
$160
$-
$0.10
$0.20
$0.30
Jan
-98
Jan
-99
Jan
-00
Jan
-01
Jan
-02
Jan
-03
Jan
-04
Jan
-05
Jan
-06
Jan
-07
Jan
-08
Jan
-09
Jan
-10
Jan
-11
Jan
-12
Jan
-13
Jan
-14
Jan
-15
Jan
-16
Jan
-17
Jan
-18
Jan
-19
Dividend EDM Light Share Price
Edm
onto
n L
ight
($/b
bl) &
BN
E S
hare
Price ($
/share
)
Div
iden
d (
$/m
on
th)

8
Long-Term Development Opportunities
West Pembina
Willesden Green
Keystone
Rose Creek
Carnwood
BlueRapids
Cynthia
Concentrated assets in the Pembina & Willesden Green area support efficient operations and offer
exposure to significant upside through a large inventory of low-risk, highly economic undrilled locations
Pembina & Willesden Green Lands by the Numbers
473 grossSections of land (312 net) 92%
Operated Production
101.2 MBOEP+P Reserves
21 yearsReserve Life Index (P+P)
700+ netInternally identified multi-zone locations
298 netBooked locations
Ferrier

9
Pembina Cardium Overview
Original Oil in Place per Section Recovery Factor
5,000 to 10,000 Mbbl
10,000 to 20,000 Mbbl
20,000 to 25,000 Mbbl
0 to 5,000 Mbbl
25,000+ Mbbl
5%
10%
15%
0%
20%
25%
• Pembina is the largest conventional oilfield in Canada with large oil-in-place and low recovery to date, offering long-term stable production, high-quality oil and attractive netbacks
• Majority of Bonterra land covers areas with significant remaining original-oil-in-place
• Opportunity to increase recovery factors can contribute to sizable increases in reserves and production

10
Pembina Cardium Geology
Conglomerate
Sandstone
Sandstone
Bioturbated
Mudstone
Shale
Shale
• Interbedded sandstone and shale with local conglomerate and prevalent underlying low permeability bioturbated mudstone
• Depths range from 1,200 m TVD in NE Pembina to 2,000m TVD in SW Pembina

11
2019 Production Forecast – Q3 Update
~21% Corporate Decline Rate
Low decline rate means less capital is required to maintain production, contributing to free
cash flow growth over time
0
2,000
4,000
6,000
8,000
10,000
12,000
14,000
16,000
Jan-18 Apr-18 Jul-18 Oct-18 Jan-19 Apr-19 Jul-19 Oct-19 Jan-20
BO
E/d
Vertical Wells Horizontal Wells 2019 Capital Program

12
2019 Q3 Update
(1) Realized Oil Price calculated as follows: (WTI Oil Price – Differential) x FX rate – (Quality Adjustment) (2) Assumptions: Edmonton light differential: U$6.00; FX: 0.76 CAD/US; Quality adjustment C$3.25/bbl; BNE Realized Gas $2.00/mcf; BNE Realized Liquids: 40% of
realized oil(3) CAPEX decrease of MM$C 3 versus Q2 update results from delaying completions on 3 Net wells until January 2020
Bonterra will generate significant discretionary cash under the varying price forecasts and
exhibits great torque to improving commodity prices
Assumptions:
2019 WELLS DRILLED 30 Gross (23.7 Net) 2019 FORECASTED ANNUAL PRODUCTION 12,400 boe/d
OIL PRICE (WTI) USD/bbl $50.27 $54.07 $57.87 $61.67 $65.47
REALIZED OIL PRICE(1) CAD/bbl $55.00 $60.00 $65.00 $70.00 $75.00
FUNDS FLOW (2) MM$C 78 88 99 105 120
CAPEX MM$C 56 56 56 56 56
CASH FLOW MM$C 21 32 43 49 64
DIVIDEND MM$C 4 4 4 4 4
DISCRETIONARY CASH MM$C 17 28 39 45 60
YE2019 DEBT ESTIMATE MM$C 312 301 290 284 269
DEBT/FUNDS FLOW MM$C 4.01x 3.40x 2.92x 2.69x 2.25x

13
Average BNE Cardium Full Cycle Economics
WTI $USD/bbl $ 50.12 $ 53.85 $ 57.59 $ 61.32 $ 65.05
BNE Realized Price (1,2) $CAD/bbl $ 55.00 $ 60.00 $ 65.00 $ 70.00 $ 75.00 Full Cycle Capital (3) M$C $ 2,155 $ 2,265 $ 2,265 $ 2,265 $ 2,265
BT Payout Years 2.2 2.0 1.6 1.4 1.2 Rate of Return % 37% 42% 53% 66% 81% BT NPV10 M$C $ 939 $ 1,140 $ 1,432 $ 1,706 $ 1,971Capital Efficiency S/boepd $19,250 $20,210 $20,210 $20,210 $20,210 Recycle Ratio 1.9 2.0 2.2 2.4 2.4
(1) Realized Oil Price calculated as follows: (WTI Oil Price – Differential) x FX rate – (Quality Adjustment) (2) Assumptions: Edmonton light differential: U$6.62; FX: 0.747 CAD/US; Quality adjustment C$3.25/bbl; BNE Realized Gas $1.88/mcf; BNE Realized Liquids: 50% of realized oil(3) Drill, Complete, Equip, Tie-In, Facilities
0
50
100
150
200
250
300
1 2 3 4 5 6 7 8 9 10 11 12 13 14 15 16 17 18 19 20 21 22 23 24
BO
E/D
Month
BNE Type Curve: Full Cycle Price and Capital Sensitivities
Reserves per well (MBOE) 165
IP (12 months) (boe/d) 112
Cardium wells are repeatable, predictable and generate strong returns even in a weak
commodity price environment

14
2015 2016 2017 2018
12,656 12,650
$20
$30
$40
$50
$60
$70
$80
$90
Cap
ital
Exp
end
itu
res
($m
m)
Capital Expenditures ($mm)
Annual Production
Annual Production (BOE per day)
Successfully maintaining production levels through a challenging commodity price environment
12,82713,206
OIL & NGL GAS
Consistent and conservative production management delivers predictable returns across
changing commodity prices and preserves long-term shareholder value
15
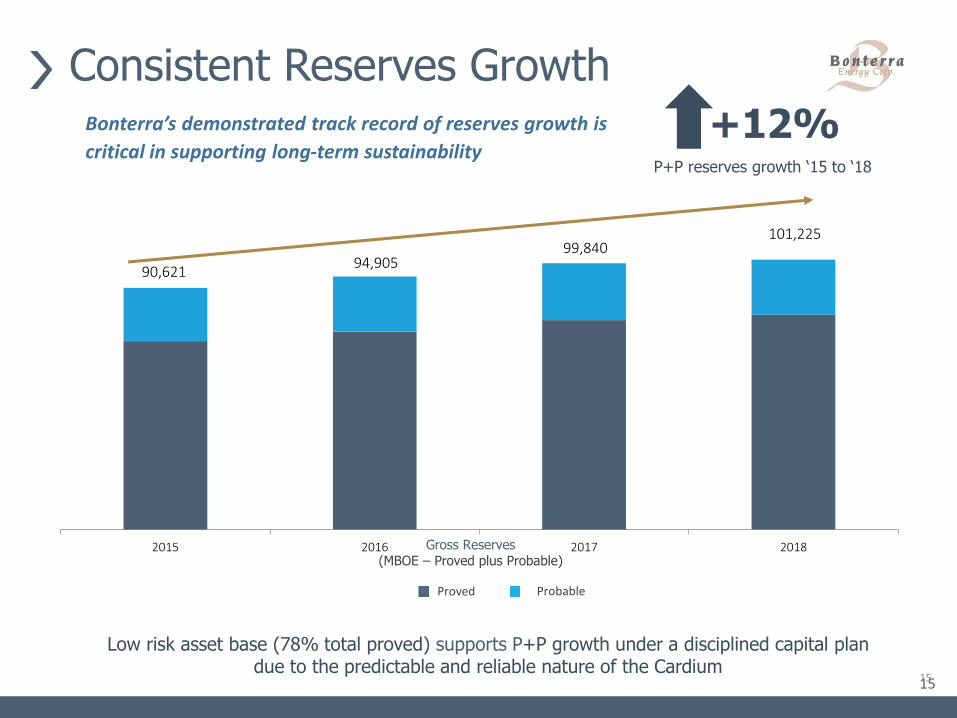
Consistent Reserves Growth
Low risk asset base (78% total proved) supports P+P growth under a disciplined capital plan due to the predictable and reliable nature of the Cardium
15
Gross Reserves(MBOE – Proved plus Probable)
+12%P+P reserves growth ‘15 to ‘18
Proved Probable
90,62194,905
99,840101,225
2015 2016 2017 2018
Bonterra’s demonstrated track record of reserves growth is
critical in supporting long-term sustainability

16
Building per Share Value
Production per Share(BOE per share)
Reserves per Share(BOE per share) (P+P)
Continuous value creation on a per share basis from 2015 to 2018
4%Production per share Reserves per share
9%
2.7
8
2.8
5
3.0
0
3.0
4
2015 2016 2017 2018
0.1
39
0.1
40
0.1
41
0.1
45
0.100
0.105
0.110
0.115
0.120
0.125
0.130
0.135
0.140
0.145
0.150
2015 2016 2017 2018

17
Investment Summary: Why Bonterra?Oil weighted producer offering yield and exposure to oil price upside through operational
excellence and conservative financial management
Insiders own ~25%
Industry low ~20% decline
$1.1B has been returned to shareholders in dividends since 1998
Low-risk asset base with 78% 1P reserves
Experienced & Aligned
Management
Low Corporate
Decline Rate
Yield
Low-Risk Drilling
Inventory
Shareholder Value
Creation

18
Appendix

19
Cash Flow Sensitivities
Sensitivity Analysis(1)
(estimate for 2019) Cash FlowCash Flow
Per Share(2)
Change of Canadian $1.00 per barrel of oil and NGLs $2,843,000 $0.09
Change of Canadian $0.10 per MCF of natural gas $1,007,000 $0.03
Change of Canadian $0.01 / U.S.$ exchange rate $1,507,000 $0.05
Per Annum
(1) This analysis uses current royalty rates, annualized estimated average production of 12,600 BOE per day and no changes in working capital(2) Based on annualized basic weighted average shares outstanding of 33,388,796
20
Corporate Information
DIRECTORSG. F. Fink G. J. DrummondR. M. JarockR. A. TourignyA. M. WalshD. Reuter
Bonterra Energy Corp.
Suite 901, 1015 – 4th St SW
Calgary, AB T2R 1J4
Phone: 403.262.5307
HEAD OFFICE
OFFICERSG. F. Fink
CEO & Chairman of the Board
R. D. ThompsonCFO & Corporate Secretary
A. Neumann Chief Operating Officer
B. A. CurtisSenior VP, Business Development
STOCK EXCHANGE LISTINGTSX: BNE
LEGAL COUNSELBorden Ladner Gervais LLP
BANKSCIBC
National Bank of Canada
The Toronto Dominion Bank
Alberta Treasury Branches
Business Development Bank of Canada
REGISTRAR & TRANSFER AGENTOdyssey Trust Company of Canada
AUDITORSDeloitte LLP
INDEPENDENT RESERVE ENGINEERSproule Associates Limited