corporate presentation march 2017 - nuvista energy · corporate presentation . march 2017 . all...
TRANSCRIPT

CORPORATE PRESENTATION March 2017 All amounts in Canadian dollars unless indicated otherwise.
1
Advisory Regarding Forward-Looking Information and Statements
This presentation contains forward-looking statements and forward-looking information within the meaning of applicable securities laws. The use of any of the words “will”, “expects”, “believe”, “plans”, “potential” and similar expressions are intended to identify forward-looking statements or information. More particularly and without limitation, this presentation contains forward-looking statements and information concerning: NuVista's future strategy, focus and opportunities; plans to maintain NuVista's balance sheet strength; NuVista's ability to profitably grow production and funds from operations and develop NuVista's resource base, processing and infrastructure plans; future processing capacity; the benefits of NuVista's risk management program; the anticipated benefits of NuVista's asset base; expected supply cost increases and annual efficiency gains; NuVista's exploration and development program; drilling, testing and completion plans, the timing thereof and the results therefrom; anticipated inventory of drilling locations and type of wells; estimated liquid yields; estimated supply and demands for condensates; anticipated well economics including drilling, completion and equipping and tie-in costs; estimated future oil and gas services costs; anticipated well performance and type curves; and other estimated operating, transportation, G&A and other costs; estimated liquid yields; netbacks, payouts, finding and development costs, capital efficiencies, recycle ratio and estimated rates of return; anticipated facility capacity and NuVista's ability to fulfill all TOP obligations; expected impact of infrastructure maintenance; guidance with respect to NuVista's capital expenditure program, production, production mix, netback, funds from operations, targeted net debt levels and net debt to funds from operations ratios; working capital, commodity pricing and exchange rates, industry activity and industry conditions. Statements relating to "reserves" and "resources" are also deemed to be forward-looking statements, as they involve the implied assessment, based on certain estimates and assumptions, that the reserves or resources described exist in the quantities predicted or estimated and that the reserves or resources can be profitably produced in the future. The forward-looking statements and information in this presentation are based on certain key expectations and assumptions made by NuVista, including prevailing commodity prices and exchange rates; applicable royalty rates and tax laws; future well production rates; reserve and resource volumes; the performance of existing wells; the success obtained in drilling new wells; the sufficiency of budgeted capital expenditures in carrying out planned activities; continuing access to capital and debt markets; the availability and cost of labour and services; debt service requirements and operating costs and the receipt, in a timely manner, of regulatory and other required approvals. Although NuVista believes that the expectations and assumptions on which such forward-looking statements and information are based are reasonable, undue reliance should not be placed on the forward-looking statements and information because NuVista can give no assurance that they will prove to be correct. There is no certainty that NuVista will achieve commercially viable production from its undeveloped lands and prospects. Since forward-looking statements and information address future events and conditions, by their very nature they involve inherent risks and uncertainties. Actual results could differ materially from those currently anticipated due to a number of factors and risks. These include, but are not limited to the risks associated with the oil and gas industry in general such as: operational risks in development, exploration and production; delays or changes in plans with respect to exploration or development projects or capital expenditures; the uncertainty of reserve and resource estimates; the uncertainty of estimates and projections relating to reserves, production, costs and expenses; health, safety and environmental risks; commodity price and exchange rate fluctuations; marketing and transportation of petroleum and natural gas and loss of markets; environmental risks; competition; incorrect assessment of the value of acquisitions; failure to realize the anticipated benefits of acquisitions; ability to access sufficient capital from internal and external sources; stock market volatility; and changes in legislation, including but not limited to tax laws, royalty rates and environmental regulations. Management has included the above summary of assumptions and risks related to forward-looking statements in order to provide a more complete perspective on NuVista's future operations. Readers are cautioned that this information may not be appropriate for other purposes. The foregoing list of factors is not exhaustive. Additional information on these and other factors that could affect the operations or financial results of NuVista are included in reports on file with applicable securities regulatory authorities and may be accessed through the SEDAR website (www.sedar.com). This presentation also contains future-oriented financial information and financial outlook information (collectively, "FOFI") about our prospective results of operations and funds from operations, all of which are subject to the same assumptions, risk factors, limitations, and qualifications as set forth in above. Readers are cautioned that the assumptions used in the preparation of such information, although considered reasonable at the time of preparation, may prove to be imprecise and, as such, undue reliance should not be placed on FOFI and forward-looking statements. NuVista’s actual results, performance or achievement could differ materially from those expressed in, or implied by, these FOFI and forward-looking statements, or if any of them do so, what benefits NuVista will derive therefrom. NuVista has included the FOFI and forward-looking statements in this presentation in order to provide readers with a more complete perspective on NuVista’s future operations and such information may not be appropriate for other purposes. The FOFI and forward-looking statements and information contained in this presentation are made as of the date hereof and NuVista undertakes no obligation to update publicly or revise any forward-looking statements or information, whether as a result of new information, future events or otherwise, unless so required by applicable securities laws.
March 2017

2
NuVista Snapshot
Production (MBoe/d)
27% 50%
75% 90%
95+%
28% 25%
17%
0
5
10
15
20
25
30
35
2013* 2014 2015 2016 2017EWapiti Montney Wapiti Sweet Other
TSX Trading Symbol: NVA Market Capitalization: ~$1.0 billion Basic Shares Outstanding(1): 172.7 million Bank Revolver Capacity(1): $200 million Percent Drawn(1): 0% Net Debt/Funds from Operations(2): 0.5x
2017 Guidance FY Average Production: 28,000 – 31,000 Boe/d FY Capital Investment: $260 – $300 million FY Funds from Operations(3): $160 – $180 million
NuVista Corporate Info
1 As at December 31, 2016 2 December 31, 2016 net debt to Q416 Annualized Funds from Operations. See "Non-GAPP Measurements". 3 2017 Pricing Assumptions: $3/GJ AECO and US$55/Bbl WTI * Pro-forma 2013 Divestitures
Grande Prairie
Edmonton
Calgary
NuVista Wapiti Montney Project
Non-Core Areas
March 2017

3
All of The Pieces in Place
Pure-Play Montney Company – In The Right Neighborhood Funded Growth Plan Through 2018+ Clear Line-of-Sight to 60,000 Boe/d Inventory Underpinned by Four Established Development Blocks Wellhead-to-Market Egress Plan In-Place 30%+ Condensate Production – Torque to Oil Price Proven Track Record of Execution
March 2017
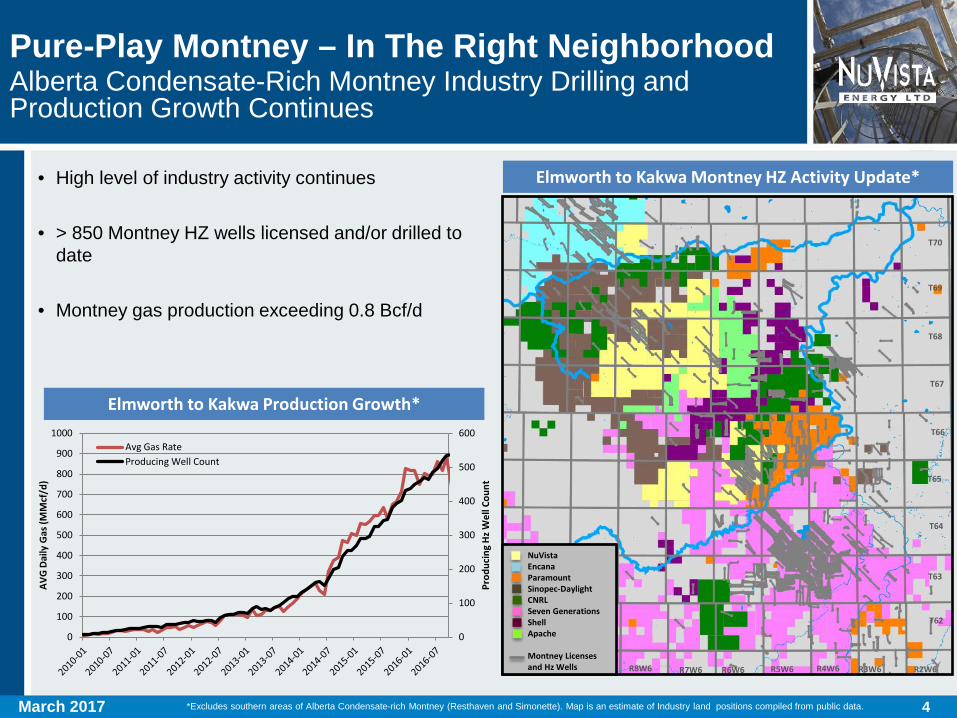
Pure-Play Montney – In The Right Neighborhood Alberta Condensate-Rich Montney Industry Drilling and Production Growth Continues
*Excludes southern areas of Alberta Condensate-rich Montney (Resthaven and Simonette). Map is an estimate of Industry land positions compiled from public data.
• High level of industry activity continues
• > 850 Montney HZ wells licensed and/or drilled to date
• Montney gas production exceeding 0.8 Bcf/d
Elmworth to Kakwa Montney HZ Activity Update*
Elmworth to Kakwa Production Growth*
NuVista Encana Paramount Sinopec-Daylight CNRL Seven Generations Shell Apache Montney Licenses and Hz Wells R6W6 R4W6 R2W6 R8W6
T65
T62
T67
T69
T70
T68
T66
T64
T63
R5W6 R3W6 R7W6
0
100
200
300
400
500
600
0
100
200
300
400
500
600
700
800
900
1000
Prod
ucin
g Hz
Wel
l Cou
nt
AVG
Dai
ly G
as (M
Mcf
/d)
Avg Gas RateProducing Well Count
March 2017 4
5
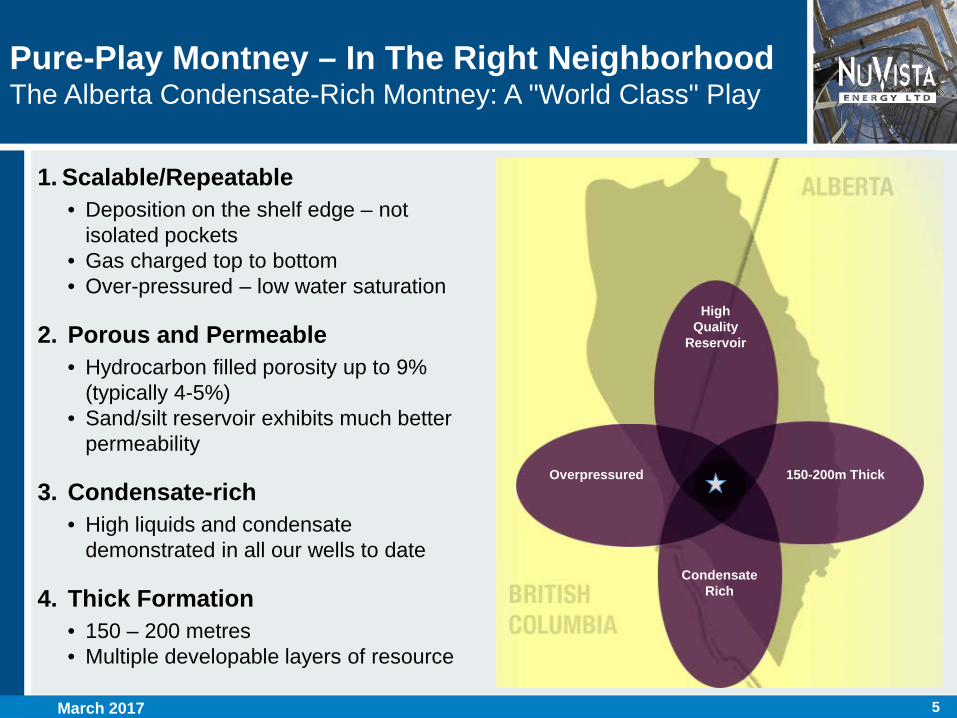
Pure-Play Montney – In The Right Neighborhood The Alberta Condensate-Rich Montney: A "World Class" Play
High Quality
Reservoir
Overpressured 150-200m Thick
Condensate Rich
1. Scalable/Repeatable • Deposition on the shelf edge – not
isolated pockets • Gas charged top to bottom • Over-pressured – low water saturation
2. Porous and Permeable • Hydrocarbon filled porosity up to 9%
(typically 4-5%) • Sand/silt reservoir exhibits much better
permeability
3. Condensate-rich • High liquids and condensate
demonstrated in all our wells to date
4. Thick Formation • 150 – 200 metres • Multiple developable layers of resource
March 2017

6
28.0 35.0
10
20
30
40
50
2015A 2016A 2017E 2018E
Upside Case Base Case
Funded Growth Plan Strong Growth with Managed Debt/Funds Flow
Capital Expenditures ($MM) Production (MBoe/d)
(1)Assumptions: 2017/18: US$55/Bbl WTI; C$3.00/GJ AECO; 1.30:1.0 C$:USD (2) Funds from Operations. See "Non-GAPP Measurements"
$260
$100
$200
$300
$400
2015A 2016A 2017E 2018E
Upside Case Base Case
Funds from Operations(1)(2) ($MM) Net Debt:Funds from Operations(1)(2)
$160
$215
$50
$100
$150
$200
$250
2015A 2016A 2017E 2018E
Upside Case Base Case
$189
$273
22.4 24.6
$300
31.0
$125 $138
$180
0.0x
1.0x
2.0x
3.0x
2015A 2016A 2017E 2018E
Base Pricing
$330
$280
$250
40.0
March 2017
7
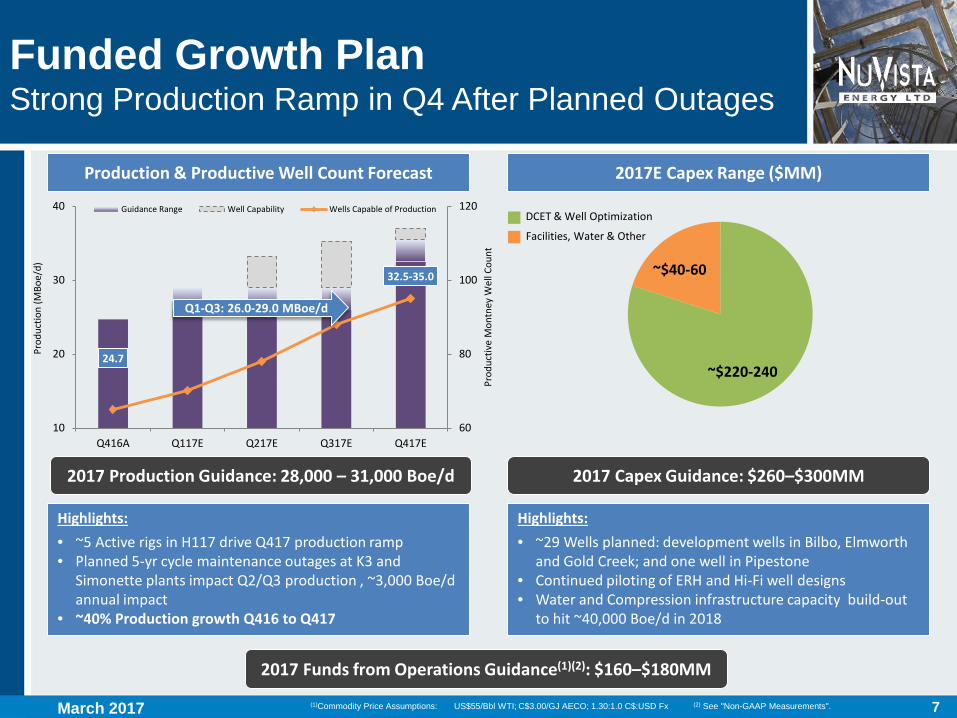
24.7
32.5-35.0
60
80
100
120
10
20
30
40
Q416A Q117E Q217E Q317E Q417E
Prod
uctiv
e M
ontn
ey W
ell C
ount
Prod
uctio
n (M
Boe/
d)
Guidance Range Well Capability Wells Capable of Production
Funded Growth Plan Strong Production Ramp in Q4 After Planned Outages
Production & Productive Well Count Forecast 2017E Capex Range ($MM)
~$220-240
~$40-60
Highlights:
• ~29 Wells planned: development wells in Bilbo, Elmworth and Gold Creek; and one well in Pipestone
• Continued piloting of ERH and Hi-Fi well designs • Water and Compression infrastructure capacity build-out
to hit ~40,000 Boe/d in 2018
2017 Capex Guidance: $260–$300MM
DCET & Well Optimization
Facilities, Water & Other
Highlights:
• ~5 Active rigs in H117 drive Q417 production ramp • Planned 5-yr cycle maintenance outages at K3 and
Simonette plants impact Q2/Q3 production , ~3,000 Boe/d annual impact
• ~40% Production growth Q416 to Q417
2017 Production Guidance: 28,000 – 31,000 Boe/d
(1)Commodity Price Assumptions: US$55/Bbl WTI; C$3.00/GJ AECO; 1.30:1.0 C$:USD Fx (2) See "Non-GAAP Measurements".
Q1-Q3: 26.0-29.0 MBoe/d
2017 Funds from Operations Guidance(1)(2): $160–$180MM
March 2017

8
Line-of-Sight to 60,000+ Boe/d Four Development Blocks Established
Pipestone
• Four layer development potential in the Montney
• Initial type-curve 5.0 Bcf, 60+ Bbls/MMcf condensate (range 45 to 150+ Bbls/MMcf)
• Full Development into potential new Wapiti Gas Plant
• Early Development Drilling in 2017 • Forecast production ~27% condensate • 10,000 Boe/d expected facility
capacity and well inventory(1)
Pipestone – Emerging Dev Block
Elmworth
• Base Type-curve 6.0 Bcf, 45 Bbls/MMcf condensate
• Optimized Type-Curve 7.0 Bcf, 40 Bbls/MMcf condensate
• Existing NVA owned compression and long-term firm service agreement for 100% of volumes
• Current Production ~10,000 Boe/d with ~22% condensate
• 16,000 Boe/d existing facility capacity and well inventory(1)
Elmworth – On Production
• Initial type-curve 4.0 Bcf, 60 Bbls/MMcf
condensate (range 40 to 150+Bbls/MMcf)
• NVA footprint provides optionality in well length (ERH)
• Early delineation/dev capacity into Elmworth infrastructure
• Full Development into potential new Wapiti Gas Plant
• Forecast production ~27% condensate • 18,000 Boe/d expected facility
capacity and well inventory(1)
Gold Creek – On Production
• Base Type-curve 4.4 Bcf, 75
Bbls/MMcf condensate • Optimized Type-Curve 5.0 Bcf, 75
Bbls/MMcf condensate • Existing NVA owned compression and
long-term firm service agreement for 100% of volumes
• Current Production ~14,000 Boe/d with ~32% condensate
• 18,000 Boe/d existing facility and well inventory(1)
Bilbo – On Production
(1) Well inventory is expected to be sufficient to produce at facility capacity for at least 10 years; refer to slide 22 & 23 for our existing midstream capacity and licensed Wapiti area gas plants.
March 2017

9
Inventory Underpinned by Established Development Blocks Zones Currently in Development
Inventory (Based on Zones Tested to date)
Area Pipestone (C) Elmworth (B&C) Gold Creek (B) Bilbo (B&C) Total
NVA Producers 0 21 6 39 66
Remaining Inventory 40-50 125 115 140 - 175 420 - 465
Pipestone
Gold Creek Bilbo
Elmworth
*Inventory only includes Montney intervals with current production or with direct offset production (i.e. Pipestone). Inventory represents NuVista's view of the development potential of each zone using current estimates for achievable well length. For comparison, year-end 2016 Proved Plus Probable locations (including producers) was 309. See "Advisory Regarding Oil and Gas Information".
15 Producers
6 Producers 6 Producers
Not Tested 3 Producers
36 Producers
Middle Montney 'D' Middle Montney 'C' Middle Montney 'B' Lower Montney
Not Tested
Offsetting Production
Multiple Industry Tests – Significant Future Potential
Tested
200m
+
March 2017
10
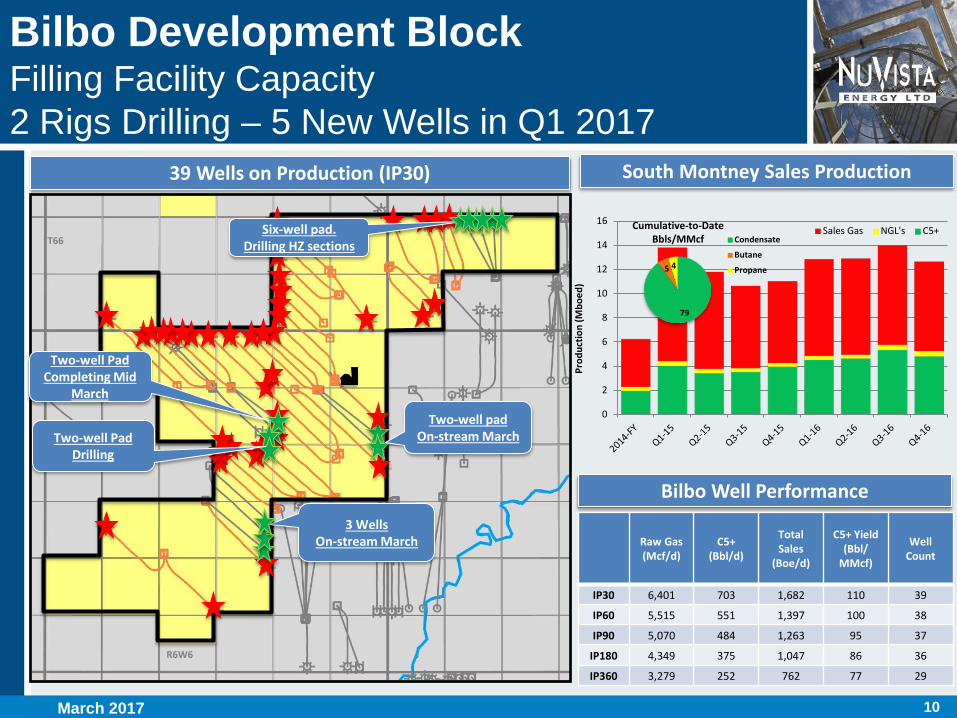
Bilbo Development Block Filling Facility Capacity 2 Rigs Drilling – 5 New Wells in Q1 2017
R6W6
T65
T66
South Montney Sales Production
3 Wells On-stream March
Two-well pad On-stream March
Six-well pad. Drilling HZ sections
Two-well Pad Completing Mid
March
39 Wells on Production (IP30)
Two-well Pad Drilling
Bilbo Well Performance
Raw Gas (Mcf/d)
C5+ (Bbl/d)
Total Sales
(Boe/d)
C5+ Yield (Bbl/
MMcf)
Well Count
IP30 6,401 703 1,682 110 39
IP60 5,515 551 1,397 100 38
IP90 5,070 484 1,263 95 37
IP180 4,349 375 1,047 86 36
IP360 3,279 252 762 77 29
0
2
4
6
8
10
12
14
16
Prod
uctio
n (M
boed
)
Sales Gas NGL's C5+
79
5 4
Cumulative-to-Date Bbls/MMcf Condensate
Butane
Propane
March 2017

11
Economics(6)(7)(8)(9) Original Type Curve
Historical Average(3)
Hi-Fi Type Curve
NPV10 ($MM) $6.6 $7.9 $10.1
PIR 1.0 1.2 1.2
Payout (Years) 1.5 1.3 0.9
ROR (%) 65% 80% 125%
Netback ($/Boe) $25.00 $25.00 $25.00
F+D ($/Boe) $6.25 $6.50 $7.00
Cap. Efficiency ($/Boed) $10,000 $9,000 $7,000
1st Year Prod (Boe/d) 600 700 1,100
1st Year Cash Flow ($MM) $5.5 $6.3 $10.3
Bilbo Development Block Results To-Date and Type Well Economics
Bilbo Type Curve Inputs and Economics
Half-Cycle Inputs Original Type Curve
Historical Average(3)
Hi-Fi Type Curve
DCET Capital ($MM) $6.3 $6.6 $8.4
EUR (Raw Gas) (Bcf) 4.4 4.4 5.0
EUR (MMBoe) 1.0 1.0 1.2
NGL(4) (C3, C4 Bbl/MMcf) 11 11 11
CGR(5) (C5+ Bbls/MMcf) 75 75 75
Opex ($/Boe) $10.00 $10.00 $10.00
Horizontal Length (m) 1,800 2,000 2,000
Stage Count 18 20 40
* Refer to the Advisories for our "Economic Input Assumptions" and for the various footnotes referred to above. (6) Pricing Assumptions: WTI (USD/Bbl): $55.00; AECO (C$/GJ): $3.00; Fx (CAD:USD): 1.30:1
Currently Piloting
March 2017
0
1
10
0 1,000 2,000 3,000 4,000 5,000 6,000
Rate
(MM
cf/d
)
Cumulative Gas (MMcf)
Original Historical Average Hi-Fi
Type Curve Comparison Plot
Bilbo Well Production to-Date(1)(2)

12
0
2
4
6
8
10
12
Prod
uctio
n (M
boed
)
Sales Gas NGL's C5+
Elmworth Development Block Volume Ramp In-Progress
R9W6
T67
T68
NVA Montney IP30's
NVA In-Progress Wells
Montney Horizontal Wells
NVA Compressor Site Connected to SemCAMS
R8W6 T69
Three-well Pad Drilling – ERH
Pilot up to 2,450m and 50
stages
2 Well Pad Drilled Hi-Fi Completion - March Planned Avg. 50 stages
North Montney Sales Production
Elmworth Well Performance
Raw Gas (Mcf/d)
C5+ (Bbl/d)
Total Sales
(Boe/d)
C5+ Yield (Bbl/
MMcf)
Well Count
IP30 6,536 326 1,342 50 21
IP60 5,881 283 1,191 48 21
IP90 5,521 259 1,110 47 21
IP180 4,276 182 845 42 16
IP360 3,278 121 631 37 12
39
8
9
Cumulative-to-Date Bbls/MMcf
Condensate
Butane
Propane
21 Wells on Production (IP30)
March 2017

13
Elmworth Development Block Results To-Date and Type Well Economics
Economics(6)(7)(8)(9) Original Type Curve
Historical Average(3)
Hi-Fi Type Curve
NPV10 ($MM) $4.6 $4.1 $6.5
PIR 0.8 0.7 0.8
Payout (Years) 2.0 2.3 1.2
ROR (%) 40% 35% 65%
Netback ($/Boe) $20.00 $19.00 $19.00
F+D ($/Boe) $5.25 $5.25 $6.00
Cap. Efficiency ($/Boed) $10,000 $10,000 $7,000
1st Year Prod (Boe/d) 600 600 1,200
1st Year Cash Flow ($MM) $4.5 $4.1 $8.2
Elmworth Type Curve Inputs and Economics
Half-Cycle Inputs Original Type Curve
Historical Average(3)
Hi-Fi Type Curve
DCET Capital ($MM) $6.1 $6.1 $8.2
EUR (Raw Gas) (Bcf) 6.0 6.0 7.0
EUR (MMBoe) 1.2 1.2 1.4
NGL(4) (C3, C4 Bbl/MMcf) 19 19 19
CGR(5) (C5+ Bbls/MMcf) 45 40 40
Opex ($/Boe) $10.50 $10.50 $10.50
Horizontal Length (m) 1,800 1,800 2,000
Stage Count 18 18 40
Currently Piloting
* Refer to the Advisories for our "Economic Input Assumptions" and for the various footnotes referred to above. (6) Pricing Assumptions: WTI (USD/Bbl): $55.00; AECO (C$/GJ): $3.00; Fx (CAD:USD): 1.30:1
March 2017
Type Curve Comparison Plot
0
1
10
0 1,000 2,000 3,000 4,000 5,000 6,000 7,000 8,000
Rate
(MM
cf/d
)
Cumulative Gas (MMcf)
Original Historical Average Hi-Fi
Elmworth Well Production to-Date(1)(2)

14
Gold Creek Development Block Initial Type-Curve Established – 2016/17 Early Development
Gold Creek Highlights
• Up to 3 developable layers
• Condensate yield expected to average 60+ Bbls/MMcf (range 40 to 150+)
• Initial type-curve raw gas EUR average 4.0+ Bcf
• 5 existing producers – ~4 additional through 2017
• Extended-reach Hz and High Frac Intensity (Hi-Fi) tests are planned
• 2016/17 Early Development through Elmworth Compressor – Full-field Development into 2019 SemCAMS Wapiti Gas Plant
• Majority of development does not require additional compression infrastructure – Lower Opex
Gold Creek Geology
MN
TN 'C
' M
NTN
'B'
Low
er M
NTN
Gamma Porosity %
20 0
Sour Infrastructure NVA Montney Producers Montney Hz Wells
To NVA Elmworth Comp Stn
SemCams Wapiti
Gas Plant
Activity and Infrastructure
Three-well ERH Pad Drilling Hi-Fi Completion Planned Avg.
3300m+ HZ and 55 stages
March 2017

15
0
1
10
0 1,000 2,000 3,000 4,000 5,000 6,000 7,000 8,000
Rate
(MM
cf/d
)
Cumulative Gas (MMcf)
Historical Average ERH ERH + HiFi
Type Curve Comparison Plot
Gold Creek Development Block Results To-Date and Type Well Economics
Economics(6)(7)(8)(9) Historical Average(3)
ERH Type Curve
ERH + Hi-Fi Type Curve
NPV10 ($MM) $4.2 $7.1 $8.6
PIR 0.6 0.9 0.8
Payout (Years) 2.3 1.5 1.1
ROR (%) 35% 60% 75%
Netback ($/Boe) $24.50 $24.50 $24.50
F+D ($/Boe) $8.00 $7.00 $8.00
Cap. Efficiency ($/Boed) $13,000 $10,000 $8,500
1st Year Prod (Boe/d) 550 850 1,250
1st Year Cash Flow ($MM) $5.0 $7.6 $11.3
Gold Creek Type Curve Inputs and Economics
Half-Cycle Inputs Historical Average(3)
ERH Type Curve
ERH + Hi-Fi Type Curve
DCET Capital ($MM) $7.1 $8.4 $10.6
EUR (Raw Gas) (Bcf) 4.0 5.5 6.0
EUR (MMBoe) 0.9 1.2 1.3
NGL(4) (C3, C4 Bbl/MMcf) 19 19 19
CGR(5) (C5+ Bbls/MMcf) 60 60 60
New GP Opex ($/Boe) $8.00 $8.00 $8.00
Horizontal Length (m) 2,000 3,000 3,000
Stage Count 25 38 60
Currently piloting
Currently Piloting Gold Creek Well Production to-Date(1)
* Refer to the Advisories for our "Economic Input Assumptions" and for the various footnotes referred to above. (6) Pricing Assumptions: WTI (USD/Bbl): $55.00; AECO (C$/GJ): $3.00; Fx (CAD:USD): 1.30:1
March 2017

16
Pipestone Development Block Initial Type-Curve Established Facilities in Planning Phase for 2019-20 Development
Pipestone Highlights Pipestone Geology
• Up to 4 developable layers
• Acreage to the West extensively developed by EnCana
• Condensate yield expected to average 60+ Bbls/MMcf (Range of 45 to 150+)
• Type-curve raw gas EUR expected to average 5.0 Bcf (Range of 3.0 to 7.0 Bcf)
• NVA is presently planning minimum of one well in 2017
• 2019-20 full-field development including compressor station and pipeline to new SemCAMS Wapiti plant
MN
TN 'C
' M
NTN
'D'
MN
TN 'B
' Lo
wer
MN
TN
Gamma Porosity 20 0
ECA Pipestone 'Super-Condensate'
ECA Pipestone Condensate-rich Development
Future NVA Compressor and Pipeline to SemCAMS
Wapiti Gas Plant
Pipestone Activity
*Map of activity at Pipestone is compiled from public data
CNOR 13-22 HZ Initial Test
278 Bbls/MMcf C5+
March 2017
17
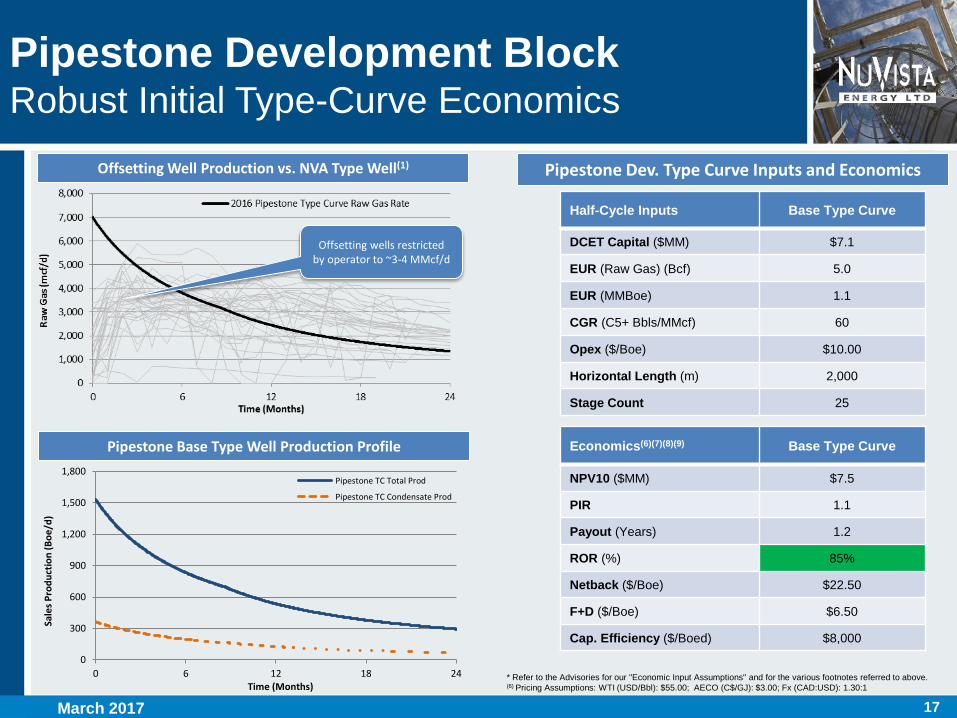
Pipestone Development Block Robust Initial Type-Curve Economics
Offsetting Well Production vs. NVA Type Well(1)
Pipestone Base Type Well Production Profile
Pipestone Dev. Type Curve Inputs and Economics
Half-Cycle Inputs Base Type Curve
DCET Capital ($MM) $7.1
EUR (Raw Gas) (Bcf) 5.0
EUR (MMBoe) 1.1
CGR (C5+ Bbls/MMcf) 60
Opex ($/Boe) $10.00
Horizontal Length (m) 2,000
Stage Count 25
Economics(6)(7)(8)(9) Base Type Curve
NPV10 ($MM) $7.5
PIR 1.1
Payout (Years) 1.2
ROR (%) 85%
Netback ($/Boe) $22.50
F+D ($/Boe) $6.50
Cap. Efficiency ($/Boed) $8,000 0
300
600
900
1,200
1,500
1,800
0 6 12 18 24
Sale
s Pro
duct
ion
(Boe
/d)
Time (Months)
Pipestone TC Total Prod
Pipestone TC Condensate Prod
Offsetting wells restricted by operator to ~3-4 MMcf/d
* Refer to the Advisories for our "Economic Input Assumptions" and for the various footnotes referred to above. (6) Pricing Assumptions: WTI (USD/Bbl): $55.00; AECO (C$/GJ): $3.00; Fx (CAD:USD): 1.30:1
March 2017

18
$0
$100
$200
$300
$400
2012 2013 2014 2015 2016
Non-MTY MTY
0
10
20
30
40
2012 2013 2014 2015 2016
Non-MTY MTY
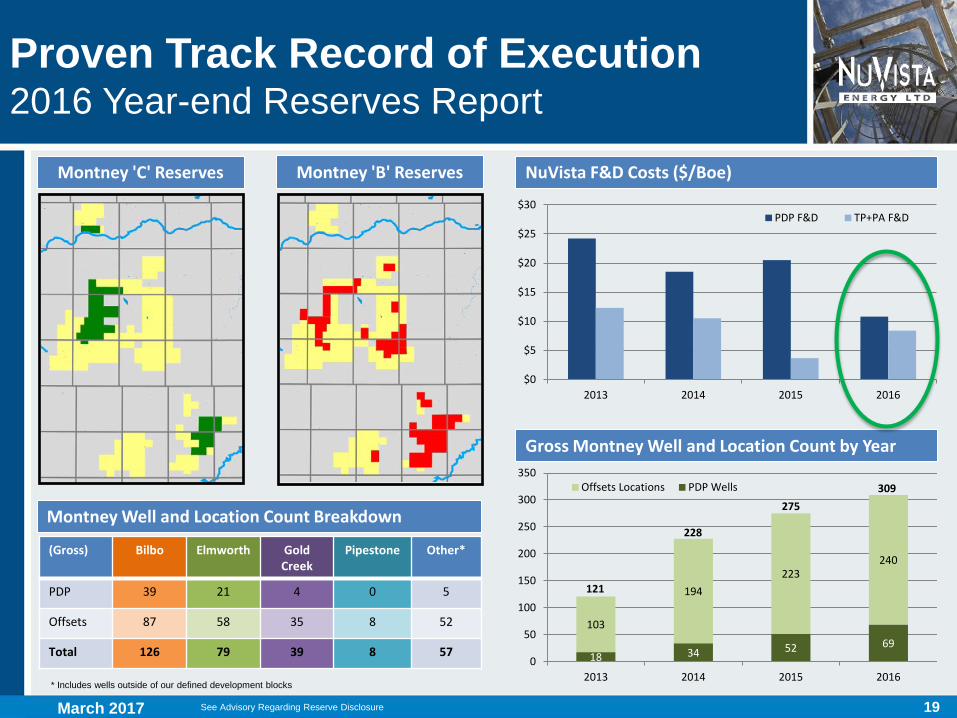
Proven Track Record of Execution 2016 Year-end Reserves Report
• Montney now comprises 99% of NuVista's reserves
• PDP F&D at 5-year low ($10.80/Boe) driven by positive technical revisions and continued focus on Montney development drilling
• PDP reserves value (NPV10) at recent high despite low commodity price forecasts
• Condensate now 25% of NuVista reserves (up from 19% last year)
• Pipestone Probable locations booked
• Total Montney PDP Wells increased to 69 – Total Proved + Probable well count (incl. PDP) now 309
NuVista PDP Reserves (MMBoe) NuVista PDP NPV10 ($MM)
See Advisory Regarding Reserve Disclosure
2016 Year-end Reserve Highlights
March 2017
19
Proven Track Record of Execution 2016 Year-end Reserves Report
Gross Montney Well and Location Count by Year
Montney 'C' Reserves NuVista F&D Costs ($/Boe) Montney 'B' Reserves
March 2017 See Advisory Regarding Reserve Disclosure
$0
$5
$10
$15
$20
$25
$30
2013 2014 2015 2016
PDP F&D TP+PA F&D
18 34 52 69 103
194 223
240
0
50
100
150
200
250
300
350
2013 2014 2015 2016
Offsets Locations PDP Wells
121
228
275 309
(Gross) Bilbo Elmworth Gold Creek
Pipestone Other*
PDP 39 21 4 0 5
Offsets 87 58 35 8 52
Total 126 79 39 8 57
* Includes wells outside of our defined development blocks
Montney Well and Location Count Breakdown
20
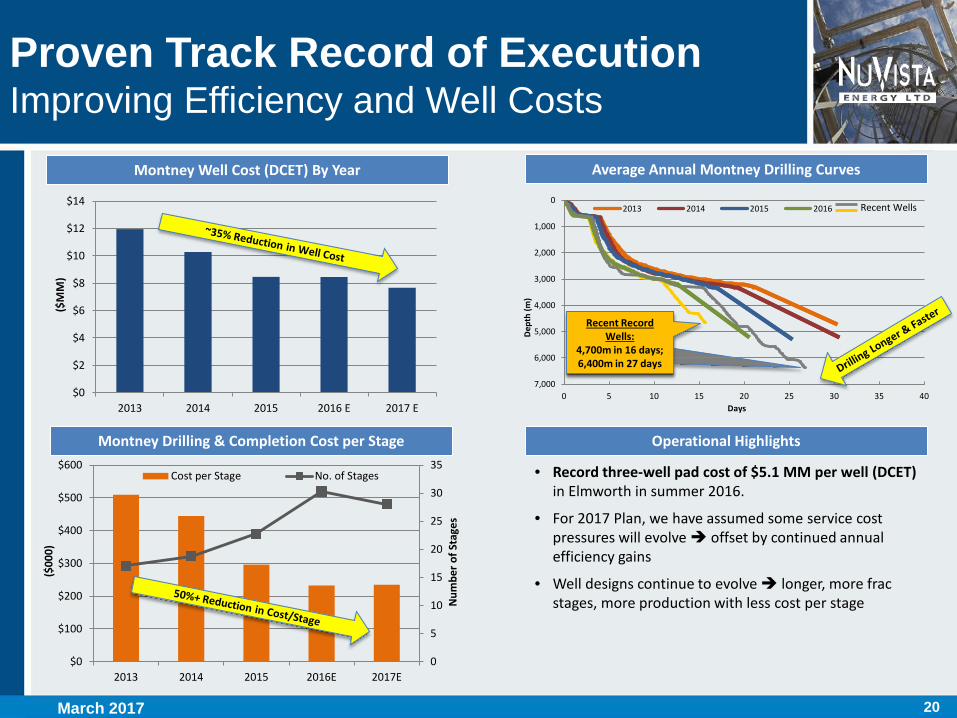
Average Annual Montney Drilling Curves Montney Well Cost (DCET) By Year
Recent wells: 4,700m in 17 days; 5,500m in 21 days
Proven Track Record of Execution Improving Efficiency and Well Costs
• Record three-well pad cost of $5.1 MM per well (DCET) in Elmworth in summer 2016.
• For 2017 Plan, we have assumed some service cost pressures will evolve offset by continued annual efficiency gains
• Well designs continue to evolve longer, more frac stages, more production with less cost per stage
0
1,000
2,000
3,000
4,000
5,000
6,000
7,0000 5 10 15 20 25 30 35 40
Dep
th (m
)
Days
2013 2014 2015 2016
Montney Drilling & Completion Cost per Stage Operational Highlights
Recent Wells
Recent Record Wells:
4,700m in 16 days; 6,400m in 27 days
$0
$2
$4
$6
$8
$10
$12
$14
2013 2014 2015 2016 E 2017 E
($M
M)
0
5
10
15
20
25
30
35
$0
$100
$200
$300
$400
$500
$600
2013 2014 2015 2016E 2017E
Num
ber o
f Sta
ges
($00
0)
Cost per Stage No. of Stages
March 2017

21
Proven Track Record of Execution ERH and Hi-Fi Completions
04-05 2,500m Hz 23 Stages
16-10 2,400m Hz 23 Stages
09-24 3,100m Hz 37 Stages 01-34
2,700m Hz 32 Stages
16-27 2,600m Hz 29 Stages
NVA Extended Reach Montney Horizontals Bilbo IP180 vs. Original Type Curve
05-02 2,400m Hz 22 Stages
Bilbo ERH Production vs. Original Type Curve(1)
0
100
200
300
400
500
600
0 1 2 3 4 5 6 7 8 9 10 11 12
Cum
ulat
ive
Prod
uctio
n (m
boe)
Time (months)
Type Curve (4.4 bcf, 75 bbl/mmcf) Average
Approx. 2x Yr 1 Prod
(1) NuVista's type curve based on Management's best estimates
2 Wells 2,300m+ 50 stages per well On-stream March
3 Wells 2,200m+ avg. 35 stages per well On-stream March
0
200
400
600
800
1,000
1,200
1,400
1,600
1,800
2,000
0 500 1,000 1,500 2,000 2,500 3,000 3,500
Tota
l Sal
es IP
180
(boe
/d)
Horizontal Length (m)
Bilbo TC Encouraging ERH Results
March 2017
22
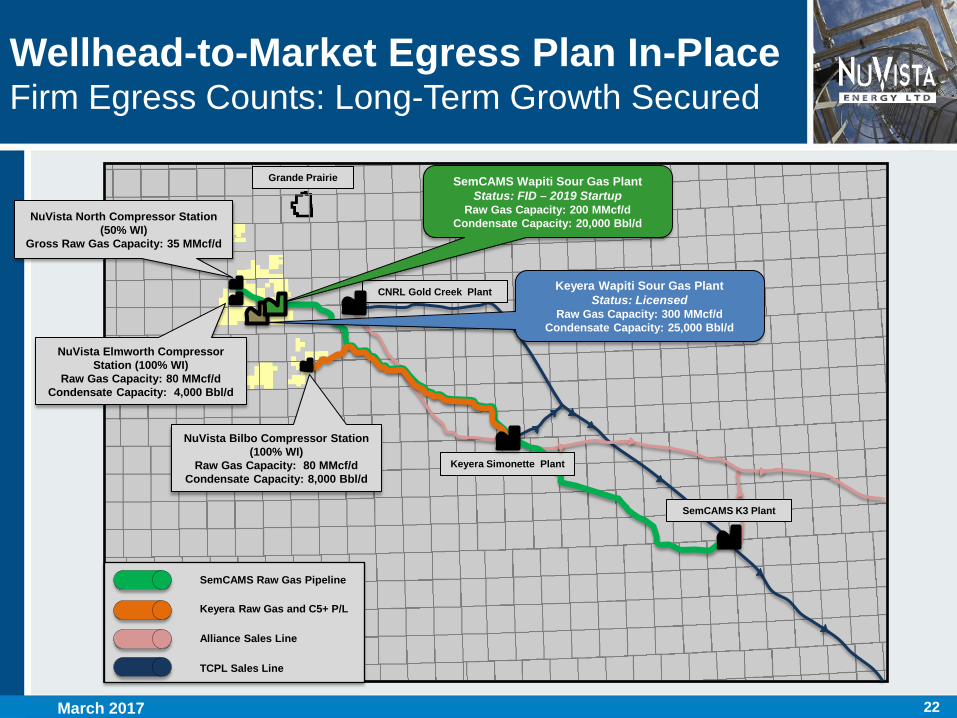
Wellhead-to-Market Egress Plan In-Place Firm Egress Counts: Long-Term Growth Secured
CNRL Gold Creek Plant
Keyera Simonette Plant
SemCAMS K3 Plant
SemCAMS Raw Gas Pipeline
Keyera Raw Gas and C5+ P/L
Alliance Sales Line
TCPL Sales Line
Grande Prairie SemCAMS Wapiti Sour Gas Plant Status: FID – 2019 Startup
Raw Gas Capacity: 200 MMcf/d Condensate Capacity: 20,000 Bbl/d
Keyera Wapiti Sour Gas Plant Status: Licensed
Raw Gas Capacity: 300 MMcf/d Condensate Capacity: 25,000 Bbl/d
NuVista North Compressor Station (50% WI)
Gross Raw Gas Capacity: 35 MMcf/d
NuVista Elmworth Compressor Station (100% WI)
Raw Gas Capacity: 80 MMcf/d Condensate Capacity: 4,000 Bbl/d
NuVista Bilbo Compressor Station (100% WI)
Raw Gas Capacity: 80 MMcf/d Condensate Capacity: 8,000 Bbl/d
March 2017

23
0
10,000
20,000
30,000
40,000
50,000
60,000
0
50
100
150
200
250
300
2014 2015 2016 2017 2018 2019 2020 2021
Mon
tney
Cap
acity
(Boe
/d)
Mon
tney
Raw
Gas
Cap
acity
(MM
cf/d
)
Min TOP Commitment
Wellhead-to-Market Egress Plan In-Place Wapiti Montney Processing Capacity…Material Running Room
TOP = NuVista Minimum take-or-pay volume commitment
Elmworth
Bilbo
Gold Creek
Pipestone
60,000+ Boe/d Montney Processing Capacity Secured
March 2017
24 March 2017
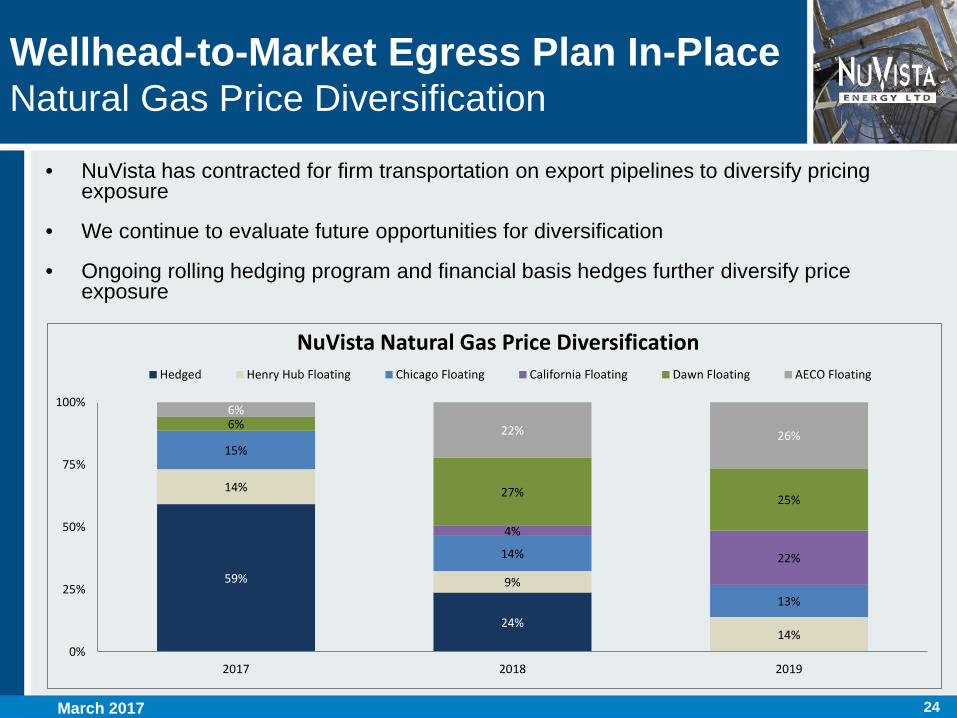
• NuVista has contracted for firm transportation on export pipelines to diversify pricing exposure
• We continue to evaluate future opportunities for diversification
• Ongoing rolling hedging program and financial basis hedges further diversify price exposure
59%
24%
14%
9%
14%
15%
14%
13%
4%
22%
6%
27% 25%
6% 22% 26%
0%
25%
50%
75%
100%
2017 2018 2019
NuVista Natural Gas Price Diversification Hedged Henry Hub Floating Chicago Floating California Floating Dawn Floating AECO Floating
Wellhead-to-Market Egress Plan In-Place Natural Gas Price Diversification
25
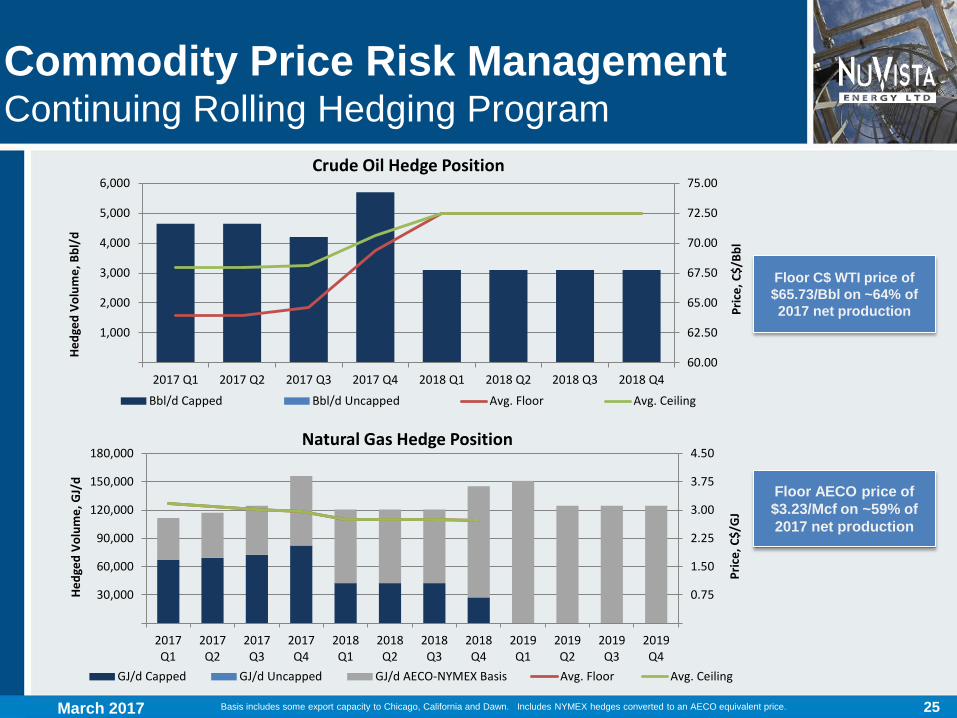
Commodity Price Risk Management Continuing Rolling Hedging Program
March 2017
60.00
62.50
65.00
67.50
70.00
72.50
75.00
1,000
2,000
3,000
4,000
5,000
6,000
2017 Q1 2017 Q2 2017 Q3 2017 Q4 2018 Q1 2018 Q2 2018 Q3 2018 Q4
Pric
e, C
$/Bb
l
Hedg
ed V
olum
e, B
bl/d
Crude Oil Hedge Position
Bbl/d Capped Bbl/d Uncapped Avg. Floor Avg. Ceiling
Floor C$ WTI price of $65.73/Bbl on ~64% of 2017 net production
Floor AECO price of $3.23/Mcf on ~59% of 2017 net production
0.75
1.50
2.25
3.00
3.75
4.50
30,000
60,000
90,000
120,000
150,000
180,000
2017Q1
2017Q2
2017Q3
2017Q4
2018Q1
2018Q2
2018Q3
2018Q4
2019Q1
2019Q2
2019Q3
2019Q4
Pric
e, C
$/G
J
Hedg
ed V
olum
e, G
J/d
Natural Gas Hedge Position
GJ/d Capped GJ/d Uncapped GJ/d AECO-NYMEX Basis Avg. Floor Avg. Ceiling
Basis includes some export capacity to Chicago, California and Dawn. Includes NYMEX hedges converted to an AECO equivalent price.
26
72% 72% 76% 79% 81% 83%
96%
23,215 21,448 21,622
23,355 25,484 23,451 24,898 24,716
-
5,000
10,000
15,000
20,000
25,000
30,000
Q1 '15 Q2 '15 Q3 '15 Q4 '15 Q1 '16 Q2 '16 Q3 '16 Q4 '16
Wapiti Montney Other Properties
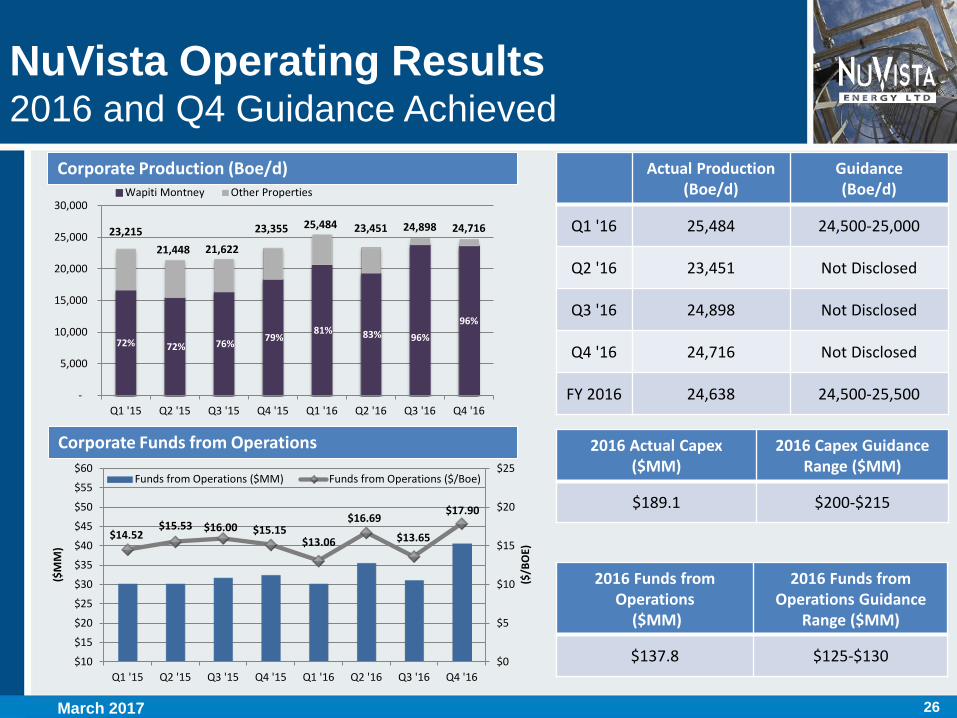
NuVista Operating Results 2016 and Q4 Guidance Achieved
Corporate Production (Boe/d)
Corporate Funds from Operations
Actual Production (Boe/d)
Guidance (Boe/d)
Q1 '16 25,484 24,500-25,000
Q2 '16 23,451 Not Disclosed
Q3 '16 24,898 Not Disclosed
Q4 '16 24,716 Not Disclosed
FY 2016 24,638 24,500-25,500
$14.52 $15.53 $16.00 $15.15
$13.06
$16.69
$13.65
$17.90
$0
$5
$10
$15
$20
$25
$10
$15
$20
$25
$30
$35
$40
$45
$50
$55
$60
Q1 '15 Q2 '15 Q3 '15 Q4 '15 Q1 '16 Q2 '16 Q3 '16 Q4 '16
($/B
OE)
($M
M)
Funds from Operations ($MM) Funds from Operations ($/Boe)
2016 Actual Capex ($MM)
2016 Capex Guidance Range ($MM)
$189.1 $200-$215
96%
March 2017
2016 Funds from Operations
($MM)
2016 Funds from Operations Guidance
Range ($MM)
$137.8 $125-$130

27
Pure-Play Montney Company – In The Right Neighborhood Balance Sheet Strength – Funded Growth Plan Through 2018+ Clear Line-of-Sight to 60,000 Boe/d Inventory Underpinned by Four Established Development Blocks Wellhead-to-Market Egress Plan In-Place + Rolling Hedge Program 30%+ Condensate Production – Torque to Oil Price Proven Track Record of Execution
NuVista Looking Forward Flexibility and Strength …Growth in a Volatile Environment
We have the Assets We have the Will We have the Team We have the Strategy… To Deliver
March 2017

28
Advisory Regarding Oil and Gas Information
ADVISORY REGARDING OIL AND GAS INFORMATION Throughout this presentation the terms Boe (barrels of oil equivalent), MBoe (thousands of barrels of oil equivalent), MMBOE (millions of barrels of oil equivalent), Bcfe (billions of cubic feet of gas equivalent) and Tcfe (trillion of cubic feet of gas equivalent). Such terms may be misleading, particularly if used in isolation. The conversion ratio of six thousand cubic feet per barrel (6 Mcf: 1 Bbl) of natural gas to barrels of oil equivalent and the conversion ratio of 1 barrel per six thousand cubic feet (1 Bbl: 6 Mcf) of barrels of oil to natural gas equivalent is based on an energy equivalency conversion method primarily applicable at the burner tip and does not represent a value equivalency at the wellhead. Given that the value ratio based on the current price of crude oil as compared to natural gas is significantly different from the energy equivalency of 6:1, utilizing a conversion on a 6:1 basis may be misleading as an indication of value. Any references in this presentation to initial production rates are useful in confirming the presence of hydrocarbons, however, such rates are not determinative of the rates at which such wells will continue production and decline thereafter. While encouraging, readers are cautioned not to place reliance on such rates in calculating the aggregate production for NuVista. NuVista has presented certain typecurves and well economics for the Bilbo, Elmworth, Pipestone and Gold Creek development blocks. For each of the Bilbo and Elmworth areas the type curves presented are based on NuVista's historical production in the Bilbo and Elmworth development blocks, in addition to production history from analogous Montney developments located in close proximity to the Wapiti area. For each of the Gold Creek and Pipestone development blocks the type curves presented are based primarily on drilling results from analogous Montney developments located in close proximity to such areas as such development blocks are still in the early stages of development (NuVista has not yet drilled a well in the Pipestone development block). Such type curves and well economics are useful in understanding management's assumptions of well performance in making investment decisions in relation to development drilling in the Montney area and for determining the success of the performance of development wells; however, such type curves and well economics are not necessarily determinative of the production rates and performance of existing and future wells and such type curves do not reflect the type curves used by our independent qualified reserves evaluator in estimating our reserves volumes. The type curves used by GLJ for NuVista's most recent independent reserves evaluation as of December 31, 2015 for the Bilbo and Elmworth development blocks had a lower estimate of estimated ultimate recovery than the type curves presented herein. Due to the early stages of development of the Pipestone and Gold Creek development blocks no reserves were attributed to such development blocks as of December 31, 2015. The type curves presented fall into several categories: (i) Base (or initial); (ii) Historical Average; (iii) Optimized, (iv) ERH; (v) Hi-Fi; and (vi) ERH +Hi-Fi; the expectations for each type curve differ as a result of varying horizontal well length, stage count and stage spacing. The Base type curve represents the average type curve expected. Historical Average is the average type curve achieved from the wells previously drilled by NuVista in the area. The Optimized type curve represents the best potential type curve NuVista expects is achievable if NuVista fully optimizes its drilling operations in such development blocks. The ERH type curves represents NuVista's expected type curve from drilling extended reach horizontal wells. The Hi-Fi type curves represents NuVista's expected type curve from utilizing high fracture intensity techniques on wells and ERH + Hi-Fi type curves are the expected type curves from combining extended reach horizontal with high-fracture intensity. NuVista is still in the early days of piloting extended reach horizontals and high intensity facture techniques and as such there is no certainty that such results will be achieved or that NuVista will be to optimize such drilling results to achieve the optimized type curves described. In this presentation, estimated ultimate recovery represents the estimated ultimate recovery associated with the type curves presented; however, there is no certainty that NuVista will ultimately recover such volumes from the wells it drills. In presenting such type curves, inputs and economics information, NuVista has used a number of oil and gas metrics which do not have standardized meanings and therefore may be calculated differently from the metrics presented by other oil and gas companies. Such metrics include "Development Well Capital" (or "DCET"), "raw EUR", "NPV10", "PIR", "payout", "ROR", "netback", "F&D", "capital efficiency", "IRR", "recycle ratio" and "reserves life index". Development well capital includes all capital spent to drill, complete, equip and tie-in a well. Raw EUR represents the estimated ultimate recovery of resources associated with the type curves presented. NPV 10 represents the anticipated net present value of the future net revenue discounted at a rate of 10% associated with the type curves presented. PIR (Profit to Investment Ratio) is the ratio of the NPV 10 relative to the development well capital. Payout means the anticipated years of production from a well required to fully pay for the development well capital of such well. ROR means the rate of return of a well or the discount rate required to arrive at a NPV equal to zero. Netback equals total revenues on a BOE basis (excluding realized commodity derivative gains/losses) less royalties, transportation and operating costs. F&D is the anticipated full exploration and development costs associated with each barrel of oil equivalent expected to be recovered from a well based on the type curves and economics presented. Historical F&D is calculated based on exploration and development capital spent in a period plus the change in future development capital associated with the Company's reserves divided by the reserves additions. Capital efficiency is a measure of expected development well capital divided by average first year production results (IP365) from such well based on the type curve presented. Recycle ratio is a measure of the netback achieved on a barrel of oil equivalent divided by the associated F&D costs for such barrel of oil equivalent. Reserves life is a measure of the volume of the Company's reserves divided by the annual average production.
March 2017

29
Advisory Regarding Oil and Gas Information
ADVISORY REGARDING OIL AND GAS INFORMATION This presentation discloses NuVista's drilling inventory associated with its Montney assets. Certain of the drilling locations represented in such inventory represent unbooked locations. While proved and probable locations (or "booked" locations) are derived from NuVista's most recent independent reserves as prepared by GLJ as of December 31, 2016 and account for drilling locations that have associated proved and/or probable reserves, unbooked locations do not have any associated proved or probable reserves as at December 31, 2016. Unbooked locations are management's internal estimates of drilling locations based on current estimates for achievable well length and inter-well spacing. There is no certainty that NuVista will drill all drilling locations and if drilled there is no certainty that such locations will result in additional production or reserves. The drilling locations on which we actually drill wells will ultimately depend upon the availability of capital, regulatory, oil and natural gas prices, costs, actual drilling results and other factors. Certain information in this presentation may constitute "analogous information" as defined in National Instrument 51-101 - Standards of Disclosure for Oil and Gas Activities with respect to the certain drilling results, number of wells drilled, or offset well production from other producers with operations that are in geographical proximity to or believed to be on-trend with NuVista's Montney assets. Management of NuVista believes the information may be relevant to help determine the expected results that NuVista may achieve within NuVista's lands and such information has been presented to help demonstrate the basis for NuVista's business plans and strategies with respect to its Montney assets. There is no certainty that the results of the analogous information or inferred thereby will be achieved by NuVista and such information should not be construed as an estimate of future production levels, reserves or the actual characteristics and quality of NuVista's Montney assets. It should not be assumed that the future net revenues (NPV10) included in this presentation represent the fair market value of the reserves. The estimates of reserves and future net revenue for individual properties may not reflect the same confidence level as estimates of reserves and future net revenue for all properties due to the effects of aggregation.
March 2017

30
Advisory Regarding Non-GAAP Measurements, Reserves Disclosure & Economic Assumptions
NON-GAAP MEASUREMENTS Within this presentation, references are made to terms commonly used in the oil and natural gas industry. Management uses cash flow from operations, net debt to annualized funds from operations and netback to analyze operating performance and leverage. These terms as presented, do not have any standardized meaning prescribed by GAAP and therefore it may not be comparable with the calculation of similar measures for other entities. All references to funds from operations throughout this presentation are based on cash flow from operating activities before changes in non-cash working capital, environmental remediation expenses, note receivable allowance (recovery) and asset retirement expenditures. Netbacks equals total revenues excluding realized commodity derivative gains/losses less royalties, transportation and operating costs. Debt (net debt) is calculated as long-term debt plus senior unscured note plus current assets less current liabilities and excludes the current portions of the commodity derivative asset or liability. For a reconciliation of these non-GAAP measures with the most directly comparable GAPP measure, please see NuVista's management's discussion and analysis for the year ended December 31, 2016. RESERVES DISCLOSURE The reserves estimates prepared herein have been evaluated by an independent qualified reserves evaluator in accordance with NI 51-101 and the COGE Handbook and is effective December 31, 2016 and is based on an independent evaluation by GLJ using January 1, 2017 forecast pricing. The reserves have been categorized accordance with the reserves and resource definitions as set out in the COGE Handbook, which are set out below: Reserves are estimated remaining quantities of petroleum anticipated to be recoverable from known accumulations, as of a given date, based on the analysis of drilling, geological, geophysical, and engineering data; the use of established technology; and specified economic conditions, which are generally accepted as being reasonable. Reserves are further classified according to the level of certainty associated with the estimates and may be sub-classified based on development and production status. Proved Reserves are those quantities of petroleum, which, by analysis of geoscience and engineering data, can be estimated with reasonable certainty to be economically producible from a given date forward, from known reservoirs and under existing economic conditions, operating methods and government regulations. Probable Reserves are those additional quantities of petroleum that are less certain to be recovered than Proved Reserves, but which, together with Proved Reserves, are as likely as not to be recovered. ECONOMIC INPUT ASSUMPTIONS (1) NuVista's type curve based on Management's best estimates (2) Production groupings based off spud dates (3) Economics based on average historical well performance with current well cost estimate (4) NGL yield represents the equivalent constant yield for the full life of the well (5) CGR yield represents the equivalent constant yield for the full life of the well (6) Pricing Assumptions: WTI (USD/Bbl): $55.00; AECO (C$/GJ): $3.00; Fx (CAD:USD): 1.30:1 (7) Price case flat on a real basis; costs inflated at 2% per annum (8) NGL's as % of WTI: C3 35%, C4 65%; C5+ = WTI +$2 (9) Unit transportation costs: sales gas $0.20/Mcf, recovered liquids: $6/Bbl
March 2017
31
APPENDIX
March 2017

32
Condensate Pricing Strong Demand and Premium Price for the Long Term
• Condensate is used in Alberta as a diluent to ship heavy oil on pipelines
• Condensate in Alberta is typically priced at a premium to crude oil
• US condensate supply is increasing
• But condensate export restrictions are easing
• Condensate must be transported to Alberta – "we're on the right end of the pipe"
• Premium for condensate will always reflect the cost of transportation to deliver to Alberta while demand outstrips local Alberta production … and it still does
Western Canada Condensate Supply and Demand
Western Canadian Condensate Pricing
March 2017

33
Lower Montney Activity NuVista Data Collection In Progress
Elmworth
Wapiti
South Wapiti
Gold Creek
Bilbo
Kakwa
Karr
Pipestone
SCL 1-33-67-5W6 CTD: 0.1 bcf, Current CGR: 100
7Gen 13-24-65-5W6 CTD: 0.2 bcf, 43 mbbl C5+ (SI)
7Gen 12-32-64-5W6 CTD: 0.3 bcf, Current CGR: 254
7Gen 02/9-22-63-3W6 RR: Feb 2015 (standing)
NVA Lands Montney Wells LWR Montney A Wells LWR Montney Cores
• Multiple pilot wells in progress by industry – Early Production Data Emerging
• NuVista has good distribution of vertical wells and cores
• NuVista vertical completion: over pressured, condensate-rich
• NuVista pilot deferred until sustained commodity price recovery
NVA 15-13-68-7W6 Vertical Over-pressured – 133 Bbls/MMcf condy
ACL 1-7-67-7W6 CTD: 0.9 bcf, Test CGR: 54
SCL 02/9-27-66-7W6 CTD: 0.5 bcf, IP30 CGR: 85
T70
T68
T66
R9W6 R7W6 R5W6 R3W6
SCL 15-1-69-6W6 Tested: 1.9 MMcf/d and 174 bpd C5+
March 2017