corporate presentation - banorte
TRANSCRIPT

1DB
NIMRev
C/INI
Div
ROETI L D
DepLoan
ICAPBAP Guid
MktEco
Hist App
ESG
1Q21CORPORATE
Presentation

2DB
NIMRev
C/INI
Div
ROETI L D
DepLoan
ICAPBAP Guid
MktEco
Hist App
ESG
About Banorte 3
Results
NIM 9
Revenue composition 11
Fees 12
Cost to Income 14
Net Income 16
EPS 17
Dividend 18
ROE / ROA 19
Digital Bank 20
Deposit & Loans 26
Loans / Deposits 27
Deposits growth 28
Loan growth 29
Government Loan Book 32
Asset Quality - NPL 33
CAR 36
BAP (Insurance, Pension & Afore) 37
Insurance graphs & segments 39
Guidance 41
Market Presence 42
GFNorte 49
ESG 51
Appendix 56
Economic and Financial Perspectives 68
XNOR
GFNORTE GBOOY
Best Bank 2019 México
Table of Content

3DB
NIMRev
C/INI
Div
ROETI L D
DepLoan
ICAPBAP Guid
MktEco
Hist App
ESGDBNIM
Rev
C/INI
Div
ROETI L D
DepLoan
ICAPBAP Guid
MktEco
Hist App
ESG
About
Banorte

4DB
NIMRev
C/INI
Div
ROETI L D
DepLoan
ICAPBAP Guid
MktEco
Hist App
ESG
GFNORTE – A Leading and Profitable Financial Franchise in Mexico
GFNorte is top 3 in trading at BMV, and has the highest Relative
Weighting on S&P/BMV IPC Index, rated OTCQX Best 50 Global
Market capitalization of US 16 billion, float of almost 86%
and more than 4,000 investors, including large global institutional funds.
Investment grade ratings by S&P, Fitch, Moody's and HR Ratings.
Sound
Fundamentals
Increasing profitability,
solid asset quality,
high liquidity and
strong capitalization
ratios.
Adequate
business mixStrong retail, wholesale
and premium banking
platforms, as well as
leading insurance and
pension fund
management units,
serving more than 21
million clients.
Solid corporate
governanceIndependent Board
Members represent
64% of total board
composition and best
practices in minority
shareholder right
protection.
1
2
3 DigitalPrepared for
the Future
…
4
One of the
most public
companies
in Mexico

5DB
NIMRev
C/INI
Div
ROETI L D
DepLoan
ICAPBAP Guid
MktEco
Hist App
ESG
From Regional Bank to Second Largest National Financial Group
20|20 Plan
Establishment
1899 1982-1992 1995 2000 2005 2010 2015
Privatization
INB IXE
Afin Afore Bancomer
Banorte Generali 50%
BancentroBanpaísBancrecer
Afore XXIIMSS 50%
Banorte-General i100%
…
Inorganic Growth
Regional Bank
Business Diversification
2020
Client
Segmentation
IT : central DB,
multichannel
Profitability
Nationalization
G.F. Interacciones
Rappi J.V.

6DB
NIMRev
C/INI
Div
ROETI L D
DepLoan
ICAPBAP Guid
MktEco
Hist App
ESG
Strategy – Client centric & Digital Evolution
PRODUCTS &
SOLUTIONS
Deposits & Loans
Insurances
Pension
Annuities
Wealth Mngt.
…
DISTRIBUTION
CHANNELS
Mobile
Internet
ATM
Contact Center
Branches
…
PROCESSES
Account opening - Credit Analysis
Next Best Offer – Next Best Action
Client Segmentation
▪ 12 million ex-Afore clients
9 million Afore clients
▪ Structured Info & Learning
(Central DB & Watson)
▪ Behavior understanding
Analytics
Cost
New customer
behavior
Digital
Bank
> 10M
Rappi clients
Rappi JV Consumer focus

7DB
NIMRev
C/INI
Div
ROETI L D
DepLoan
ICAPBAP Guid
MktEco
Hist App
ESG
Diversified Business Mix
* Includes: Almacenadora Banorte; Ixe Servicios; Fundación Banorte A.B.P.
** Solida merges Arrendadora y Factor Banorte on July 1st, 2020
Casa de Bolsa
Banorte
Banco Mercantil del Norte
Pensiones Banorte
Seguros Banorte
Banorte Futuro
Afore XXI Banorte
Operadora de Fondos
Banorte
(Fondos de Inversión)
Other Subsidiaries*
Arrendadora y Factor
Banorte**
Banorte Ahorro y Previsión
98.2618% 99.9999% 99.9999% 99.9999% 99.9058%
50.0%
99.9999% 99.9999%
98.22%
Banorte Financial Services
(Uniteller)100.0%
100%
JV withRAPPI
Digital Bank
50% 100%
Looking for fully licensed banks
In progress…

8DB
NIMRev
C/INI
Div
ROETI L D
DepLoan
ICAPBAP Guid
MktEco
Hist App
ESG
Business Mix - Diversified Net Income and Balance
Net Income Mix
1Q21
$30.5 b
** Afore ROTE 43.2%
Bank69%
Broker Dealer & Mutual Funds
5%
Insurance 10%
Annuities 6%
Afore5%
Other Finance Companies
3%
Holding3%Million pesos 1Q21 q/q y/y ROE 1Q21
Bank 5,870 53% (3%) 17.6%Broker Dealer &
Mutual Funds420 18% 34%
26.4%
Insurance 858 82% (50%) 30.9%
Annuities 496 (1%) 75% 29.6%
Afore 396 (17%) 22% 13.3%
BAP (Holding) 8 (10%) (41%)
Other Finance Co. 250 185% 277%
Holding 247 6% (27%)
GFNorte 8,544 43% (6%) 15.2%

9DB
NIMRev
C/INI
Div
ROETI L D
DepLoan
ICAPBAP Guid
MktEco
Hist App
ESG
NIM
Net Interest Margin Moving in the Right Direction
4.1% 4.1%
4.4%
4.7%4.5%
4.9%
5.5% 5.6% 5.6%
5.3%
5.9%
5.1%
4.8%
4.9%
5.6% 5.3%
5.0%
4.8%
4.0%
4.5%
5.0%
5.5%
6.0%
2011 2012 2013 2014 2015 2016 2017 2018 2019 2020 1Q20 2Q20 3Q20 4Q20 1Q21
NIM NIM ex Insurance & Annuities
NIM
(Post-Provision)
3.3% 3.4% 3.4% 3.5% 3.5%3.7%
4.3% 4.4%4.5%
3.9%
4.8%
3.1%
4.3%
3.3%
4.1%
4.3%3.9%
4.4% 4.4%
3.9%
2.5%
3.0%
3.5%
4.0%
4.5%
5.0%
2011 2012 2013 2014 2015 2016 2017 2018 2019 2020 1Q20 2Q20 3Q20 4Q20 1Q21
4.9bn on
advanced
provisions
*Recurring
2.4bn on
advanced
provisions

10DB
NIMRev
C/INI
Div
ROETI L D
DepLoan
ICAPBAP Guid
MktEco
Hist App
ESG
2,861
3,099
3,315
3,883
2,500
3,000
3,500
4,000
1Q 2Q 3Q 4Q 1Q 2Q 3Q 4Q 1Q 2Q 3Q 4Q 1Q
2018 2019 2020 2021
Core Banking Fees
2,967
3,455 3,214
1,500
2,000
2,500
3,000
3,500
4,000
4,500
1Q 2Q 3Q 4Q 1Q 2Q 3Q 4Q 1Q 2Q 3Q 4Q 1Q
2018 2019 2020 2021
Net Fees
Fees on Services Affected But Recovering
Net Fees quarterly down on seasonality,
and COVID-19 affected over 12 months.
Fees charged (19%) q/q, +4% y/y,
Core banking fees (5%) q/q, +17% y/y.
Remote digital transactions lead growth,
+65% q/q in POS, +78% in mobile monetary.
Millions Millions
Mill
ion P
esos +17%
+65%
1Q - y/y+78%
1Q - y/y

11DB
NIMRev
C/INI
Div
ROETI L D
DepLoan
ICAPBAP Guid
MktEco
Hist App
ESG
Improving Efficiency
Cost to Income56.0% 54.0%
52.0%
48.5% 47.9%
44.9%42.8%
39.0% 39.1%41.4%
38.9% 38.8%
41.7%
46.6%
43.5%
35%
40%
45%
50%
55%
2011 2012 2013 2014 2015 2016 2017 2018* 2019* 2020 1Q20 2Q20 3Q20 4Q20 1Q21
+13% +5%+10%
+13%
+5% +4% +4% +7%+11%
+19%*
* Recurring
+8%
+9%*
Recurring
40.0% 39.7%
+7%
-0%
12DB
NIMRev
C/INI
Div
ROETI L D
DepLoan
ICAPBAP Guid
MktEco
Hist App
ESG
9,118
6,518
8,906
5,966
8,544
9,867
7,692
5,000
5,500
6,000
6,500
7,000
7,500
8,000
8,500
9,000
9,500
10,000
10,500
1Q20 2Q20 3Q20 4Q20 1Q21
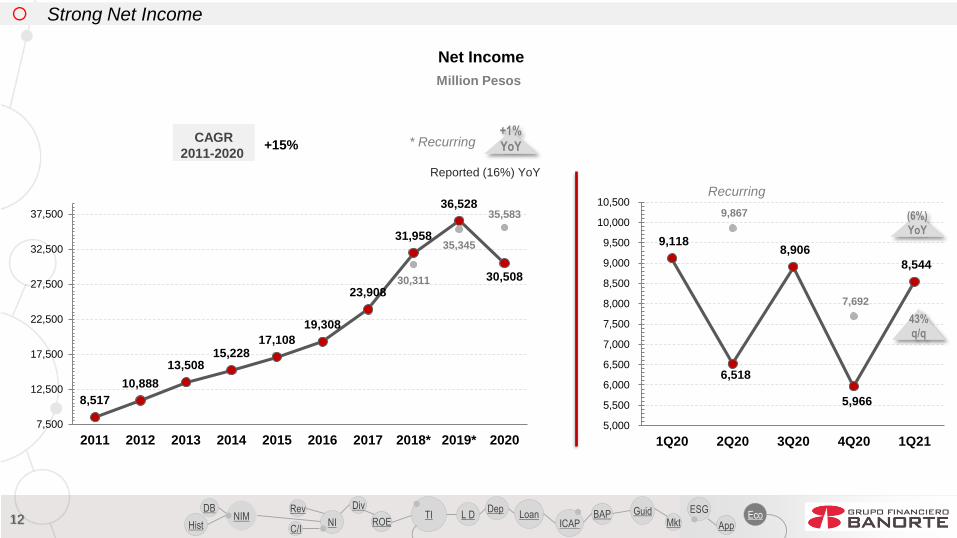
Strong Net Income
Net Income
8,517
10,888
13,50815,228
17,108
19,308
23,908
31,958
36,528
30,50830,311
35,345
35,583
7,500
12,500
17,500
22,500
27,500
32,500
37,500
2011 2012 2013 2014 2015 2016 2017 2018* 2019* 2020
Million Pesos
CAGR
2011-2020 +15%
(6%)
YoY
+1%
YoY* Recurring
Reported (16%) YoY
Recurring
43%
q/q

13DB
NIMRev
C/INI
Div
ROETI L D
DepLoan
ICAPBAP Guid
MktEco
Hist App
ESG
Pre-pandemic - Constant Positive Growth in Profitability
1.10%
1.30%1.40% 1.46% 1.47%
1.60%
1.86%
2.18%2.30%
1.76%
2.21%
1.49%
1.99%
1.33%
1.90%
2.07%2.22%
2.05%
1.72%
1.0%
1.5%
2.0%
2.5%
2011 2012 2013 2014 2015 2016 2017 2018* 2019* 2020* 1Q20 2Q20 3Q20 4Q20 4Q21
ROA
ROE
14.1% 14.3% 14.2%13.2% 13.3%
14.1%
17.0%
20.3% 20.1%
14.8%
18.8%
13.0%
16.9%
10.9%
15.2%19.3% 19.6%
17.1%19.6%
13.9%
10%
13%
16%
19%
22%
2011 2012 2013 2014 2015 2016 2017 2018* 2019* 2020* 1Q20 2Q20 3Q20 4Q20 1Q21
*Recurring
*Recurring
4.9bn on
advanced
provisions
2.4bn on
advanced
provisions
*Recurring
*Recurring

14DB
NIMRev
C/INI
Div
ROETI L D
DepLoan
ICAPBAP Guid
MktEco
Hist App
ESGDBNIM
Rev
C/INI
Div
ROETI L D
DepLoan
ICAPBAP Guid
MktEco
Hist App
ESG
Digital
Transformation

15DB
NIMRev
C/INI
Div
ROETI L D
DepLoan
ICAPBAP Guid
MktEco
Hist App
ESG
Digital Transformation Gaining Share
105.0
223.9
343.3
0
50
100
150
200
250
300
350
400
1Q2017
3Q 1Q2018
3Q 1Q2019
3Q 1Q2020
3Q 1Q2021
Transactions +53%y/y
20%
34%15%
1%
1%
26%
3.2%
Transactions (Tx)
Customers Using Digital (millions)
WEB
Mobile
ATM
Call Center
Correspondents
POS
Branches
*
Time Deposits
Mutual Funds
Credit Card
Insurance
Digital Deposit Account
Payroll loans
Mobile
as a
Point of Sale
1Q20 1Q21
24%
28%22%
2%
1%
19%
4.6%
3.5
4.3
4.7
5.2
1Q19 2Q 3Q 4Q 1Q20 2Q 3Q 4Q 1Q21

16DB
NIMRev
C/INI
Div
ROETI L D
DepLoan
ICAPBAP Guid
MktEco
Hist App
ESG
*
Mutual Funds
Credit Card / Additional
Digital Deposits
Payroll loans / Renewals
The increase in digital adoption is reflected in higher origination in the mobile channel
% Digital origination
2020 Jan - Feb ‘21
6.0% / 18.2% 6.2% / 25.6%
3.8% / 24.1% 8.1% / 35.7%
47.8% 63.0%
21.5% 34.8%
Mutual funds
investment already
outgrow branch
contracts

17DB
NIMRev
C/INI
Div
ROETI L D
DepLoan
ICAPBAP Guid
MktEco
Hist App
ESG
Leaders in the Business & Infrastructure for the New Payments Market
Beyond recovery on POS’s transactions pre
COVID-19 with emphasis on e-commerce
The best DIGITAL PLATFORM for aggregators
CoDi
Millions
+65%
1Q - y/y
Rappi JV – Credit Cards
and Credits to affiliates

18DB
NIMRev
C/INI
Div
ROETI L D
DepLoan
ICAPBAP Guid
MktEco
Hist App
ESG
Rappi JV evolution
Since the launch of the RappiCard on January 25th:
• +103,000 cards issued and 85,000 active.
In addition to this, +103,000 debit cards have also
been issued, associated with Rappi user accounts,
which have facilitated the entry and exit of resources
to the accounts.

19DB
NIMRev
C/INI
Div
ROETI L D
DepLoan
ICAPBAP Guid
MktEco
Hist App
ESGDBNIM
Rev
C/INI
Div
ROETI L D
DepLoan
ICAPBAP Guid
MktEco
Hist App
ESG
Loans &
Deposits
20DB
NIMRev
C/INI
Div
ROETI L D
DepLoan
ICAPBAP Guid
MktEco
Hist App
ESG
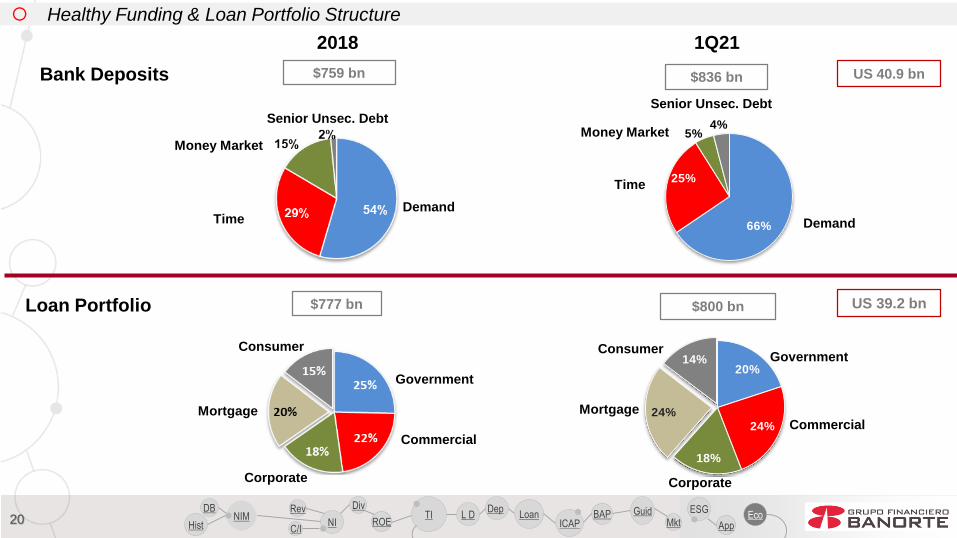
20%
24%
18%
24%
14%
66%
25%
5%4%
Healthy Funding & Loan Portfolio Structure
$836 bn
1Q21
$800 bn
Commercial
Consumer
Mortgage
Government
Corporate
US 40.9 bn
Demand
Money Market
Time
Senior Unsec. Debt
US 39.2 bn
2018
DemandTime
Money Market
Senior Unsec. Debt
Consumer
Commercial
Mortgage
Corporate
Government
Bank Deposits
Loan Portfolio
$759 bn
$777 bn

21DB
NIMRev
C/INI
Div
ROETI L D
DepLoan
ICAPBAP Guid
MktEco
Hist App
ESG
Demand72%
Time28%
116 124 129 136158 168
194223 229 217 227 224 220 217 214
190211
255300
351384 397 414
438
533
454482
509533 549
306336
384436
509551
590637
667
751681
706729 751 763
100
200
300
400
500
600
700
2011 2012 2013 2014 2015 2016 2017 2018 2019 2020 1Q20 2Q20 3Q20 4Q20 1Q21
Time Demand Core Deposits
Loyal Deposits Base
Demand62%
Time38%
MIX
2013 1Q21
Billion Pesos CAGR:
+10%
YoY
+12%
Deposits
YoY
+21%
YoY
(6%)
+12%
+7%

22DB
NIMRev
C/INI
Div
ROETI L D
DepLoan
ICAPBAP Guid
MktEco
Hist App
ESG
Continued Growth in Performing Loan Book, Special Focus on Consumer
US 39.2 bn
Billion Pesos 1Q20 4Q20 1Q21 QoQ YoY
Mortgage 173 188 191 2% 10%
Car Loans 27 28 28 0% 4%
Credit Cards 39 37 36 (3%) (8%)
Payroll 52 52 52 1% 1%
Consumer 291 304 307 1% 6%
Commercial 182 193 193 (0%) 6%
Corporate 145 143 140 (2%) (4%)
Government 162 162 160 (1%) (1%)
TOTAL 780 802 800 (0%) 3%
350 401 425
472 518
567 616
777 763
802 803
300
400
500
600
700
800
2011 2012 2013 2014 2015 2016 2017 2018 2019 2020 1Q21
Total Loan Portfolio
99118
140158
176203
241269
288304 307
50
100
150
200
250
300
2011 2012 2013 2014 2015 2016 2017 2018 2019 2020 1Q21
CAGR:
+13%
US 15.0 bn
CAGR:
+10%
Consumer Portfolio

23DB
NIMRev
C/INI
Div
ROETI L D
DepLoan
ICAPBAP Guid
MktEco
Hist App
ESG
1.9% 2.1%
3.1%2.9%
2.2%
1.8%2.0%
1.7% 1.7% 1.7%
1.2%0.8%
1.1%1.3%
0.5%
1.5%
2.5%
3.5%
2011 2012 2013 2014 2015 2016 2017 2018 2019 1Q20 2Q20 3Q20 4Q20 1Q21
Sound Asset Quality
NPL Ratio
1Q19 2Q19 3Q19 4Q19 1Q20 2Q20 3Q20 4Q20 1Q21
Credit Cards 5.9% 5.9% 6.0% 5.4% 5.8% 5.5% 3.1% 7.8% 7.2%
Payroll 3.0% 3.8% 3.4% 3.3% 2.7% 3.3% 1.7% 2.7% 2.9%
Car Loans 0.9% 1.0% 1.0% 1.0% 0.9% 1.2% 0.7% 0.6% 1.3%
Mortgage 1.0% 1.0% 1.1% 1.1% 1.2% 1.3% 1.0% 0.9% 1.1%
Commercial 2.1% 2.4% 2.5% 2.4% 2.3% 1.1% 0.9% 1.2% 1.7%
SME 5.9% 6.4% 6.5% 6.6% 7.0% 3.7% 1.9% 2.0% 3.4%
Commercial ex-SME 1.1% 1.3% 1.6% 1.3% 1.2% 0.6% 0.7% 1.0% 1.3%
Corporate 2.9% 3.0% 2.8% 1.8% 1.8% 0.3% 0.3% 0.1% 0.2%
Government 0.0% 0.0% 0.0% 0.0% 0.0% 0.1% 0.2% 0.0% 0.1%
Total GFNorte 1.7% 1.9% 1.9% 1.7% 1.7% 1.2% 0.8% 1.1% 1.3%
↓4.6 bn ↓0.8 bn
Anticipated Write-offs reducing NPL

24DB
NIMRev
C/INI
Div
ROETI L D
DepLoan
ICAPBAP Guid
MktEco
Hist App
ESG
2.2%
2.3%2.0%
2.8%
2.2%
4.2%
1.6%
3.0%
1.6%
1.8% 1.8% 1.8%1.0%
1.5%
2.0%
2.5%
3.0%
3.5%
4.0%
4.5%
2011 2012 2013 2014 2015 2016 2017 2018 2019 2020 1Q20 2Q20 3Q20 4Q20 1Q21
Current Prev. Criteria Recurring
143% 138%
105% 107%116%
139%129%
142% 138%
224%
140%
201%
265%
224%
185%
90%
120%
150%
180%
210%
240%
270%
2011 2012 2013 2014 2015 2016 2017 2018 2019 2020 1Q20 2Q20 3Q20 4Q20 1Q21
Sound Asset Quality
Coverage Ratio
Cost of Risk
* Cost of Risk: Provisions / Average Total loans (Performing + Past Due), On current criteria all the recoveries are register on Provisions (net)

25DB
NIMRev
C/INI
Div
ROETI L D
DepLoan
ICAPBAP Guid
MktEco
Hist App
ESG
Strong Capital Position
7.90%
9.40%
11.40%
Capital Adequacy Ratio
11.5%12.7% 12.4% 12.1% 11.9% 12.7% 12.7% 12.2%
13.3% 13.7% 13.9%15.0%
15.1% 15.3%14.6%
15.3%
17.2% 17.2%
18.6% 19.0%19.7%
21.1%20.2%
21.7%
2013 2014 2015 2016 2017 2018 2019 1Q20 2Q20 3Q20 4Q20 1Q21
*RWA= Risk Weighted Assets annual growth
RWA
Basel III
+17% +11% +8% +16% (2%) +19% +7% +9% +15% +17% +17% +6%
CET1
Minimum
Regulatory
Ratios
Total
Tier 1
20.8%
Tier 2
Dividends already
in GFNorte’s
balance sheet
9.70%
7.70%
6.20%
Temporary
waiver
26DB
NIMRev
C/INI
Div
ROETI L D
DepLoan
ICAPBAP Guid
MktEco
Hist App
ESG
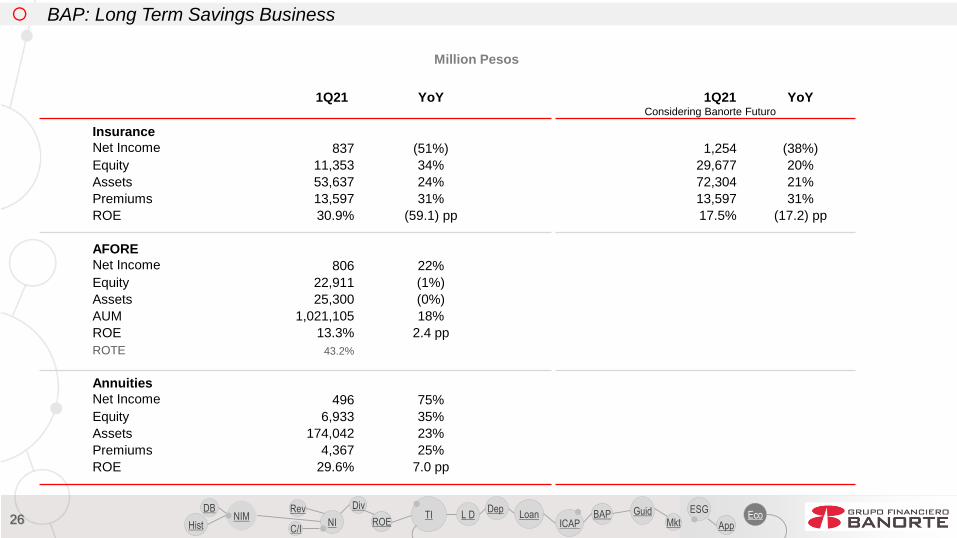
1Q21 YoY 1Q21 YoYConsidering Banorte Futuro
Insurance
Net Income 837 (51%) 1,254 (38%)
Equity 11,353 34% 29,677 20%
Assets 53,637 24% 72,304 21%
Premiums 13,597 31% 13,597 31%
ROE 30.9% (59.1) pp 17.5% (17.2) pp
AFORE
Net Income 806 22%
Equity 22,911 (1%)
Assets 25,300 (0%)
AUM 1,021,105 18%
ROE 13.3% 2.4 pp
ROTE 43.2%
Annuities
Net Income 496 75%
Equity 6,933 35%
Assets 174,042 23%
Premiums 4,367 25%
ROE 29.6% 7.0 pp
BAP: Long Term Savings Business
Million Pesos

27DB
NIMRev
C/INI
Div
ROETI L D
DepLoan
ICAPBAP Guid
MktEco
Hist App
ESG
2021 Guidance
Macro Estimates for 2021
GDP 3% - 4%
Inflation 4.0%
Reference Rate 4.00%
Guidance
Loan Growth 6% – 8%
NIM Contraction (15) – (30bps)
Expense Growth 3.5% – 4.2%
Efficiency 39.5% – 41.0%
Cost of Risk 2.1% – 2.3%
Tax Rate 26% – 27%
Net Income 33.5 – 35.0
ROE 15% – 16%
Bank ROE 18% - 19%

28DB
NIMRev
C/INI
Div
ROETI L D
DepLoan
ICAPBAP Guid
MktEco
Hist App
ESGDBNIM
Rev
C/INI
Div
ROETI L D
DepLoan
ICAPBAP Guid
MktEco
Hist App
ESG
Market
Presence

29DB
NIMRev
C/INI
Div
ROETI L D
DepLoan
ICAPBAP Guid
MktEco
Hist App
ESG
Loans
Feb 2021
Deposits
2°
Deposit & Loan Market Share
Source: CNBV.
3°
2°

30DB
NIMRev
C/INI
Div
ROETI L D
DepLoan
ICAPBAP Guid
MktEco
Hist App
ESG
Consumer C. Cards Mortgage Commercial Government Deposits
Feb-20 Feb-21 Feb-20 Feb-21 Feb-20 Feb-21 Feb-20 Feb-21 Feb-20 Feb-21 Feb-20 Feb-21
Banorte 12.1% 13.6% 9.9% 10.3% 19.2% 19.6% 10.3% 11.8% 29.9% 27.0% 12.1% 13.6%
BBVA 29.4% 29.9% 27.4% 29.6% 26.0% 26.0% 19.6% 19.4% 26.6% 28.4% 29.4% 29.9%
CitiBanamex 13.1% 11.3% 26.7% 24.8% 9.4% 7.8% 12.1% 9.8% 5.8% 6.6% 13.1% 11.3%
Santander 8.8% 10.1% 14.2% 14.1% 16.5% 17.2% 13.2% 12.2% 12.7% 13.2% 8.8% 10.1%
HSBC 6.6% 6.7% 5.7% 5.8% 7.2% 8.1% 7.9% 6.7% 5.9% 6.3% 6.6% 6.7%
ScotiaBank 5.2% 4.8% 2.8% 2.5% 15.2% 15.0% 7.5% 7.9% 2.4% 2.1% 5.2% 4.8%
Inbursa 4.1% 3.0% 4.1% 3.8% 0.6% 0.5% 0.0% 0.0% 5.8% 3.9% 4.1% 3.0%
Others 20.6% 20.5% 9.2% 9.2% 6.0% 5.9% 29.3% 32.1% 11.0% 12.5% 20.6% 20.5%
Market Position 2° 4° 2° 3° 2° 3°
Market Share by Segment
Source: CNBV.

31DB
NIMRev
C/INI
Div
ROETI L D
DepLoan
ICAPBAP Guid
MktEco
Hist App
ESG
13.1% 13.0%
14.9%
14.1%
15.1%
2016 2017 2018 2019 2020
Loan Book Market Share
10.4%
9.4%
11.0%
10.3%
11.8%
2016 2017 2018 2019 2020
Corporate & Commercial market share
17.2%
18.7%
19.5%19.2%
19.5%
2016 2017 2018 2019 2020
Mortgage market share
8.4%
9.3%9.5%
9.8%10.2%
2016 2017 2018 2019 2020
Credit Card market share
14.9%
16.3%
17.6% 17.9%
19.3%
2016 2017 2018 2019 2020
Auto Loans market share
19.5%
21.1%20.9%
19.2%
20.5%
2016 2017 2018 2019 2020
Payroll Loans market share
13.1% 13.0%
14.9%
14.1%
15.1%
2016 2017 2018 2019 2020
Loan Book Market Share
Market Share by Segment
+108bp
+140bp+42bp
+133bp
+146bp
+28bp

32DB
NIMRev
C/INI
Div
ROETI L D
DepLoan
ICAPBAP Guid
MktEco
Hist App
ESG
Afore Market Share (Retirement Savings)
Source: CONSAR
AUM Market Share
Mar-20 Mar-21 Mar-20 Mar-21
XXI Banorte 866 1021 22.1% 21.4%
CitiBanamex 684 802 17.5% 16.8%
Profuturo GNP 597 752 15.2% 15.7%
SURA 565 708 14.4% 14.8%
Coppel 257 343 6.6% 7.2%
Principal 254 295 6.5% 6.2%
PensionISSSTE 257 317 6.6% 6.6%
Invercap 185 221 4.7% 4.6%
Other 250 322 6.4% 6.7%
1°
Billion Pesos
Assets Under Management

33DB
NIMRev
C/INI
Div
ROETI L D
DepLoan
ICAPBAP Guid
MktEco
Hist App
ESG
Insurance Market Share
Million Pesos
Source: AMIS.
Dec-19 Dec-19
Premiums Market Share
Dec-20 Dec-20
8°
Dec-19 Dec-19
Net Income Market Share
Dec-20 Dec-20
4°
G.N.P.
Metlife México
BBVA Bancomer
AXA Seguros
Qualitas
Monterrey New York Life
CitiBanamex
Seguros Banorte
Inbursa
Mapfre Crédito
Other
TOTAL
67,995 72,968 12.4% 13.2% 4,435 3,743 9.0% 8.9%
55,186 56,915 10.0% 10.3% 6,695 5,043 13.6% 12.0%
47,363 46,672 8.6% 8.5% 5,845 4,813 11.9% 11.5%
39,940 40,205 7.3% 7.3% 1,501 2,269 3.1% 5.4%
34,249 33,302 6.2% 6.0% 5,081 6,456 10.3% 15.4%
30,259 32,811 5.5% 6.0% 3,147 1,799 6.4% 4.3%
39,962 30,598 7.3% 5.6% 3,999 2,502 8.1% 6.0%
26,551 26,911 4.8% 4.9% 3,890 3,775 7.9% 9.0%
19,335 19,526 3.5% 3.5% 3,957 3,198 8.1% 7.6%
28,143 18,275 5.1% 3.3% 286 497 0.6% 1.2%
161,449 172,592 29.3% 31.3% 10,270 7,848 20.9% 18.7%
550,433 550,775 100.0% 100.0% 49,106 41,945 100.0% 100.0%

34DB
NIMRev
C/INI
Div
ROETI L D
DepLoan
ICAPBAP Guid
MktEco
Hist App
ESG
Annuities Market ShareMillion Pesos
1°
1°
*\ Legal document for any pensioners entitled to receive a pension.
Source: AMIS to March 2021.
Mar-20 Mar-20
Resolutions * Market Share
Mar-21 Mar-21
Annuitants
Mar-20 Mar-20Mar-21 Mar-21
Market Share
Banorte
Profuturo GNP
Bancomer
Total Industry
Banorte
Profuturo GNP
Bancomer
Total Industry
3,481 4,380 47.6% 42.3%
1,927 2,760 26.4% 26.7%
1,901 3,212 26.0% 31.0%
7,310 10,351 100.0% 100.0%
2,826 3,208 45.1% 41.3%
1,411 1,596 22.5% 20.5%
2,024 2,972 32.3% 38.2%
6,261 7,776 100.0% 100.0%

35DB
NIMRev
C/INI
Div
ROETI L D
DepLoan
ICAPBAP Guid
MktEco
Hist App
ESG
GFNorte in the World
(1) Level 1
Ticket Indexes
GFNORTEO (BMV)
IPC (BMV)
Sustainable IPC (BMV)
MSCI Mexico
STOXX
GBOOY (OTCQX)
DJSI MILA
Climate Disclosure Leadership
OTCQX30
Euronext Vigeo EM70
XNOR (Latibex)FTSE Latibex All Shares
FTSE Latibex TOP
1Q21
Total Shares Outstanding: 2,883.5 m
Float: ~ 86%
Total ADRs(1) Outstanding: 8.98 m
Market CapitalizationMillion pesos
US 20.4 bn
Oil and
COVID-19
crisis187,425
316,978
331,972
150,000
200,000
250,000
300,000
350,000
400,000
4Q
13
4Q
15
2Q
16
4Q
16
2Q
17
4Q
17
2Q
18
4Q
18
2Q
19
4Q
19
2Q
20
4Q
20

36DB
NIMRev
C/INI
Div
ROETI L D
DepLoan
ICAPBAP Guid
MktEco
Hist App
ESG
Analyst Opinion & Investment Grade by All Major Rating Agencies
Net Income 2021 $34,408
Target Price $125.2
Maximum $143.0
Number of Analysts 22
# BUY 17
# HOLD 4
# SELL 1
Analysts‘ Estimates
(as of April 22, 2021)
Ratings Agencies
RatingAgency Outlook Date
BBB-
BBB
Fitch
Standard & Poor’s Negative
Negative
Mar-20
Jul-20
Baa3Moody’s Negative Abr-20

37DB
NIMRev
C/INI
Div
ROETI L D
DepLoan
ICAPBAP Guid
MktEco
Hist App
ESGDBNIM
Rev
C/INI
Div
ROETI L D
DepLoan
ICAPBAP Guid
MktEco
Hist App
ESG
E S G

38DB
NIMRev
C/INI
Div
ROETI L D
DepLoan
ICAPBAP Guid
MktEco
Hist App
ESG
Sustainability Strategy
MSCI ESG Ratings Action:
Upgraded to
from 'A’
AA

39DB
NIMRev
C/INI
Div
ROETI L D
DepLoan
ICAPBAP Guid
MktEco
Hist App
ESG
Continuous evolution in ESG on the back of constant feedback from investors
Environmental
• Carpool Waze Mexico - Adherence of Afore XXI
• Smart mobility strategy (MOVIN) - Corporate offices in Mexico City
• Waste management program - Expansion to corporate headquarters
(Mexico City & Monterrey)
• Earth Hour Initiative (WWF) – Promotion of energy efficiency
Governance
• Integrated Annual Report
• Updated Materiality Matrix
• Code of Conduct training - 82.3% of employees as of 1Q21
• NPS (65 pts): +13% vs 1Q20 and +2% vs 4Q20
• 30% Club Mexico – Pension fund (Afore XXI Banorte) and Mutual
Funds and AM company signed a request for issuers to promote a goal
of at least 30% of women participation in the Boards of Directors by
year 2025
• Newsletter “Our Journey”
Social
• “Cross-border Payment Companies” (FXCIntelligence) - Uniteller
• 30% Club Mexico - Inter-organization women mentoring program
• Gender-Equality Index Bloomberg – 4 th year
• Corporate Social Responsibility (Mexican Center for Philanthropy) –
11th year
• International Women´s Day Commemoration
Sustainable Finance
• TCFD (UNEP FI) – Participation in the 3rd pilot
• Launch of the NTEESG Fund in partnership with Franklin Templeton
and a training program for 153 customers and 160 private banking
advisors
• Publication of the first report on the Principles for Responsible Banking
• Training program on sustainability and responsible investment for 210
investment executives
• Green building and Real-Estate certification training program

40DB
NIMRev
C/INI
Div
ROETI L D
DepLoan
ICAPBAP Guid
MktEco
Hist App
ESG
Integrated Annual Report 2020
Updates
• ESG data was present throughout the report and not just in one chapter,
as we did in previous years.
• First time using the SASB standards (Sustainability Accounting
Standards Board).
• We updated our Sustainability Model and our Materiality Matrix.
We used the framework proposed by the International Integrated
Reporting Council (IIRC) reporting the information in the following way:
• Financial Capital
• Technology and Infrastructure Capital
• Human Capital
• Intellectual Capital
• Social Capital
• Natural Capital
GFNorte Reports through the years
• 2000: First report that integrated ESG information
• 2009: First ESG report aligned with GRI
• 2011: First ESG report aligned with the UN Global Compact
• 2016: First ESG report aligned with IIRC
• 2020: First ESG report aligned with SASBNote: All GFNorte reports are independently verified.
41DB
NIMRev
C/INI
Div
ROETI L D
DepLoan
ICAPBAP Guid
MktEco
Hist App
ESG
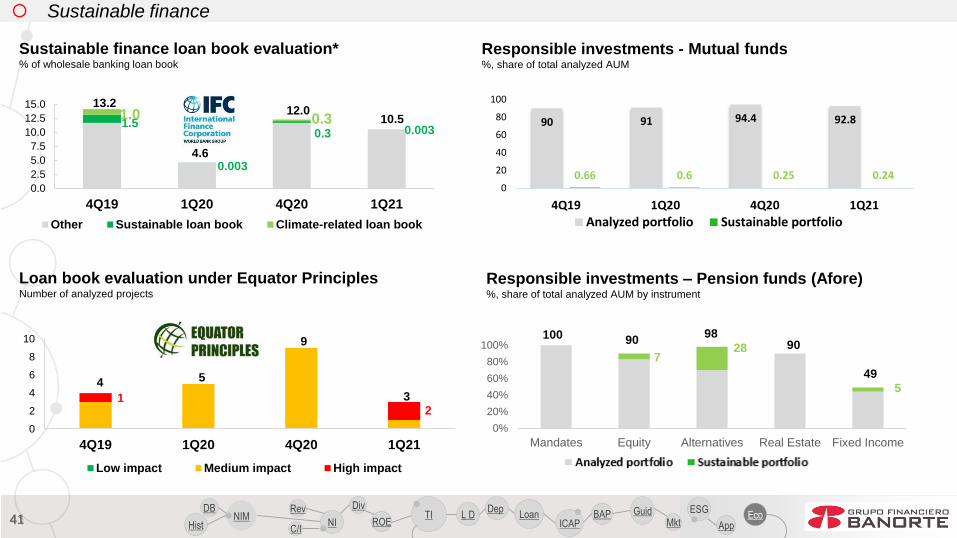
Sustainable finance
90 91 94.4 92.8
0.66 0.6 0.25 0.240
20
40
60
80
100
4Q19 1Q20 4Q20 1Q21
Analyzed portfolio Sustainable portfolio
Responsible investments - Mutual funds%, share of total analyzed AUM
Responsible investments – Pension funds (Afore)%, share of total analyzed AUM by instrument
Loan book evaluation under Equator PrinciplesNumber of analyzed projects
Sustainable finance loan book evaluation*% of wholesale banking loan book
1.5
0.003
0.3 0.003
1.0 0.313.2
4.6
12.010.5
0.0
2.5
5.0
7.5
10.0
12.5
15.0
4Q19 1Q20 4Q20 1Q21
Other Sustainable loan book Climate-related loan book
12
4 5
9
3
0
2
4
6
8
10
4Q19 1Q20 4Q20 1Q21
Low impact Medium impact High impact
0%
20%
40%
60%
80%
100%
Mandates Equity Alternatives Real Estate Fixed Income
Portafolio analizado Portafolio sustentable
100 9098
90
49
728
5

42DB
NIMRev
C/INI
Div
ROETI L D
DepLoan
ICAPBAP Guid
MktEco
Hist App
ESGDBNIM
Rev
C/INI
Div
ROETI L D
DepLoan
ICAPBAP Guid
MktEco
Hist App
ESG
Appendix

43DB
NIMRev
C/INI
Div
ROETI L D
DepLoan
ICAPBAP Guid
MktEco
Hist App
ESG
Quarterly Summary
Income Statement Highlights - GFNorte1Q20 4Q20 1Q21
Change
(Million Pesos) 4Q20 1Q20
Interest Income 36,879 30,676 32,572 6% (12%)
Interest Expense 14,528 9,638 9,797 2% (33%)
Technical Results (Insurance & Annuities) (383) (1,458) (2,773) (90%) (623%)
Net Interest Income 21,968 19,580 20,002 2% (9%)
Net Service Fees 3,455 3,599 3,214 (11%) (7%)
Trading 1,166 858 964 12% (17%)
Other Operating Income (Expenses) 327 859 822 (4%) 151%
Non Interest Income 4,949 5,315 5,000 (6%) 1%
Total Income 26,916 24,896 25,003 0% (7%)
Non Interest Expense 10,466 11,612 10,883 (6%) 4%
Provisions 4,344 5,993 3,215 (46%) (26%)
Operating Income 12,106 7,290 10,905 50% (10%)
Taxes 3,228 1,757 2,678 52% (17%)
Subsidiaries' Net Income 353 509 429 (16%) 21%
Minority Interest (113) (77) (112) (46%) 1%
Subsidiaries & Minority Interest 240 433 317 (27%) 32%
Net Income 9,118 5,966 8,544 43% (6%)

44DB
NIMRev
C/INI
Div
ROETI L D
DepLoan
ICAPBAP Guid
MktEco
Hist App
ESG
Quarterly Summary
Financial Ratios GFNorte 1Q20 4Q20 1Q21
NIM (1) 5.9% 4.8% 4.9%
ROE (2) 18.8% 10.9% 15.2%
ROA (3) 2.2% 1.3% 1.9%
Efficiency Ratio (4) 38.9% 46.6% 43.5%
Operating Efficiency Ratio (5) 2.5% 2.6% 2.4%
CCL Banorte and SOFOM - Basel III (6) 120.1% 192.5% 207.6%
Past Due Loan Ratio 1.7% 1.1% 1.3%
Coverage Ratio 140.1% 224.0% 185.4%
Cost of Risk (7) 2.2% 3.0% 1.6%
Market References
Banxico Reference Rate 6.50% 4.25% 4.00%
TIIE 28 days (Average) 7.36% 4.51% 4.37%
Exchange Rate Peso/Dolar 23.48 19.91 20.44
Tax Rate 25.9% 22.5% 23.6%
Balance Sheet Highlights - GFNorte1Q20 4Q20 1Q21
Change
(Million Pesos) 4Q20 1Q20
Asset Under Management 2,708,692 2,975,753 3,074,928 3% 14%
Performing Loans (a) 779,818 802,138 800,328 (0%) 3%
Past Due Loans (b) 13,212 8,931 10,607 19% (20%)
Total Loans (a+b) 793,030 811,070 810,935 (0%) 2%
Total Loans Net (d) 774,525 791,066 791,265 0% 2%
Acquired Collection Rights ( e) 1,500 1,617 1,529 (5%) 2%
Total Credit Portfolio (d+e) 776,025 792,682 792,794 0% 2%
Total Assets 1,729,280 1,787,904 1,810,207 1% 5%
Total Deposits 772,993 821,712 830,531 1% 7%
Total Liabilities 1,531,790 1,562,801 1,580,066 1% 3%
Equity 197,490 225,103 230,142 2% 17%
Total Performing Loans ex-Government 618,269 640,576 640,286 (0%) 4%

45DB
NIMRev
C/INI
Div
ROETI L D
DepLoan
ICAPBAP Guid
MktEco
Hist App
ESG
Quarterly Summary
Share Data 1Q20 4Q20 1Q21Change
4Q20 1Q20
Earnings per share (Pesos) 3.162 2.069 2.963 43% (6%)
Earnings per share Basic (Pesos) 3.180 2.097 2.995 43% (6%)
Dividend per Share for the period (Pesos) 0.00 0.00 0.00 - -
Payout for the period 0.0% 0.0% 0.0% - -
Book Value per Share (Pesos) 67.70 77.07 78.81 2% 16%
Outstanding Shares - BMV (Million) 2,883.5 2,883.5 2,883.5 0% 0%
Stock Price (Pesos) 65.00 109.93 115.13 5% 77%
P/BV (Times) 0.96 1.43 1.46 2% 52%
Market Capitalization (Million Dollars) 7,981 15,922 16,241 2% 104%
Market Capitalization (Million Pesos) 187,425 316,978 331,972 5% 77%
Exchange Rate Peso/Dolar 23.48470 19.90870 20.44000 3% (13%)
INFRASTRUCTURE 1Q20 4Q20 1Q21
Employees 29,796 29,916 29,626
Branches 1,178 1,193 1,178
Correspondents 13,694 16,984 17,297
ATM’s 9,090 9,387 9,449
POS’s 166,225 159,780 150,080

46DB
NIMRev
C/INI
Div
ROETI L D
DepLoan
ICAPBAP Guid
MktEco
Hist App
ESG
Healthy Liquidity
Loans / Deposits
(%)
Liquidity Coverage Ratio
CCL (%)
101%
98%
96%
90%
92%
94%
96%
98%
100%
102%
104%
106%
108%
110%
1Q2015
3Q 1Q2016
3Q 1Q2017
3Q 1Q2018
3Q 1Q2019
3Q 1Q2020
3Q 1Q2021
120%
193%
208%
70%
90%
110%
130%
150%
170%
190%
210%
230%
1Q2015
3Q 1Q2016
3Q 1Q2017
3Q 1Q2018
3Q 1Q2019
3Q 1Q2020
3Q 1Q2021
4Q

47DB
NIMRev
C/INI
Div
ROETI L D
DepLoan
ICAPBAP Guid
MktEco
Hist App
ESG
Improving Corporate Governance
GFNorte Mexbol Index (Average)*
Float 86% 45%
Listed overseas Yes 46% of the companies
Chairman of the Board-CEO separation Yes In 73% of the companies
Share of independent board members, % 64% 50%
Share of total assets threshold to require shareholders
approval in M&A operations, %Current Before Aug'16 19.7
Non-related 20 20 - -
Related 5 20 - -
Board members nominations committee
Existence Yes 13.5% of the companies
Final approval of nominated board members Shareholders Shareholders
Share of independent board members in this committee, %Current Before Aug'16
18.857.1 25
All members of the BOD are elected every year by the Shareholders’ Assembly.
Main Committees are chaired by independent members.
- Risk Policies
- Nominations
- Audit & Corporate Practices
Assembly quorum has always been higher than 60% and consensus has always been reached on proposals.

48DB
NIMRev
C/INI
Div
ROETI L D
DepLoan
ICAPBAP Guid
MktEco
Hist App
ESG
Corporate Responsibility and Sustainability
Global Initiative Report (GRI Standards)International standards on sustainability reporting and disclosure of economic, environmental and socialtopics.
UN Global CompactInternational initiative promoting 10 universally accepted Principles to promote Corporate Social Responsibility (CSR).
Carbon Disclosure Project (CDP)Organization that promotes awareness on climate change through a better quality and transparency of the information reported on the company's emissionsperformance.
IPC SustentableMexican index of 30 listed companies ,which are best positioned in relation to the pillars of Environment, Socialand Corporate Governance.
Empresa Socialmente Responsable (ESR) Recognition granted by the Mexican Center for Philanthropy (Cemefi) and AliaRSE, as a company committed with corporate social Responsibility.
Natural Capital DeclarationVoluntary financial sector initiative created at the Rio +20 Earth Summit, which recognizes the role of natural resources in the economy through its integration into financial products and services.
Equator PrinciplesStandard within the financial sector to determine, assessand manage the environmental and social risks of financed projects.
GEI2 Programme MexicoVoluntary reporting of greenhouse gas emissions
UNEP Finance InitiativeInitiative that aims to identify, promote and carry out the adoption of best environmental and sustainabilitypractices at all levels of operations of financialinstitutions.
Dow Jones Sustainability Index MILA In 2017 was included in the Dow Jones Sustainability Index MILA Pacific Alliance.
Asociación de Bancos de México (ABM) Participation in the Sustainability Committee and the Corporate Social Responsibility Committee, and signatories as the ABM Banking Sustainabilityprotocol.
STOXX ESG Leaders IndexIndex that represents the main global companies in terms ofenvironmental, social and governance criteria, based on ESG indicators provided by Sustainalytics.
Euronext Vigeo Emerging Markets 70 Recognizes the 70 companies from emerging countries with the most advanced practices in terms of sustainability.
FTSE4Good Emerging IndexIndex that evaluates actions in the themes of climate change, labor standards and risk management, among others.
Bloomberg Gender Equity IndexIndex that provides analysis of the commitment of 52 companies with the gender equity in the workplaceto investors and organizations.
Principles for Responsible Investment Initiative that promotes its signatories to integrate environmental, social and governmental (ESG)criteria into their investment and ownership decisions.

49DB
NIMRev
C/INI
Div
ROETI L D
DepLoan
ICAPBAP Guid
MktEco
Hist App
ESG
Contact Information and Reports
If you have any information request or comments, please contact Banorte's Investor Relations Department at:
Tel: (52) 55 1670 2276
E-mail: [email protected]
We recently published the 1Q21 report.
During 2021 we have released:
1. Annual Report to the Banking and Securities Commission (CNBV)
2. Annual Report to the Stock Exchange (Informe Anual Circular Única de Emisoras)
3. Audited Financial Statements for 2020
4. Annual Financial and CSR Report for 2020 under the GRI and SASB methodology (PDF & Interactive)
You can access our quarterly and annual reports (in Spanish and English) and other informative materials at :
investors.banorte.com
Disclaimer
Grupo Financiero Banorte does not warrant that the document is accurate, complete, reliable, fit for any particular purpose and does not accept liability for any act (or
decision not to act) resulting from the use of this document and related data. The information contained in this document is illustrative and informative so it should not
be considered as an advice and/or recommendation of any kind. Grupo Financiero Banorte is not part of any party or political trend.

50DB
NIMRev
C/INI
Div
ROETI L D
DepLoan
ICAPBAP Guid
MktEco
Hist App
ESGDBNIM
Rev
C/INI
Div
ROETI L D
DepLoan
ICAPBAP Guid
MktEco
Hist App
ESG
Economic and
Financial
Perspectives
51DB
NIMRev
C/INI
Div
ROETI L D
DepLoan
ICAPBAP Guid
MktEco
Hist App
ESG
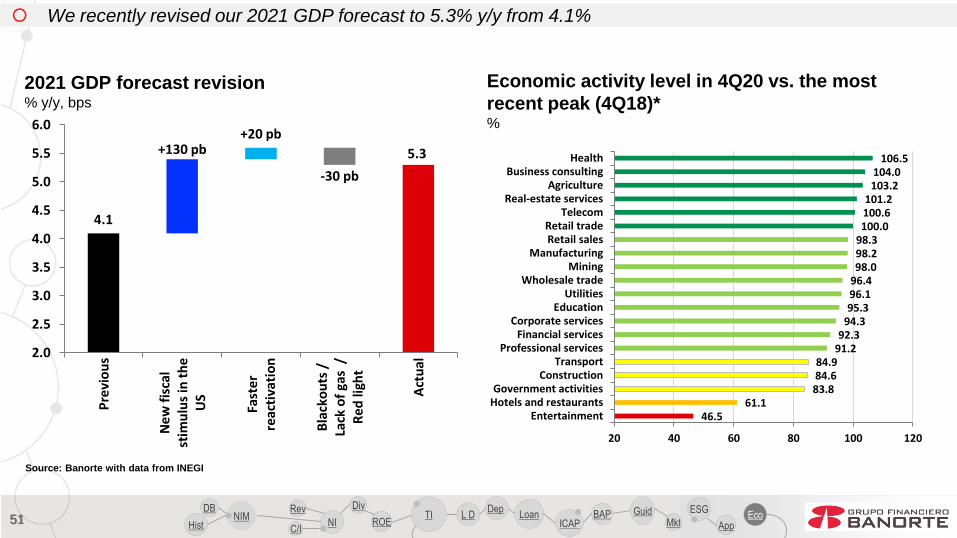
We recently revised our 2021 GDP forecast to 5.3% y/y from 4.1%
2021 GDP forecast revision% y/y, bps
Economic activity level in 4Q20 vs. the most
recent peak (4Q18)*%
Source: Banorte with data from INEGI
4.1
5.3+130 pb+20 pb
-30 pb
2.0
2.5
3.0
3.5
4.0
4.5
5.0
5.5
6.0
Pre
vio
us
Ne
w f
isca
lst
imu
lus
in t
he
US
Fast
er
reac
tiva
tio
n
Bla
cko
uts
/La
ck o
f ga
s /
Re
d li
ght
Act
ual
46.561.1
83.884.684.9
91.292.3
94.395.396.196.498.098.298.3100.0100.6101.2
103.2104.0
106.5
20 40 60 80 100 120
EntertainmentHotels and restaurantsGovernment activities
ConstructionTransport
Professional servicesFinancial services
Corporate servicesEducation
UtilitiesWholesale trade
MiningManufacturing
Retail salesRetail trade
TelecomReal-estate services
AgricultureBusiness consulting
Health

52DB
NIMRev
C/INI
Div
ROETI L D
DepLoan
ICAPBAP Guid
MktEco
Hist App
ESG
Supply and demand forecasts for 2021
2021 GDP forecast: Supply% y/y, % q/q
2021 GDP forecast: Demand% y/y, % q/q
Source: Banorte
1Q21 2Q21 3Q21 4Q21
2021 (whole year)
Actual Previous
GDP (y/y) -5.0 18.1 6.5 3.9 5.3 4.1
Primary 5.3 3.8 -2.5 -1.7 1.1 0.1
Industry -4.8 27.6 7.2 4.3 7.4 5.1
Services -5.5 15.1 6.5 4.0 4.6 3.8
Actual (t/t) -0.2 1.8 1.2 0.8 - - - -
Previous -0.7 1.1 1.4 1.7 - - - -
1Q21 2Q21 3Q21 4Q21
2021 (whole year)
Actual Previous
GDP (y/y) -5.0 18.1 6.5 3.9 5.3 4.1
Consumption -6.4 19.9 10.8 7.3 7.2 6.2
Investment -11.4 24.9 9.0 3.0 4.7 3.9
Govt. spending -3.2 -1.8 -2.2 1.0 -1.5 -1.8
Exports -1.5 36.3 6.9 4.7 9.8 7.6
Imports -4.9 23.9 18.3 9.8 10.8 9.6

53DB
NIMRev
C/INI
Div
ROETI L D
DepLoan
ICAPBAP Guid
MktEco
Hist App
ESG
5.3
-6.6
-14.0
-4.4
3.5
-3.7
2.1
-6.3
6.8
-5.3
5.1
-8.2
-15.0
-10.0
-5.0
0.0
5.0
10.0
19
29
19
33
19
37
19
41
19
45
19
49
19
53
19
57
19
61
19
65
19
69
19
73
19
77
19
81
19
85
19
89
19
93
19
97
20
01
20
05
20
09
20
13
20
17
20
21f
Source: 1895-1980 (Historical archive from Jonathan Heath); 1980-To date (INEGI).
The fall in 2020’s GDP would be the steepest since 1932, with a moderate recovery in 2021
Mexico GDP% y/y

54DB
NIMRev
C/INI
Div
ROETI L D
DepLoan
ICAPBAP Guid
MktEco
Hist App
ESG
However, the great difference to those are inflation levels
Source: Banorte with data from INEGI and Banxico
*Interest rate(1980-Sep 1982: CPP; 1982-…: Cetes; Exchange rate: 1980-Nov 1991: ‘para solventar obligaciones en moneda extranjera’; Nov 1991-…: Fix)
Nominal governmental interest rate, inflation and annual exchange rate depreciation%
-50
0
50
100
150
200
250
300
Mar-80 Aug-83 Jan-87 Jun-90 Nov-93 Apr-97 Sep-00 Feb-04 Jul-07 Dec-10 May-14 Oct-17 Mar-21
Interest rate Inflation Annual exchange rate depreciation

55DB
NIMRev
C/INI
Div
ROETI L D
DepLoan
ICAPBAP Guid
MktEco
Hist App
ESG
Banking sector KPI’s
Source: CNBV, Banorte with data as of Jan.-21
Capitalization ratio% of net capital / credit risk assets
Non performing loans ratio% of total loan portfolio
Coverage ratio% of loan loss provisions/NPL
0
5
10
15
20
25
30
35
40
Co
mp
arta
mo
sB
anco
pp
el
Ban
ort
eB
ank
of
Am
eric
aSa
nta
nd
erFi
nte
rra
Inb
urs
aB
BV
A B
anco
me
rC
on
sub
anco
Ban
co d
el B
ajío
Ban
ame
xIn
vex
Ban
crea
Ban
regi
oB
ansí
Mu
ltiv
aM
on
exA
uto
fin
Ban
co B
ase
CIB
anco
Inte
rcam
Ban
coB
IAfi
rme
Ban
ca M
ife
lH
SBC
Sab
ade
llB
anco
Azt
eca
Act
inve
rA
cce
nd
o B
anco
Afi
rme
Sco
tiab
ank
Inm
ob
iliar
io M
exic
ano
Ve
po
r M
ásA
BC
Cap
ital
Ban
kao
ol
Capitalization ratioBanking sector's average
17.90
20.950
2
4
6
8
10
Jan.-07 May.-09 Sep.-11 Jan.-14 Jun.-16 Oct.-18 Feb.-21
ConsumerMortgageCorporate
5.43.42.0
9.4
144.3
100
120
140
160
180
200
Dec.-07 Feb.-10 Apr.-12 Jul.-14 Sep.-16 Dec.-18 Feb.-21
193.3

56DB
NIMRev
C/INI
Div
ROETI L D
DepLoan
ICAPBAP Guid
MktEco
Hist App
ESG
‘Recovery plan’ to return back to ‘normal’ from COVID-19
Source: Banorte and Presentation from Beatriz Leycegui (SAI, April 15, 2020)
USD/MXN: 24.10 **Nominal GDP in 2019
Programs from Development BanksMX$ billion, US$ million, % of GDP
▪ Four-month advance to the senior citizen pension▪ Support for:
⎯ Fishermen⎯ Children with disabilities⎯ Benito Juárez Universities⎯ Savings for people without access to financial services⎯ Agriculture⎯ Upkeep for schools
▪ Programs for:⎯ Apprenticeships⎯ Internet for everyone
▪ Guarantee prices▪ Toluca – Mexico City Train▪ Construction of branches of El Banco del Bienestar▪ Recruitment of 31 thousand new elements for the Army, Navy
and National Guard▪ Rural concrete roads▪ New credits and refinancing from INFONAVIT▪ ‘Sowing Life’ program will extend to 200 thousand farmers▪ Expedited returns of VAT to taxpayers▪ No increase to taxes or adoption of counter-cyclical measures or
corporate bailouts to businesses or banks▪ Elimination of 10 deputy ministries▪ Reduction of 25% in wages of high-ranking workers (Deputy
Director and upwards) and end-of-year bonus elimination▪ Savings of 75% in general spending and supplies categories
Institution Measure MXN USD* % of GDP**
Total 61.1 2,535 0.25
BANOBRASLiquidity support for companies in the infrastructure sector
6.0 249 0.02
NAFIN / BANCOMEXT
Liquidity support for "first-floor" financial institutions
10.0 415 0.04
NAFIN / BANCOMEXT
Liquidity support for "second-floor" financial institutions
20.0 830 0.08
NAFIN / BANCOMEXT
Guarantees program for companies and businesspeople
6.3 261 0.03
SHFStabilization of syndicated loans provided to construction companies
8.8 365 0.04
SHF Additional financing for "second-floor" bridge loans 6.0 249 0.02
SHF Small loans for housing improvements 2.0 83 0.01
FNDAttention scheme for the restructuring of debtors' loans
TBD
FND Measures to support the Rural Economy TBDBanco del Bienestar
Clients' Program 2.0 83 0.01
Banco del Bienestar
Outreach Program TBD
Banco del Bienestar
Reactivation of credit demand TBD
FOCIRExtension of the period to divest affected companies
TBD
FOCIRSuspension of commission payments for the management of FICAS
TBD
FOCIR Emerging Program "COVID 2020 - FOCIR-SE" TBD

57DB
NIMRev
C/INI
Div
ROETI L D
DepLoan
ICAPBAP Guid
MktEco
Hist App
ESG
…and strengthen credit channels
Note: 1. The total only adds up facilities for which we have information; 2. Using an exchange rate of USD/MXN 22.50
NA = Not available
Source: Banxico, Banorte
Additional measures announced by Banxico to promote liquidity and strengthen credit channelsMX$ billion, US$ billion, % of GDP
Measure MXN USD % of GDP
Total1 800.0 35.6 3.3
Provide liquidity and reestablish operational conditions in money markets
(1) Reduction of the Monetary Regulation Deposit 50.0 2.2 0.2
(2) Adjustments to the Ordinary Additional Liquidity Facility interest rate -- -- --
(3) Increasing liquidity during trading hours to facilitate the optimal functioning of financial markets and payment systems -- -- --
(4) Extending the securities eligible for the Ordinary Additional Liquidity Facility -- -- --
(5) Extending the counterparts eligible for the Ordinary Additional Liquidity Facility -- -- --
(6) Temporary securities swap window 100.0 4.4 0.4
Promote the orderly behavior in governmental and corporate bond markets
(7) Strengthening of the Government Debt Market Makers Program -- -- --
(8) Government securities term repurchase window 100.0 4.4 0.4
(9) Swap of government securities 100.0 4.4 0.4
(10) Securities Repurchase Facility 100.0 4.4 0.4
Strengthen credit channels
(11) Provision of resources to banking institutions to channel credit to MSMEs and individuals affected by the COVID-19 pandemic 250.0 11.1 1.0
(12) Collateralized financing facility for commercial banks with corporate loans, to finance MSMEs 100.0 4.4 0.4
Promote the orderly behavior of the foreign exchange market
(13) Non-deliverable FX forwards program expansion -- -- --
(14) USD credit auctions (financed with the swap line facility with the Federal Reserve) -- -- --
(15) Foreign exchange hedges settled by differences in USD -- -- --

58DB
NIMRev
C/INI
Div
ROETI L D
DepLoan
ICAPBAP Guid
MktEco
Hist App
ESG
Initial impact of COVID-19 lockdowns in Mexico and the path towards recovery
Source: INEGI, IMEF, ANTAD
IMEF’s PMIsDiffusion index
Auto production% y/y
Industrial productionIndex base 100= 2013 , sa
50.7
52.8
34
36
38
40
42
44
46
48
50
52
54
56
Mar-16 Sep-18 Mar-21
Manufacturing
Non-manufacturing
60
70
80
90
100
110
120
Feb-11 Feb-16 Feb-21
Total
Manufacturing
Mining
Construction-98.8
-28.8
12.5
-100
-80
-60
-40
-20
0
20
40
60
80
100
Mar-07 Mar-14 Mar-21

59DB
NIMRev
C/INI
Div
ROETI L D
DepLoan
ICAPBAP Guid
MktEco
Hist App
ESG
Initial impact of COVID-19 lockdowns in Mexico and the path towards recovery
*Note: Seasonally adjusted by Banorte with the ARIMA X-12 method
Source: IMSS, STPS, INEGI and ANTAD
Formal job creationThousands, seasonally adjusted*
Auto sales% y/y
ANTAD’s same-store sales% y/y in nominal terms
-64.5
9.1
-70
-60
-50
-40
-30
-20
-10
0
10
20
30
Mar-07 Nov-11 Jul-16 Mar-21
-22.9
-8.2
6.5
-25
-20
-15
-10
-5
0
5
10
15
Mar-07 Nov-11 Jul-16 Mar-21
Apr May Jun Jul Aug Sep Oct Nov Dec Jan Feb Mar
Supermarkets 8.7 7.0 2.4 3.1 2.1 0.7 4.8 2.6 2.8 3.4 -1.2 -13.2
Departmental -72.7 -49.6 -44.6 -22.6 -1.8 3.5 -0.9 7.4 -9.8 -20.2 4.7 42.7
Specialized -17.5 -16.3 -14.5 -9.9 -8.0 -3.5 4.1 -2.5 -9.7 --9.2 -5.5 7.3
-472
103
-49
71
-600
-500
-400
-300
-200
-100
0
100
200
Jun-94 May-03 Apr-12 Mar-21
NSA:
April: -555
May: -345
June: -83
July: -4
August: +92
September: +114
October: +201
November: +149
December: -278
January: +48
February: +115
March: +89

60DB
NIMRev
C/INI
Div
ROETI L D
DepLoan
ICAPBAP Guid
MktEco
Hist App
ESG
We believe Banxico has ended its easing cycle on higher inflation, expecting a 25bps hike at the end of the
year
Source: Banxico, INEGI, Banorte
Inflation forecast% y/y, contributions in bps
Inflation forecast% y/y, bi-weekly frequency
Banxico’s Hawk-o-meter
Implicit movements in interest
rate futuresbps
Reference rate forecast%
2019:7.25
2020:4.25
2
3
4
5
6
7
8
9
Dec-15 Dec-17 Dec-19 Dec-21
2021:4.25
HawkishDovish
GE JH ADL IEGB
3.7
4.7
+45bps+27bps
+21bps +11bps
3.03.43.84.24.65.0
Pre
vio
us
est
imat
e
Infl
atio
nsu
rpri
ses
in1
Q21
Low
er s
lack
and
su
pp
lysh
ock
s
Ad
dit
ion
alp
ress
ure
sin
en
ergy
Pas
sth
rou
ghto
ser
vice
s
New
fore
cast
2019:2.8
2020:3.2
3.7
2021:4.7
2
3
4
5
6
Dec-19 Aug-20 Apr-21 Dec-21
Observed
Previous estimate
New forecast
3
19
35
63
2Q21 3Q21 4Q21 1Q22

61DB
NIMRev
C/INI
Div
ROETI L D
DepLoan
ICAPBAP Guid
MktEco
Hist App
ESG
-4.6-3.2
-2.3-1.4-1.3
0.41.1
1.62.1
3.3
-9.5-8.3
-5.9-5.5
-3.1-3.1
-2.3-1.5
-1.2-1.0
-0.10.40.50.7
2.32.9
-12 -8 -4 0 4
JPYCHFSEKEURDKKNZDAUDCADGBPNOK
ARSTRYBRLCOPIDR
RUBMYRPENPLNHUFHKD
MXNCNY
TWDCLPZAR
Concerns arround the possibility of the Fed hiking earlier has strenghened the USD
Year-to-date performance vs. USD%
USD/MXN forecastUSD/MXN
Source: Banorte with data from Bloomberg
21.50
20.90
19.50
20.5020.20
18.50
19.50
20.50
21.50
22.50
23.50
24.50
Dec-19 Jun-20 Dec-20 Jun-21 Dec-21
Banorte
forecast

62DB
NIMRev
C/INI
Div
ROETI L D
DepLoan
ICAPBAP Guid
MktEco
Hist App
ESG
Public debt increased , resuming its downward trend in 2021
Source: MoF
1. HBPSBR – Historical Balance of the Public Sector Borrowing Requirements.
Public debt1
% of GDP
Government debt – 2019-2020
increase
% of GDP
30.6 30.933.2
34.832.3 31.1
29.5 28.8
32.936 36 37.2 37.2
4042.6
46.548.7
45.7 44.9 45.1
52.451.4
0
10
20
30
40
50
60
200
0
200
1
200
2
200
3
200
4
200
5
200
6
200
7
200
8
200
9
201
0
201
1
201
2
201
3
201
4
201
5
201
6
201
7
201
8
201
9
202
0
202
1
Credit ratings
BBB+ BBB+ Baa1
BBB BBB Baa2
BBB- BBB- Baa3
BB+ BB+ Ba1
BB BB Ba2
BB- BB- Ba3
45.1
52.4
+0.9
+3.9+2.5
42
46
50
54
2019 FXweakness
Fall innominal
GDP
Higherdebt
2020

63DB
NIMRev
C/INI
Div
ROETI L D
DepLoan
ICAPBAP Guid
MktEco
Hist App
ESG
Attention on mid-term elections
Source: INE, El Financiero, Oraculus
*Note Difference of effective preferences; Morena is either the first or second place in all races. Text in parenthesis signals incumbent party
Morena’s advantage in
governorship races*% over the next closest competitor
Possible composition of the
Lower HouseSeats
-21
-11
-4
-2
-1
2
4
6
10
13
13
15
15
18
22
-40 -20 0 20 40
Qro. (PAN)
B.C.S. (PAN)
N.L. (Ind.)
Chih. (PAN)
S.L.P. (PRI)
Sin. (PRI)
Son. (PRI)
Mich. (PRD)
Tlax. (PRI)
B.C. (Morena)
Camp. (PRI)
Col. (PRI)
Gro. (PRI)
Zac. (PRI)
Nay. (PAN)
Morena´s coalition (PT and PVEM)would get 326 seats
The confidence Interval for them isbetween 304 and 346 seats
The qualified majority (2/3) isobtained with 334 seats, which thiscoalition currently has
Mexico will have the mostimportant mid-term elections inhistory, with 15 governorships, acomplete renewal of the LowerHouse and a large amount of statelegislatures and municipalpositions
Representatives may get reelectedfor the first time
This can make proposals frommany candidates –which are inoffice right now-, skew towardsgaining more support, becomingother law initiatives which may inturn generate additional noise

64DB
NIMRev
C/INI
Div
ROETI L D
DepLoan
ICAPBAP Guid
MktEco
Hist App
ESG
2021 mid-term elections in Mexico
Source: Banorte with data from local and state governments, Consulta Mitofsky (January 2021) and INEGI
1.Will renew local congresses: Aguascalientes, Durango and Hidalgo; Will renew county governments: Coahuila, Quintana Roo and Tamaulipas; Renew both: Mexico City, Chiapas, State of
Mexico, Guanajuato, Jalisco, Morelos, Oaxaca, Puebla, Tabasco, Veracruz and Yucatán
# State Current Governor Party Approval rate % of GDP% of
population% of territory
1 Baja California Jaime Bonilla Valdez Morena 58.4% 3.1 2.8 3.6
2 Baja California Sur Carlos Mendoza Davis PAN 60.0% 1.0 0.6 3.8
3 Campeche Carlos Miguel Aysa González PRI 44.1% 3.0 0.7 2.7
4 Chihuahua Javier Corral Jurado PAN 36.0% 3.2 3.0 12.9
5 Colima José Ignacio Peralta Sánchez PRI 37.1% 0.6 0.6 0.3
6 Guerrero Héctor Antonio Astudillo Flores PRI; PVEM 55.9% 1.4 3.0 3.3
7 Michoacán Silvano Aureoles Conejo PRD 44.2% 2.4 3.9 3.1
8 Nayarit Antonio Echevarría García PAN 36.7% 0.7 1.0 1.4
9 Nuevo León Jaime Heliodoro Rodríguez Calderón Independent 35.0% 7.5 4.1 3.4
10 Querétaro Francisco Domínguez Servién PAN 59.1% 2.3 1.6 0.6
11 San Luis Potosí Juan Manuel Carreras López PRI 40.0% 2.1 2.3 3.3
12 Sinaloa Quirino Ordaz Coppel PRI; PVEM 67.9% 2.2 2.5 3.0
13 Sonora Claudia Artemisa Pavlovich Arellano PRI 49.4% 3.3 2.4 9.6
14 Tlaxcala Marco Antonio Mena Rodríguez PRI 52.1% 0.6 1.0 0.2
15 Zacatecas Alejandro Tello Cristerna PRI 43.6% 0.9 1.3 3.9