corporate presentation - argaamplus.s3.amazonaws.com€¦ · constantly monitoring emerging market...
TRANSCRIPT

Corporate Presentation
December 2017
Contents
Overview: A leading travel & tourism company 3
Hospitality 8
Travel 14
Investments 25
Supporting Businesses 29
Financial Performance 32
2

A leading travel & tourism companywith a balanced portfolio of trusted brands that
consistently exceed customer expectations

Adjusting to a shifting landscape
Despite being the largest travel & tourism company in Saudi Arabia, ATG is
constantly monitoring emerging market trends and opportunities
Travelers increasingly
discerning
Industry facing pressure
on mark-ups
Online increasingly
important sales channel
Government spending
decline
TRENDS
▪ Capitalize on the competitive
advantages inherent in its size and
history
▪ Leadership role in travel
management services
▪ Admired Saudi company – aligned
with Vision 2030
▪ Delivering growth and strong cash
flow
OPPORTUNITIES
Introduction
Hospitality
Travel
Investments
Supporting
Businesses
Financial
Performance
4

Travel & Tourism Value Chain
We will be selective about where in the sector we will deliver value
LOGISTICS
& INFRASTRUCTUREINTERMEDIARY SERVICE DELIVERY
• Traditional travel agent
• Online travel agent
• Documentation
• Accommodation
• Local Travel
• Infrastructure Providers
• Logistics
• Transportation
• Entertainment
• Excursions KEY: ATG Focus Area
Al Tayyar has a well balanced commercial portfolio to succeed in the travel & tourism
industry, specifically along intermediary and service delivery activities
Introduction
Hospitality
Travel
Supporting
Businesses
Financial
Performance
Investments
• DMC
5

Online Travel Agency
DMC Mecca
Traditional Travel Agent (KSA)
Freight Forwarding
DMC International
Conference - operate
Car rental
Traditional Travel Agent (Int'l)
Other investments
Hotels – operator
Hotels – own
Operational Consolidation
To best capitalize on market opportunities, we are organizing operations around
four core commercial focus areas
Online Travel Agency
Travel Services
Hospitality
Car rental
Corporate ventures
TRAVEL
HOSPITALITY
SUPPORTING BUSINESSES
INVESTMENTS
…TOFROM A GROUP OF NUMEROUS SUBSIDIARIES…
Introduction
Hospitality
Travel
Supporting
Businesses
Financial
Performance
Investments
4 FOCUS AREAS5 SBU’S
6

Positioning for the Future
We know where we want to be by 2020 and are implementing the strategic
initiatives required to get us there transform, diversify and balanceIntroduction
Hospitality
Travel
Supporting
Businesses
Financial
Performance
TODAY STRATEGIC INITIATIVES TOMORROW: 2020
General- Business-to-government (B2G)
- Concentrated revenue source
- Traditional travel agency
- Hospitality owner
Travel Services- Leading ticket agent in Middle East
- Targeting offline sales, corporate
accounts
Online- New market player
- No profitability
Hospitality- 5 operational hotels including 2 direct
assets
- Entering mid-market segment
- Launch Development Fund
General- Reorganize of main business areas
- Upgrade of technological capabilities
Travel Services- Reconfigure the traveler experience
w/ focus on leisure customers
- Invest in tech platforms
- Increase focus on Hajj & Umrah
Online- Scale up technology capability
- Enter new markets with potential
to build market share
Hospitality- List REIT 2018
- Maximize cash flow from direct
assets
- Leverage the Choice Hotel brands to
grow mid-market segment
General- B2G and B2C
- Diversification of revenue source
- Balanced portfolio
- Technology-focused
Travel Services- Leading omni-travel service
- Holiday “advisor”
- Hajj & Umrah (inbound travel)
Online- Leading service provider in MENA
- Profitable in core markets and
growing in new markets
- New products and expand market
share
Hospitality- Optimizing the balance sheet
- Own and operate 6,000 keys in
mid-market
- Diversified net income from
different assets – include
Development Fund
Investments
7

Hospitality
Introduction Hospitality Travel InvestmentsSupporting
Businesses
Financial
Performance

Al Tayyar Travel Group
2
is leveraging its legacy
business to successfully
reposition the Company
through a balanced asset
portfolio offering stable
cash-flows and risk-
adjusted returns

Hospitality: Overview
ATG will deliver stable cash flows by capitalizing on the growth of Saudi Arabia’s tourism sector via the development and operation of mid-market hotels in the GCC
ACHIEVEMENTSAT A GLANCE
OBJECTIVE
▪ Provide stable cashflow to fund working capex
▪ Invest in under-served mid-market hotels
▪ Optimize balance sheet, push for higher returns on equity
APPROACH
▪ Locate hotels in high density areas and/or major cities
▪ Identify clear entry points for mid-market hotels
▪ Support long-term indirect and minority stakes
- Inaugurated flagship
Sheraton Makkah
- Decision to spin-off
hospitality assets in Makkah
into a REIT
- Mid-market hospitality
Development Fund to be
launched in H1 2018
Introduction
Hospitality
Travel
Supporting
Businesses
Financial
Performance
2Cities
5Hotels
1,880Rooms
Investments
SAR 4bn
Book value
- Delivered two pilgrim
accommodations in Makkah
10

Hospitality: Direct investments
These assets are associated with globally recognized brands, strategically located
in Makkah and Jeddah - delivering stable, low volatility cashflow
Benefits
Introduction
Hospitality
Travel
Supporting
Businesses
Financial
Performance Global brand recognition - better
RevPAR premium
#1 location in Jeddah
and Makkah
Lower income volatility and
greater transparency
Disciplined strategy of investing in
key cities and heritage sites
Key growth markets – Hajj &
Umrah, and domestic tourists
Investments
11

10
▪ Create REIT to extract cash for
investment and provide stable net
income to the group
▪ 100% of assets in Makkah
▪ Specialist hospitality portfolio
▪ Consists of 3 fully leased hotels and
110 serviced apartments
▪ Fully focused on Hajj & Umrah
▪ Listing Q1 2018; retain majority stake
ASSET 2: REIT
Private Real Estate Fund
Al Tayyar Group
- Invest land and cash
- 7 plots > Jeddah, Riyadh and
Makkah
Landowners/Contractor Unitholders
- Invest cash
- Invest land
Fund Manager
- 3rd Party Custodian (CMA
authorized)
▪ Develop and operate mid-market hotels across GCC utilizing
equity and debt off the balance sheet
▪ Contribute 7 plots of land and cash equity into the fund, to
be managed by a independent fund manager and operated by
the Choice Hotel brand
▪ Develop 10 hotels under the Choice Hotel brand
ASSET 1: MID MARKET DEVELOPMENT FUND
Hospitality: Indirect Investment
Our two ‘indirect assets’ will further increase steady cashflow, via off-balance sheet
financing, and will also enhance our liquidity profileIntroduction
Hospitality
Travel
Supporting
Businesses
Financial
Performance
Investments
Sheab QuraishMasafi Hotel Beer Baleela
12
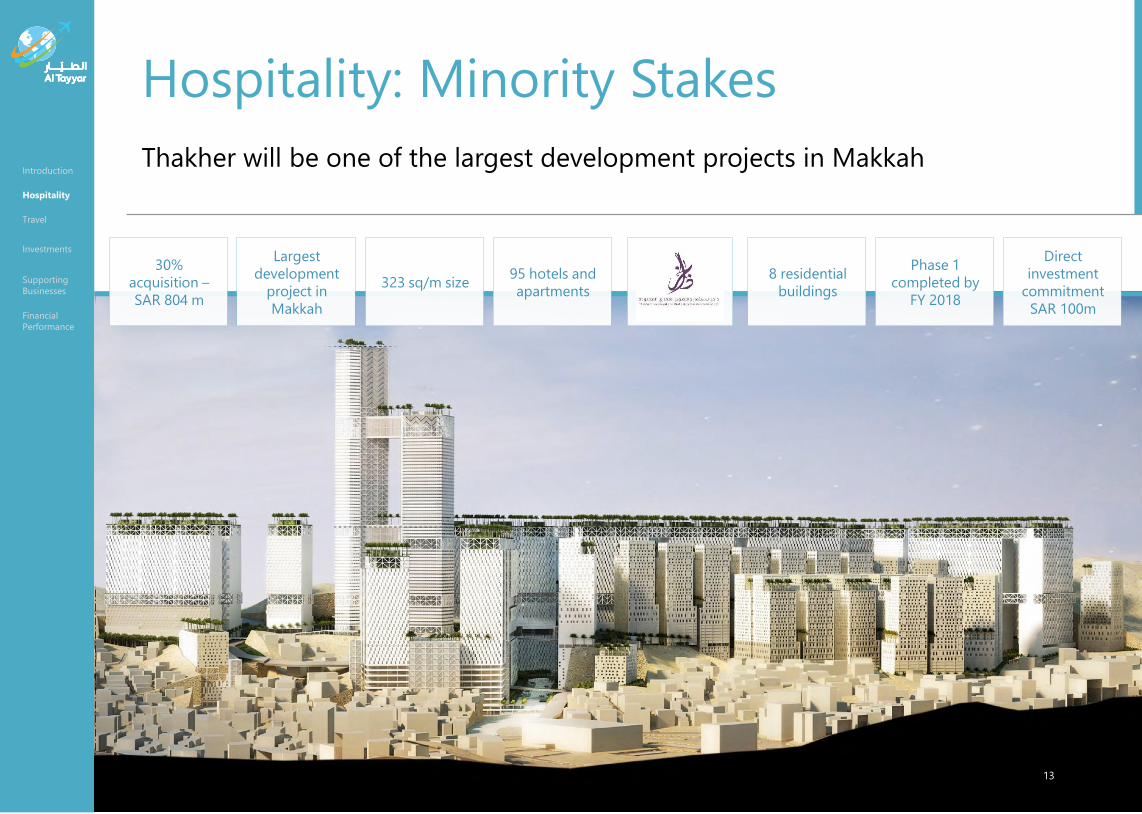
Hospitality: Minority Stakes
Thakher will be one of the largest development projects in Makkah
30%
acquisition –
SAR 804 m
Largest
development
project in
Makkah
8 residential
buildings
95 hotels and
apartments323 sq/m size
Direct
investment
commitment
SAR 100m
Phase 1
completed by
FY 2018
Introduction
Hospitality
Travel
Supporting
Businesses
Financial
Performance
Investments
13

Introduction Hospitality Travel InvestmentsSupporting
Businesses
Financial
Performance
Travel

2
Al Tayyar
Travel Group
delivers travel and holiday
solutions to its customers
across the MENA region
and broader Muslim world
through its travel service
outlets and proprietary
online travel platforms

Travel Services: Overview
ATG’s Travel Services, a traditionally flagship business, will be refreshed, rebalanced
and redefined
Leisure Tourism Government & Corporate Business Hajj & Umrah
APPROACH
▪ Provide seamless customer experience
through omni-channel strategy
▪ Shift from selling low margin tickets to
packages
▪ Enhance sales experience by pivoting
from ticketing agents to travel
advisors
▪ Create inspirational holiday advisory
experience in redesigned branches
REFRESH REBALANCE REALIGN
▪ Introduce new travel management
portal
▪ Optimize processes and focus on cost
optimization
▪ Customer segmentation strategy
▪ Define growth and go-to-
market strategy for Hajj &
Umrah tourism
▪ Propose new government
platform to allow Umrah
operators to target global
pilgrims
▪ Align with Vision 2030
programs and initiatives
▪ Seize untapped opportunity leisure
business
▪ Target SAR 2.7 bn gross sales by 2022
▪ Defend leading position in government
business
▪ Consolidate growth of corporate business
▪ Identify new growth
opportunities for Hajj &
Umrah tourism
OBJECTIVE
Introduction
Hospitality
Travel
Supporting
Businesses
Financial
Performance
Investments
16

Travel Services: Market Assessment (1 of 2)
There is huge untapped opportunity in KSA, especially in the Leisure segment
Note: 1. Includes VFR market ~SAR 11-13 bn. 2. Includes all travel for business and professional reasons and education & training (MoHE driven market). 3. Includes travel for medical care, religious visits, sports, special occasions and miscellaneous reasons. 4. Includes VFR travel of ~SAR 8 bn 5. Includes VFR travel of SAR 3-4 bn. 6. Includes SAR4-5bn of travel for medical care. 7. Includes SAR 4-5bn of religious travel.Source: Tourism statistics (2015), SCTH, MAS KSA, Euromonitor International Passport – Travel in Saudi Arabia (August 2016), Al Tayyar Strategy Unit (2017)
CORP. & GOV.2
OU
TBO
UN
D T
RA
VEL
DO
MES
TIC
TR
AV
EL
LEISURE1 OTHERS3
Introduction
Hospitality
Travel
Supporting
Businesses
Financial
Performance
Market Share
35-45%
Total Market
SAR 12 Bn
Market Share
3-4%
Market Share
3-4%
Total Market
SAR 12bn(5)
Total Market
SAR 38bn(4)
SAR 8 Bn(6)
(mainly travel for medical care)
SAR 7 Bn(7)
(mainly travel for religious tourism)
Investments
17

Travel Services: Market Assessment (2 of 2)
We estimate the Hajj & Umrah tourism market will grow five-fold by 2030
Number of international pilgrims (Mn)
Vision 2030 target is to host30Mn international pilgrims
Total Inbound pilgrim expenditure excluding air travel (SAR Bn)
We estimate spend within KSA will reach ~250Bn SAR in 2030
+10%
20
2020 2030
30
8
2016
+12%
154
2030
50
255
20202016
Increase driven by:
• Easing visa restrictions
• Investments in capacity and pilgrim experience
• Increase of disposable income of Hajj & Umrah pilgrims source markets
• Spending is expected to increase from current 6.5k SAR per person
Increase driven by:• Higher purchasing power from source markets • Additional offerings in Holy Cities and KSA
Introduction
Hospitality
Travel
Supporting
Businesses
Financial
Performance
Investments
18
Source: Al Tayyar Strategy Unit

Travel Services: Leisure
The transformation of the leisure business will be aligned with market trends
Transform business to become market leader in
customer satisfaction and service excellence
Introduction
Hospitality
Travel
Corporate
Ventures
Supporting
Businesses
Financial
Performance ▪ Strong preference for offline
purchases
▪ Willingness to pay for
integrated packages
▪ Desire to be inspired by
travel advisor
MARKET TRENDSSTRATEGY
Develop a strong top-of-
mind leisure travel brand
Revamp our retail branch
network
Target 5 priority leisure
customer segments
Create exclusive and
innovative packages
Offer a seamless omni-channel
customer experience
Hire, train and retain the
best travel consultants
Implement a CRM to
enhance customer centricity
19

Travel Services: Government & Corporate
Defend the leadership position of the government business and grow the corporate
business
DEFEND Government Business
GROW Corporate Business
Secure ATG's position as leading travel agency for
government entities
Position ATG as one of the leading travel
management companies for corporations
Introduction
Hospitality
Travel
Supporting
Businesses
Financial
Performance GOVERNMENT
▪ Purchase order system expected
to stay in place
▪ Increasing cost-awareness (Vision
2030)
▪ Importance of reputation and
past relationships
CORPORATE
▪ Create integrated travel
management solutions
▪ Cost-optimization and
transparency focus
▪ Consolidation of players through
technology
MARKET TRENDSSTRATEGYInvestments
20
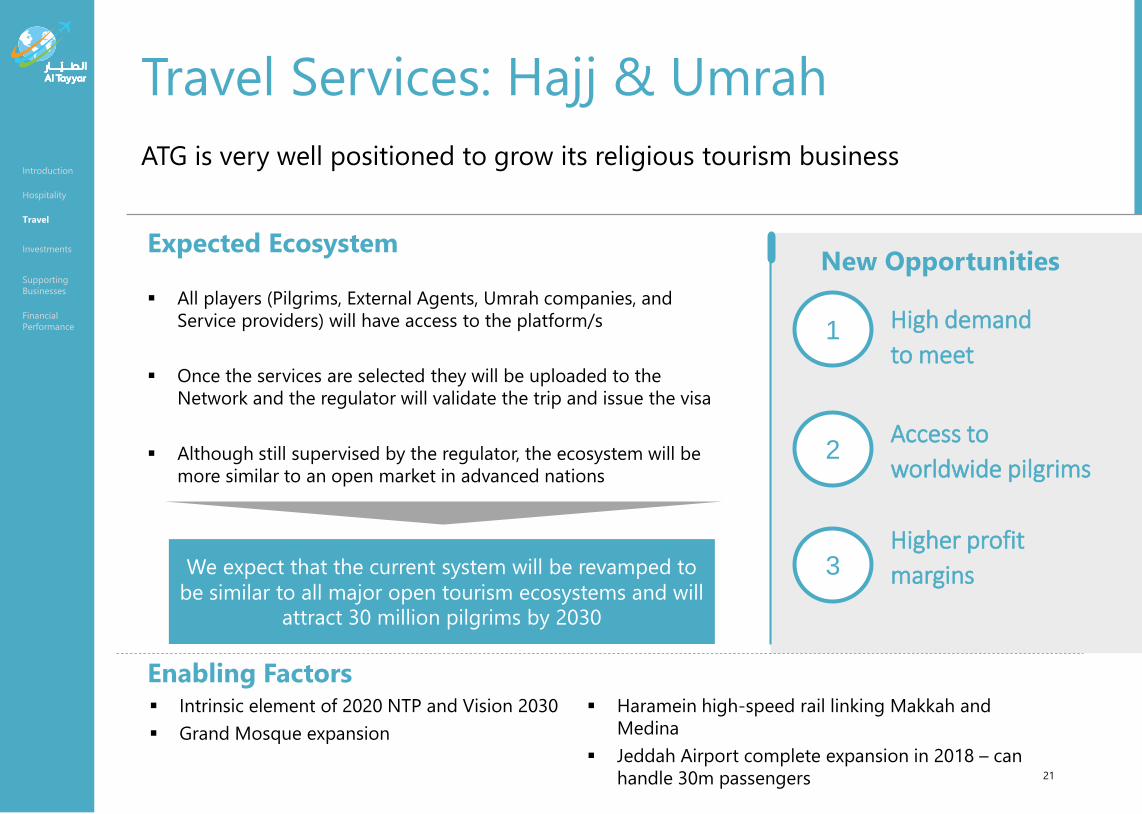
Travel Services: Hajj & Umrah
ATG is very well positioned to grow its religious tourism businessIntroduction
Hospitality
Travel
Supporting
Businesses
Financial
Performance
Expected EcosystemInvestments
▪ All players (Pilgrims, External Agents, Umrah companies, and
Service providers) will have access to the platform/s
▪ Once the services are selected they will be uploaded to the
Network and the regulator will validate the trip and issue the visa
▪ Although still supervised by the regulator, the ecosystem will be
more similar to an open market in advanced nations
Higher profit
margins3
Access to
worldwide pilgrims 2
High demand
to meet1
Enabling Factors ▪ Intrinsic element of 2020 NTP and Vision 2030
▪ Grand Mosque expansion
▪ Haramein high-speed rail linking Makkah and
Medina
▪ Jeddah Airport complete expansion in 2018 – can
handle 30m passengers
New Opportunities
We expect that the current system will be revamped to
be similar to all major open tourism ecosystems and will
attract 30 million pilgrims by 2030
21

Online Travel: Overview
We are investing in a technology-enabled transformation towards being a full
service OTA that captures growth opportunities in our target markets
Coming soon
… catering to local needs through..
▪ Arabic content
▪ Local payment options
▪ Tailored offers to preferred
destination for Saudi tourists
▪ Packages for religious tourism
ATG has established
two leading MENA OTAs...
Since its inception, Online
SBU grew over 1,200% and
target is to achieve 3.7 Bn
SAR by 2020
Strategy is to increase the
product roadmap and
expand into new markets
Gross booking value (M SAR)
2014 20162015
9M
1,200
2017e
+1,268%
➢ Activities
➢ Ground Transport
➢ Insurance
➢ Packages
➢ New Markets
➢ Other products
Source: Al Tayyar Strategy Unit (2017)
Introduction
Hospitality
Travel
Corporate
Ventures
Supporting
Businesses
Financial
Performance
2,000
3,750
2018 Target
2020 Target
22
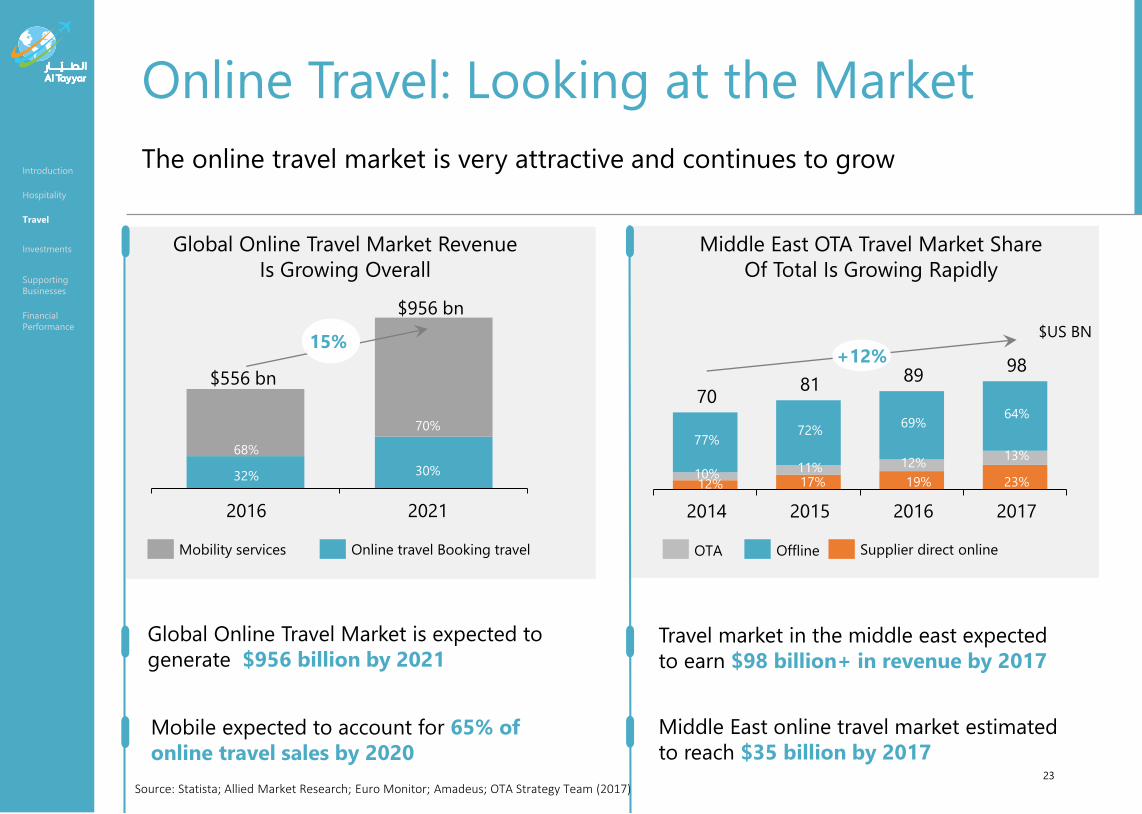
Online Travel: Looking at the Market
The online travel market is very attractive and continues to grow
Middle East OTA Travel Market Share
Of Total Is Growing Rapidly
Global Online Travel Market Revenue
Is Growing Overall
2021
70%
68%
32%
2016
30%
$556 bn
$956 bn
15%
Mobility services Online travel Booking travel
12%
77%
10%11%
2014
98
72%
70
2015
17%
69%
12%
19%
2016
64%
13%
23%
81
2017
89+12%
Supplier direct onlineOfflineOTA
$US BN
Global Online Travel Market is expected to
generate $956 billion by 2021
Mobile expected to account for 65% of
online travel sales by 2020
Middle East online travel market estimated
to reach $35 billion by 2017
Travel market in the middle east expected
to earn $98 billion+ in revenue by 2017
Introduction
Hospitality
Travel
Supporting
Businesses
Financial
Performance
Investments
23
Source: Statista; Allied Market Research; Euro Monitor; Amadeus; OTA Strategy Team (2017)

Online Travel: Real Growth Opportunity
By global standards, Saud Arabia holds much promise for online travel sales
40%29%
27%25%
19%15%
13%7%
6%
TurkeyUSA
IndonesiaSaudi Arabia
RussiaUAE
IndiaSouth Korea
UK
Growth in online travel sales, 2013-2016 CAGR ($)
KSA is one of the
fastest growing
markets in the
world
Online Lodging Expenditure, 2016, $ per transaction
KSA customers are
among the top
spenders per
transaction
Number of online transaction per 100 inhabitants (avg 7)
There is significant
room for more
transactions in the
KSA
1,457917
719667
655263
200128
49
Russia
UAESaudi Arabia
IndonesiaUK
USAGermany
TurkeyIndia
7358
4717
1511
103
1
UKAustralia
Turkey
USAUAE
GermanyIndia
Saudi ArabiaIndonesia
Source: Euromonitor; Renaissance Capital estimates
Introduction
Hospitality
Travel
Supporting
Businesses
Financial
Performance There is a significant opportunity for ATG to increase the number of online travel sales transactions by…
- Improving the online customer user experience…
- Increasing marketing reach…
…to its customer segments across the Saudi Arabian population and those of its international target markets
Investments
OPPORTUNITIES
24

Investments
Introduction Hospitality Travel Investments
Supporting
Businesses
Financial
Performance

2
Al Tayyar
Travel Group
manages a portfolio of
other assets and
enterprises with significant
upside potential and
attractive valuation

Investments: Snapshot
22 investments grouped by 4 main clusters where ATG has a mix of minority,
majority and full ownership
TRAVEL
18 ventures
Conduct performance reviews and regular monitoring to identify right opportunities to
determine the best approach for each investment in the short and long-term
Introduction
Hospitality
Travel
Supporting
Businesses
Financial
Performance
E-COMMERCE2 ventures
REAL ESTATE1 ventures
MOBILITY1 venture
Investments
27

Investments: Success Stories
ATG has made some successful acquisitions by investing in businesses that have attractive returns & market scale
▪ The Portman/Clarity combination is #9 Travel
Management Company (TMC) in the UK
▪ Access to corporate clients in new markets
with technology-enabled cost synergies
▪ Market leader in the MENA region; 10
million registered users in 60 cities
▪ Growth has been exceptional: daily active
users surged 1,800% between 2015–2017
Introduction
Hospitality
Travel
Supporting
Businesses
Financial
Performance
(Acquired stake in 2014)
Investments
(Acquired in 2016)
Valuation reached ~$1 billion
(one of the first MENA-based
Unicorns) making our 14.7%
stake more valuable
Consolidation underway in mid-
market segment in the UK,
making the now larger TMC
more attractive
28

Introduction Hospitality Travel InvestmentSupporting
Businesses
Financial
Performance
Supporting Businesses

2
Al Tayyar
Travel Group
invests in businesses that
are complementary to the
Company's core activities
and focuses on services
that deliver stable returns
and contribute shareholder
value
Introduction
Hospitality
Travel
Supporting
Businesses
Financial
Performance
Investments
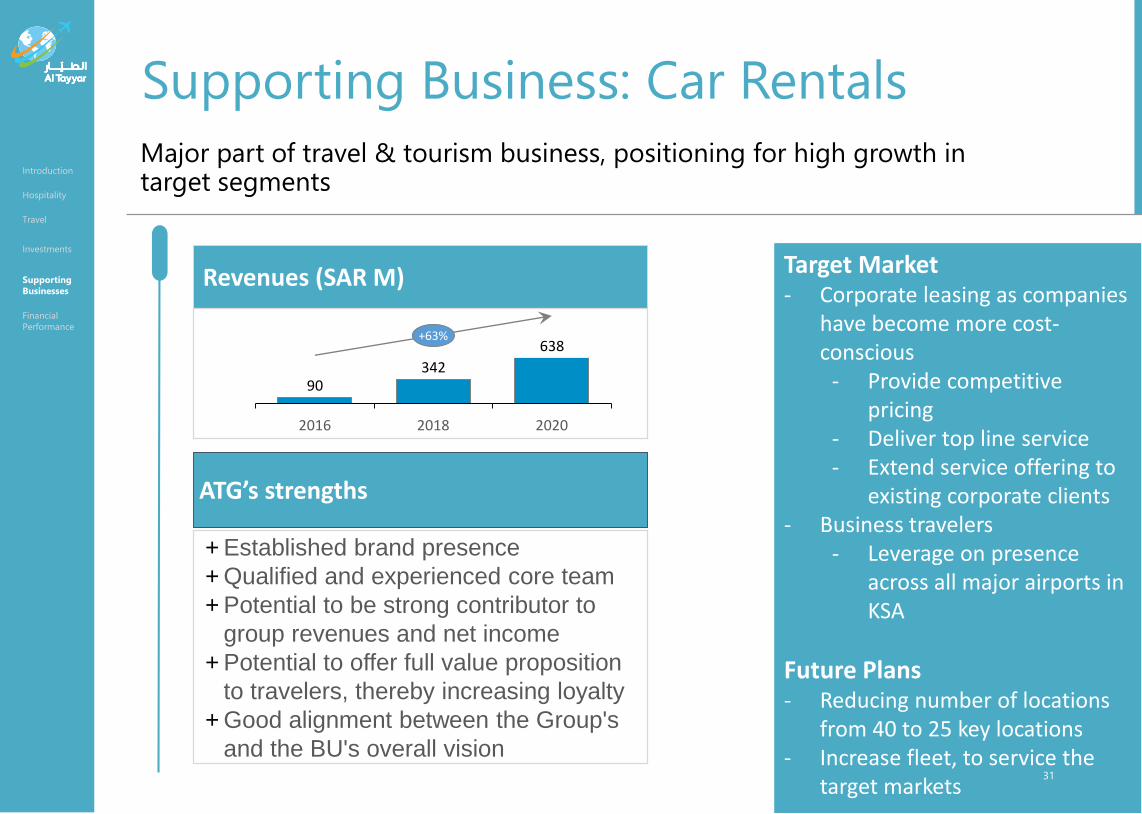
Supporting Business: Car Rentals
Major part of travel & tourism business, positioning for high growth in target segments
+ Established brand presence
+ Qualified and experienced core team
+ Potential to be strong contributor to
group revenues and net income
+ Potential to offer full value proposition
to travelers, thereby increasing loyalty
+ Good alignment between the Group's
and the BU's overall vision
ATG’s strengths
Revenues (SAR M) Target Market - Corporate leasing as companies
have become more cost-conscious
- Provide competitive pricing
- Deliver top line service - Extend service offering to
existing corporate clients - Business travelers
- Leverage on presence across all major airports in KSA
Future Plans - Reducing number of locations
from 40 to 25 key locations - Increase fleet, to service the
target markets 31
90342
638
20182016 2020
+63%

Financial Performance
Introduction Hospitality Travel
Corporate
Ventures
Supporting
Businesses
Financial
Performance

Introduction
Hospitality
Travel
Supporting
Businesses
Financial
Performance
Investments
Financial Performance
We are proactively addressing the need to change
33
-735
-2,422
-475
-4,000
-2,000
0
2014 2015 2016
Cashflow from Investing Activities, (SAR Mn)
8,421 9,376
5%
10%
15%
20%
0
5,000
10,000
15,000
2014
6,201
8%1,086
474
17%
1,459
2015
12%
2016
Total Debt & Assets (SAR Mn) - LHS
Debt-to-asset ratio (%) - RHS
Debt Asset
7,711 8,631 8,041
1,621 1,816 1,490
0
5,000
10,000
20152014 2016
Gross Sales & Gross Profit, (SAR Mn)
Gross Sales Gross Profit
Key Metrics Explanation
▪ Economic slowdown
▪ Government austerity measures
▪ 2014: Stake in Careem
▪ 2015: significant investment in Hospitality
such as Sheraton
▪ Ongoing: development of existing properties
▪ Sheraton acquisition debt-financed
▪ Short term financing to fund working capital
requirements

Introduction
Hospitality
Travel
Supporting
Businesses
Financial
Performance
Investments
Financial Performance: Q3 & 9M 2017
Higher sales driven by OTAs; lower revenue because of a decline in the average commission of travel services
34
Gross Sales
1,890 Mn
5,980 Mn
2,233 Mn
6,438 Mn
9MQ3
Revenue 523 Mn
1,680 Mn
489 Mn
1,529 Mn
Q3 9M
Net Income
186 Mn
678 Mn
131 Mn
480 Mn
9MQ3
2016
2017
Op Ex 147 Mn
547 Mn
184 Mn
470 Mn
Q3 9M
2016
2017
Net Margin
36% 40%27% 31%
Q3 9M
2016
2017
2016
2017
2016
2017

Introduction
Hospitality
Travel
Supporting
Businesses
Financial
Performance
Investments
Financial Performance: Q3 & 9M 2017
Over the years we have expanded our balance sheet and will continue to optimize it in order to better capitalize on the opportunities emerging in the future
35
Total Assets
6,201
8,421
9,376
2014 2015 2016
6,153
2,599
1,004
442
9M 2017
10,198
Total Liabilities & Shareholder’s Equity
6,010
1,897
1,672
412
34 173
9M 2017
10,198
Other Liabilities
Minority Interest
Deferred Revenue
Trade & Other Payables
Bank Debts
Shareholder’s Equity
Fixed Assets
Cash & Bank
Prepayments & Advances
Trade & Other Receivables18%

Al Tayyar Group
www.altayyargroup.com