corporate executive board - iis windows...
TRANSCRIPT
CORPORATE EXECUTIVE BOARDWhat the Best Companies Do™
FEBRUARY 2009

2
The following slides are accompanied by an oral description and elaboration of this information, which
constitutes an essential part of this presentation. Persons should not rely on or analyze these slides without
reference to the oral part of this presentation. Except as otherwise expressly indicated in this presentation,
all the information in the presentation refl ects historical results. While this information is believed to be
representative of the issues discussed in this presentation, past results and trends may not be indicative of the
future, and the Company hereby disclaims any representation, regardless of whether express or implied, to
the contrary. Any information in this presentation relating to future performance, growth, or operating results
constitutes a forward-looking statement within the meaning of the Private Securities Litigation Reform Act.
Actual future performance or results may vary, perhaps materially, from those indicated herein, based on
a variety of factors. Those factors include, but are not limited to, the Company’s dependence on renewal of
membership-based services, dependence on key personnel, the need to attract and retain qualifi ed personnel,
risks arising from the management of growth, new product development, competition, risks associated with
anticipating market trends, industry consolidation, variability of quarterly operating results, factors that
could aff ect the estimated tax rate, and possible volatility of the Company’s stock price. The statements in this
presentation are made as of 10 February 2009, and the Company undertakes no obligation to update any of the
forward-looking information made in this presentation, whether as a result of new information, future events,
changes in expectations, or otherwise.
SECURITIES LAW DISCLAIMER

3
THE EXBD INVESTMENT PROPOSITION
EXBD develops and delivers an unparalleled set of resources to executives and professionals in the fi ve core decision centers of the world’s largest corporations.
The economics of EXBD’s business model allow for development of products and businesses with attractive fi nancial characteristics.
Expanding support for teams in core decision centers, continuing penetration of new markets, and versioning products to support critical decision points, positions EXBD for sustainable growth.
In 2009, EXBD will protect vital relationships and strengthen its growth outlook by streamlining the product portfolio, implementing a proven integrated service and sales model, and investing in critical technology and branding capabilities.
Debt free E
High visibility revenue E
Strong cash fl ow E
High and consistent operating margins E

4
Product Economics
Renewable revenue stream E
Scalable operating cost Estructure
Strong, interrelated brands Ethat support corporate decision centers
Resources that travel Eacross a professional’s career
TARGETING THE FIVE CORE DECISION CENTERS OF THE WORLD’S LARGEST CORPORATIONS
EXBD AT A GLANCE
Marketing
IT
FinanceLegal
HR
CXO
Key Direct Reports
Divisional/Operational
Support
Professionals
Corporate Leadership
Council, Human Resources Executive Forum
Benefi ts Roundtable,
Leadership and Development Roundtable
CLC-Genesee, Employee
Satisfaction Tool (ESAT)
Toolbox for HR®, HR Leadership
Academy
Product Characteristics
Targets clearly identifi able Epoint of sale
Supports recurring, Ehigh-dollar value decision/processes
Provides globally relevant Edecision-making support
Builds proprietary, Enetwork-enabled dataand intellectual property
1993: Human Resources
1983: Financial Services
1994
1995
1996: Finance
2004: India
2005: Middle Market
2006
2007: AsiaPAC
1997: ITMarketing
Europe1998
1999: Legal

5
AN UNPARALLELED SET OF RESOURCESUnparalleled Set of Resources
Economically Sound Business Model
Positioned for Sustainable Growth
Protecting Vital Relationships
World-class IP and resources for executives to leverage across every major decision they face
More than 40 programs, 5,100+ Eunique clients
200 new studies, 300,000+ corporate Epractices
Delivery systems that match actionable business insights to professional outcomes
7,500 education sessions; E187,000 attendees
Daily news feeds E
159,000 unique Web site users with E2 million+ downloads
Expansive intellectual and data assets to support professionals throughout their careers
More than 150 new benchmarking datasets E
More than 100 new analytic tools (e.g., EInvestor Message Absorption Diagnostic, Recruiting Executive Dashboard, LiquidityEdge)
Unprecedented executive network that spans functions, industries, and geographies
More than 80% of the Fortune 500 E
More than 190 executive discussion Egroups
1.5 million registered ITtoolbox.com users E

6
DELIVERING EXCEPTIONAL VALUE
FASTER
BETTER
SUPERIOR OUTCOMES
“If we hadn’t had this insight from CLC, I feel we would have risked
choosing the wrong vendor due to our lack of knowledge on the
topic. As it was, we saved an estimated 30–50% of the time we
would have otherwise spent.”
“It’s a wonderful way, when you’re
trying to execute on change, not to
have to reinvent the wheel.”
“My category leaders can
quantify the savings/cost avoidance
directly related to our PSC supplier
management engagement at more
than $1.5M in 12 months.”
“In diffi cult times, people who maintain investments in
themselves and their companies will win out over others
who chose to retrench. Now is not the time to retreat from
vision and ideas. Quite the reverse. I need all the fresh ideas
I can get. And it’s investment in those ideas that will lead to
sustained competitive advantage.”
“The current state of the economy has added pressure to all areas
of the business. We are making every eff ort to be common sense
stewards of our resources. Understandably this leaves less funding for
formal training; however, I found the CLC resource to be a great low-
cost solution to support self development…Thank you again for your
forward thinking and commitment to growth and self-development.”
Unparalleled Set of Resources
Economically Sound Business Model
Positioned for Sustainable Growth
Protecting Vital Relationships
“It permits me to do a reality
check of my team’s processes and
organization. It helps us to be more
effi cient and make sure that we aren’t
missing the boat on important ideas.”

7
Unparalleled Set of Resources
Economically Sound Business Model
Positioned for Sustainable Growth
Protecting Vital Relationships
SERVING THE WORLD’S PREMIER EXECUTIVE NETWORK
5,100+Global
Enterprises
50+Countries
120,000+Executives andProfessionals
80%of the
Fortune 500 Companies

8
HIGHLY VISIBLE REVENUE = SUPERIOR COST MANAGEMENT
Deferred Revenue
55%
Renewals 30%
New Business
Total Annual
Revenue
CEB Revenue
Large Corporate Client Renewal Rate
~85% of Annual
Revenue Visible
1 January
2004 2005 2006 2007 20080.0%
25.0%
50.0%
75.0%
100.0%91.0% 92.0% 92.0% 92.0%
88.0%
15%
85%
100%
Unparalleled Set of Resources
Economically Sound Business Model
Positioned for Sustainable Growth
Protecting Vital Relationships
9
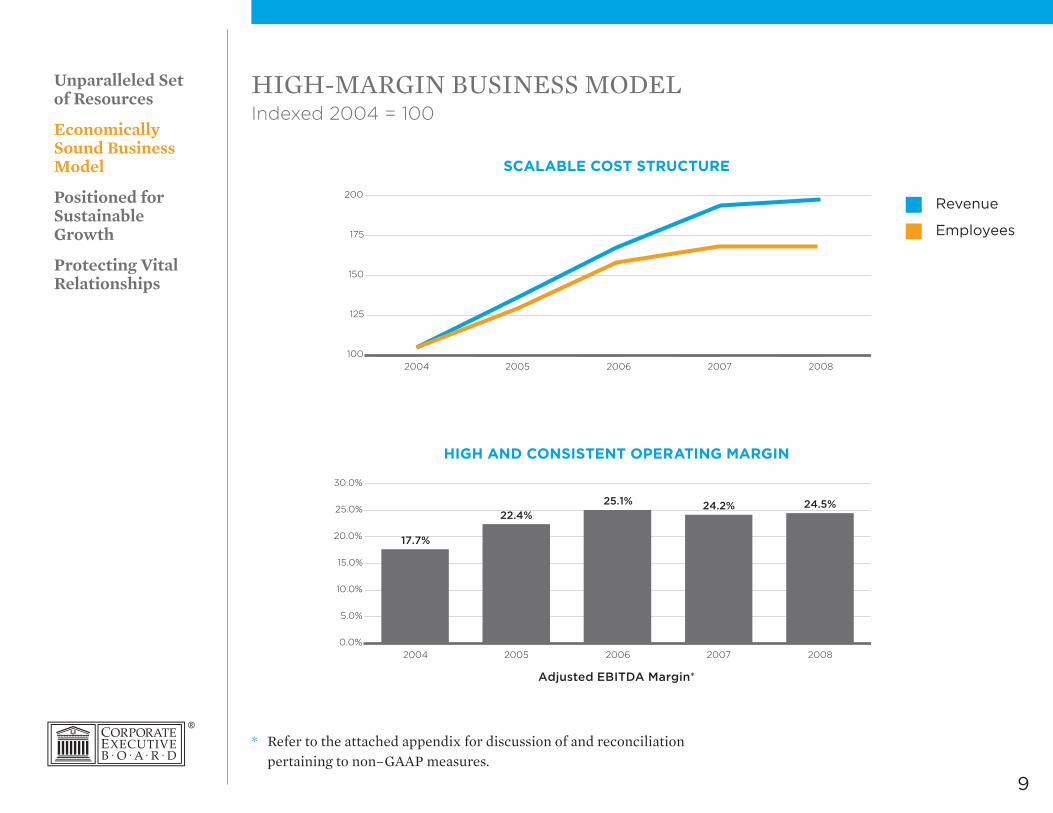
HIGH-MARGIN BUSINESS MODELIndexed 2004 = 100
2004 2005 2006 2007 20080.0%
5.0%
10.0%
15.0%
20.0%
25.0%
30.0%
17.7%
22.4%25.1% 24.2% 24.5%
Revenue
Employees
Adjusted EBITDA Margin*
HIGH AND CONSISTENT OPERATING MARGIN
SCALABLE COST STRUCTURE
2004 2005 2006 2007 2008100
125
150
175
200
Unparalleled Set of Resources
Economically Sound Business Model
Positioned for Sustainable Growth
Protecting Vital Relationships
* Refer to the attached appendix for discussion of and reconciliation pertaining to non–GAAP measures.

10
A STRONG CASH-GENERATING CAPABILITY
Net Income
Depreciation and
Amortization
Averaging 24.6%
Adjusted EBITDA Margin*
2006–2008
~2% of Revenue
More than 85% of
Members Prepay
1.1x ~ 2.0x Adjusted
Net Income* 2003–2008
2–3% Revenue
EBITDA
Stock-Based Comp
Deferred Income Tax
Change in Working Capital
Cash Flow from Operations CAPEX
Free Cash Flow
Unparalleled Set of Resources
Economically Sound Business Model
Positioned for Sustainable Growth
Protecting Vital Relationships
* Refer to the attached appendix for discussion of and reconciliation pertaining to non–GAAP measures.

11
MARKETINGITLEGALFINANCE
SIZING EXBD’S MARKET POTENTIALUnparalleled Set of Resources
Economically Sound Business Model
Positioned for Sustainable Growth
Protecting Vital Relationships
HR
SEGMENT CHARACTERISTICS EXAMPLESPOTENTIAL HR
FUNCTION SPEND PER INSTITUTION
EXBD MARKET
POTENTIAL
GLOBAL ENTERPRISES
~750 INSTITUTIONS
$10 B+ REVENUE
Globally distributed Einstitutions with multiple business units
Strategic focus E
Large teams with executive Elevel sub-functions defi ned
Pfi zer
Pepsico
Samsung
General Electric
$500 K–$1 M $375M–$750M
LARGE ENTERPRISES
~4,000 INSTITUTIONS
$1 B–$10 B REVENUE
Single location or small Esubsidiaries structure
Established functions with Eemerging sub-functions
Smaller teams with shared Eresponsibilities
Heinz
Avon
Limited Brands
Novo Nordisk
$100 K–$150 K $400 M–$600 M
MIDSIZED ENTERPRISES
~17,000 INSTITUTIONS
$100 M–$1 B REVENUE
Single location E
Emerging functions Eand sub-functions
Very small teams E
Choicepoint
Scholastic
Polycom
$20 K–$40 K $300 M–$600 M
TOTAL HR FUNCTION MARKET POTENTIAL $1 B–$2 B
12
1994 1996 1998 2000 2002 2004 2006 2007 2008
$17.0$36.9
$86.8
$171.0
$335.3
$425.4
$576.8
$725.5
$689.9
Compensation
Information Security
Investor Relations
Real Estate
Recruiting
Shared ServicesApplications
Learning and Development
Compliance
Controller
Sales
Benefi ts
Infrastructure
Treasury
Procurement
R&D
Legal
Finance
IT
StrategyHR
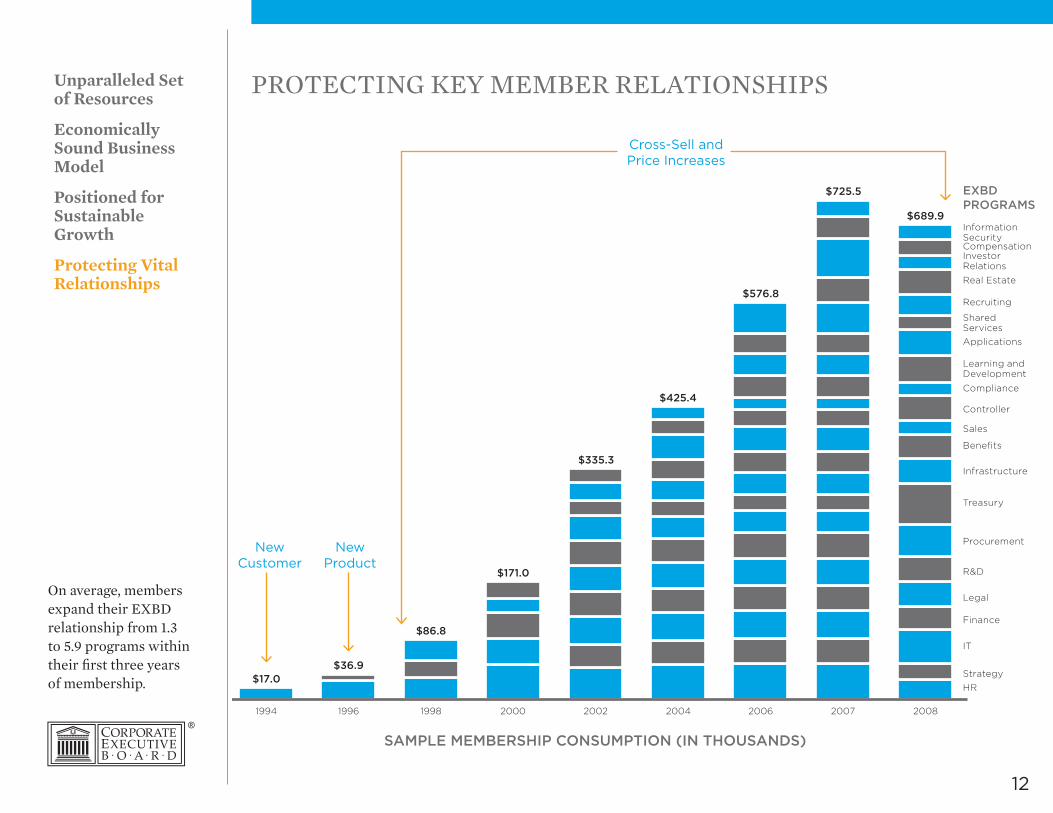
PROTECTING KEY MEMBER RELATIONSHIPS
New Customer
New Product
Cross-Sell and Price Increases
SAMPLE MEMBERSHIP CONSUMPTION (IN THOUSANDS)
EXBD PROGRAMS
Unparalleled Set of Resources
Economically Sound Business Model
Positioned for Sustainable Growth
Protecting Vital Relationships
On average, members expand their EXBD relationship from 1.3 to 5.9 programs within their fi rst three years of membership.

13
FOCUSING ON FOUR KEY GROWTH AREAS IN 2009
1 Protect the core economics of EXBD’s business through careful cost management.
2 Engage and grow unparalleled networks in EXBD’s fi ve core domains by leveraging an integrated sales and service model.
3 Version the existing EXBD product set for key new markets.
4 Launch new products that target new decisions and decision makers in EXBD’s fi ve core domains.
Unparalleled Set of Resources
Economically Sound Business Model
Positioned for Sustainable Growth
Protecting Vital Relationships

FINANCIAL HIGHLIGHTS

15
FINANCIAL HIGHLIGHTS
OPERATING STATISTICS
DEC. `05 DEC. `06 DEC. `07 DEC. `08
NUMBER OF INSTITUTIONS 2,831 3,739 4,711 5,114
NUMBER OF MEMBERSHIPS 10,825 14,190 16,349 15,747
MARKET METRICS
LARGE CORPORATE CLIENTS
CLIENTS 3,653 3,685
RENEWAL RATE 92% 88%
CROSS-SELL RATIO 4.03 3.63
MIDDLE MARKET CLIENTS
CLIENTS 1,136 1,508
RENEWAL RATE 80% 71%
CROSS-SELL RATIO 1.44 1.58

16
YEAR-TO-DATE FINANCIAL PERFORMANCE
STATEMENT OF OPERATIONS AND CONTRACT VALUE(In thousands, except per share amounts)
YEAR ENDED31 DEC 2007
YEAR ENDED31 DEC 2008
2007–2008GROWTH
REVENUE $532,716 $558,352 4.8%
ADJUSTED NET INCOME1 $80,587 $70,259 (12.8%)
GAAP EARNINGS PER DILUTED SHARE $2.17 $1.48 (31.8%)
NON-GAAP EARNINGS PER DILUTED SHARE1 $2.17 $2.05 (5.5%)
ADJUSTED EBITDA1 $128,724 $136,627 6.1%
CONTRACT VALUE2 $526,386 $487,107 (7.5%)
1 Refer to the attached appendix for discussion of and reconciliation pertaining to non-GAAP measures.
2 We defi ne “Contract Value” as of the year end as the aggregate annualized revenue attributed to all agreements in eff ect on such date, without regard to the remaining duration of any such agreement.

17
This Appendix and the accompanying tables include a discussion of EBITDA, Adjusted EBITDA, Adjusted
net income and Non–GAAP earnings per diluted share, which are non–GAAP fi nancial measures provided
as a complement to the results provided in accordance with accounting principles generally accepted in the
United States of America (“GAAP”). The term “EBITDA” refers to a fi nancial measure that CEB defi nes as
earnings before interest income, net, income taxes, and depreciation and amortization. The term “Adjusted
EBITDA” refers to a fi nancial measure that CEB defi nes as earnings before interest income, net, income taxes,
depreciation and amortization, impairment loss, and restructuring costs. “Adjusted net income” refers to Net
income excluding the eff ect, net of tax, of the impairment loss and restructuring costs. “Non_GAAP earnings
per diluted share” refers to Net income excluding the per share eff ect, net of tax, of the impairment loss and
restructuring costs.
These non–GAAP measures may be considered in addition to results prepared in accordance with GAAP, but
should not be considered a substitute for, or superior to, GAAP results. Furthermore, CEB intends to continue
to provide these non–GAAP fi nancial measures as part of the company’s future earnings discussions and,
therefore, the inclusion of these non-GAAP fi nancial measures will provide consistency in CEB’s fi nancial
reporting. A reconciliation of these non–GAAP measures to GAAP results is provided on the following page.
APPENDIX

18
APPENDIX2004 2005 2006 2007 2008
REVENUE $280,724 $362,226 $460,623 $532,716 $558,352
ADJUSTED EBITDA
NET INCOME $53,656 $75,060 $79,171 $80,587 $50,791
DEPRECIATION AND AMORTIZATION 6,782 7,308 10,381 15,573 21,895
INTEREST INCOME, NET (9,936) (13,588) (23,566) (14,937) (4,268)
PROVISION FOR INCOME TAXES 26,729 38,550 49,561 47,501 36,957
EBITDA 77,231 107,330 115,547 128,724 105,375
SHARE BASED COMPENSATION (27,573) (26,370) – – –
IMPAIRMENT LOSS – – – – 23,246
RESTRUCTURING COSTS – – – – 8,006
ADJUSTED EBITDA $49,658 $80,960 $115,547 $128,724 $136,627
ADJUSTED EBITDA MARGIN 17.7% 22.4% 25.1% 24.2% 24.5%
2007 2008
ADJUSTED NET INCOME
NET INCOME $80,587 $50,791
IMPAIRMENT LOSS, NET OF TAX – 14,664
RESTRUCTURING COSTS, NET OF TAX – 4,804
ADJUSTED NET INCOME $80,587 $70,259
2007 2008
NON-GAAP EARNINGS PER DILUTED SHARE
GAAP EARNINGS PER DILUTED SHARE $2.17 $1.48
PER SHARE EFFECT OF IMPAIRMENT LOSS, NET OF TAX – 0.43
PER SHARE EFFECT OF RESTRUCTURING COSTS, NET OF TAX – 0.14
NON-GAAP EARNINGS PER DILUTED SHARE $2.17 $2.05

WASHINGTON, D.C. • LONDON • NEW DELHI • CHICAGO • SAN FRANCISCO • TORONTO • ROCHESTER • SCOTTSDALE • WEST CHESTER • SYDNEY
WWW.EXECUTIVEBOARD.COM
CORPORATE EXECUTIVE BOARD