corporate bond trading costs and practices - university of notre
TRANSCRIPT
Corporate Bond Trading Costs and Practices:
A Peek Behind the Curtain
Paul Schultz
University of Notre Dame
November, 1998
Very preliminary. Do not cite without author’s permission
Financial support from TIAA-CREF, The University of Chicago, and The University of NotreDame made this paper possible. Steve Sterman provided helpful background information on thecorporate bond market. I am responsible for any remaining blunders, etc.
1
1. Introduction
The corporate bond market in the United States is very large. According to the Securities
Industry Association (1998), there were $3.2 trillion in corporate bonds outstanding as of the 3rd
quarter of 1997. Accurate data on the amount of corporate bond trading is difficult to find, but
the Securities Industry Association (1994) estimates that institutional corporate bond trading
averaged $46.1 billion dollars per day during 1993, a dollar volume easily greater than that of
the equities traded on the New York Stock Exchange (NYSE).
Institutions dominate this market and their participation has been growing. As recently as
1993, individuals owned 14 percent of corporate debt. By the third quarter of 1997, individual
ownership of corporate bonds was estimated to have declined to 9 percent of the total while
institutions were estimated to own the other 91 percent. Among institutions, life insurance
companies are the biggest debtholders with about 32 percent of all corporate bonds in their
portfolios. Private pension funds hold almost 10 percent of outstanding corporate debt while
foreign institutions own 16 percent of U.S. corporate bonds. Public pensions, mutual funds,
banks, other insurance companies and savings institutions also hold significant proportions of the
U.S. corporate debt.
Almost all secondary bond trading takes place over-the-counter. While some active bonds
are quoted on the NYSE, that market is regarded as the odd-lot market for bonds. The Securities
Exchange Commission (1992) estimates that only .5 percent to 1 percent of corporate bond
volume took place on the NYSE in 1990.
The secondary market for corporate bonds resembles the pre-Nasdaq market for equities.
An institution seeking quotes for a specific bond cannot see all quotes for the bond in one place.
Instead, the institution must make several calls to a number of dealers for quotes. Alternatively,
institutions may broadcast a list of bonds to sell (or buy) to various dealers through Bloomberg
and invite bids. Or, dealers may broadcast quotes on lists of bonds in their inventory to potential
institutional customers. When dealers broadcast quotes, they are often on one side of the market
only. That is they provide bid or ask quotes but not both.
Most bonds trade so infrequently that dealers do not broadcast quotes for them. There is

2
usually an initial flurry of trading activity in a bond following its offering. Bond traders suggest
this occurs because bond offerings are typically underpriced by a small amount. As with equities,
flippers will buy bonds on the offering and sell shortly thereafter. Eventually though, bonds fall
into the hands of institutions who intend to hold them to maturity. Institutions buy bond issues in
sufficiently large quantities that even the largest issues can be held entirely by 200 or fewer
institutions. So, with the bonds in the hands of a small number of institutions who intend to hold
them to maturity, trading declines to almost nothing.
If an institution wants to sell or buy a bond that is not actively quoted, they can contact
dealers to provide quotes. If the issue is an investment grade bond, dealers are usually able to
provide a quote by comparing the bond to bonds with similar characteristics. Most of the
variation in the prices of investment grade bonds is a result of fluctuations in interest rates, so bid
and ask quotes for investment grade bonds are given in terms of additional yield over a treasury
security of similar maturity. The yield spread between the bond and the treasury security can be
estimated by comparing the bond with other bonds with similar maturities, coupon rates, bond
ratings and call provisions. High yield or junk bonds are more difficult to price. High-yield bonds
are quoted in dollar prices rather than a premium from treasury yields because they, like equities,
are affected primarily by firm-specific factors. Thus dealers cannot determine an appropriate
quote by comparing the bond to others of similar rating, coupon and maturity.
Because quotes are not automatically disseminated for these inactively traded bonds,
institutions sometimes find that they get very different quotes for the same bond from different
dealers. This is especially true for high-yield or junk bonds. This problem is aggravated by a
dearth of information on bond market trades. Trade reports are not disseminated, so institutions
have no idea if they are paying more or less than others for the same or similar bonds.
When the bond market is compared to the other security markets, the lack of
transparency is striking. In a speech on September 9, 1998, Securities and Exchange Commission
Chairman Arthur Leavitt remarked that
“The sad truth is that investors in the corporate bond market do not enjoy thesame access to information as a car buyer or a homebuyer or, dare I say, a fruitbuyer. And that’s unacceptable. Guesswork can never be a substitute for readilyavailable price data.”

3
The absence of transparency in this market has become a matter of concern to regulators and
some practitioners because it is feared to lead to higher transaction costs. A Wall Street Journal
article of September 21, 1998 quotes Kevin McClintock, head of taxable fixed income at Dreyfus
Corp that
“ I would certainly favor a centralized location reporting all trade prices, but theWall Street community will fight it like crazy because an inordinate amount ismade in the bond-trading business due to large spreads.”
In September 1998, the House Committee on Commerce began hearings on bond market
transparency. However, regulatory reform of the corporate bond market is hampered by a lack of
hard data on bond trading costs and practices. There is almost no academic research on the costs
of bond trading faced by institutional investors. This is no doubt a result of a lack of data on
dealer quotes and transaction prices that reflects the opaqueness of the market.
In this paper, I employ a large sample of institutional bond trades over 1995-1997 to
describe institutional trading practices and provide some first estimates of trading costs in the
over-the-counter fixed income market. I estimate round-trip trading costs investment grade bonds
to be about $2.60 per bond. These costs are slightly higher than the estimates produced by Hong
and Warga (1998), the only other recent study of trading costs in the over-the-counter bond
market. They employ a small sample of 2,779 buy and sell trade prices for the same bond on the
same day and produce an estimate of the effective spread of 7.8¢ per hundred dollar par value
for investment grade bonds and 19.1¢ per hundred dollar par value for non-investment grade
bonds. I also find that costs decline with trade size and larger institutions seem to pay less all
else equal. I show that some institutions seem to develop relationships with some dealers. This is
reflected in a disproportionate number of their trades between some dealers and institutions.
However, I find that trading costs are not decreased when institutions trade with the dealers that
they trade with most frequently.
The findings of this paper complement recent work on the costs of institutional equity
trading by Keim and Madhavan (1997) and Chan and Lakonishok (1997). This research provides
independent tests of the role of order size and institutional identity on trading costs. In addition,
institutions with private information are less likely to trade bonds than stock. Bond trading costs

4
provide a rough benchmark to measure the adverse selection component of institution’s equity
trading costs.
The remainder of the paper is organized as follows. In Section 2 I provide information on
the data used here. Section 3 reports different estimates of trading costs for corporate bonds. In
Section 4 the effects of trade size and dealer and institutional identity on trading costs are
examined. Section 5 offers a summary and conclusions.
2. Data
Data on bond trades is obtained from Capital Access International. The data consists of
trades of corporate bonds over 1995 - 1997. The record for each trade consists of the trade date,
the identity of the institution, the identity of the dealer, the bond’s cusip number, the firm issuing
the bonds, a description of the bonds, the coupon rate, the maturity date, whether the trade is a
buy or sell, the face value of the traded bonds and the actual dollar value of the trade. The ratio of
these last two variables provides the trade price as a percentage of the bond’s face value. Capital
Access also provides an indicator variable that says whether each trade date is the actual trade
date or whether the date is an estimate provided by Capital Access. Trades with estimated dates
are not included in transaction cost estimates.
Capital Access obtains their data from several sources. Insurance companies are required
to file a Schedule D with the National Association of Insurance Commissioners every quarter.
Information on all bond market transactions, including the trade date, amount bought or sold, and
the par value of the bonds traded is included in this schedule. Capital Access obtains Schedule D
information from A.M. Best & Co. and provides further cleaning and checking of this data.
Information on insurance company trades appears relatively complete, which is important
because life insurance companies by themselves hold 32 percent of corporate bonds. Mutual fund
managers are required to file bondholding information semiannually and some file quarterly.
Capital Access collects mutual fund information directly and also receives information from
Morningstar. Public pension funds are not required to file holdings but Capital Access obtains
information on their trades through voluntary disclosure and through the filing of Freedom of
Information Act forms.
5
There are several features of this data that make it well-suited for estimating institutional
bond-trading costs. Prices are trade prices rather than quotes and trades are designated as buys or
sells. The institution is named and the dealer handling each trade is identified. Finally, there are
thousands of trades included each month. Trading records are reasonably complete for insurance
companies and many mutual funds.
There are also severe limitations to this data. First, not all corporate bond trades are
included. For instance, foreign institutions hold about 1/6 of U.S. corporate bonds but their trades
do not show up in this data. Public pension fund trades are included, but Capital Access does not
claim to have data on all public pension funds. Second, the dollar value of trades is rounded up to
the nearest $1000 dollars. For small trades this could represent a significant amount of noise in
the prices, but most trades in my data set are for $1,000,000 or more. In calculating trading costs,
I look at differences in prices for buy and sell trades and the bias caused by rounding up trade
amounts should cancel when differences in buy and sell prices are examined. Third, the data does
not contain contemporaneous quotes and the trades are not time-stamped.
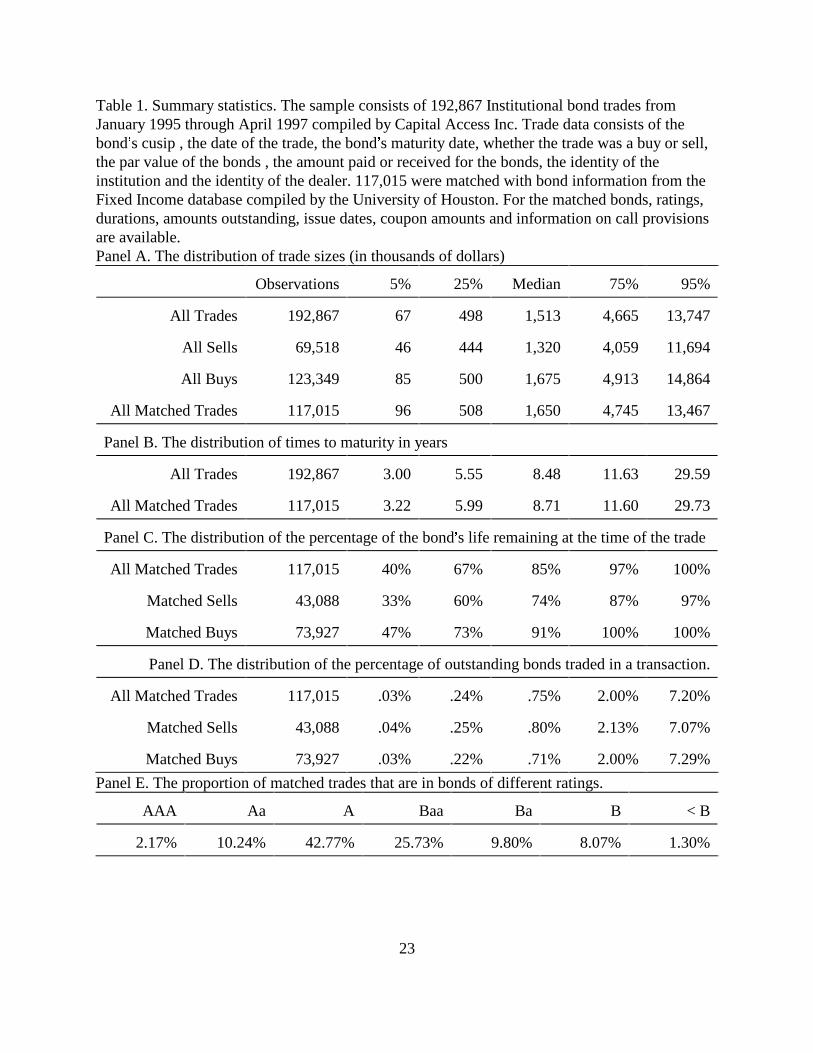
Table 1 provides a description of the trade data. Panel A reports the distribution of trade
sizes. There are a total of 192,867 trades from January 1995 through April 1997. In general,
trades are considerably larger than institutional equity trades. Keim and Madhavan (1997)
examine equity trades by 21 institutional investors over January 1991 through March 1993. The
median size buy order in their sample is $138,000 and the median size sell order is $386,000. In
contrast, the median dollar amount of the bond trades studied here is $1,513,000. The 25th
percentile of trade size is $498,000 and the 75th percentile is $4,665,000. Panel A also
demonstrates that buy orders are almost twice as common as sell orders and are usually a little
larger. The smaller number of sell orders reflects the practice of many institutions of holding
bonds to maturity and then reinvesting the principle. The last row of Panel A shows the
distribution of trade sizes for matched trades. These are trades that could be matched with
information from the Fixed Income Database. This data is compiled at the University of Houston
from data from Lehman Brothers on bonds that are included in their bond index. This data source
provides me with the issue date, maturity date, coupon yield, duration, convexity, Moody’s and
S&P ratings for each bond. This data set has been used in several other academic studies
6
including Hong and Warga (1998) and Blume, Lim and MacKinlay (1998). 117,015 of the total
of 192,867 trades in the Capital Access data could be matched with this data set. The matched
trades are slightly larger than the unmatched ones.
Panel B shows the distribution of times to maturity of the traded bonds. When all sample
bonds are considered, the median time to maturity was 8.48 years. The 25th and 75th percentiles
were 5.55 years and 11.63 years. The distribution of times to maturity is similar for bonds that
could be matched with the Fixed Income Data Set.
Practitioners claim that bonds only trade actively soon after they are issued. Panel C
examines this issue by providing the distribution of the percentage of the bond’s life that remains
at the time of the trade. This is calculated by taking the time to maturity at the time of the trade
and dividing by the time to maturity when the bond was issued. Issue dates are obtained from the
Fixed Income Database, thus the results reported in Panel C are based only on the 117,015 trades
that could be matched with information in that source. When all matched trades are considered,
the median percentage time to maturity when a trade is made is 85 percent of the time to maturity
at the bonds issue. Or, put another way, half of the trades in sample bonds issued with 20 years to
maturity took place in the first three years after the bonds were issued and the other half took
place in the remaining 17 years. A full quarter of the trades in the sample take place in bonds that
still have 97 percent of their life remaining. Sells are more likely when the bond has less of its
life remaining than buys, but the median percentage time to maturity when a sell occurs is still 74
percent of the time to maturity at the bonds issue.
These results are consistent with Alexander, Edwards and Ferri’s (1998) findings on the
trading of high-yield bonds in Nasdaq’s Fixed Income Pricing System. They show that volume is
much lower for bonds that have traded for more than two years. Part of the explanation for the
results in Panel C could be that there have been a lot of recent issues of debt and thus a
disproportionate number of the trades in 1995-1997 occurred in recently issued bonds. However,
Alexander, Edwards and Ferri (1998) cite anecdotal evidence that bonds are initially traded
frequently but that bond trading declines as they fall into the hands of investors who hold the
bonds to maturity.
Panel D of Table 1 shows the distribution of the percentage of the outstanding issue

7
traded in a transaction. Information on the number of bonds outstanding is obtained from the
Fixed Income Database, so attention is again restricted to the bonds that could be matched with
that database. When all trades are considered, the median trade consists of .75 percent of the
outstanding bonds of that issue. The 25th percentile of the percentage of outstanding bonds per
trade is .24 percent and the 75th percentile is 2.00 percent. Unlike equities, a typical institutional
bond trade is for a non-trivial proportion of the total outstanding bonds. The proportions in Table
1 suggest that entire bond issues are held by a relatively small number of institutions.
The distribution of bond ratings is reported in Panel E of Table 1. Again, attention is
restricted to the bonds that could be matched with the Fixed Income Database. About two-thirds
of the trades took place in bonds with Moody’s ratings of A or Baa. Only 1.30 percent involved
bonds with ratings that were lower than B.
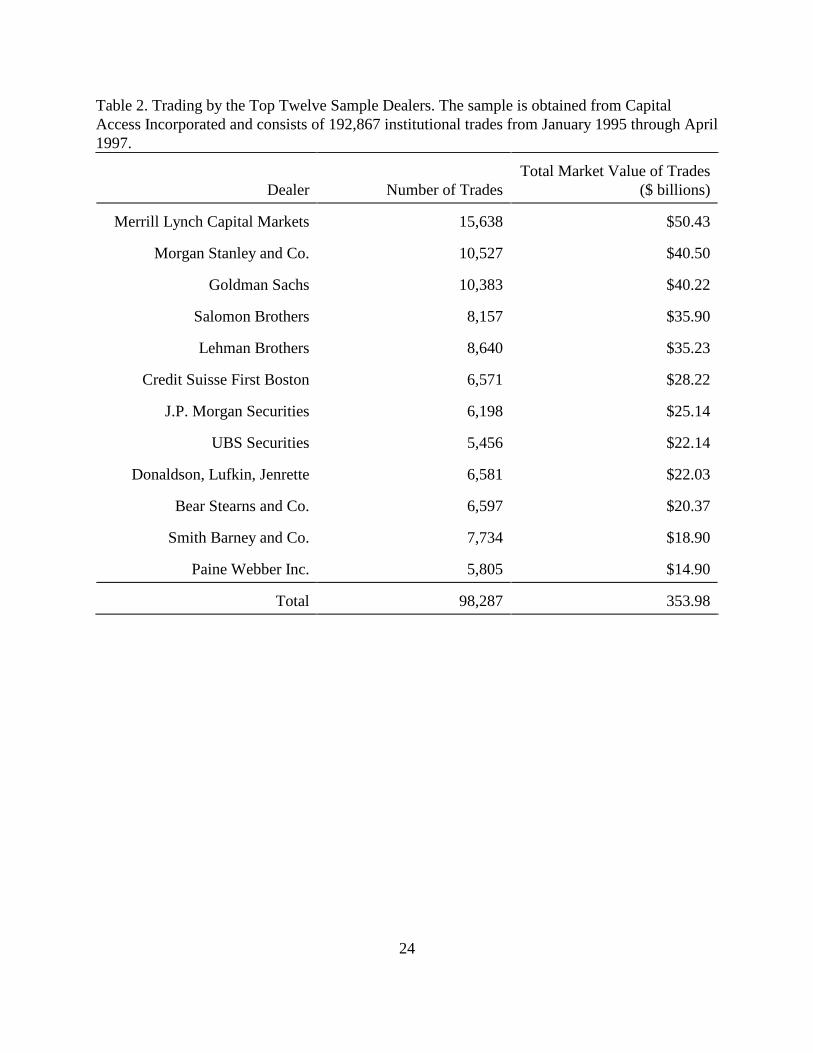
It is often reported that the over-the-counter bond market is dominated by a small number
of dealers. Table 2 shows the number of trades and dollar volume of trades for the 12 dealers
with the highest dollar volume of trades in the sample. In total, 601 dealers appear in the sample
and $690.36 billion dollars of bonds are traded. $169.43 billion dollars of trades are designated
as taking place with “various” dealers. That is, the institution used two or more dealers to
complete the purchases or sale of bonds. An additional $27.72 billion in trades were direct
placements of bonds from the company to the institution and did not require a dealer. This leaves
$493.20 billion in trades with an identified dealer. The top twelve dealers traded $353.98 billion
dollars worth of bonds or 72 percent of the total. Merrill Lynch tops the list with 15,638 trades
worth $50.43 billion, or 10.2 percent of the total. Morgan Stanley is second with 10,527 trades
worth $40.50 billion.
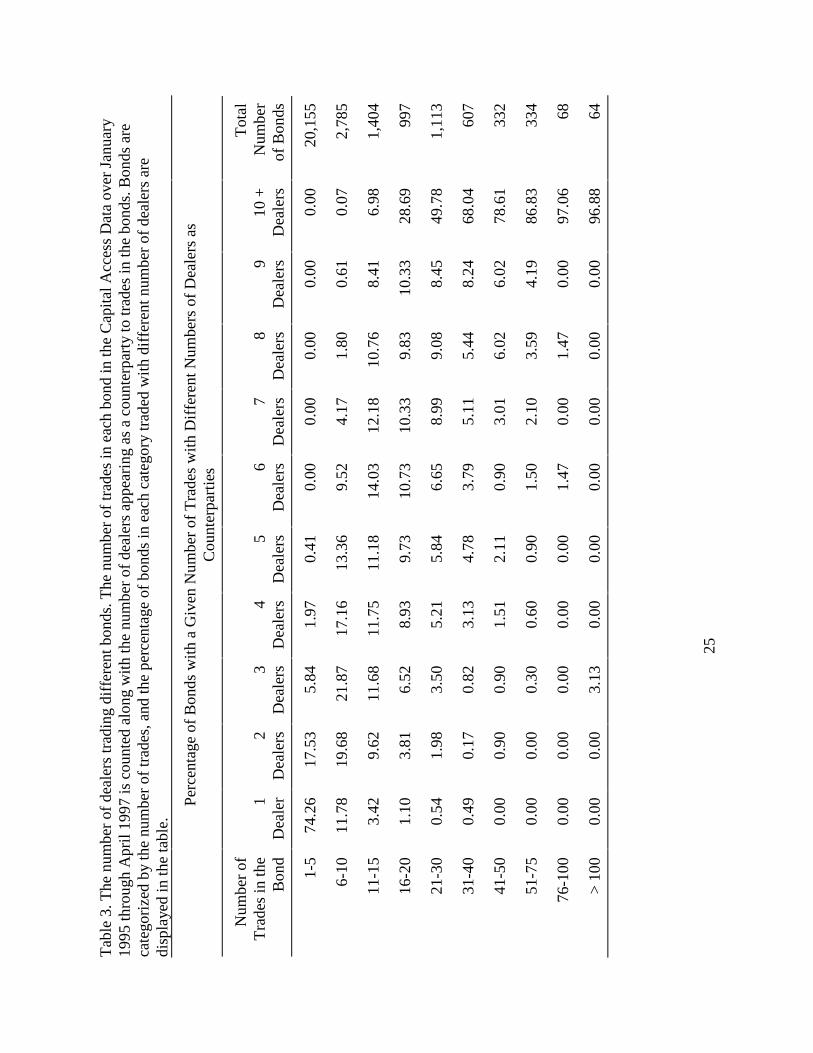
Although trading volume seems to be dominated by a relatively small number of dealers,
trading in specific bonds seems to be spread across multiple dealers. I count the number of trades
in each of the 27,859 bonds with at least one sample trade. I then sort bonds into ten categories
based on the number of sample trades in the bond. The majority of bonds in the sample, 20,155,
have only 1 to 5 trades. The number of bonds decreases for categories defined by larger numbers
of trades. There are only 64 bonds with over 100 sample trades. I next calculate the percentage
of bonds in each category that are traded with different number of dealers. Results are shown in
8
Table 3. Here we see that more than two-thirds of bonds with six to ten trades have three or
more dealers as counterparties to the trades. More than three-quarters of bonds with 40 to 50
trades have ten or more dealers involved in trades. Trading in individual bonds does not seem to
be dominated by specific dealers.
There are 957 institutions in the Capital Access sample with at least one trade over the
period and 384 institutions with 50 or more. Table 4 provides information on the trades of the 20
institutions with the largest total dollar amount of trades. Most of these companies are in the
insurance industry. The institution with the largest dollar trading volume is Prudential Capital
Management with 6,480 trades with an average value of $8,722,000. In total the 20 institutions’
trades total $381 billion, about 55 percent of the total dollar value of all bonds traded in the
sample. There are obvious differences in trading patterns across institutions. Mean trade sizes
among the 20 institutions vary from $2,603,000 for Conseco Capital Management to
$15,244,000 for TIAA-CREF. The proportion of trades that are sells also varies widely across
these institutions. Fewer than 25 percent of TIAA-CREF’s trades are sells while 34.8 percent of
Loews Corporation trades are sells. The relative shortage of sell orders reflects the institution’s
propensity to hold bonds to maturity and then reinvest the proceeds.
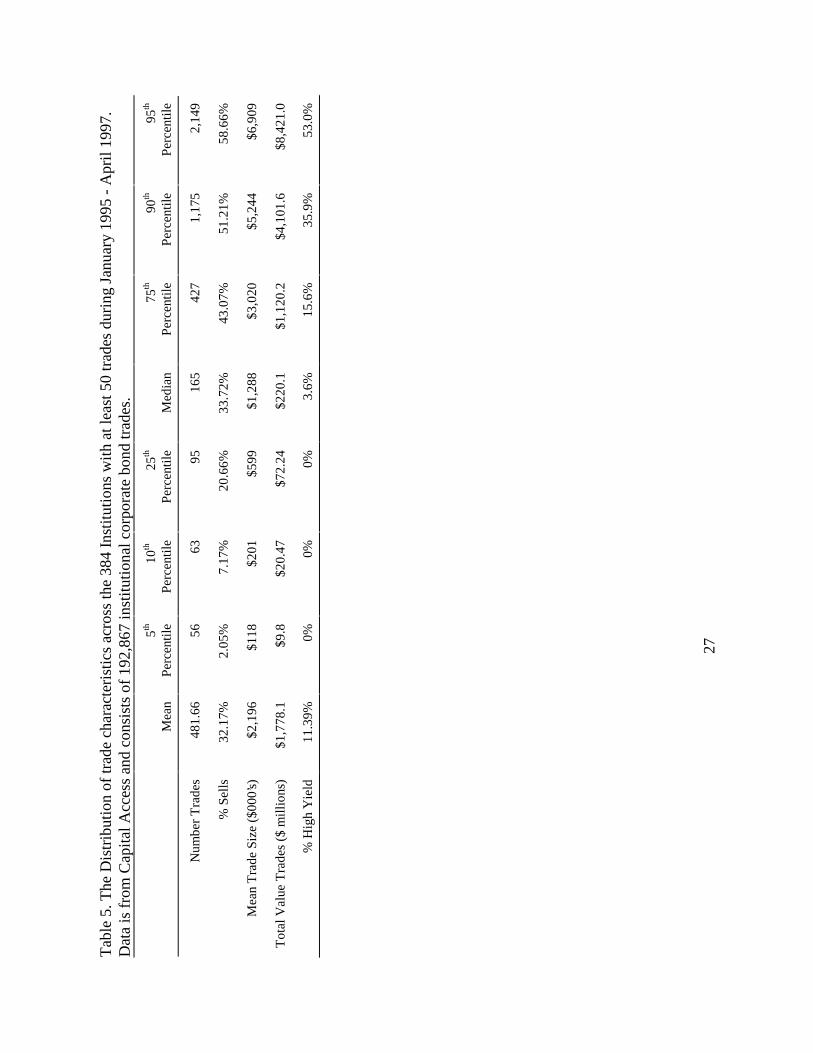
Table 5 shows the distribution of the number of trades, the percentage of trades that are
sell orders, the mean trade size and the percentage of trades that are in high yield bonds for the
384 institutions with at least 50 trades. The percentage of trades that are sells averages 32.17
percent across the institutional traders, but 10 percent of the sample institutions have 7.17 percent
or fewer sells and most trades are sells for about 10 percent of the sample institutions. Trade
sizes also vary considerably across institutions with 25 percent having an average trade size of
less than $600,000 and 25 percent having an average trade size of more than $3,000,000. Perhaps
the clearest differences across institutions is in the willingness to trade in high yield bonds. More
than 25 percent of the institutions do not conduct any trades in bonds with Moody’s rating lower
than Baa3. However, for 10 percent of the institutions more than 35 percent of trades are in high
yield bonds.
3. Estimates of Transaction Costs
9
3.1 Estimates from multiple trades in the same bond on the same day
The simplest and most direct way to estimate trading costs for a bond is to compare buy
and sell prices for the same bond on the same day. Matched trades occur at different times during
the day so this will be a noisy estimate. It seems unlikely that the non-synchroneity of matched
trades will impart any biases however. A possible source of bias though is that only the most
active bonds have both buy and sell trades on the same day. Thus, it is not clear whether
estimates obtained in this way can be extrapolated to other bonds. Nevertheless, this technique
provides a good starting point for estimating trading costs.
For every bond every day, I check to see if there are both buy and sell trades. The estimate
of the round-trip transaction costs is the difference between the buy and sell prices. If there is
more than one buy (sell) of a particular bond on a specific day, I use a weighted average of the
buy (sell) prices where the weights are the dollar value of the transactions. In total, I find 2,835
bond-days with both buys and sells. Transaction cost estimates are shown in Table 6.
When all buy-sell combinations are considered, the average round-trip transaction cost is
26.22 basis points, or $2.62 for each $1,000 bond. The t-statistic is 2.14, indicating that the
round-trip transactions costs estimate is significantly different from zero but is not estimated with
much precision. The following rows of the table provide estimates of round-trip transaction costs
by bond rating. With the exception of bonds rated lower than B, round-trip transactions cost
estimates are positive. Costs are estimated to be $2.07 per bond for AAA rated bonds, $1.38 per
bond for AA rated bonds, $3.92 per bond for A rated bonds, $1.87 for Baa bonds and $3.11 for
Ba bonds. However, as a result of the small sample size, the transaction cost estimates are not
estimated very precisely and are not significantly different from each other.
3.2 Can I obtain accurate estimates of bid quotes to use in measuring trading costs?
Only a small fraction of the buys in the sample can be matched with a sell in the same
bond on the same day. This results in imprecise estimates of trading costs. In addition, it is likely
that the pairs of trades that are uncovered are in the more active bonds. It is not clear whether the
trading cost estimates from these pairs can be extrapolated to other bonds. As an alternative, I
would like to use differences between trade prices and bid quotes to measure trading costs. The

10
idea is to separately calculate average differences between sell orders and bid quotes and between
buy orders and bid quotes. The difference between these differences is an estimate of the round-
trip trading costs.
In addition to providing the data on ratings, issue dates and other bond characteristics, the
Fixed Income Data Base compiled at the University of Houston from Lehman Brothers’ data
provides end-of-month bid quotes for thousands of corporate bonds. Hong and Warga (1998)
find that the dealer bid quotes from Lehman Brothers that are used in this data set are similar to
transaction prices from the NYSE’s Automated Bond System (ABS) but appear to be better
quotes. That is, the Lehman brothers bid quotes are usually higher than the ABS bids and
correspond more closely to actual transactions prices.
This data set appears to be the most complete and accurate source of data on corporate
bonds that is available to academics. It is not ideal for this study though. The major limitation of
the data is that quotes are provided at month-end only. This means that quotes within the month
have to be estimated or attention must be restricted to trades that occur at the end of the month. A
second limitation is that the data only includes bonds contained in the Lehman Brothers bond
index. Quotes are not available for less active bonds and recently issued bonds.
To determine trading costs for days other than the month end, I generate estimates of
daily bid quotes. Much of the change in corporate bond prices from day to day can be accounted
for by changes in the level of default-free interest rates, or, equivalently, by changes in the prices
of treasury bonds. Indeed, dealers quote investment grade bonds in terms of additional yield over
similar treasury bonds. Over short periods of time, high-grade corporate bond price changes are
expected to track changes in treasury bonds.
The Wall Street Journal provides closing bid prices each day of the sample period for
bonds (or notes) with one, two, three, five, seven, ten and twenty years to maturity. At the
beginning of each calendar month a bond (or note) is selected that is closest to each maturity. If
two or more bonds have the same maturity, I choose the bond with the price that is closest to par
on the last day of the preceding month.
The idea is to estimate bond quotes within a month by assuming the percentage price
change since the last available quote equals the price change observed in treasury bonds of

11
similar maturity. To see how well this works, I examine the monthly changes in quotes in the
Fixed Income Database. For each bond with quotes in consecutive months, I measure the
percentage price change over the month. A simple prediction of the price change is that it is the
same as the change in a treasury bond with the same maturity. To approximate that, I take a
weighted average of the changes in the treasury bonds with maturities that straddle the bond in
question. The weights are chosen so that the weighted average of the maturities equals the
maturity of the corporate bond. So, for example, the predicted change in a corporate bond that
matures in eight years will be a weighted average of the price changes of the bond that matures in
seven years and the bond that matures in ten years. Two-thirds of the weight will be on the bond
that matures in seven years. I use the change in the twenty year bond price to predict the change
in prices of bond with more than twenty years to maturity and the one year bond price change to
predict price changes for bonds with less than one year to maturity. The prediction error is
defined as the difference between the actual change in the quote and the change predicted by
assuming that the percentage change in the bond price is the same as the percentage change in the
treasury bonds of similar maturity.
Results are described in Table 7. Panel A breaks down price changes and prediction
errors by bond rating. The first column of that table gives the bond rating and the second gives
the number of monthly quote changes available for bonds with that rating. The following column
provides the mean prediction error, or the mean difference between the bond price change and
the change in treasury securities with the same maturity. These numbers, like other price changes
and prediction errors in the table are expressed in basis points of par value. So, for example, the
value of 3.19 for A bonds means that the average prediction error for A Bonds was 3.19 basis
points or 31.9¢ on a $1000 par value bond. This column gives an idea of the bias in using T-bond
price changes as a proxy for changes in corporate bond quotes. The mean prediction errors are
generally positive, which indicates that the yield spread between treasuries and corporate bonds
increased over most months during the sample period. The next column provides the mean price
change. Except for the small number of C and D rated bonds, the mean price change is positive.
This reflects the general decline in bond yields over this period.
The next two columns report the mean absolute price change and the mean absolute
12
prediction error. A comparison of these two columns provides the clearest indication of the
usefulness of treasury bond price changes for predicting changes in the corporate bond prices.
Mean absolute price changes are 100 to 150 basis points for most grades of bonds. This
represents an average monthly price change of about $10 to $15 on a $1000 face value bond. For
investment grade bonds, the mean absolute prediction error is typically one-half to one-third of
the mean absolute price change. Thus most of the price change for investment grade bonds is
captured by changes in treasury bond prices. Notice though that for bonds rated Ba3 and lower,
mean absolute prediction errors tend to actually exceed the mean absolute price changes.
The last two columns show the percentage of bond price changes that are predicted more
successfully with the change in treasury bonds than by predicting that bond prices will not
change at all. For bonds rated Baa3 and above, treasury bond changes beat a naive prediction
about 75 percent of the time. The average percentage of the price change explained by treasury
bond price changes is 50 percent to 65 percent for these bonds. This is calculated by subtracting
the mean absolute prediction error from the mean absolute price change and then dividing by the
mean absolute price change. For bonds rated B and below, the naive prediction that the bond
price will be the same at the end of the month as at the beginning usually comes closer to the true
value of the bond than when T-bond price changes are incorporated. Thus by this measure, the
percentage of the price change explained by treasury bond changes for the high yield bonds is
negative.
It is not surprising that changes in high-yield bond prices are not explained well by
changes in treasury bond prices. Anecdotal evidence suggests that price changes in investment
grade bonds are usually caused by changes in interest rates while changes in high yield bond
prices are more often due to changes in firm-specific factors. That is why investment grade
bonds are quoted in terms of a yield premium over treasuries while high-yield bonds are quoted
as a percentage of par value. Because price changes of high-yield bonds are not explained well by
changes in interest rates, quote estimates within the month are very inaccurate. Therefore I do not
use estimated quotes to get trading cost estimates for high-yield bonds.
The results in Table 7 provide a conservative assessment of our ability to estimate quotes
for investment grade bonds. In Table 7 we are using month-end price to predict prices at the end
13
of the following month. All of the trades in the Capital Access Database will occur closer in time
to the previous quote than at the end of the month. Absolute price changes and absolute
prediction errors should be much smaller.
Panel B of Table 7 has the same format as that of Panel A but breaks down bond quote
changes by sample period month rather than by rating. A prediction based on T-bond price
changes is superior to the naive prediction that the price will equal the previous month’s price in
every month except January and February 1997. Mean prediction errors, shown in the third
column, are positive in some months and negative in others. There are several months where
values exceed .4 or are less than -.3. These are months with significant changes in the yield
spread between corporate and treasury bonds. This suggests that an adjustment for changes in the
yield spread could provide a significant improvement in predicting quotes.
To summarize, one way to estimate trading costs is to estimate differences between trade
prices and bid quotes for buy orders and for sell orders. A comparison of these differences
provides a measure of round-trip trading costs. A complication is that the bid quotes for
corporate bonds are only available on a monthly basis. However, it appears that most of the
changes in investment grade corporate bond quotes from month to month can be explained by
changes in the prices of treasury bonds of similar maturity. This technique does not appear to be
promising for high-yield bonds though, and I do not attempt to estimate trading costs for them
using estimated quotes.
3.3 Estimates of trading costs based on trade prices and estimated bid quotes.
My estimates of monthly changes in bid quotes suggests that they can be predicted well
using changes in treasury bond prices. However, the large mean differences between predicted
and actual quotes in some months argue that further refinements can yield more accurate
predictions of quotes within the month. Thus I estimate within-month bid quotes with a three
step procedure. First, for each trade, I take the bond’s previous end-of-month quote and multiply
by the percentage change in price over the month of treasury bonds with similar maturity to
predict the month-end quote. The change in treasury bond prices is calculated as the weighted
average of the price change of bonds with maturities that bracket the bond’s maturity, where the

14
weights are chosen so that the weighted average of the treasury bond’s maturities equals the
maturity of the corporate bond. The second step is to subtract the forecasted quote from the
actual end-of-month quote and divide by the number of days in the month. This gives an average
daily error from predicting that the change in the corporate bond is the same as the change in
treasury bonds. These errors are calculated to make a rough adjustment for the changes in the
yield spread between corporate and treasury bonds and for the idiosyncratic changes in the bonds
price over the month. The third step is to take the previous end of month price, multiply by the
percentage change in treasury bonds up to the trade date and add on the average daily error times
the number of days from the previous month-end to the trade date. This provides the estimated
bid quote for that trade date. Note that this methodology leaves the actual end-of-month quote as
the estimate and that the total impact of estimated errors is small at the beginning and end of the
month. If the trade price exceeds both the month-end and previous month quotes by more than 5
percent, or is less than both quotes by more than 5 percent the trade is considered a likely data
error and not included. If a quote could not be found for the month-end or the previous month-
end the trade is discarded.
Recall that the total number of trades in the Capital Access data was 192,867. The
number remaining after eliminating trades that could not be matched with quotes from the Fixed
Income Database was 117,015. To calculate trading costs using estimated bid quotes I discard all
trades of bonds rated below Baa, all trades with an uncertain trade date, all trades of bonds
without quotes available both at the beginning and end of the month, and all trades that take
place at prices that differ by more than 5 percent from the beginning or end of month quote. I
also discard all trades with a trade date of June 30, 1995 or June 30, 1996 because there are a
large number of trades are attributed to those dates but appear to have taken place on a different
date. A total of 63,510 trades in investment grade bonds remain.
Round-trip transactions costs are estimated from the trade price and estimated quotes by
regressing the difference between the trade price and the estimated bid quote on a dummy
variable that takes a value of 1 for buys and zero for sells. That is,

15
∆∆
t 0 1 tBuy
t
t
tBuy
D
Where = the price of trade t - the bid price
D = 1 if trade t is a buy, 0 otherwise (1)
= + +α α ε
The variable of interest is 1, which provides an estimate of the difference in prices for buy and
sell orders. The intercept of the regression is an estimate of the mean difference between sell
prices and my estimated quotes. If the estimated quotes are systematically too high or low this
will also show up in the intercept term 0. A bias in estimated quotes should not affect 1 unless
the frequency of buy orders is correlated with errors in estimating the contemporaneous quotes.
Likewise, Capital Access’ procedure of rounding up transaction prices to the next $1,000 will
bias 0 upward but should not affect 1.
The cost of any specific trade is measured with significant error with this methodology.
However, just as long as there are no significant biases in estimating the trading costs, the large
number of observations should allow me to draw conclusions about average trading costs and
how they vary with the characteristics of the trade.
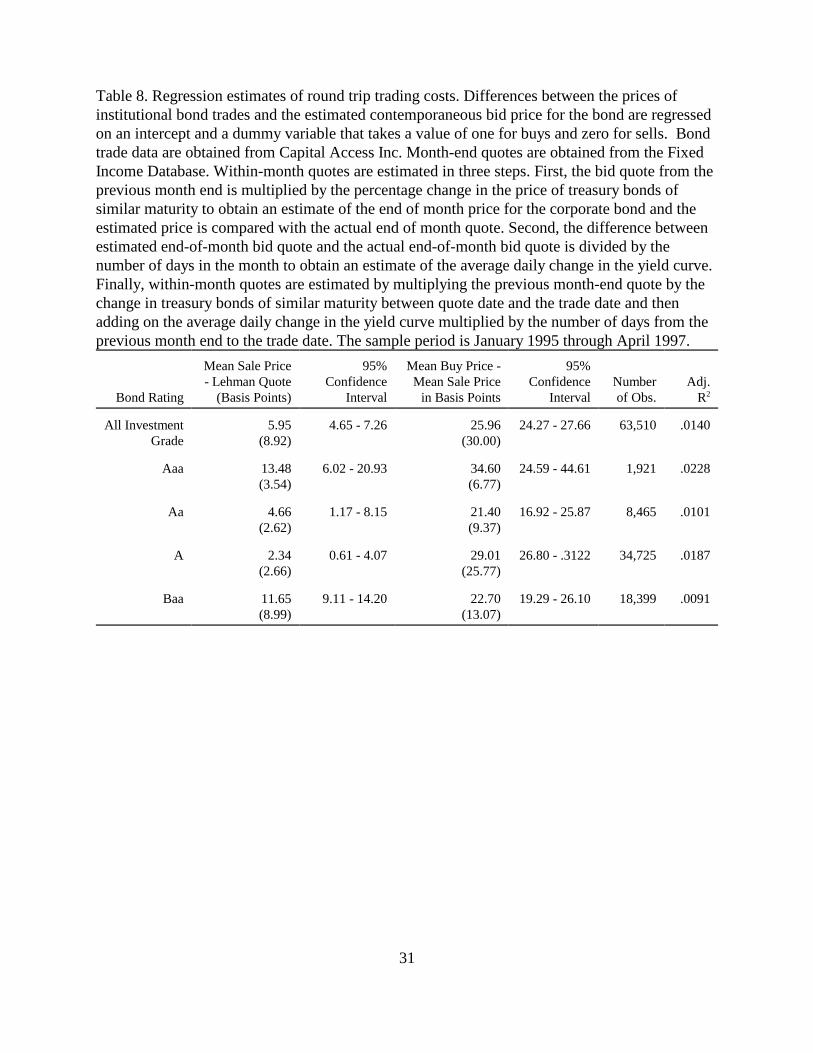
Estimates of (1) are reported in Table 8. The first row of the table reports estimates when
all 63,510 trades of investment grade bonds are included. The mean difference between the sale
price and the estimated quote (the regression intercept) is 5.95 basis points. The coefficient on
the dummy variable for buy order provides an estimate of the round-trip trading costs of 25.96
basis points or $2.60 per $1,000 bond. This is almost identical to the estimate obtained by
comparing buy and sell prices for the same bond on the same day. However, this is in good part
coincidence as indicated by the large standard error on the cost estimate obtained from matching
buy and sell trades. In contrast, as a result of the large number of observations the t-statistic on
the buy-order dummy is in Table 8 30.00 even though the regression R2 is only .0140. The 95
percent confidence interval for the dummy variable for buy orders is from 24.27 basis points to
27.66 basis points. Thus the large sample size permits fairly precise estimates of round-trip
trading costs.
The regression is run separately for bonds with different ratings to allow estimates of
trading costs for bonds with different risks. For every rating class, the estimate of round-trip

16
trading costs is more than 21 basis points or $2.10 per bond. Trading cost estimates are
significantly greater than zero for all ratings classes, but the confidence intervals for the 1
estimates imply that we cannot detect differences in trading costs across ratings.
4. Factors that Affect Trading Costs
4.1 Trade size and institution size
Trade size varies tremendously in the sample. The median trade size was about
$1,500,000 for the sample, but there are many trades of less than $100,000 or in excess of
$20,000,000. On the one hand, the fixed costs of completing a trade imply that costs should be
smaller for large trades. On the other hand, all else equal investors with information will be more
likely to make large trades. To determine the effects of trade size on bond trading costs I run the
following regression:
∆t
DtBuy Size
t t= + + +
=
α α α ε0 1 2
ln
where lnSizet
the natural log of the trade size x 1 for buys, -1 for sells (2)
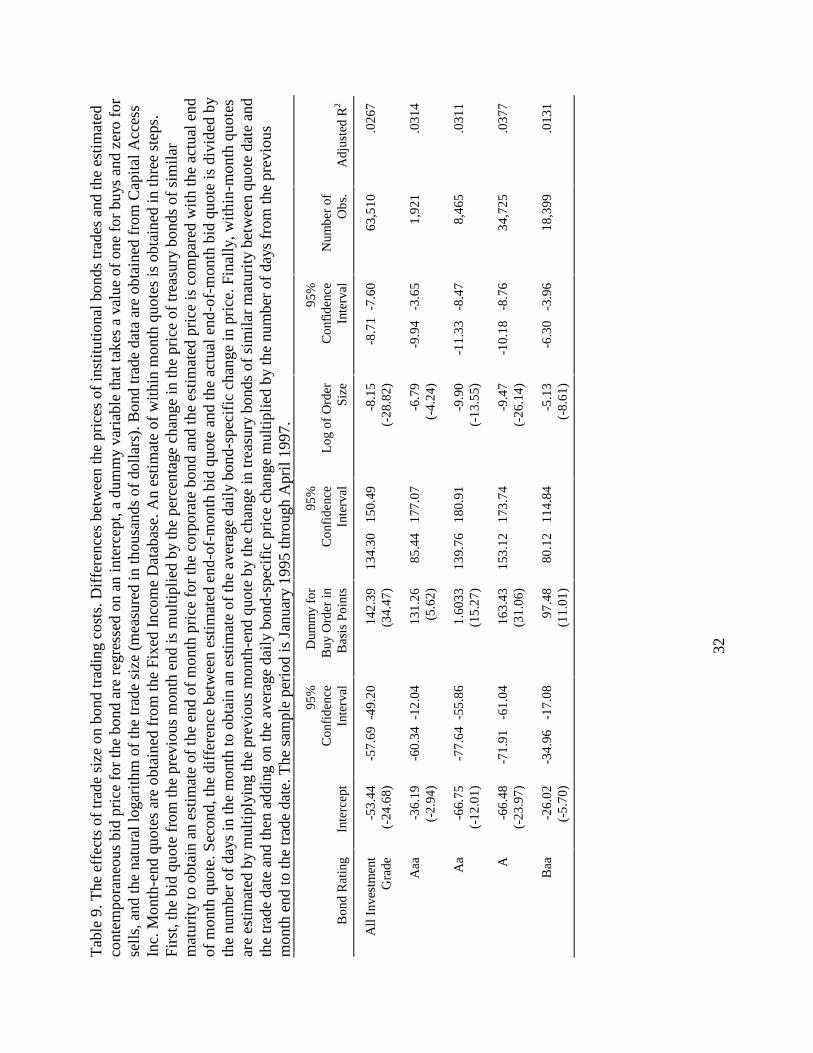
Results are shown in Table 9. R2’s increase when trade size is included in the regression.
As before, the coefficient on the dummy variable for buy orders is positive in the regression with
all investment grade bonds and the regressions for different bond ratings. The coefficients on the
log of the order size are negative and highly significant for each of the regressions. Trading costs
per bond are smaller for larger trades. The coefficient on the log of order size in the regression
with all investment grade bonds implies that round-trip trading costs decline by about 37.5 basis
points or $3.75 per bond when order size goes from $100,000 to $1,000,000. The same
regression was run using trade size raised to the first through fourth powers (not shown). Results
were qualitatively similar but R2’s were smaller. When the regression is run separately for trades
in bonds of different ratings, the coefficient on trade size is always negative, but are closer to
zero for trades in bonds rated Baa than bonds rated A or Aa. Perhaps trading costs do not fall as
much with trade size for these bonds because traders in lower rated bonds are more likely to have
17
information.
Keim and Madhavan (1997) document significant differences in equity trading costs
across institutions even after adjusting for differences in trading styles. They attribute the
variations to differences in trading skills across institutions. It is likely that we will see similar
differences in bond trading costs across institutions. In particular, I would expect those
institutions that do more trading to develop more skill at it and to have more bargaining power
with bond dealers. To test this, I rerun the last regression with an additional dummy variable that
takes on a value of one if the trade is a buy order from one of the 20 large institutional traders
shown in Table 4, and negative one if the trade is a sell by one of these institutions. That is
∆t
DtBuy Size
tD
tInst
t= + + + +α α α α ε
0 1 2 3ln .
where DtInst = 1 if a buy from a large institution, -1 if a sell from a large institution (3)
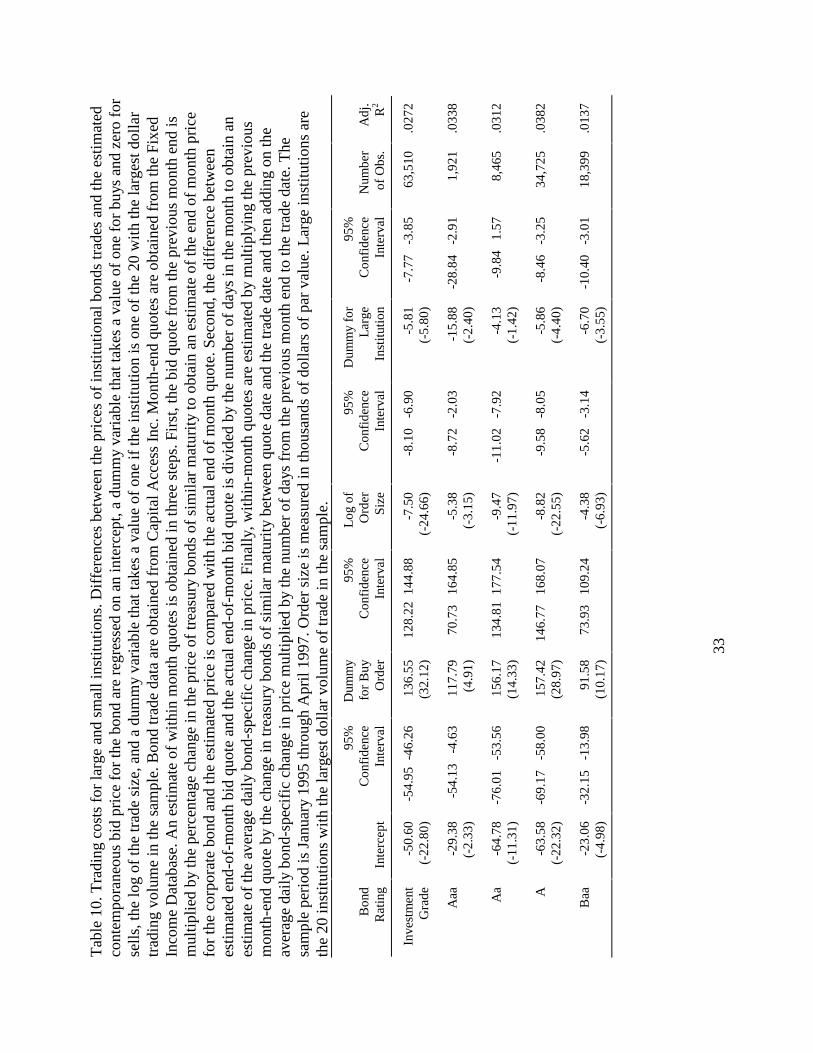
Regression estimates are shown in Table 10. As in the previous regressions, the
coefficient on the dummy variable for buy orders is always positive and significant and the
coefficient on the log of the trade size is always negative and significant. When all trades in
investment grade bonds are included in the regression the coefficient on the dummy variable for
a large institution has a coefficient of -5.81 with a t-statistic of -5.80. Since the coefficient
represents the effect on the price of one trade of a large institution, it has to be doubled to find the
round trip cost savings. In this case it means that round-trip trading costs are lower by 11.6 basis
points or $1.16 per $1,000 bond for the largest institutional traders. When separate regressions
are run for trades of bonds with different ratings the coefficient on the dummy variable for large
institutions is always negative and is significant at the 5 percent level for trades of bonds rated
Aaa, A, and B. Standard errors are too large to allow us to detect differences in the dummy
variable for large institutions across different ratings classes.
Figure 1 graphs the round-trip trading costs in dollars per $1,000 face value bond for
large institutions and other across different trade sizes. These estimates are derived from the
regression coefficients in Table 10. Figure 1 reveals that for trades of $100,000 face value of
bonds trading costs are about $5.50 per bond for large institutions and almost $7 for others.

18
Trading costs decline with size. The median trade size in the sample is about $1,500,000. Figure
1 shows that the round trip costs for a trade of this size will be about $1.50 per bond for large
institutions and about $2.70 per bond for others.
I also test to see if the dealer is an important determinant of trading costs. It is possible
that the larger and more active dealers may enjoy economies of scale that allow them to charge
less for trading. It is also likely that they deal in larger, more active bonds, and can therefore
charge less. On the other hand, smaller dealers may be forced to compete through price rather
than service.
I run the same regression used to test whether there are differences in trading costs across
institutions but now use a dummy variable that equals one for buy orders and negative one for
sell orders executed against one of the 12 large dealers shown in Table 2. The dummy variable
takes a value of zero for trades executed against any other dealer. Results are shown in Table 11.
The coefficient on the dummy variable for buy orders remains positive and significant.
Coefficients on the log of order size remain highly significant but are now smaller. The
coefficient on the dummy variable for large dealers is -5.79 and has a t-statistic of -6.62 when all
trades of investment grade bonds are included in the regression. This suggests that round trip
trading costs are lower by 11.58 basis points when the counterparty is a large dealer. When the
trades are separated by the rating of the underlying bond, the large dealer variable remains
negative in all of the regressions except for the regression for Aaa bonds. It is statistically
significant at the 1% level for bonds rated B or A.
4.2 Relationships and trading costs
In the over-the-counter bond market, the same institutions trade with the same dealers
repeatedly. It is sometimes claimed that the relationships that develop make trading easier and
less costly. If a dealer has dealt with an institution regularly, they are more likely to know the
type of bonds that the institution will buy. Also, familiarity with the trading patterns and
practices of an institution make it easier for a dealer to infer whether the institution is trading on
the basis of information. Institutions without information who trade with the same dealer can
expect lower trading costs than if they traded with somebody who was unfamiliar with their

19
history. Conversely, if a dealer is approached by an institution that it does not normally trade
with, it may infer that the institution is likely to have information about the bond’s value.
I examine the frequency with which dealers and institutions trade with each other for
evidence that institutions prefer trading with particular dealers. I restrict attention to the 20
largest institutions and to the trades that are used to calculate transaction costs in the previous
section, that is trades of bonds rated Baa or higher that had quotes at the beginning and end of the
month. I first calculate the number of trades that each of the 20 institutions executes with each of
the 12 most active dealers and with all other dealers. This yields a total of 260 dealer-institution
combinations. I next calculate the expected number of trades between each combination of dealer
and institution assuming independence. This is done by taking the total number of trades and
multiplying by the proportion of all trades by the institution and the proportion of all trades by
the dealer. The following statistic has a chi-square distribution if all institutions are equally likely
to trade with all dealers
statisticoi j
ei j
ei jji
=−
=∑
=∑ − ⋅ −
(, ,
)
,
~ (( ) ( ))
2
1
13
1
20 2 20 1 13 1χ
Where Oi, j
= the observed number of trades between institution i and dealer j
ei, j
= the expected number of trades between institution i and dealer j (4)
The calculated chi-square statistic has a value of 3,486 with 228 degrees of freedom which
allows us to reject a null hypothesis that institution and dealer identities are independent at a .1%
confidence level.
Table 12 provides information on which institutions trade with which dealers. Each row
of the table corresponds to one institution and each column corresponds to one dealer. The cell at
the junction of a row and column represents the trades of the institution with the dealer. A - in
the cell indicates that the number of trades is between 50 percent and 75 percent of the expected
number while a - - in a cell indicates that the number of trades between that combination of
dealer and institution is less than half of the expected number. A 0 in a cell means that the

20
number of trades is between 50 percent and 100 percent higher than expected. Cells containing a
0 0 indicate that there are at least twice as many trades between the dealer and institution as
expected.
Examination of Table 12 suggests that some institutions show little preference for
particular dealers. Prudential, American General, and Aeltus Investments seem to trade with
almost all dealers. However, most institutions show strong preferences in their trading partners.
For example, Northwestern Mutual trades frequently with Salomon Brothers and Credit Suisse
while avoiding Morgan Stanley and DLJ (Donaldson, Lufkin, and Jenrette). Manulife and
Transamerica on the other hand trade with DLJ frequently.
How do these relationships affect transaction costs? I define an institution and dealer as
having a relationship if the institution trades with the dealer 50 percent (or 100 percent) more
often than expected and as having no relation if the institution trades with the dealer less than 75
percent (or 50 percent) as much as expected. The expected number of trades is again defined as
all trades multiplied by the proportion of all trades handled by the dealer and the proportion of all
trades that involve the institution. I then run the following regression:
∆t
DtBuy Size
tD
tl D
tNo l
t= + + + + +α α α α α ε
0 1 2 3 4ln Re Re
where DtRel = 1 (-1) if a buy (sell) from a dealer with whom the institution has a relationship
DtNo Rel = 1 if a buy (sell) from a dealer with whom the institution has a no relationship (5)
Results are shown in Table 13. The first row of the table shows regression results using
all trades of investment grade bonds when an institution is defined as having a relationship with
a dealer if the institution had at least 50 percent more trades with the dealer than expected. An
institution is defined as having no relationship with a dealer if it has fewer than 75 percent of the
expected trades with the dealer as counterparty. The regression shown in the second row of the
table also includes all investment grade bond trades by the 12 leading institutions, but now a
relationship is defined as at least 100 percent more trades than expected while no relationship is
defined as less than 50 percent as many trades as expected.
21
In both cases, as expected, the dummy variable for buy order is positive while the log of
order size is negative. In both regressions, the dummy variable for a dealer that the institution
trades with often is negative but insignificant. Developing a relationship with a dealer doesn’ t
seem to bring lower transaction costs. The dummy variable for a dealer that the institution
seldom trades with has a negative coefficient in both regressions and it is significant at the 5%
level when that variable is defined as less than 50% of the expected number of trades. Thus there
is some weak evidence that it costs institutions less to trade with dealers with whom they seldom
trade. This could mean that they only trade with new dealers when they are offered a particularly
good deal. Alternatively, it could imply that institutions turn to dealers that they are familiar with
to complete complicated trades.
5. Summary and Conclusions
The over-the-counter market for corporate bonds is not as transparent as the equity
markets. Quotes are not easily obtained. Information on trades is not widely disseminated. As a
result, academics and regulators know little trading practices and the costs of trading in this
important market.
In this paper, I examine corporate bond trades by insurance companies, mutual funds and
pension funds over 1995-1997. In total, my sample includes over $600 billion in trades by over
600 institutions. Institutional bond trades are usually larger than institutional equity trades.
Median trade sizes are about $1,500,000 worth of bonds. Most of the trades have one of a dozen
large bond dealers as the counterparty, but individual bond dealers do not dominate trading in
particular bonds. I find that bonds that trade multiple times in my sample are typically traded by
several dealers. I also find that buy orders are almost twice as common as sell orders. This is
because many institutions follow the practice of purchasing bonds, holding them until maturity,
and reinvesting the principle. This is also reflected in my finding that bonds tend to be traded
soon after issuance. The median percentage of the bond’s life remaining at the time of a trade is
85 percent. A full 25 percent of trade take place in bonds with at least 97 percent of the total time
to maturity remaining. When bonds find their way into the portfolio of an investor who will hold
them to maturity they stop trading.

22
My best estimate of round-trip institutional trading costs for all investment grade bonds is
about 26 basis points, or $2.60 per $1,000 bond. This estimate is obtained by first estimating the
bid quote each day from the previous month-end bid quote and the change in treasury bond price
between the previous month-end and the trade date. The difference between the trade price and
estimated bid price is then regressed on a dummy variable for buy orders. The coefficient on the
dummy variable is an estimate of the round-trip trading costs.
There are large differences in trading costs by trade size and the identity of the dealer and
institution making the trade. Larger trades are cheaper. Round-trip costs for trades of $100,000
are about 67.5 basis points or $6.75 per bond for small traders and about 55.8 basis points or
$5.58 per bond for the largest institutions. Round-trip trading costs for trades of $1,000,000 are
about 32.9 basis points for most institutions and about 26.3 basis points for the 20 largest
institutions. After adjusting for trade size and the size of the institution, round-trip trading costs
are about 11.6 basis points or $1.16 per bond lower when the trades are transacted with one of
the 12 largest dealers. Although institutions appear to develop relationships with particular
dealers, there is no evidence that these relationships bring lower trading costs.
23
Table 1. Summary statistics. The sample consists of 192,867 Institutional bond trades fromJanuary 1995 through April 1997 compiled by Capital Access Inc. Trade data consists of thebond � s cusip , the date of the trade, the bond� s maturity date, whether the trade was a buy or sell,the par value of the bonds , the amount paid or received for the bonds, the identity of theinstitution and the identity of the dealer. 117,015 were matched with bond information from theFixed Income database compiled by the University of Houston. For the matched bonds, ratings,durations, amounts outstanding, issue dates, coupon amounts and information on call provisionsare available. Panel A. The distribution of trade sizes (in thousands of dollars)
Observations 5% 25% Median 75% 95%
All Trades 192,867 67 498 1,513 4,665 13,747
All Sells 69,518 46 444 1,320 4,059 11,694
All Buys 123,349 85 500 1,675 4,913 14,864
All Matched Trades 117,015 96 508 1,650 4,745 13,467
Panel B. The distribution of times to maturity in years
All Trades 192,867 3.00 5.55 8.48 11.63 29.59
All Matched Trades 117,015 3.22 5.99 8.71 11.60 29.73
Panel C. The distribution of the percentage of the bond � s life remaining at the time of the trade
All Matched Trades 117,015 40% 67% 85% 97% 100%
Matched Sells 43,088 33% 60% 74% 87% 97%
Matched Buys 73,927 47% 73% 91% 100% 100%
Panel D. The distribution of the percentage of outstanding bonds traded in a transaction.
All Matched Trades 117,015 .03% .24% .75% 2.00% 7.20%
Matched Sells 43,088 .04% .25% .80% 2.13% 7.07%
Matched Buys 73,927 .03% .22% .71% 2.00% 7.29%
Panel E. The proportion of matched trades that are in bonds of different ratings.
AAA Aa A Baa Ba B < B
2.17% 10.24% 42.77% 25.73% 9.80% 8.07% 1.30%
24
Table 2. Trading by the Top Twelve Sample Dealers. The sample is obtained from CapitalAccess Incorporated and consists of 192,867 institutional trades from January 1995 through April1997.
Dealer Number of TradesTotal Market Value of Trades
($ billions)
Merrill Lynch Capital Markets 15,638 $50.43
Morgan Stanley and Co. 10,527 $40.50
Goldman Sachs 10,383 $40.22
Salomon Brothers 8,157 $35.90
Lehman Brothers 8,640 $35.23
Credit Suisse First Boston 6,571 $28.22
J.P. Morgan Securities 6,198 $25.14
UBS Securities 5,456 $22.14
Donaldson, Lufkin, Jenrette 6,581 $22.03
Bear Stearns and Co. 6,597 $20.37
Smith Barney and Co. 7,734 $18.90
Paine Webber Inc. 5,805 $14.90
Total 98,287 353.98
25
Tab
le 3
. The
num
ber
of d
eale
rs tr
adin
g di
ffer
ent b
onds
. The
num
ber
of tr
ades
in e
ach
bond
in th
e C
apit
al A
cces
s D
ata
over
Jan
uary
1995
thro
ugh
Apr
il 1
997
is c
ount
ed a
long
wit
h th
e nu
mbe
r of
dea
lers
app
eari
ng a
s a
coun
terp
arty
to tr
ades
in th
e bo
nds.
Bon
ds a
reca
tego
rize
d by
the
num
ber
of tr
ades
, and
the
perc
enta
ge o
f bo
nds
in e
ach
cate
gory
trad
ed w
ith
diff
eren
t num
ber
of d
eale
rs a
redi
spla
yed
in th
e ta
ble.
Per
cent
age
of B
onds
wit
h a
Giv
en N
umbe
r of
Tra
des
wit
h D
iffe
rent
Num
bers
of
Dea
lers
as
Cou
nter
part
ies
Num
ber
ofT
rade
s in
the
Bon
d1
Dea
ler
2D
eale
rs3
Dea
lers
4D
eale
rs5
Dea
lers
6D
eale
rs7
Dea
lers
8D
eale
rs9
Dea
lers
10 +
Dea
lers
Tot
alN
umbe
rof
Bon
ds
1-5
74.2
617
.53
5.84
1.97
0.41
0.00
0.00
0.00
0.00
0.00
20,1
55
6-10
11.7
819
.68
21.8
717
.16
13.3
69.
524.
171.
800.
610.
072,
785
11-1
53.
429.
6211
.68
11.7
511
.18
14.0
312
.18
10.7
68.
416.
981,
404
16-2
01.
103.
816.
528.
939.
7310
.73
10.3
39.
8310
.33
28.6
999
7
21-3
00.
541.
983.
505.
215.
846.
658.
999.
088.
4549
.78
1,11
3
31-4
00.
490.
170.
823.
134.
783.
795.
115.
448.
2468
.04
607
41-5
00.
000.
900.
901.
512.
110.
903.
016.
026.
0278
.61
332
51-7
50.
000.
000.
300.
600.
901.
502.
103.
594.
1986
.83
334
76-1
000.
000.
000.
000.
000.
001.
470.
001.
470.
0097
.06
68
> 1
000.
000.
003.
130.
000.
000.
000.
000.
000.
0096
.88
64

26
Table 4. Institutions with the Highest Trading Volume. The sample is obtained from CapitalAccess Incorporated and consists of 192,867 institutional trades from January 1995 through April1997.
InstitutionNumber
of TradesNumber
SellsMean Trade
Value ($ 000’s)Total Trade
Value ($ billions)
Prudential Capital Management 6,480 2,575 $8,722 $56.52
Metropolitan Life Insurance 4,142 1,612 $10,917 $45.22
The Travelers Investments 6,850 2,998 $4,858 $33.28
New York Life Insurance Co 2,796 1,314 $9,950 $27.82
American General Corporation 5,368 1,936 $5,025 $26.97
Aeltus Investment Management 1,836 667 $10,827 $19.88
Conseco Capital Management 7,061 3,149 $2,603 $18.38
Northwestern Mutual Life 2,707 1,060 $6,444 $17.44
CIGNA Investments 4,867 2,081 $3,265 $15.89
Alliance Capital Management 2,360 986 $6,404 $15.11
Allstate Insurance Companies 2,296 729 $6,468 $14.85
Hartford Investment Manage 2,515 788 $5,760 $14.49
AEGON U.S.A. Investment Mn 3,950 1,570 $3,466 $13.69
Lincoln Investment Management 3,023 1,158 $3,937 $11.90
Loews Corporation 1,875 1,001 $6,298 $11.81
GNA Capital Management 1,869 516 $5,274 $9.86
TIAA-CREF 641 158 $15,244 $9.77
Transamerica Investment 1,505 390 $6,305 $9.49
Manulife Financial 1,404 670 $6,117 $8.59
John Hancock Mutual Life 1,608 706 $5,267 $8.46
Total 65,153 26,064 $389.42
27
Tab
le 5
. The
Dis
trib
utio
n of
trad
e ch
arac
teri
stic
s ac
ross
the
384
Inst
itut
ions
wit
h at
leas
t 50
trad
es d
urin
g Ja
nuar
y 19
95 -
Apr
il 1
997.
Dat
a is
fro
m C
apit
al A
cces
s an
d co
nsis
ts o
f 19
2,86
7 in
stit
utio
nal c
orpo
rate
bon
d tr
ades
.
Mea
n5th
Per
cent
ile10
th
Per
cent
ile25
th
Per
cent
ileM
edia
n75
th
Per
cent
ile90
th
Per
cent
ile95
th
Per
cent
ile
Num
ber
Tra
des
481.
6656
6395
165
427
1,17
52,
149
% S
ells
32.1
7%2.
05%
7.17
%20
.66%
33.7
2%43
.07%
51.2
1%58
.66%
Mea
n T
rade
Siz
e ($
000’
s)$2
,196
$118
$201
$599
$1,2
88$3
,020
$5,2
44$6
,909
Tot
al V
alue
Tra
des
($ m
illio
ns)
$1,7
78.1
$9.8
$20.
47$7
2.24
$220
.1$1
,120
.2$4
,101
.6$8
,421
.0
% H
igh
Yie
ld11
.39%
0%0%
0%3.
6%15
.6%
35.9
%53
.0%

28
Table 6. Estimates of Round-trip trading costs obtained from bonds with purchases and sales onthe same day. Data is obtained from Capital Access Incorporated and consists of institutionaltrades over January 1995 through April 1997. Round-trip trading costs are obtained bysubtracting the price of the sell trade from the price of a buy trade in the same bond on the sameday. When there is more than one buy or sell during a day, a weighted average transaction priceis used where the weights are the dollar values of the individual trades. Costs are expressed inbasis points.
Percentage Round-trip Costs T-Statistic Number of Trades
All Investment Grade Bond Trades 26.22 2.14 2,562
Aaa Bond Trades 20.66 0.74 878
Aa Bond Trades 13.76 1.89 186
A Bond Trades 39.15 1.82 904
Baa Bond Trades 18.67 6.81 594
All High-Yield Bond Trades 23.81 2.20 273
Ba Bond Trades 31.07 3.16 165
B Bond Trades 37.07 2.11 94
< B Bond Trades -15.07 -1.18 14

29
Table 7. Month to month price changes in corporate bonds and the ability of treasury bond pricechanges to explain them. For every bond in the Fixed Income Database with bid quotes in twoconsecutive month ends, I calculate the bond s price change and the absolute value of its pricechange. I also calculate a prediction of the price change which equals the previous month-endprice multiplied by the price change of treasury bonds with the same maturity over the month.The prediction error is the difference between the actual quote and the predicted quote. Errorsand price changes are expressed in basis points.Panel A. Price changes and predicted price changes by bond rating category.
Rating Number
MeanPrediction
Error
MeanPrice
Change
MeanAbsolute
Price Change
Mean AbsolutePrediction
Error
%PredictionImproves
Avg % ChangeExplained by
Tbond Changes
Aaa 133,981 9.45 11.56 7.527 44.39 67.53% 41.03%
Aa 23,030 0.40 16.63 117.39 44.20 77.32% 62.35%
A 69,231 3.19 15.23 118.65 40.06 78.91% 66.24%
Baa 36,350 3.82 14.96 126.96 50.80 76.64% 59.99%
Ba 10,316 18.64 23.69 130.45 111.57 55.27% 14.47%
B 14,058 9.40 15.47 159.12 186.27 38.23% -17.06%
< B 10,843 4.75 -0.42 125.01 160.68 31.92% -28.53%

30
Table 7 (continued).Panel B Price changes and predicted price changes by month.
Month Number
MeanPrediction
Error
MeanPrice
Change
MeanAbsolute
Price Change
Mean AbsolutePrediction
Error
%PredictionImproves
Avg % ChangeExplained by
Tbond Changes
1/95 8,918 .0277 1.0857 1.1969 .5099 85.47% 57.40%
2/95 9,017 .3109 1.6669 1.7191 .6998 88.87% 59.29%
3/95 9,096 .0644 .1425 .3896 .3743 56.34% 3.93%
4/95 9,190 .0153 .7878 .8954 .4436 83.13% 50.46%
5/95 9,379 -.6197 2.9014 2.9959 1.2580 77.44% 58.01%
6/95 9,535 -.1612 .2052 .4444 .4233 52.84% 4.75%
7/95 9,780 .3981 -.6688 .8636 .6130 66.75% 29.02%
8/95 9,746 -.0194 .6226 .8569 .5486 69.00% 35.98%
9/95 10,079 -.0937 .3599 .5967 .4621 61.58% 22.55%
10/95 10,329 -.3280 .5491 .8322 .6556 67.15% 21.22%
11/95 10,637 -.2441 .8667 1.0264 .6190 68.05% 39.69%
12/95 10,778 -.2044 .7153 .8391 .5515 64.98% 34.27%
1/96 10,812 .0752 .1868 .5044 .4271 63.03% 15.33%
2/96 10,989 .5810 -2.0434 2.1710 .9902 73.36% 54.39%
3/96 11,309 .4148 -1.0268 1.1560 .6280 71.15% 45.68%
4/96 11,533 .3782 -.9640 1.0707 .5367 75.87% 49.87%
5/96 11,667 .2689 -.5181 .6869 .3915 72.59% 43.01%
6/96 11,882 -.0572 .6292 .7787 .4258 77.74% 45.32%
7/96 12,096 .0921 -.2263 .3787 .3004 59.28% 20.67%
8/96 12,259 .2236 -.5874 .7499 .4242 73.11% 43.44%
9/96 12,337 -.1188 1.0877 1.1697 .4780 83.06% 59.14%
10/96 12,384 -.2433 1.3949 1.5366 .7025 77.90% 54.28%
11/96 12,619 -.4067 .9779 1.2078 .7170 70.53% 40.64%
12/96 12,750 .4372 -1.2703 1.3987 .7911 64.91% 43.44%
1/97 12,722 .2523 -.1746 .4598 .4762 39.29% -3.55%
2/97 12,917 .3430 -.1226 .4204 .4773 45.22% -13.52%
3/97 13,049 .2255 -1.5065 1.5573 .6358 80.82% 59.17%
31
Table 8. Regression estimates of round trip trading costs. Differences between the prices ofinstitutional bond trades and the estimated contemporaneous bid price for the bond are regressedon an intercept and a dummy variable that takes a value of one for buys and zero for sells. Bondtrade data are obtained from Capital Access Inc. Month-end quotes are obtained from the FixedIncome Database. Within-month quotes are estimated in three steps. First, the bid quote from theprevious month end is multiplied by the percentage change in the price of treasury bonds ofsimilar maturity to obtain an estimate of the end of month price for the corporate bond and theestimated price is compared with the actual end of month quote. Second, the difference betweenestimated end-of-month bid quote and the actual end-of-month bid quote is divided by thenumber of days in the month to obtain an estimate of the average daily change in the yield curve.Finally, within-month quotes are estimated by multiplying the previous month-end quote by thechange in treasury bonds of similar maturity between quote date and the trade date and thenadding on the average daily change in the yield curve multiplied by the number of days from theprevious month end to the trade date. The sample period is January 1995 through April 1997.
Bond Rating
Mean Sale Price- Lehman Quote
(Basis Points)
95%Confidence
Interval
Mean Buy Price -Mean Sale Price
in Basis Points
95%Confidence
IntervalNumberof Obs.
Adj.R2
All InvestmentGrade
5.95(8.92)
4.65 - 7.26 25.96(30.00)
24.27 - 27.66 63,510 .0140
Aaa 13.48(3.54)
6.02 - 20.93 34.60(6.77)
24.59 - 44.61 1,921 .0228
Aa 4.66(2.62)
1.17 - 8.15 21.40(9.37)
16.92 - 25.87 8,465 .0101
A 2.34(2.66)
0.61 - 4.07 29.01(25.77)
26.80 - .3122 34,725 .0187
Baa 11.65(8.99)
9.11 - 14.20 22.70(13.07)
19.29 - 26.10 18,399 .0091
32
Tab
le 9
. The
eff
ects
of
trad
e si
ze o
n bo
nd tr
adin
g co
sts.
Dif
fere
nces
bet
wee
n th
e pr
ices
of
inst
itut
iona
l bon
ds tr
ades
and
the
esti
mat
edco
ntem
pora
neou
s bi
d pr
ice
for
the
bond
are
reg
ress
ed o
n an
inte
rcep
t, a
dum
my
vari
able
that
take
s a
valu
e of
one
for
buy
s an
d ze
ro f
orse
lls,
and
the
natu
ral l
ogar
ithm
of
the
trad
e si
ze (
mea
sure
d in
thou
sand
s of
dol
lars
). B
ond
trad
e da
ta a
re o
btai
ned
from
Cap
ital
Acc
ess
Inc.
Mon
th-e
nd q
uote
s ar
e ob
tain
ed f
rom
the
Fixe
d In
com
e D
atab
ase.
An
esti
mat
e of
wit
hin
mon
th q
uote
s is
obt
aine
d in
thre
e st
eps.
Firs
t, th
e bi
d qu
ote
from
the
prev
ious
mon
th e
nd is
mul
tipl
ied
by th
e pe
rcen
tage
cha
nge
in th
e pr
ice
of tr
easu
ry b
onds
of
sim
ilar
mat
urit
y to
obt
ain
an e
stim
ate
of th
e en
d of
mon
th p
rice
for
the
corp
orat
e bo
nd a
nd th
e es
tim
ated
pri
ce is
com
pare
d w
ith
the
actu
al e
ndof
mon
th q
uote
. Sec
ond,
the
diff
eren
ce b
etw
een
esti
mat
ed e
nd-o
f-m
onth
bid
quo
te a
nd th
e ac
tual
end
-of-
mon
th b
id q
uote
is d
ivid
ed b
yth
e nu
mbe
r of
day
s in
the
mon
th to
obt
ain
an e
stim
ate
of th
e av
erag
e da
ily
bond
-spe
cifi
c ch
ange
in p
rice
. Fin
ally
, wit
hin-
mon
th q
uote
sar
e es
tim
ated
by
mul
tipl
ying
the
prev
ious
mon
th-e
nd q
uote
by
the
chan
ge in
trea
sury
bon
ds o
f si
mil
ar m
atur
ity
betw
een
quot
e da
te a
ndth
e tr
ade
date
and
then
add
ing
on th
e av
erag
e da
ily
bond
-spe
cifi
c pr
ice
chan
ge m
ulti
plie
d by
the
num
ber
of d
ays
from
the
prev
ious
mon
th e
nd to
the
trad
e da
te. T
he s
ampl
e pe
riod
is J
anua
ry 1
995
thro
ugh
Apr
il 1
997.
Bon
d R
atin
gIn
terc
ept
95%
Con
fide
nce
Inte
rval
Dum
my
for
Buy
Ord
er in
Bas
is P
oint
s
95%
Con
fide
nce
Inte
rval
Log
of
Ord
erSi
ze
95%
Con
fide
nce
Inte
rval
Num
ber
ofO
bs.
Adj
uste
d R
2
All
Inve
stm
ent
Gra
de-5
3.44
(-24
.68)
-57.
69 -
49.2
014
2.39
(34.
47)
134.
30
150.
49-8
.15
(-28
.82)
-8.7
1 -
7.60
63,5
10.0
267
Aaa
-36.
19(-
2.94
)-6
0.34
-12
.04
131.
26(5
.62)
85.4
4 1
77.0
7-6
.79
(-4.
24)
-9.9
4 -
3.65
1,92
1.0
314
Aa
-66.
75(-
12.0
1)-7
7.64
-55
.86
1.60
33(1
5.27
)13
9.76
18
0.91
-9.9
0(-
13.5
5)-1
1.33
-8
.47
8,46
5.0
311
A-6
6.48
(-23
.97)
-71.
91
-61.
0416
3.43
(31.
06)
153.
12
173.
74-9
.47
(-26
.14)
-10.
18
-8.7
634
,725
.037
7
Baa
-26.
02(-
5.70
)-3
4.96
-1
7.08
97.4
8(1
1.01
)80
.12
114
.84
-5.1
3(-
8.61
)-6
.30
-3.
9618
,399
.013
1
33
Tab
le 1
0. T
radi
ng c
osts
for
larg
e an
d sm
all i
nsti
tuti
ons.
Dif
fere
nces
bet
wee
n th
e pr
ices
of
inst
itut
iona
l bon
ds tr
ades
and
the
esti
mat
edco
ntem
pora
neou
s bi
d pr
ice
for
the
bond
are
reg
ress
ed o
n an
inte
rcep
t, a
dum
my
vari
able
that
take
s a
valu
e of
one
for
buy
s an
d ze
ro f
orse
lls,
the
log
of th
e tr
ade
size
, and
a d
umm
y va
riab
le th
at ta
kes
a va
lue
of o
ne if
the
inst
itut
ion
is o
ne o
f th
e 20
wit
h th
e la
rges
t dol
lar
trad
ing
volu
me
in th
e sa
mpl
e. B
ond
trad
e da
ta a
re o
btai
ned
from
Cap
ital
Acc
ess
Inc.
Mon
th-e
nd q
uote
s ar
e ob
tain
ed f
rom
the
Fixe
dIn
com
e D
atab
ase.
An
esti
mat
e of
wit
hin
mon
th q
uote
s is
obt
aine
d in
thre
e st
eps.
Fir
st, t
he b
id q
uote
fro
m th
e pr
evio
us m
onth
end
ism
ulti
plie
d by
the
perc
enta
ge c
hang
e in
the
pric
e of
trea
sury
bon
ds o
f si
mil
ar m
atur
ity
to o
btai
n an
est
imat
e of
the
end
of m
onth
pri
cefo
r th
e co
rpor
ate
bond
and
the
esti
mat
ed p
rice
is c
ompa
red
wit
h th
e ac
tual
end
of
mon
th q
uote
. Sec
ond,
the
diff
eren
ce b
etw
een
esti
mat
ed e
nd-o
f-m
onth
bid
quo
te a
nd th
e ac
tual
end
-of-
mon
th b
id q
uote
is d
ivid
ed b
y th
e nu
mbe
r of
day
s in
the
mon
th to
obt
ain
anes
tim
ate
of th
e av
erag
e da
ily
bond
-spe
cifi
c ch
ange
in p
rice
. Fin
ally
, wit
hin-
mon
th q
uote
s ar
e es
tim
ated
by
mul
tipl
ying
the
prev
ious
mon
th-e
nd q
uote
by
the
chan
ge in
trea
sury
bon
ds o
f si
mil
ar m
atur
ity
betw
een
quot
e da
te a
nd th
e tr
ade
date
and
then
add
ing
on th
eav
erag
e da
ily
bond
-spe
cifi
c ch
ange
in p
rice
mul
tipl
ied
by th
e nu
mbe
r of
day
s fr
om th
e pr
evio
us m
onth
end
to th
e tr
ade
date
. The
sam
ple
peri
od is
Jan
uary
199
5 th
roug
h A
pril
199
7. O
rder
siz
e is
mea
sure
d in
thou
sand
s of
dol
lars
of
par
valu
e. L
arge
inst
itut
ions
are
the
20 in
stit
utio
ns w
ith
the
larg
est d
olla
r vo
lum
e of
trad
e in
the
sam
ple.
Bon
dR
atin
gIn
terc
ept
95%
Con
fide
nce
Inte
rval
Dum
my
for
Buy
Ord
er
95%
Con
fide
nce
Inte
rval
Log
of
Ord
erSi
ze
95%
Con
fide
nce
Inte
rval
Dum
my
for
Lar
geIn
stitu
tion
95%
Con
fide
nce
Inte
rval
Num
ber
of O
bs.
Adj
.R
2
Inve
stm
ent
Gra
de-5
0.60
(-22
.80)
-54.
95 -
46.2
613
6.55
(32.
12)
128.
22 1
44.8
8-7
.50
(-24
.66)
-8.1
0 -
6.90
-5.8
1(-
5.80
)-7
.77
-3.
8563
,510
.027
2
Aaa
-29.
38(-
2.33
)-5
4.13
-4
.63
117.
79(4
.91)
70.7
3 1
64.8
5-5
.38
(-3.
15)
-8.7
2 -
2.03
-15.
88(-
2.40
)-2
8.84
-2
.91
1,92
1.0
338
Aa
-64.
78(-
11.3
1)-7
6.01
-5
3.56
156.
17(1
4.33
)13
4.81
177
.54
-9.4
7(-
11.9
7)-1
1.02
-7
.92
-4.1
3(-
1.42
)-9
.84
1.5
78,
465
.031
2
A-6
3.58
(-22
.32)
-69.
17
-58.
0015
7.42
(28.
97)
146.
77
168.
07-8
.82
(-22
.55)
-9.5
8 -
8.05
-5.8
6(-
4.40
)-8
.46
-3.
2534
,725
.038
2
Baa
-23.
06(-
4.98
)-3
2.15
-1
3.98
91.5
8(1
0.17
)73
.93
109
.24
-4.3
8(-
6.93
)-5
.62
-3.
14-6
.70
(-3.
55)
-10.
40
-3.0
118
,399
.013
7
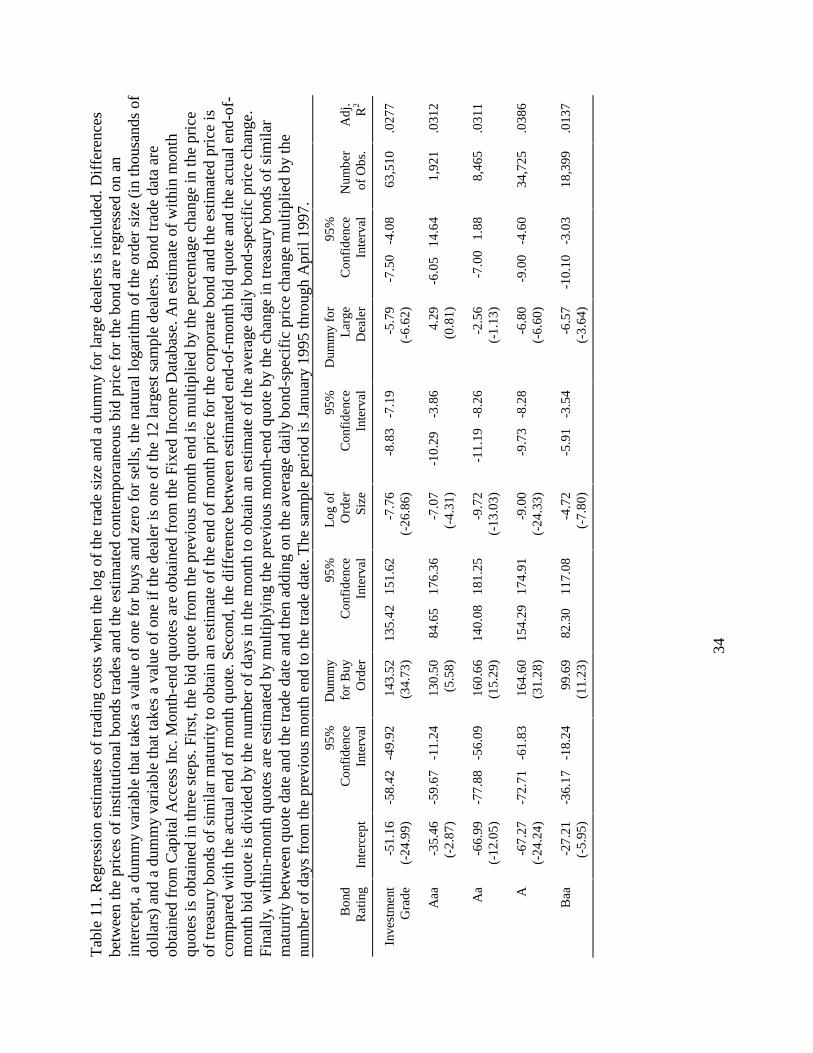
34
Tab
le 1
1. R
egre
ssio
n es
tim
ates
of
trad
ing
cost
s w
hen
the
log
of th
e tr
ade
size
and
a d
umm
y fo
r la
rge
deal
ers
is in
clud
ed. D
iffe
renc
esbe
twee
n th
e pr
ices
of
inst
itut
iona
l bon
ds tr
ades
and
the
esti
mat
ed c
onte
mpo
rane
ous
bid
pric
e fo
r th
e bo
nd a
re r
egre
ssed
on
anin
terc
ept,
a du
mm
y va
riab
le th
at ta
kes
a va
lue
of o
ne f
or b
uys
and
zero
for
sel
ls, t
he n
atur
al lo
gari
thm
of
the
orde
r si
ze (
in th
ousa
nds
ofdo
llar
s) a
nd a
dum
my
vari
able
that
take
s a
valu
e of
one
if th
e de
aler
is o
ne o
f th
e 12
larg
est s
ampl
e de
aler
s. B
ond
trad
e da
ta a
reob
tain
ed f
rom
Cap
ital
Acc
ess
Inc.
Mon
th-e
nd q
uote
s ar
e ob
tain
ed f
rom
the
Fixe
d In
com
e D
atab
ase.
An
esti
mat
e of
wit
hin
mon
thqu
otes
is o
btai
ned
in th
ree
step
s. F
irst
, the
bid
quo
te f
rom
the
prev
ious
mon
th e
nd is
mul
tipl
ied
by th
e pe
rcen
tage
cha
nge
in th
e pr
ice
of tr
easu
ry b
onds
of
sim
ilar
mat
urit
y to
obt
ain
an e
stim
ate
of th
e en
d of
mon
th p
rice
for
the
corp
orat
e bo
nd a
nd th
e es
tim
ated
pri
ce is
com
pare
d w
ith
the
actu
al e
nd o
f m
onth
quo
te. S
econ
d, th
e di
ffer
ence
bet
wee
n es
tim
ated
end
-of-
mon
th b
id q
uote
and
the
actu
al e
nd-o
f-m
onth
bid
quo
te is
div
ided
by
the
num
ber
of d
ays
in th
e m
onth
to o
btai
n an
est
imat
e of
the
aver
age
dail
y bo
nd-s
peci
fic
pric
e ch
ange
.Fi
nall
y, w
ithi
n-m
onth
quo
tes
are
esti
mat
ed b
y m
ulti
plyi
ng th
e pr
evio
us m
onth
-end
quo
te b
y th
e ch
ange
in tr
easu
ry b
onds
of
sim
ilar
mat
urit
y be
twee
n qu
ote
date
and
the
trad
e da
te a
nd th
en a
ddin
g on
the
aver
age
dail
y bo
nd-s
peci
fic
pric
e ch
ange
mul
tipl
ied
by th
enu
mbe
r of
day
s fr
om th
e pr
evio
us m
onth
end
to th
e tr
ade
date
. The
sam
ple
peri
od is
Jan
uary
199
5 th
roug
h A
pril
199
7.
Bon
dR
atin
gIn
terc
ept
95%
Con
fide
nce
Inte
rval
Dum
my
for
Buy
Ord
er
95%
Con
fide
nce
Inte
rval
Log
of
Ord
erSi
ze
95%
Con
fide
nce
Inte
rval
Dum
my
for
Lar
geD
eale
r
95%
Con
fide
nce
Inte
rval
Num
ber
of O
bs.
Adj
.R
2
Inve
stm
ent
Gra
de-5
1.16
(-24
.99)
-58.
42
-49.
9214
3.52
(34.
73)
135.
42
151.
62-7
.76
(-26
.86)
-8.8
3 -
7.19
-5.7
9(-
6.62
)-7
.50
-4.
0863
,510
.027
7
Aaa
-35.
46(-
2.87
)-5
9.67
-1
1.24
130.
50(5
.58)
84.6
5
176.
36-7
.07
(-4.
31)
-10.
29
-3.
864.
29(0
.81)
-6.0
5 1
4.64
1,92
1.0
312
Aa
-66.
99(-
12.0
5)-7
7.88
-5
6.09
160.
66(1
5.29
)14
0.08
18
1.25
-9.7
2(-
13.0
3)-1
1.19
-8
.26
-2.5
6(-
1.13
)-7
.00
1.8
88,
465
.031
1
A-6
7.27
(-24
.24)
-72.
71
-61.
8316
4.60
(31.
28)
154.
29
174.
91-9
.00
(-24
.33)
-9.7
3 -
8.28
-6.8
0(-
6.60
)-9
.00
-4.
6034
,725
.038
6
Baa
-27.
21(-
5.95
)-3
6.17
-1
8.24
99.6
9(1
1.23
)82
.30
11
7.08
-4.7
2(-
7.80
)-5
.91
-3.
54-6
.57
(-3.
64)
-10.
10
-3.0
318
,399
.013
7
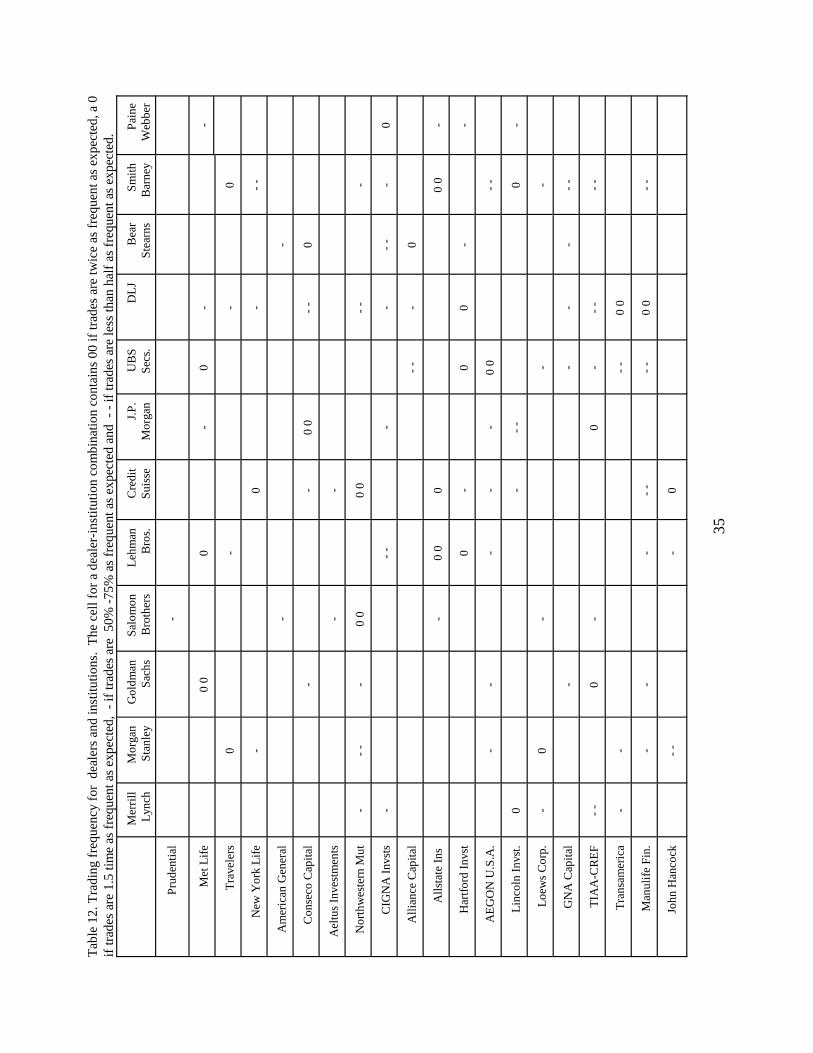
35
Tab
le 1
2. T
radi
ng f
requ
ency
for
dea
lers
and
inst
itutio
ns.
The
cel
l for
a d
eale
r-in
stitu
tion
com
bina
tion
cont
ains
00
if tr
ades
are
twic
e as
fre
quen
t as
expe
cted
, a 0
if tr
ades
are
1.5
tim
e as
fre
quen
t as
expe
cted
, -
if tr
ades
are
50%
-75
% a
s fr
eque
nt a
s ex
pect
ed a
nd -
- if
trad
es a
re le
ss th
an h
alf
as f
requ
ent a
s ex
pect
ed.
Mer
rill
Lyn
chM
orga
nS
tanl
eyG
oldm
anS
achs
Sal
omon
Bro
ther
sL
ehm
anB
ros.
Cre
dit
Sui
sse
J.P
.M
orga
nU
BS
Sec
s.D
LJ
Bea
rS
tear
nsS
mit
hB
arne
yP
aine
Web
ber
Pru
dent
ial
-
Met
Lif
e0
00
-0
--
Tra
vele
rs0
--
0
New
Yor
k L
ife
-0
--
-
Am
eric
an G
ener
al-
-
Con
seco
Cap
ital
--
0 0
- -
0
Ael
tus
Inve
stm
ents
--
Nor
thw
este
rn M
ut-
- -
-0
00
0-
--
CIG
NA
Inv
sts
--
--
--
--
0
All
ianc
e C
apit
al-
--
0
All
stat
e In
s -
0 0
00
0-
Har
tfor
d In
vst
0-
00
--
AE
GO
N U
.S.A
.-
--
--
0 0
- -
Lin
coln
Inv
st.
0-
- -
0-
Loe
ws
Cor
p.-
0-
--
GN
A C
apit
al-
--
--
-
TIA
A-C
RE
F-
-0
-0
--
--
-
Tra
nsam
eric
a-
--
-0
0
Man
ulif
e F
in.
--
--
--
-0
0-
-
John
Han
cock
- -
-0
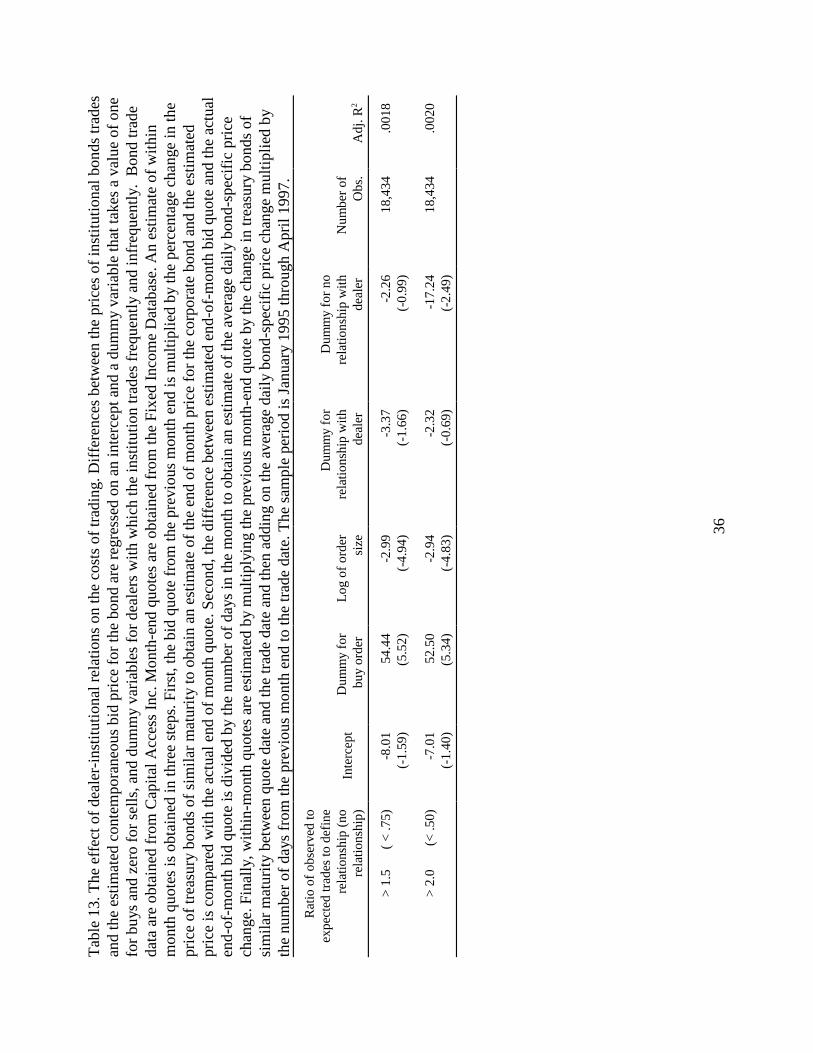
36
Tab
le 1
3. T
he e
ffec
t of
deal
er-i
nsti
tuti
onal
rel
atio
ns o
n th
e co
sts
of tr
adin
g. D
iffe
renc
es b
etw
een
the
pric
es o
f in
stit
utio
nal b
onds
trad
esan
d th
e es
tim
ated
con
tem
pora
neou
s bi
d pr
ice
for
the
bond
are
reg
ress
ed o
n an
inte
rcep
t and
a d
umm
y va
riab
le th
at ta
kes
a va
lue
of o
nefo
r bu
ys a
nd z
ero
for
sell
s, a
nd d
umm
y va
riab
les
for
deal
ers
wit
h w
hich
the
inst
itut
ion
trad
es f
requ
entl
y an
d in
freq
uent
ly.
Bon
d tr
ade
data
are
obt
aine
d fr
om C
apit
al A
cces
s In
c. M
onth
-end
quo
tes
are
obta
ined
fro
m th
e Fi
xed
Inco
me
Dat
abas
e. A
n es
tim
ate
of w
ithi
nm
onth
quo
tes
is o
btai
ned
in th
ree
step
s. F
irst
, the
bid
quo
te f
rom
the
prev
ious
mon
th e
nd is
mul
tipl
ied
by th
e pe
rcen
tage
cha
nge
in th
epr
ice
of tr
easu
ry b
onds
of
sim
ilar
mat
urit
y to
obt
ain
an e
stim
ate
of th
e en
d of
mon
th p
rice
for
the
corp
orat
e bo
nd a
nd th
e es
tim
ated
pric
e is
com
pare
d w
ith
the
actu
al e
nd o
f m
onth
quo
te. S
econ
d, th
e di
ffer
ence
bet
wee
n es
tim
ated
end
-of-
mon
th b
id q
uote
and
the
actu
alen
d-of
-mon
th b
id q
uote
is d
ivid
ed b
y th
e nu
mbe
r of
day
s in
the
mon
th to
obt
ain
an e
stim
ate
of th
e av
erag
e da
ily
bond
-spe
cifi
c pr
ice
chan
ge. F
inal
ly, w
ithi
n-m
onth
quo
tes
are
esti
mat
ed b
y m
ulti
plyi
ng th
e pr
evio
us m
onth
-end
quo
te b
y th
e ch
ange
in tr
easu
ry b
onds
of
sim
ilar
mat
urit
y be
twee
n qu
ote
date
and
the
trad
e da
te a
nd th
en a
ddin
g on
the
aver
age
dail
y bo
nd-s
peci
fic
pric
e ch
ange
mul
tipl
ied
byth
e nu
mbe
r of
day
s fr
om th
e pr
evio
us m
onth
end
to th
e tr
ade
date
. The
sam
ple
peri
od is
Jan
uary
199
5 th
roug
h A
pril
199
7.
Rat
io o
f ob
serv
ed to
expe
cted
trad
es to
def
ine
rela
tions
hip
(no
rela
tions
hip)
Inte
rcep
tD
umm
y fo
rbu
y or
der
Log
of
orde
rsi
ze
Dum
my
for
rela
tions
hip
with
deal
er
Dum
my
for
nore
latio
nshi
p w
ithde
aler
N
umbe
r of
Obs
.A
dj. R
2
> 1
.5
(
< .7
5)-8
.01
(-1.
59)
54.4
4(5
.52)
-2.9
9(-
4.94
)-3
.37
(-1.
66)
-2.2
6(-
0.99
)18
,434
.001
8
> 2
.0
(
< .5
0)-7
.01
(-1.
40)
52.5
0(5
.34)
-2.9
4(-
4.83
)-2
.32
(-0.
69)
-17.
24(-
2.49
)18
,434
.002
0
37
References
Alexander, Gordon, Amy K. Edwards, and Michael G. Ferri, 1998, Trading Volume andLiquidity in Nasdaq
�
s High-Yield Bond Market, Working paper, Securities and ExchangeCommission, Washington, D.C.
Blume, Marshall, Felix Lim, and A. Craig MacKinlay, 1998, The Declining Credit Quality ofU.S. Corporate Debt, Journal of Finance 53, 1389-1413.
Chan, Louis K.C. and Josef Lakonishok, 1997, Institutional equity trading costs: NYSE versusNasdaq, Journal of Finance 52, 713-735.
Hong, Gwangheon, and Arthur Warga, 1998, An empirical study of bond market transactions,Working paper, University of Houston, Houston, TX.
Keim, Donald and Ananth Madhavan, 1997, Transactions costs and investment style: an inter-exchange analysis of institutional equity trades, Journal of Financial Economics46, 265-292.
Levitt, Arthur, 1998, The importance of transparency in America�
s debt market, Remarks at theMedia Studies Center, New York, New York.
Securities Industry Association, February 3, 1994, Investor Activity Report, Securities IndustryAssociation, Washington, D,.C.
Securities Industry Association, 1998, Securities Industry Trends: An Analysis of EmergingTrends in the Securities Industry 24, Securities Industry Association, Washington, D,.C.
U.S. Securities and Exchange Commission: Division of Market Regulation, 1992, The corporatebond markets: Structure, pricing and trading, U.S. Securities and Exchange Commission,Washington, D.C.
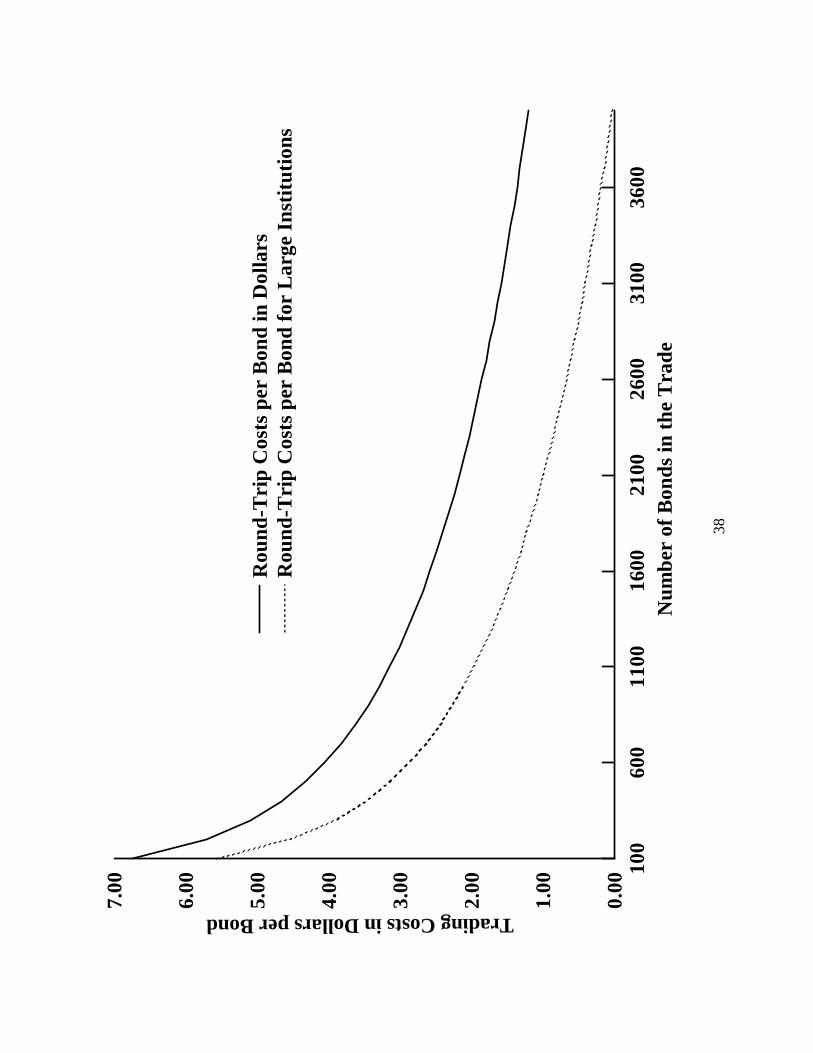
38
100
600
1100
1600
2100
2600
3100
3600
Num
ber
of B
onds
in t
he T
rade
0.00
1.00
2.00
3.00
4.00
5.00
6.00
7.00
Trading Costs in Dollars per Bond
Rou
nd-T
rip
Cos
ts p
er B
ond
in D
olla
rsR
ound
-Tri
p C
osts
per
Bon
d fo
r L
arge
Ins
titu
tion
s