corporate bond market window open 28 november 2017 - · pdf file1 treasury broadsheet |...
TRANSCRIPT

1 Treasury Broadsheet | Quarterly newsletter of snippets and stories from the world of treasury management 28 November 2017
CCCan
Corporate bond market window open
Investors around the world continue to seek out anything with a yield return. The
demand appears to be continually growing as many fund managers start to
allocate funds away from the potentially over-hyped equities asset class towards
fixed interest securities/bonds. The pursuit of yield in some areas is getting into
dangerous territory with European corporate junk bonds (non-rated) trading at
yields below US 10-year Government Treasury bonds (2.37% pa).
Here in New Zealand we have witnessed insatiable investor demand (retail and
wholesale) chasing the small number of new corporate bonds issued in the debt
capital markets. Companies like Summerset and Wellington International Airport
have commanded very attractive pricing from a borrower’s perspective this year.
It is a little surprising that a larger number NZ corporate borrowers have not
advantaged from these conducive market conditions to lock into longer-term debt
at lower issuance margins. The advice to borrowers, who can access the debt
capital markets under their own name, is to issue corporate bonds when the
market window of opportunity is open (i.e. strong investor demand in present).
That timing may not necessarily coincide with the borrower’s own maturity
profile/issuance plan. However, bank facilities are normally flexible enough to
cancel without penalty and thus it is prudent “funding risk” management to
engineer the debt issuance timing to when the market window is open.
Corporate bond issuance volumes in New Zealand have dropped off in 2017
compared to previous years, so it makes one wonder why more borrowers have
not come to the market given the investor demand and lower issuance margins.
One explanation for the lower than expected activity levels is the fact that overall
bank lending to corporates is not exactly increasing currently, therefore the banks
are very keen to hang on to their direct lending books and not be repaid from a
corporate bond issue. One of the main reasons a borrower goes to the corporate
bond market is to secure longer term debt of seven years plus that is generally not
available from bank sources. Retail investors here have historically had an
aversion to investing beyond five years in corporate bonds. However, the appetite
for longer term maturities from retail investors has been increasing of late,
28 November 2017
(Click to view) Corporate bond market window
open
The weather and forecasting
models
Digital transformation:
Visualisation of risk and the
Corporate Treasurer
Beginner’s guide to FX
management
The challenges of cash flow
forecasting
Expectations for an optimal
transactional banking solution
The impact of digital currencies
and the blockchain technologies
they rely on for corporate treasury
What is driving the cards and
payments industry?
Can analytics strengthen your
forecasting?

2 Treasury Broadsheet | Quarterly newsletter of snippets and stories from the world of treasury management 28 November 2017
particularly as they realise that seven and eight year maturities are the only bond investments on offer. Education
of more retail investors to accept seven and 10 year tenors is perhaps required. However, often the carrot in the
form of an increased interest coupon is what is needed to entice these investors to go longer. That may not fit with
the borrower’s own pricing aspirations. It is always a trade-off between risk and reward (i.e. suitability and
acceptance) for both the borrowers and investors.
The general rule of thumb is that diversification of core debt sources away from solely banks starts about the
$300 million to $400 million mark. The materiality of funding risk becomes more meaningful at and above these
levels. Surprisingly, there still appears to be many local corporate borrowers (who would be strong enough from a
credit rating perspective to utilise the debt capital markets in their own name) who have bank debt only for much
higher debt amounts. Board of Directors of these borrowers totally dependent upon bank debt should be asking
the questions about funding risk and appropriate debt source diversification. It is not too long ago (the 2009
GFC) that banks struggled to fund themselves in a credit shock and corporate borrowers from those banks
inherited the banks’ funding risk problems and paid extra in the form of sharply higher borrowing margins.
-
200
400
600
800
1,000
1,200
1,400
1,600
1,800
2,000
2008 2009 2010 2011 2012 2013 2014 2015 2016 2017
($m
)
Corporate bond new retail issuances
Source:KangaNews

3 Treasury Broadsheet | Quarterly newsletter of snippets and stories from the world of treasury management 28 November 2017
- -
82
-
40
-
42
164
18
48
424
77
-
50
100
150
200
250
300
350
400
450
Jan 18 Feb 18 Mar 18 Apr 18 May 18 Jun 18 Jul 18 Aug 18 Sep 18 Oct 18 Nov 18 Dec 18
($m
)Upcoming NZD corporate bond maturities
Source: Bloomberg
12 bonds maturingTotal: $896m
0
50
100
150
200
250
0 1 2 3 4 5 6 7 8 9
Issua
nce
ma
rgin
to
sw
ap (
bps p
.a.)
m
Tenor (Years)
2017 corporate retail bond issuance margins
Source: Bloomberg

4 Treasury Broadsheet | Quarterly newsletter of snippets and stories from the world of treasury management 28 November 2017
The weather and forecasting models
(Things that keep us up at night)
There is no disputing the key inter-relationship between our most socially talked about subject, “the weather” and
New Zealand’s economy. The weather influences our agriculture, recreation, retail sales and hydrology.
Hydrology influences our electricity generation/prices as well as wider regional infrastructural investment.
Environmental impacts from water management and climate change are critical factors. The cause/effect
impactor list goes on. Every business and government/local government entity is impacted by the weather’s
dynamic stressors.
So, how can we incorporate the weather and weather patterns into our forecasting models?
To emphasise the relationship, the following chart clearly links the influence of macro weather patterns on New
Zealand’s agricultural GDP growth performance from La Niña and El Niño effects.
The Southern Oscillation Index (SOI) measures the pressure differences between Tahiti and Darwin to predict La
Niña and El Niño episodes.
What makes this chart exciting is that is potentially providing a predictive lead to understanding the weather’s
influence on agricultural business forecasting. The current index is pointing to a more positive agricultural GDP
outcome. The last serious El Niño adverse event in 2007 caused a drought in the Waikato and subsequent overall
economic recession.
The problem facing New Zealand companies in terms of further granulating predictive data on the weather to
assist with more accurate business forecasting is the localisation of weather i.e. it can be raining in the Waikato
but drought conditions can simultaneously be experienced in the Hawkes Bay.
The localised weather patterns takes us to new and exciting advancements in remote sensing technology and the
miniaturisation of this technology that can accurately map (measure) water in its varying states such as snow,
lake capacity, river capacity and soil moisture. The satellite technology has been around for some time, however
the ability to measure and model regional and localised water capacity accurately has been the tough nut to crack.
-30%
-20%
-10%
0%
10%
20%
30%
-20
-15
-10
-5
0
5
10
15
20
25
Agri
GD
P
So
uth
ern
Oscill
iatio
n i
nde
x (
9 m
onth
le
ad)
Southern Oscillition index and NZ agri GDP
SOI Agri GDP
La Nina (wetter conditions) = positive
El Nino (dry conditions) = negative Overall correlation since 2005: 40%
La nina resulting in positive GDP/ El nino resulting in negative GDP correlation: 60%
Source: Bloomberg

5 Treasury Broadsheet | Quarterly newsletter of snippets and stories from the world of treasury management 28 November 2017
The mapping technology, which was initially developed for NASA, can now be scaled down to the use of light
aircraft and drones. This, for example, is going to allow a dairy farmer to regularly map pastures for accurate soil
moisture content. Using this technology, the farmer will understand how much irrigation is needed, where it is
needed and accurately manage fertiliser application volume and timing. These methods not only create direct cost
efficiencies; it also has an environmental benefit through the reduction of water run-off. Snow mapping by
example provides for more accurate river management and flood control systems, accurately measuring the water
capacity of the snow fields feeding the water catchment areas.
PwC New Zealand is currently at the cutting edge of investigating the use of this technology to develop forecasting
models for our clients. The challenge to any good forecasting model is access to accurate and relevant data and
using this data to support material forecasting assumptions. If that data can also provide predictive elements to
the art of forecasting, then it is certainly getting closer to the holy grail.
Digital transformation: Visualisation of risk and the Corporate Treasurer
As the march of digital transformation continues, staying technologically relevant should be at the forefront of a
Corporate Treasurer’s objectives. Despite the wave of technological change that is sweeping over the global
financial services industry, Treasurers appear to be somewhat reluctant adopters of new technology. Whilst there
is truth to the old saying ‘if it ain’t broke, don’t fix it’, Treasurer’s cannot afford to ignore the enormous change in
technology that is happening all around us. To avoid being left behind, automated out of existence, or becoming
irrelevant, Treasurers of today need to be agile, embrace change, and be receptive to new technological
opportunities that will ultimately drive better solutions for managing financial market volatility and improving
financial performance for the organisation they work for.
One pertinent example of where technology is enhancing the management of volatility and improving financial
performance is through visualisation dashboards. Every week we see new geo-political, natural or economic risk
events that impact on an organisation’s financial position. The impact of the latter can be unpredictable, as
highlighted by the effects of the Brexit referendum outcome, the election of President Trump and (more close to
home) the recent New Zealand general election and associated political risk. Risk visualisation tools play an
essential role in the management of unpredictability and assist in judicious hedging decisions; the combination of
which have a direct influence on protecting profit margins, reducing costs and enhancing profitability. Through a
visualisation dashboard, a Treasurer has the opportunity to consider the following: -
Model the impact of different financial market rate movement and hedging scenarios.
Communicate risk factors that influence decisions more clearly to both to senior management and the wider
organisation.
Demonstrate how risk decisions can drive strategic advantage.
Beginner’s Guide to FX Risk Management
At times of increased short-term turbulence in foreign exchange markets it is helpful to remember there are ways
to manage this volatility. Effective foreign exchange (FX) risk management does not have to be complicated. The
six easy steps below are a simple way for small-t0-medium sized businesses to protect their profits.
Understanding your risks and sensitivity: What are the foreign exchange risks the organisation is
exposed to? Are these cashflow risks such as export receipts, repatriation of overseas profits and/or import
payments? What is the impact on company profitability from a 10% movement in the exchange rate versus
that budgeted?
Are there any naturally occurring ‘offsets?’: If the organisation is unable to increase its selling prices to
compensate any adverse foreign exchange rate movements, then it will probably need to manage the risks of
foreign exchange rate movements itself.
Develop a policy framework to manage foreign exchange risks: Factors to consider include the
length of hedging term, the percentage of exposures that may be hedged (minimum and maximum limits),
and the hedging instruments allowed. The first two steps noted above will help in determining these
parameters.

6 Treasury Broadsheet | Quarterly newsletter of snippets and stories from the world of treasury management 28 November 2017
Forecasting future exposures: What are the amounts of expected foreign currency receipts or payments
over the next 12 or more months? This process can require a combination of sales, procurement and/or
finance functions to help determine. Greater certainty would be expected over near-term months (confirmed
exposures). Longer dated forecasts do not have to be exact but they are much better than no forecast.
Forecasts, and potentially hedging contracts, need to be updated monthly and adjusted if necessary.
Agreeing the risk management strategy: Given the agreed policy framework and the forecasted
exposures, what is the organisation’s risk management strategy at the prevailing exchange rate level?
o Does the company already have sufficient protection to withstand foreign exchange rate
movements over coming months?
o Conversely does the organisation need to add further foreign exchange hedging immediately?
o Or can the organisation set more favourable ‘target’ levels, or firm market orders, before entering
further hedging?
Effective use of hedging instruments: Just three hedging instruments cater for nearly all circumstances.
o Forward exchange contracts (FECs) are the most common and simple hedging instrument. FECs
lock in with certainty today, an exchange rate and amount in the future, and are a binding legal
contract.
o A purchased option gives the buyer the right to be protected from an unfavourable movement in
the exchange rate but the ability to ‘walk away’ - and have unlimited participation - should the
exchange rate move in a favourable direction. In return for this optionality the organisation pays an
‘insurance’ premium.
o The third simple instrument is a collar option. The collar option provides protection against an
unfavourable movement in the exchange rate but at a rate less favourable than the FEC. The collar
option provides limited ability to participate in a favourable exchange rate movement, but less so
than the purchased option. The collar option can be constructed in a way such that the organisation
pays no (net) premium. Like the FEC, the collar option is a binding legal contract.
Effective foreign exchange risk management does not have to be more complex than the above. Please feel free to
contact one of the PwC Treasury Advisory team should you wish to known more.
The challenges of cash flow forecasting
A Global Treasury Benchmark Survey completed by PwC in January of this year captured the views of over 220
Corporate Treasurers and Chief Financial Offers from around the global and a key issue that arose from the
survey was cash flow forecasting. Over past decades’ cash flow forecasting has consistently been a top priority for
Corporate Treasurers. Accurate forecasting is critical for the business and it feeds into the decision making
process for key areas such as liquidity, debt funding, covenant compliance, planning and capital structure.
Nearly half of the survey respondents (42%) mentioned this as a priority and 80% of these ranked it as high or
critically importance. However, as highlighted below there are fundamental issues that need to be overcome in
order to improve business’s ability to provide accurate forecasting that delivers insight that Treasurers will be
able to fully able to benefit from. The issues are hardly new ones and these issues make Treasures ask themselves
some fairly important questions. Do the costs of achieving an accurate forecast outweigh the benefits? Is the
forecasting accurate enough to make critical business decisions?

7 Treasury Broadsheet | Quarterly newsletter of snippets and stories from the world of treasury management 28 November 2017
Forecasting challenges:
The process of forecasting remains much the same. It is a time consuming, cumbersome and manual process that
brings together people from across the whole organisation. Which is why the frequency of updating forecasts and
forecasting horizon are limited as shown below. Most organisations typically only have forecasting at a
consolidated level and the granularity of data that is used is limited. Less than 6% of respondents make use of
inputs at the transactional level.
Regularity of forecasts: Type of forecast:
According to the survey, some respondents mentioned that, irrespective to the immense effort that is put in by
the business and the individuals to this critical task, they do not expect to see a material improve in the process or
the outcome of the process.
Expectations for an optimal transactional banking solution
Before an organisation sets its objectives and outcomes for a transactional banking review it pays to
comprehensively understand the cash flow and working capital cycle of the business. Such matters as, the
business and cash flow cycle, where do cash flows come from, what are the uses of cash and timing of cash in/out
flows across the working capital cycle. Further the structure, purpose and use of bank accounts and facilities
along with a consolidated view on account balances and cash flow movements is important.
Source: PwC global treasury benchmark survey 2017 1017
Source: PwC global treasury benchmark survey 2017 1017

8 Treasury Broadsheet | Quarterly newsletter of snippets and stories from the world of treasury management 28 November 2017
The real time nature and connectivity of transactional banking solutions continues to improve with some of the
expected measure of an optimal solution outlined below:
Real-time access to cash account balances, giving visibility of balances both intra-day and end of day.
Reduced number of bank accounts. Efficiencies can be accrued through lower bank activity fees via a
reduction in cash transactions along with reduced administration time reconciling accounts and the reduced
risk of errors and fraud. Simplified account structures should ideally allow separate business identification
and reporting.
Physical or notional transactional bank account balance offsets, thereby minimising interest costs where a
consolidated borrowing requirement or maximising income where a positive operating cash position. Seek a
high interest rate on an on-call account.
Real time expense management systems that reduce administration and reconciling time. Limits should
restrict the amount and type of expenditure. Anywhere update and approval status is an advantage.
Minimising human intervention through the integration and connectivity of the bank’s payments system and
the organisation ERP system provides efficiencies and reduces the risks of errors and fraud. Ideally 24/7
accessibility. Efficient file transfers for payroll and payments are critically important.
Connectivity is increasingly important as information moves to cloud-based solutions and the greater need for
flexibility in accessing information. Remote access to financial information, authorisations and approval is
necessary.
Automated accounts receivable and payable solutions. Receivables management solutions are complicated
through different payment channels. Automated solutions lead to timely cash settlement, stronger liquidity
management, invoice matching and reconciliation. Terms could be optimised to best meet working capital
metrics. Importantly visibility over matched and unmatched items is improved, through timely access to
financial information and reporting.
Software upgrades are preferably automated.
An ambition to reduce manual intervention across all cash management processes through accessing the
connectivity and digital features within a transactional banking solution.
The impact of digital currencies and the blockchain technologies they rely on for corporate treasury
Although still a foreign concept to many, terms such as ‘bitcoin’, ‘blockchain’ and ‘cryptocurrency’ have emerged
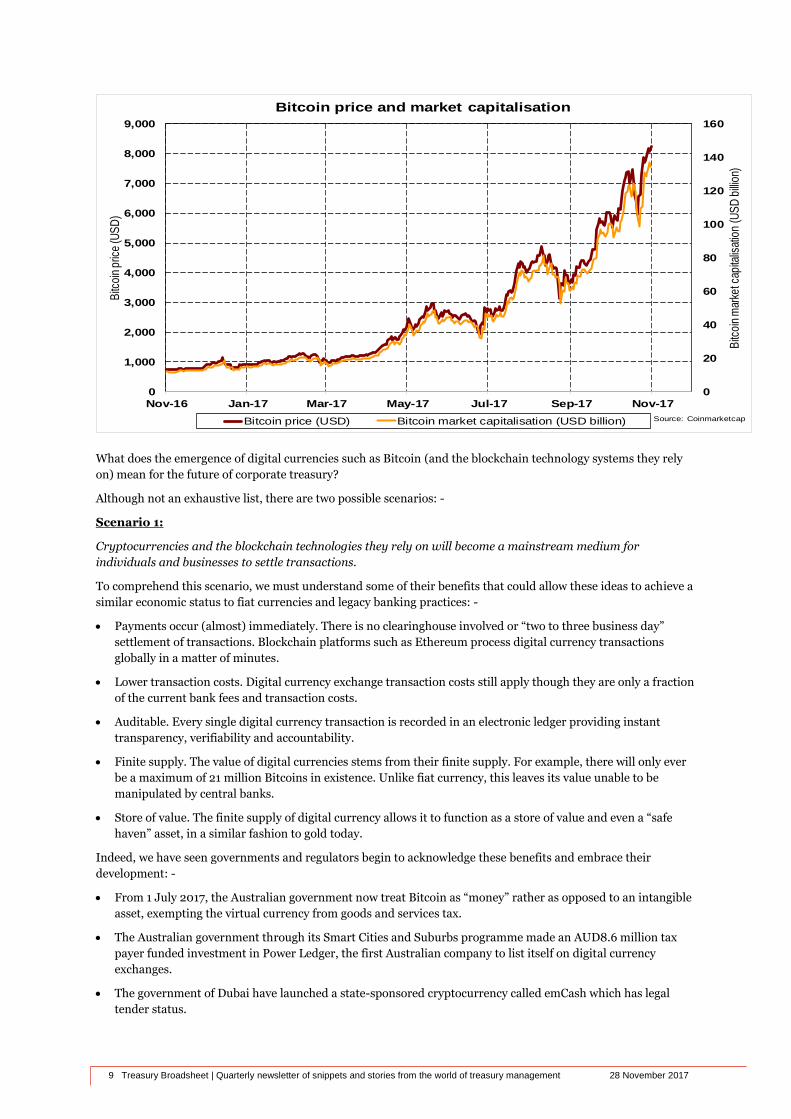
from the underground wilderness of a few tech savvy individuals to become household buzz words. With a market
capitalisation of nearly US$140 billion, digital currency Bitcoin has rapidly grown larger than global payment
system PayPal and other well-known companies such as Tesla, General Motors and Sony. Regardless of your
social, economic or political views, on the sheer scale alone it is difficult to deny their relevance and potential
importance in today’s society and how we think about money.
9 Treasury Broadsheet | Quarterly newsletter of snippets and stories from the world of treasury management 28 November 2017
What does the emergence of digital currencies such as Bitcoin (and the blockchain technology systems they rely
on) mean for the future of corporate treasury?
Although not an exhaustive list, there are two possible scenarios: -
Scenario 1:
Cryptocurrencies and the blockchain technologies they rely on will become a mainstream medium for
individuals and businesses to settle transactions.
To comprehend this scenario, we must understand some of their benefits that could allow these ideas to achieve a
similar economic status to fiat currencies and legacy banking practices: -
Payments occur (almost) immediately. There is no clearinghouse involved or “two to three business day”
settlement of transactions. Blockchain platforms such as Ethereum process digital currency transactions
globally in a matter of minutes.
Lower transaction costs. Digital currency exchange transaction costs still apply though they are only a fraction
of the current bank fees and transaction costs.
Auditable. Every single digital currency transaction is recorded in an electronic ledger providing instant
transparency, verifiability and accountability.
Finite supply. The value of digital currencies stems from their finite supply. For example, there will only ever
be a maximum of 21 million Bitcoins in existence. Unlike fiat currency, this leaves its value unable to be
manipulated by central banks.
Store of value. The finite supply of digital currency allows it to function as a store of value and even a “safe
haven” asset, in a similar fashion to gold today.
Indeed, we have seen governments and regulators begin to acknowledge these benefits and embrace their
development: -
From 1 July 2017, the Australian government now treat Bitcoin as “money” rather as opposed to an intangible
asset, exempting the virtual currency from goods and services tax.
The Australian government through its Smart Cities and Suburbs programme made an AUD8.6 million tax
payer funded investment in Power Ledger, the first Australian company to list itself on digital currency
exchanges.
The government of Dubai have launched a state-sponsored cryptocurrency called emCash which has legal
tender status.
0
20
40
60
80
100
120
140
160
0
1,000
2,000
3,000
4,000
5,000
6,000
7,000
8,000
9,000
Nov-16 Jan-17 Mar-17 May-17 Jul-17 Sep-17 Nov-17
Bitc
oin
mar
ket c
apita
lisat
ion
(US
D b
illio
n)
Bitc
oin
pric
e (U
SD
)Bitcoin price and market capitalisation
Bitcoin price (USD) Bitcoin market capitalisation (USD billion) Source: Coinmarketcap

10 Treasury Broadsheet | Quarterly newsletter of snippets and stories from the world of treasury management 28 November 2017
Russian president Vladimir Putin has ordered the Russian government devise a regulatory framework for
cryptocurrencies so that they may be recognised as legal tender in a controlled environment.
Japan’s Financial Services Agency approved the rights of 11 companies within its borders, including bitFlyer,
to operate cryptocurrency exchanges.
The Comptroller of the Currency of the United States is considering imposing a nationwide licensing program
for cryptocurrency exchanges. This hypothetical licensing program could put into place a nation-wide, unified
regulatory framework for cryptocurrency exchange platforms.
The Chicago Mercantile Exchange (CME) have added Bitcoin futures to their futures trading platform.
There is no doubt many hurdles to overcome before this scenario plays out. The largest being the mind-set shift
from the current way we view money and undertake payments and transactions, particularly navigating the safety
and security concerns that naturally emanate from a largely unknown realm of the internet. As with any
ideological change, its future will be dependent on education and understanding.
Undoubtedly the current digital currency landscape will not look the same in five to 10 years’ time. Perhaps
Bitcoin will be surpassed by some yet unknown digital currency? Perhaps it will become a global currency and
change the nature of foreign exchange risk as we know it? What will then be the role of central banks who
currently manage currency, money supply and interest rates?
Admittedly these questions may be testing the extremes of the future of blockchain and cryptocurrencies.
However, it is not farfetched (under this scenario) to fathom that blockchain and digital currency will be at the
core of most transactions in the future.
For corporate treasurers this at least means acknowledging their existence. The next step is to understand the
ideas and their application, keep up with developments and assess any potential disruptions to current practices
and operations. A forward looking treasurer will embrace the change rather than avoid it, seeking out where any
efficiencies can be added and be prepared to adopt digital currency to mitigate the risk of being left behind.
Scenario 2:
It’s a fraud. It’s a bubble that will burst and never reflate. It’s a speculative gravy train that has no part to play
in the future of transactions. Fiat currencies will remain superior and absolute.
What is driving the cards and payments industry?
Consumers today are more educated and empowered than ever before and expect a seamless and tailored service
from the organisations they do business with. At PwC we have worked extensively with our client’s customers to
understand this demand, and formulate how businesses can react to transact naturally free from pretension or
calculation, and lacking artificiality. Payments are one of the most common interactions that take place between
businesses and consumers, and with over two-thirds of New Zealanders now choosing digital payments as their
preferred method of payment (1) it is important that our clients consider how their payment systems may be
impacting their customer experience, the attraction of potential customers, and business outcomes as a result.
The increasing prevalence of smartphones (70% of New Zealanders own a mobile phone (2)) means that people
have constant access to the Internet, and payments are expected to be fast, safe, continuous and versatile.
Therefore, businesses need to provide the flexibility and channels for consumers to interact with payment
services seamlessly on any device. Consumers expect payment interactions to be simple and easy to navigate, with
minimal barriers to purchase. Offerings should be personalised where possible to maximise the value for each
buyer and predict their future needs. Transparency and security are also top of the mind for consumers, with 62%
of NZ millennials in a recent survey desiring biometric security (fingerprint or retina) when purchasing (3). They
also want to know where their money is going and how their data is being used. Failing to meet this expectation
can result in the loss of consumer trust, which is often irreversible.
Consumer expectations will morph over time, sometimes in unexpected ways, and businesses must be agile in
adapting their services to suit changing environments. However, this may be a complex transition and there are a
number of issues to consider, such as how existing relationships with financial institutions can evolve to meet
these changing environmental factors, or how to create new relationships to take advantage of emerging
technologies.

11 Treasury Broadsheet | Quarterly newsletter of snippets and stories from the world of treasury management 28 November 2017
The rise of FinTechs has brought customer experience to the forefront of the financial services industry. With a
focus on addressing particular needs, and without the complications of legacy systems, FinTechs have been able
to develop innovative, engaging and scalable payment solutions for both organisations and consumers. This
presents a challenge for financial services industry incumbents, as they are now faced with the option to innovate
or fade away. PwC’s 2017 Fintech Survey explores the increasing connection between FinTechs and corporates,
discussing how the gap between the two is likely to decrease as start-ups mature and financial institutions
undertake their own transformations. However, it also discusses the tendency of New Zealand corporates to rely
heavily on partnering with FinTechs rather than driving their own innovation from within.
At PwC New Zealand we work with our clients to help form payments solutions that maximise current
opportunities and that are also future-fit. PwC has worked with a number of banks to uplift their payments
capabilities. These engagements have included replacement of core merchant and payments switching systems,
managing large-scale payments industry compliance programmes and delivering payments transformation
programmes. We have also helped industry sector organisations to articulate their future strategy and
requirements around their transactional banking and payments needs, with a focus on creating an enhanced
customer experience, and as part of a larger piece of work to identify and enlist new strategic banking partners.
The payments industry is one that will change drastically over the coming years as innovation continues to surge
at an unprecedented rate, and other mechanisms such as digital currencies continue to grow in popularity.
However, it remains clear that customer expectations will continue to be the driving force of change, meaning
organisations will need to re-evaluate their current payments systems and invest in partnerships that will enable
them to make the most out of current and future opportunities.
Steve O’Donnell is Consulting Director at PwC New Zealand with 20+ years in the banking and payments
industry. For a discussion on your banking and payments requirements, please contact Steven O’Donnell,
Source:
http://www.scoop.co.nz/stories/BU1705/S00103/kiwis-ditch-cash-as-digital-payments-increase.htm
http://www.nielsen.com/nz/en/insights/news/2016/nz-mobile-keeping-kiwis-connected.html
https://www.canstar.co.nz/credit-cards/kiwi-millenials-want-make-payments-eyes
Can analytics strengthen your forecasting?
For many companies and councils, the past few months has involved the annual budget process and generation of
forward-looking forecasts for the financial year(s) ahead. This time of the year can often be stressful and equally,
in some cases, a little arbitrary. That is because it can be challenging to come up with realistic, purpose-built or
well-designed forecasts. Starting with the year that was (or is), factoring in a desired or realistic growth rate and
then back-solving for the key contributing resources is a reasonably common way to go. However, with a growing
swell of analytical tools increasing sophistication of forecasting accuracy while reducing the effort involved, it is a
timely reminder that “taking a fresh look” at your existing processes and methods could yield valuable gains.
There are three main “pain points” we commonly see for Corporate Treasuries during this process: -
The medium term cash flow forecast.
The drawn debt forecast.
Foreign currency receipts or payments (requiring FX risk management).
The three of these are obviously inter-connected (for example, it’s likely that stronger cash flow will imply lower
debt). There are a number of small tricks that companies can use to help simplify the process (e.g. making sure to
factor in their existing hedging portfolio to the interest or exchange rates feeding the forecast), however in our
experience, many companies still struggle to accurately forecast their projected debt levels for the coming one to
three years. There can be real costs from failing to do this as well. The most obvious example is a very optimistic
debt forecast that fails to materialise, causing management to arrange and pay for a large chunk of funding
facilities that never get used.
In this regard, companies should consider taking a harder look at data analytics to better inform their decision
making. Because of the regular rhythm created by the annual forecasting process, coupled with the need to track
actual behaviour, there are often very powerful datasets that can be used to help inform management.

12 Treasury Broadsheet | Quarterly newsletter of snippets and stories from the world of treasury management 28 November 2017
The struggle is that these datasets can often be hidden away in historical folders, completed by other people in
other formats or disconnected from the ERP or ledger.
Taking the time to build or invest in tools that help solve these challenges can have a really positive impact on the
forecasting process, as well as monitoring forecast accuracy moving forward. The encouraging part too is that
such tools are becoming increasingly widespread, whereby instead of spending large amounts on a specific (often
rigid) system that provides a particular service, one or two smaller tools are used as enablers to create a tailored
and flexible solution that provides 80% of the system’s value with 10-20% of the cost.

13 Treasury Broadsheet | Quarterly newsletter of snippets and stories from the world of treasury management 28 November 2017
DISCLAIMER: This publication is subject to the following restrictions. This publication should not be reproduced or supplied to any other party
without first obtaining our (PwC New Zealand) written consent. We accept no responsibility for any reliance that may be placed on its content
should it be used for any purpose other than that set out below and in any event we will accept no liability to any party other than you in respect of
its contents.
The purpose of the publication is to provide our current financial market views and opinions. The statements and opinions contained in this report
are based on data obtained from the financial markets and are so contained in good faith and in the belief that such statements, opinions and data
are not false or misleading. In preparing this publication, we have relied upon information which we believe to be reliable and accurate.
We reserve the right (but will be under no obligation) to review our assessment and if we consider it necessary, to revise our opinion in the light of
any information existing at the date of this publication which becomes known to us after that date.
Get in touch
Stuart Henderson Partner T: +64 9 425 0158 M: +64 21 343 423 E: [email protected]
Roger Kerr Consultant T: +64 9 355 8181 M: +64 21 935 288 E: [email protected]
Brett Johanson Partner T: +64 4 462 7234 M: +64 21 771 574 E: [email protected]
Chris Hedley Director T: +64 9 355 8183 M: +64 21 479 680 E: [email protected]
James McHardy Director T: +64 4 462 7153 M: +64 21 263 4282 E: [email protected]
Tom Lawson Associate Director T: +64 9 355 8144 M: +64 27 421 0733 E: [email protected]
Alex Wondergem Associate Director T: +64 9 355 8252 M: +64 21 041 2127 E: [email protected]
Hasthika Ekneligoda Treasury Analyst T: +64 9 355 88855 E: [email protected]
James Butler Treasury Advisor T: +64 9 355 8265 E: [email protected]
Tom North Treasury Analyst T: +64 9 355 8497 E: [email protected]
Ollie McDowell Treasury Advisor T: + 64 4 462 7316 E: [email protected]
Matt Stewart Treasury Analyst T: +64 5 462 7037 E: [email protected]
www.pwc.co.nz/treasury-and-debt-advisory