corn, ethanol production and land use, part 1
DESCRIPTION
This is the first of a two-part series on the land-use impacts of corn ethanol production. The second paper will cover available acreage and the difficulty in estimating indirect land use change.TRANSCRIPT

NCGA White Paper:Corn, Ethanol Production and Land Use, Part I
Executive Summary
This is the first of a two-part series on the land-use impacts of corn ethanol production. The second paper will cover available acreage and the difficulty in estimating indirect land use change.
• Thepassageofthe2007EnergyIndependenceandSecurityActbytheU.S.CongresswasawatershedeventforenergypolicyintheUnitedStates.Thebillprovidesforincreasedresearchforawiderangeofalternativeenergiesand,importantly,hassignificantsupportforbiofuels,whicharetoexpandto36billiongallonsofproductionby2022inanenhancedRenewableFuelStandard.
• Inadditiontodescribingthefeedstockforfuels,thelegislationalsomandatesthelifecyclereductioningreenhousegasthateachfuelcategorywillprovide.Accordingtothelegislation,emissionsfromconventionalethanolandcellulosicethanolneedtobereducedby20and60percent,respectively;thegreenhousegasreductionforadvancedbiofuelsby50percent.TheEnvironmentalProtectionAgencyhasauthorityoverdetermininglifecyclegreenhousegasemissions.
• Aspartofitsroleinoversightoftheenergybill,theEPAhasdeterminedthatitwillincorporatelandusechangeincalculationsforgreenhousegasemissions.Whilethisappearstobeastraightforwardcalculation,theactualcalculationismuchmorecomplex,andthereissignificantdisagreementonhowtocomputeareasonablevalueforlanduse.
• Whileincreasingcropyieldsfrom1800totheearly20thCenturywaslargelydrivenbyplowingmoreland,majoradvancestookplaceinthelastcenturythatfundamentallychangedglobalagricultureinawaythatdiminishedtheimportanceofshiftingacreage.Theseadvancesincludedmechanization,widespreadutilizationofsyntheticfertilizer,hybridcornanddwarfriceandwheatvarietiesand,finally,thegeneticengineeringofcrops.
• Thesecondhalfofthe20thCenturymayverywellbeheraldedastheGoldenAgeofAgriculture.Itisworthnotingthatbetween1961and2007globalcerealproductionincreasedfrom877milliontonsto2,341milliontons—anincreaseofalmost300percent.Andthisincreaseinproductionwasaccomplishedusingonlyeightpercentmoreland.

Founded in 1957, the National Corn Growers Association represents 35,000 dues-‐paying corn farmers nationwide and the interests of more than 300,000 growers who contribute through corn checkoff programs in their states. NCGA and its 48 affiliated state associations and checkoff organizations work together to create and increase opportunities for their members and their industry. © 2010, National Corn Growers Association

I. Introduction The December 2007 passage of the Energy Independence and Security Act by the U.S. Congress was a watershed event for energy policy in the United States. The goals of the legislation are to increase energy security and conservation across the spectrum of energy consumption—from the generation and utilization of electricity and home heating oil to transportation fuels. Incandescent light bulbs, for example, will begin to be phased out of use beginning in 2012 and car manufacturers will be required to have a fleet average of 35 miles per gallon by 2020. Of significance is the fact that the bill was signed into law during a time of increasingly anti-‐American rhetoric by Iran, Venezuela and Russia—all major oil suppliers—and when the average retail price per gallon of gasoline was $3.07 per gallon, demonstrating the sound rationale for the legislation. The bill provides for increased research for a wide range of alternative energies. One of the major goals of the legislation is to create “green jobs” through a training program for energy efficiency and renewable energy workers in conjunction with an expanded energy portfolio available to the United States. Funding is available for solar, wind, geothermal and marine energy research and deployment. Additionally, there is significant support for biofuels, which are to expand to 36 billion gallons of production by 2022 in an enhanced Renewable Fuel Standard. The law is envisioned to simultaneously reduce U.S. energy consumption and shield the economy from exposure to volatile international energy markets while increasing clean energy sector jobs.
Figure 1. EISA volume mandates by fuel volume and date. (Source ESIA, USDA)
As seen here, the Renewable Fuel Standard is met by utilizing a number of different fuel types. For the bill, conventional ethanol may be derived from corn starch or sugar cane; cellulosic ethanol is ethanol derived from sugars in biomass, e.g., corn stover, switch grass, bagasse from sugar cane; advanced biofuels (compounds such as biogasoline, butanol or other hydrocarbon like compounds) are derived from renewable sources. There is also a category for biodiesel.
1
In addition to describing the feedstock for fuels, the legislation also mandates the lifecycle reduction in greenhouse gas that each fuel category will provide. Using 2005 measurements for baseline fuels, lifecycle greenhouse gas emission pathways are compared to the emissions of the fuel being replaced, either diesel or gasoline. According to the legislation, emissions from conventional and cellulosic ethanol need to be reduced by 20 and 60 percent, respectively; the greenhouse gas reduction for advanced biofuels by 50 percent. The Environmental Protection Agency has authority over determining lifecycle greenhouse gas emissions. It defines lifecycle greenhouse gas emissions to be
“the aggregate quantity of greenhouse emissions (including direct and significant indirect emissions such as significant emissions from land use changes), as determined by the Administrator [of EPA], related to the full fuel lifecycle, including all stages of fuel and feedstock production and distribution, from feedstock generation or extraction through the distribution and delivery and use of the finished fuel to the ultimate consumer, where the mass values for all greenhouse gases are adjusted to account for their relative global warming potential.” (May 29, 2008)
As defined by the EPA, there are two components to greenhouse gas emissions, direct and indirect. Direct emissions relate to all of the greenhouse gases emitted in the entire process of biofuels production from “well to wheels” —i.e., from initial feedstock production to final consumer use. Determining direct emissions, while difficult, has been done before and there is a large body of literature reviewed on the subject. Indirect emissions, by definition, will be more difficult to ascertain. As part of its final rule implementing the Energy Independence and Security Act, the EPA has determined that it will incorporate land use change in calculations for greenhouse gas emissions. The rationale behind including land use change is simple: If crops or crop land are diverted to biofuel production, then additional land will be required for crop production. Depending on where this land is located, its introduction into agriculture may release greenhouse gases and in some cases this will be a significant release. While this appears to be a straightforward calculation, the actual calculation is much more complex and there is significant disagreement on how to compute a reasonable value for land use. Indirect land use has become a highly controversial issue since the publication of a 2008 paper by Tim Searchinger in Science magazine. Many groups are involved in developing mathematical models such as FASOM and GTAP, which are beyond the scope of this introduction, but demonstrate the difficulty with validating mathematical models on the effects of hypothetical changes of indirect land effects from international agriculture on domestic production in the United States. However, while the time horizon may be in question, there is general consensus that biofuels will have a beneficial impact over time. While significant questions remain surrounding land use, without a defined course of action we are committed to a continued cycle of economic turmoil, increasing dependence on foreign oil, increasing military activity to protect sources of foreign oil, and further environmental degradation.
2
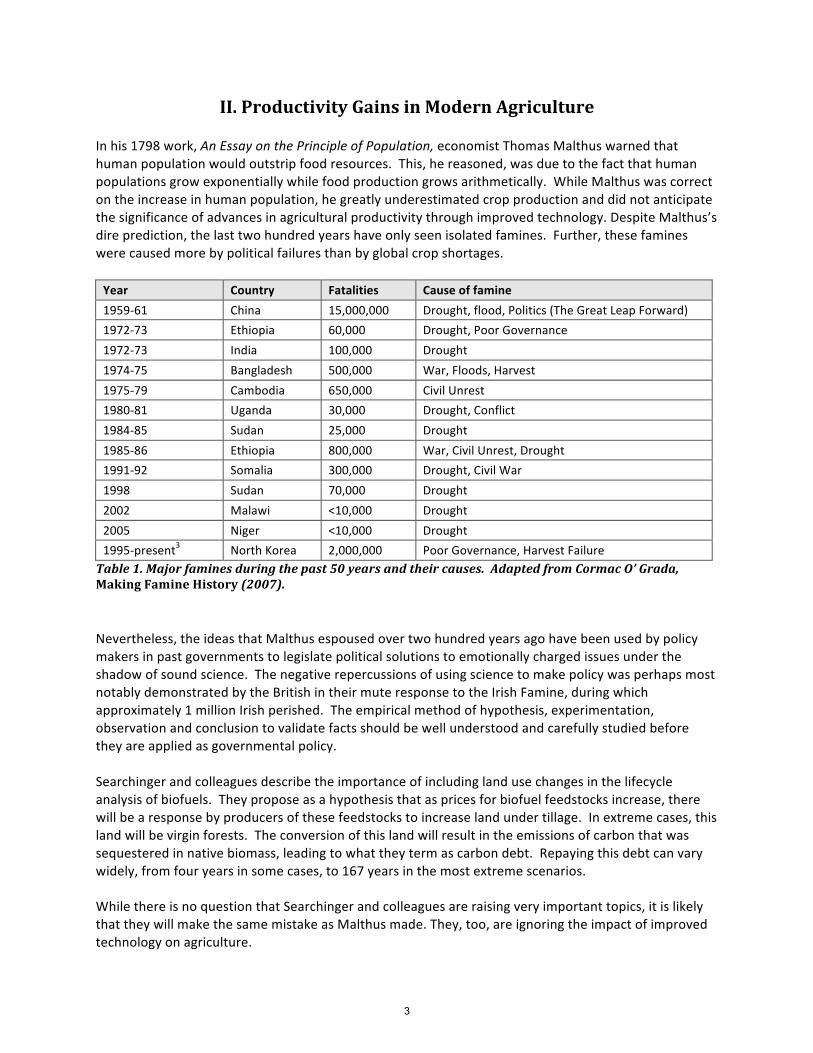
II. Productivity Gains in Modern Agriculture In his 1798 work, An Essay on the Principle of Population, economist Thomas Malthus warned that human population would outstrip food resources. This, he reasoned, was due to the fact that human populations grow exponentially while food production grows arithmetically. While Malthus was correct on the increase in human population, he greatly underestimated crop production and did not anticipate the significance of advances in agricultural productivity through improved technology. Despite Malthus’s dire prediction, the last two hundred years have only seen isolated famines. Further, these famines were caused more by political failures than by global crop shortages. Year Country Fatalities Cause of famine
1959-‐61 China 15,000,000 Drought, flood, Politics (The Great Leap Forward)
1972-‐73 Ethiopia 60,000 Drought, Poor Governance
1972-‐73 India 100,000 Drought
1974-‐75 Bangladesh 500,000 War, Floods, Harvest
1975-‐79 Cambodia 650,000 Civil Unrest
1980-‐81 Uganda 30,000 Drought, Conflict
1984-‐85 Sudan 25,000 Drought
1985-‐86 Ethiopia 800,000 War, Civil Unrest, Drought
1991-‐92 Somalia 300,000 Drought, Civil War
1998 Sudan 70,000 Drought
2002 Malawi <10,000 Drought
2005 Niger <10,000 Drought
1995-‐present3 North Korea 2,000,000 Poor Governance, Harvest Failure Table 1. Major famines during the past 50 years and their causes. Adapted from Cormac O’ Grada, Making Famine History (2007). Nevertheless, the ideas that Malthus espoused over two hundred years ago have been used by policy makers in past governments to legislate political solutions to emotionally charged issues under the shadow of sound science. The negative repercussions of using science to make policy was perhaps most notably demonstrated by the British in their mute response to the Irish Famine, during which approximately 1 million Irish perished. The empirical method of hypothesis, experimentation, observation and conclusion to validate facts should be well understood and carefully studied before they are applied as governmental policy. Searchinger and colleagues describe the importance of including land use changes in the lifecycle analysis of biofuels. They propose as a hypothesis that as prices for biofuel feedstocks increase, there will be a response by producers of these feedstocks to increase land under tillage. In extreme cases, this land will be virgin forests. The conversion of this land will result in the emissions of carbon that was sequestered in native biomass, leading to what they term as carbon debt. Repaying this debt can vary widely, from four years in some cases, to 167 years in the most extreme scenarios. While there is no question that Searchinger and colleagues are raising very important topics, it is likely that they will make the same mistake as Malthus made. They, too, are ignoring the impact of improved technology on agriculture.
3

The improvements in agriculture since the time of Malthus are staggering. While increasing crop yields from 1800 to the early 20th Century was largely driven by plowing more land, major advances took place in the last century that fundamentally changed global agriculture. These advances included mechanization, widespread utilization of synthetic fertilizer, hybrid corn and dwarf rice and wheat varieties and finally genetic engineering of crops. The 20th Century may very well be heralded as the Golden Age of Agriculture. While it is difficult to find accurate sources for historical grain production increases which go as far back as Malthus’s time, it is worth noting that between 1961 and 2007 global cereal production increased from 877 million tons to 2,341 million tons—an increase of almost 300 percent. Additionally, it must be noted that this increase in production was accomplished using only eight percent more land (FAO Database). This increase in crop yield is shown below.
Figure 1. Increase in major cereal (in metric tons) crops compared to change in land area in hectares, (FAO database)
The gains in agriculture have not been distributed equally across the globe. Corn agriculture is a good example of the difference between the top-‐producing countries and the lower yielding countries. The three top producing countries (United States, Argentina and China) produce on average 230 percent more than the low-‐producing countries of the Philippines, Romania and Ukraine. In fact, during the past three years, the United States has produced an average of 9.4 metric tons per hectare while Brazil averages only 3.4 metric tons per hectare. Since corn is derived from a tropical grass, one would conclude that the more tropical climate in South America would see greater yields than in North America. The differences in yield have less to do with environment than it does with agricultural and crop management practices. Growers in the top-‐producing countries have adopted numerous technologies including hybrid corn, precision agriculture and molecular biology. If Brazilian farmers were to adopt these agricultural practices and only achieve an increase of up to 75 percent of current U.S. yields, they would more than double production to 6.8 metric tons per hectare. This would result in an additional 1.83 billion bushels of corn or 5.3 billion gallons of ethanol and an additional 14 million tons of animal feed in Brazil alone—all without a single additional hectare of land being used.
4
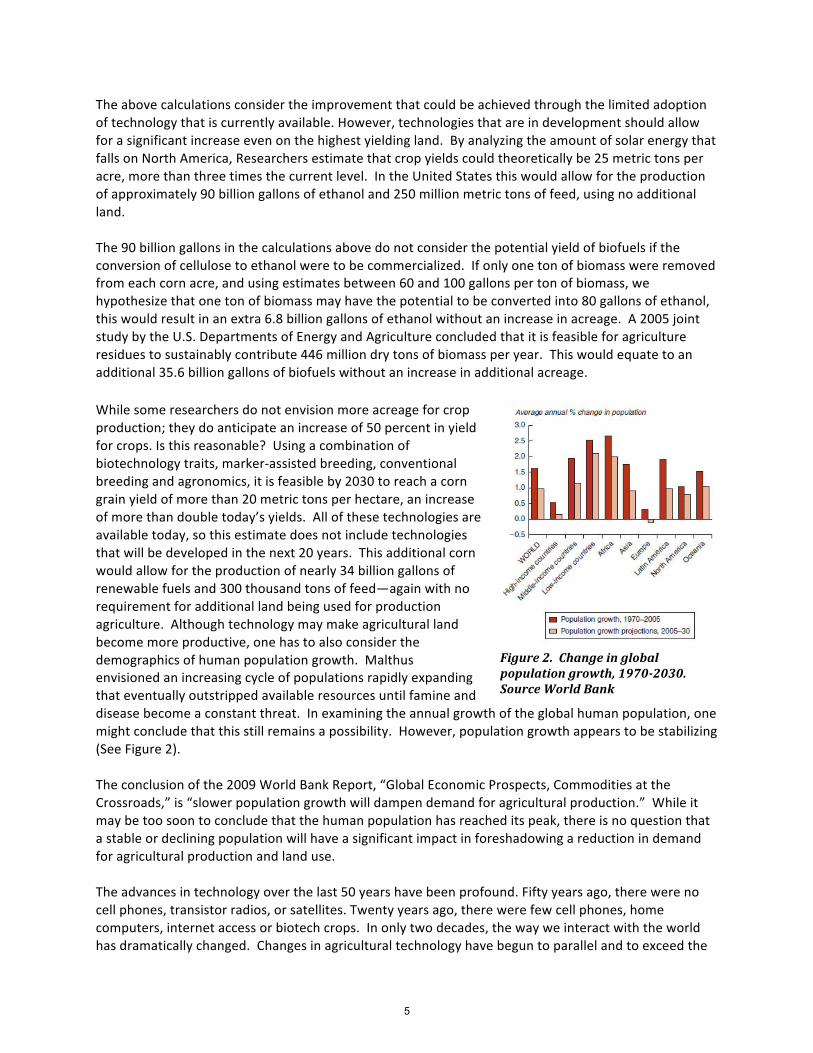
Figure 2. Change in global population growth, 1970-2030. Source World Bank
The above calculations consider the improvement that could be achieved through the limited adoption of technology that is currently available. However, technologies that are in development should allow for a significant increase even on the highest yielding land. By analyzing the amount of solar energy that falls on North America, Researchers estimate that crop yields could theoretically be 25 metric tons per acre, more than three times the current level. In the United States this would allow for the production of approximately 90 billion gallons of ethanol and 250 million metric tons of feed, using no additional land. The 90 billion gallons in the calculations above do not consider the potential yield of biofuels if the conversion of cellulose to ethanol were to be commercialized. If only one ton of biomass were removed from each corn acre, and using estimates between 60 and 100 gallons per ton of biomass, we hypothesize that one ton of biomass may have the potential to be converted into 80 gallons of ethanol, this would result in an extra 6.8 billion gallons of ethanol without an increase in acreage. A 2005 joint study by the U.S. Departments of Energy and Agriculture concluded that it is feasible for agriculture residues to sustainably contribute 446 million dry tons of biomass per year. This would equate to an additional 35.6 billion gallons of biofuels without an increase in additional acreage. While some researchers do not envision more acreage for crop production; they do anticipate an increase of 50 percent in yield for crops. Is this reasonable? Using a combination of biotechnology traits, marker-‐assisted breeding, conventional breeding and agronomics, it is feasible by 2030 to reach a corn grain yield of more than 20 metric tons per hectare, an increase of more than double today’s yields. All of these technologies are available today, so this estimate does not include technologies that will be developed in the next 20 years. This additional corn would allow for the production of nearly 34 billion gallons of renewable fuels and 300 thousand tons of feed—again with no requirement for additional land being used for production agriculture. Although technology may make agricultural land become more productive, one has to also consider the demographics of human population growth. Malthus envisioned an increasing cycle of populations rapidly expanding that eventually outstripped available resources until famine and disease become a constant threat. In examining the annual growth of the global human population, one might conclude that this still remains a possibility. However, population growth appears to be stabilizing (See Figure 2). The conclusion of the 2009 World Bank Report, “Global Economic Prospects, Commodities at the Crossroads,” is “slower population growth will dampen demand for agricultural production.” While it may be too soon to conclude that the human population has reached its peak, there is no question that a stable or declining population will have a significant impact in foreshadowing a reduction in demand for agricultural production and land use. The advances in technology over the last 50 years have been profound. Fifty years ago, there were no cell phones, transistor radios, or satellites. Twenty years ago, there were few cell phones, home computers, internet access or biotech crops. In only two decades, the way we interact with the world has dramatically changed. Changes in agricultural technology have begun to parallel and to exceed the
5

exponential growth of population espoused by Malthus rather than the arithmetic growth he envisioned. As we move from an economy driven by a petroleum based industry to a renewable fuels economy, the impact of changing technology, particularly when the time horizon under consideration is decades or centuries away must be considered as part of the modeling process. To date, to the contrary, it has not.
# # #
6