core discussion paper 2006/46 - gwdgwebdoc.sub.gwdg.de/ebook/serien/e/core/dp2006_46.pdf ·...
TRANSCRIPT
CORE DISCUSSION PAPER
2006/46
CLIMATIC CHANGE AND RURAL-URBAN MIGRATION: THE CASE OF SUB-SAHARAN AFRICA
Salavador BARRIOS1, Luisito BERTINELLI2 and Eric STROBL3
May 2006
Abstract
We investigate the role that climatic change has played in the pattern of urbanization in sub-Saharan African countries compared to the rest of the developing world. To this end we assemble a cross-country panel data set that allows us to estimate the determinants of urbanization. The results of our econometric analysis suggest that climatic change, as proxied by rainfall, has acted to change urbanization in sub-Saharan Africa but not elsewhere in the developing world. Moreover, this link has become stronger since decolonization, which is likely due to the often simultaneous lifting of legislation prohibiting the free internal movement of native Africans. Keywords: urbanization, climate change, rainfall, rural-urban migration, Africa JEL classification: O18, O55, Q54, R23
1European Commission. Joint Research Centre – Institute for Prospective Technological Studies. 2CREA, Université du Luxembourg and CORE. 3Ecole Polytechnique, Paris. The authors wish to thank Yasusada Murata and Kristian Behrens for their valuable help and participants at CORE seminar for their comments. Views expressed by the authors are not necessarily those of the institutions they are affiliated with. This text presents research results of the Belgian Program on Interuniversity Poles of Attraction initiated by the Belgian State, Prime Minister’s Office, Science Policy Programming. The scientific responsibility is assumed by the authors.
Section I: Introduction
It has been noted that historically economic development and urbanization have
tended to go hand in hand, and the legitimacy of this link continues to draw considerable
attention; see, for instance, the 1999/2000 issue of the World Development Report
(World Bank [36]). One notable exception to this stylised fact, however, has been sub-
Saharan Africa. More specifically, while sub-Saharan Africa’s growth rate of
urbanization, defined as the share of urban to total population, has been extraordinary by
international standards, averaging 140 per cent between the 1960s and the 1990s - which
is a rate of ten times that of OECD countries and 2.5 times that of the rest of the
developing world – it does not appear to have been coupled with an improvement in
economic wealth in this region of the world; see Fay and Opal [11] and World Bank
[36].4 Furthermore, it is now a well known fact that internal migration has been a major
factor fuelling the growth of Africa’s cities. For example, it has been estimated that rural-
urban migration has accounted for roughly half of urban growth in Africa between the
1960s and 1990s (Zachariah and Conde [37], Kelley [18]), with large variations across
countries. These evolutions and further predicted increases in urbanization have
consequently raised concerns about the capacity of Africa’s urban system to absorb such
massive movements of population and its impact on sustainable development.
A natural starting point in trying to understand the lack of connection between
urbanization and development in sub-Saharan Africa is to analyse the potential
determinants of urbanization on this continent. From the general literature on what
causes urbanization, one can essentially distinguish between two groups of explanations
of rural-urban movements, which we loosely label as demand pull and supply push type.
With regard to the former, it is generally assumed that modern sectors of production,
4 Moreover, according to UN [32] projections, sub-Saharan Africa’s urbanization should further increase by about 3.5 per cent annually in the next 30 years.
2
which generally locate in urban areas, have higher rates of productivity and monetary
reward than the traditional rural agricultural sector and hence attract urban-rural
migrants. As highlighted in the seminal work by Harris and Todaro [14], this may happen
despite persistent unemployment in urban areas since potential migrants base their
decision on their expected income. Thus, urbanization in developing countries may result
from the existence of a market failure, leading to the so-called over-urbanization thesis;
see, amongst others, Gugler [13]. More recently, by adding rural-urban migration to a
standard monocentric city model, Brueckner [7] points as well to the importance of the
income gap between urban and rural areas as a determinant of urbanization in developing
countries. Apart from the general urbanization issue, several studies have also focused in
particular on explaining the spectacular and arguably unsustainable growth of mega cities,
i.e., urban primacy, defined as the share of the population of the largest city in total
urban population. Using a sample of developed and developing countries, Ades and
Glaeser [1] show, for instance ,that rent-seeking activities have been paramount in
explaining the rise of such mega-cities, while Davis and Henderson [8]’s results on panel
data support these findings, highlighting more generally the importance of political
factors in explaining the growth of mega cities.
Supply-push explanations, in contrast, essentially refer to the possibility that other
factors directly affecting the rural sector have favoured population movements towards
cities but may not necessarily result in productivity improvements. These may include
displacement of population due to civil conflicts or other more direct determinants of
agricultural production. As such, rural to urban migration can be seen as a survival
strategy, affecting especially the poorest segment of the rural population.5 One particular
supply-push type factor that may have been important in determining urbanization in
5 Educational levels seem to play little role in determining migration in many developing countries, as indicated by the fact that many migrants work in low skilled informal sector jobs, such as street vending, see Todaro [31].
3

Africa, and that is the focus of the current paper, is that of climate change. In particular,
long-run climate change scenarios tend to suggest that extreme climate variations and,
more specifically, water shortages, are likely to cause abrupt changes in human
settlements and urbanization patterns in sub-Saharan Africa more than anywhere else in
the world; see Watson et al. [34]. It has also relatively recently been noted that rainfall in
Africa has, in general, been on a decline since its relative peak in the 1960s; see, for
instance, Nicholson [27, 28]. The specific effects of climate change on rural-urban
migration in sub-Saharan Africa have, however, as of date been poorly documented. A
particularly important starting-point is that sub-Saharan African agriculture is especially
dependent on rainfall compared to most other developing countries, which exacerbates
the potential impact of rainfall variations on economic activity; see Barrios et al. [2].
These impacts are, in turn, especially pronounced in rural areas where agriculture
concentrates, and thus potentially affect rural-urban migration patterns. In this regard,
one should note that, although climate per se is seldom the direct root of migration,
except in extreme cases like floods or droughts, it clearly can, however, exacerbate
difficult living conditions at the margin of subsistence.
The current paper provides empirical evidence showing that climatic change has
been an important determinant of rural-urban migration in sub-Saharan Africa. More
generally, our focus is linked to the concept of eco-refugees or environmental refugees, where
environmental conditions may influence socio-economic conditions and hence migration
(Myers [26]).6, 7 We specifically set out to investigate the role of the general decline in
rainfall on the African continent since the 1960s in shaping its urbanization patterns. In
this regard we take advantage of a new comprehensive cross-country data set on rainfall
6 The term was actually first popularised by Lester Brown of the Worldwatch Institute in the 1970s, but perhaps the most quoted contributions on the subject are those of El-Hinnawi [10] and Jacobson [16]. 7 Although difficult to estimate, the number of environmental refugees ranges worldwide from 10 to 25 millions (Myers [26]).
4
and commonly used United Nations data on urbanization. Placing these in an
econometric specification of the determinants of urbanization we then explicitly test for
the impact of rainfall on urbanization in sub-Saharan Africa using other developing
countries as a natural control group. Our results show that rainfall has indeed been an
important determinant of urbanization growth in sub-Saharan Africa. Moreover, we find
that this effect was much stronger after decolonization when there were less restrictions
on migration in most countries.
The remainder of the paper is organised as follows. In section II, we outline a
simple theoretical specific factor framework to demonstrate how rainfall may affect
urbanization patterns. In section III, we discuss Africa’s rural sector vulnerability to
shortages in rainfall. Section IV describes our data and provides summary statistics. Our
econometric framework and estimation results are presented in section V. Concluding
remarks are provided in the final section.
Section II: The Link between Rural-Urban Migration and Rainfall: A Specific
Factors Framework
The specific factors model (Jones [17]) is a particularly useful theoretical
framework in order to conceptualize the link between rural-urban migration and changes
in rainfall. Here we use a slightly modified version of this model in order to consider the
effect of variations in rainfall in the agriculture sector. Accordingly, suppose we have an
economy that has two industries, the rural/agricultural sector (A) and the
urban/manufacturing sector (M), and three factors of production, “effective” land input
(L), labor (N), and capital (K). Here, land is specific to the agricultural sector whereas
capital is specific to the manufacturing sector, and labor is supposed to be freely mobile
5

between the two sectors. The production function in the rural/agricultural and the
urban/manufacturing sectors are
(1) ,1 AAAA NLY αα−=
MMMM NKY αα−= 1 (2)
where K stands for capital endowment of the small and open economy and Aα ( Mα ) is
the elasticity of agricultural (manufacturing) output with respect to labour. Unlike the
standard specific factors model, we assume that the effective land input depends on the
level of rainfall (R), that is, L=L(R). In order to have a positive impact of rainfall on the
effective land input, we assume L’(R)>0. We also assume that the economy is small in
the sense that prices of the two sectors, Ap and Mp , are exogenously given.
For simplicity we postulate that both the agricultural and the manufacturing sectors
exhibit constant returns to scale technologies. In this case, first order conditions lead to
the following results:
( )RLpwNw
NYp
A
A
AAA
A
AA
α
αα−
−
−
⎟⎟⎠
⎞⎜⎜⎝
⎛=⇒=
∂∂ 1
1
11
(3)
KpwNw
NYp
M
M
MMM
M
MM
α
αα−
−
−
⎟⎟⎠
⎞⎜⎜⎝
⎛=⇒=
∂∂ 1
1
11
. (4)
where NA/NM is the mass of workers in the agricultural/manufacturing sector.
From equations (3) and (4) and the labor market equilibrium condition, NNN MA =+ ,
we have the equilibrium wage rate and the equilibrium distribution of workers between
the two sectors { }*** ,, MA NNw , as functions of the parameters ( ){ }MA ppKRL ,,, . The
equilibrium urbanization rate is given by NNU M*≡ .
6
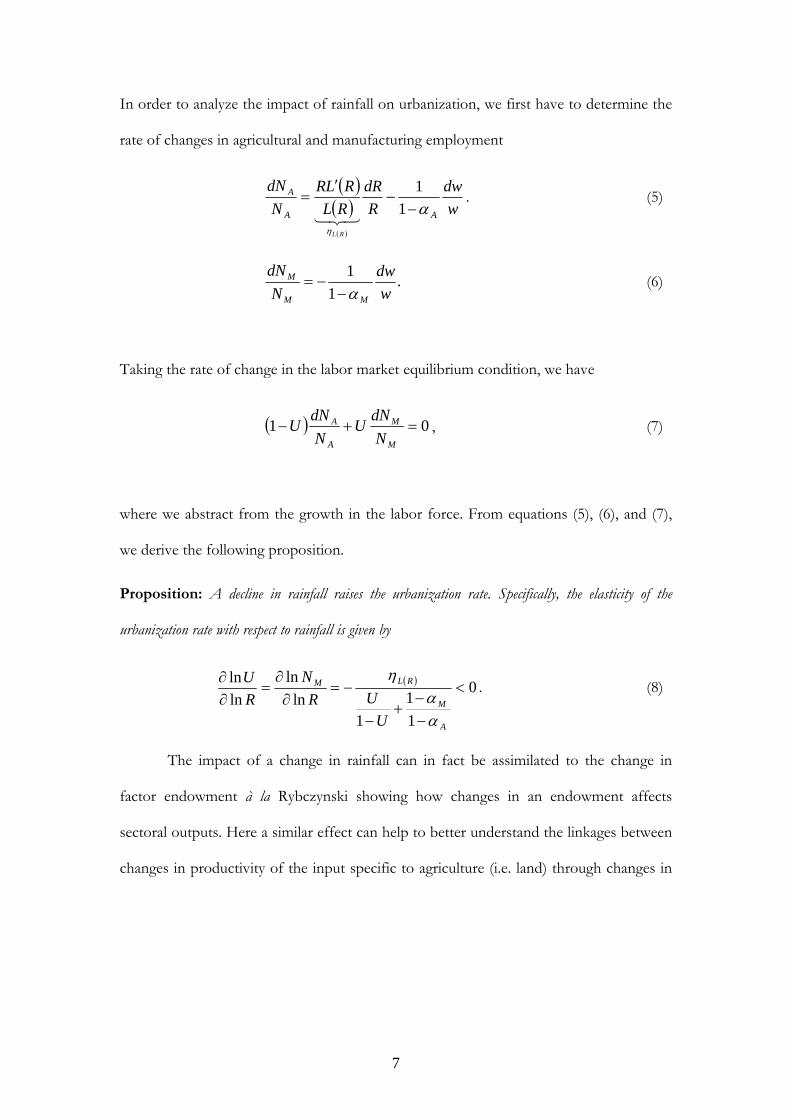
In order to analyze the impact of rainfall on urbanization, we first have to determine the
rate of changes in agricultural and manufacturing employment
( )( )( )
wdw
RdR
RLRLR
NdN
AA
A
RL
αη
−−
′=
11
321
. (5)
.1
1wdw
NdN
MM
M
α−−= (6)
Taking the rate of change in the labor market equilibrium condition, we have
( ) 01 =+−M
M
A
A
NdNU
NdNU , (7)
where we abstract from the growth in the labor force. From equations (5), (6), and (7),
we derive the following proposition.
Proposition: A decline in rainfall raises the urbanization rate. Specifically, the elasticity of the
urbanization rate with respect to rainfall is given by
( ) 0
11
1ln
lnlnln
<
−−
+−
−=∂∂
=∂∂
A
M
RLM
UUR
NRU
αα
η. (8)
The impact of a change in rainfall can in fact be assimilated to the change in
factor endowment à la Rybczynski showing how changes in an endowment affects
sectoral outputs. Here a similar effect can help to better understand the linkages between
changes in productivity of the input specific to agriculture (i.e. land) through changes in
7

rainfall and changes in the urbanization rate through change in the relative share of
manufacturing versus agriculture employment.8
Section III: The Rainfall Dependence of sub-Saharan African Agriculture
The dependence of sub-Saharan African (henceforth SSA) agriculture on rainfall
and its implications for Africa’s economic development has been widely documented in
the literature. The present section summarizes this literature and more extended
discussion can be found, for instance in Barrios et al. [2] and Intergovernmental Panel of
Climate Change (2001) [henceforth referred to as IPCC]. Changes in rainfall can
potentially have a wide array of economic implications anywhere in the developing world
given that rainfall is the main driver of water balance variability both over space and time.
Historically, however, shortages in rainfall in Africa seem to have been associated with
particularly damaging consequences, in the most extreme cases causing food and water
deficiencies and the death and displacement of substantial shares of population. Part of
the reason of why shortages in rainfall have been important for Africa is certainly due to
the importance of the agricultural sector in its economies. Table 1 shows, for example,
that agriculture has traditionally had a higher share in GDP in Africa than in any other
developing regions – nearly 40 per cent in 1960. Although this share has since been
steadily decreasing, it still represents almost a third of total GDP in 1997, compared to
the average 14.1 per cent in the rest of the developing world. In particular, African
agriculture relies heavily on rainfall for the provision of water for crops. Indeed,
compared to other developing areas in the world, a much smaller proportion of cropland
is irrigated. More generally speaking, the geographic and climatic conditions specific to 8 One should note that given that there are no empirical data, we do not consider a market for land and hence the impact of land prices in our model.
8
the African continent explain to a great extent why agriculture in SSA is so vulnerable to
water shortages.
Generally speaking, agriculture in the African tropical area is seriously hampered
by high temperature, fragile soils, and low yield potential. It also suffers from chronic
diseases affecting both animal and non-animal production. Outside its equatorial area, a
large share of Africa’s arable land suffers from aridity, tending to increase the risk of
drought as drier soil absorbs more rainfall; see Bloom and Sachs [6].9 The vulnerability to
rainfall in the arid and semiarid areas of the continent also translates into a poor capacity
of most African soils to retain moisture. Furthermore, evapotranspiration is in turn
relatively high in Africa, as a consequence of high temperature throughout the year, thus
leaving low quantities of water for soil moisture.10 The reduction of vegetative cover
experienced by Africa over the past decades has also added to the insufficient inter-
annual soil water storage; see UNEP [33]. Land-surface and atmosphere conditions may
thus interact positively as a feedback mechanism leading to a further decrease in
precipitation.
Agricultural practices often add to the water shortage problem in Africa more
than anywhere else due to differences in property rights. More precisely, because farmers
are often not owners of the land they work on, the preservation of natural resources is
often viewed as a secondary objective. In addition, pressures represented by increasing
populations and changing technology add to the problem of land deterioration related to
agricultural practices; see, for example, Drechsel et al. [9]. Problems associated with land
use through, for example, deforestation, can translate into increased erosion. Another
illustration of environment-damaging agricultural practices is the intense use of fertilizer
9 Today, around 60 per cent of African countries are considered to be vulnerable to drought and 30 per cent extremely so; see Benson and Clay [4]. 10 Evapotranspiration is the combination of water that is evaporated and the one that is transpired by plants as a part of their metabolic process.
9
in low-quality lands. As yields increase, so will water consumption, thus creating a vicious
cycle; see Gommes and Petrassi [12]. This causes greater exposure to desertification with
the shortages in rainfall directly influencing agricultural productivity. Human practices
can also add to the desertification risks through overgrazing, which is represented by
higher density and/or shorter rotations of livestock beyond the limit of the ecosystem, in
particular because range-fed livestock are usually concentrated in the arid and semi-arid
areas since tropical areas provide potentially more exposure to animal diseases; see IPCC
[15].
This high vulnerability of agriculture on climatic conditions in turn opens the
door to the possibility of large-scale migrations of those whose livelihood essentially
depends on rain-fed agriculture, the so-called environmental migrants that have partly
converged to cities. As a matter of fact, in SSA countries, urban growth has essentially
been achieved through in-migration of agricultural populations, where nearly half of
Africa’s urbanization in the last decades has been achieved by rural-urban migration,
although there have been large variations across countries (Kelley [18]).
10
Section IV: Data and Summary Statistics
As is standard in recent studies of urbanization and urban concentration, the data
set underlying our econometric analysis consists of five-year interval observations to
avoid issues related to temporal dependence. Given the missing values for some
countries and some time periods, the nature of our data consists of an unbalanced panel,
covering 78 countries and spanning over a 30-year period (1960-90).
Rainfall Data
The basic hypothesis of the paper poses that climatic conditions push people out
of rural/agricultural areas to urban areas.11 Our measure of climatic condition will be the
rainfall level in a country and is taken from the Inter-Governmental Panel on Climate
Change (IPCC) data set, which provides, amongst other things, time series data on the
average annual rainfall for 289 “countries” (comprised of 188 states and 101 islands and
territories) from 1901 to 1998; see Mitchell et al [24] for a complete description of the
data set. These rainfall series were constructed by assimilating measurements of rainfall
from meteorological stations across the world into 0.5 degree latitude by 0.5 degree
longitude grids covering the land surface of the earth. Each grid-box was then assigned
to the appropriate country in order to calculate a measure of rainfall for each by using the
weighted mean of the values of all grid boxes within a country.12 This procedure resulted
in comparable mean measures, given in millimetres per square meters, of annual rainfall
for each country. For the purposes of this paper we use observations on developing
countries, where we consider a country to be of developing status if it is either a low,
11 One should note that arguably rainfall may have effects on the level, rather than just the composition, of the population. This is beyond the focus of the current analysis. 12 Where a grid box was located across more than one country, the grid box was assigned to the country with the largest stake, except where a country would otherwise have been left without any grid box. Weighting was essential since the spatial areas represented by each grid box differ in latitude. For further details; see Mitchell et al [24].
11
lower-middle, or upper-middle income nation according to the World Bank 2001
definition. All countries used in any part of our empirical analysis are listed in Appendix.
There are a number of issues to be noted in terms of constructing and using the
cross-country measure of annual rainfall. First, we chose to normalize the rainfall
measure provided in the data set by the long-term mean annual rainfall in each country.
This was primarily done because we are interested in climatic changes, rather than
permanent cross-country climatic differences in levels. In order to avoid any concerns
regarding the exogeneity of this normalization factor we used the mean of the annual
rainfall for the period prior to 1960, although using the long-term mean over the entire
available period produced very similar results.13 One should note that a similar measure
is also used by the FAO; see Gommes and Petrassi [12]. Since our econometric analysis
focuses on the effect of rainfall on long-term, five-year, intervals, we calculated the
simple arithmetic mean of the annual normalised rainfall measure over the appropriate
five-year intervals.
One other aspect with regard to our rainfall measure that deserves discussion,
because it has plagued many studies examining other potential determinants of Africa’s
poor growth performance, is the question of its exogeneity. In terms of rainfall we can
argue fairly confidently that it is a strictly exogenous factor given that it measures an
aspect of climatic change. While one could in theory also hypothesize that perhaps
economic activity affects such aspects as environmental degradation and desertification,
and thereby possibly rainfall, Nicholson [27] finds no evidence suggesting such. As a
matter of fact, earlier historical data suggests that rainfall naturally moves through long
cycles of relative troughs and peaks, and that a cycle similar to the present one seems to
have occurred in the 19th century; see Nicholson [28].
13 Details are available from the authors.
12
Finally, one should note that our measure of rainfall only offers a countrywide
measure of precipitation. Clearly, however, particularly in large countries there may be
considerable variation even within national boundaries and constraints on growth may
thus be due to logistical problems of redistribution. Given the lack of data, we
unfortunately have to abstract from any intra-country climatic variation. Having said this,
one must remark that first this problem is partly tackled by using a fixed effect estimator,
purging out time invariant unobservable covariates, which is likely to be a characteristic
common to measurement errors in rainfall.14 Furthermore, issues related to the
aggregation of variables at the macro level are inherent to all cross-country empirical
analysis.
Figure 1 depicts the long-term trends in our normalised rainfall measure for SSA
countries. As can be seen, while variable, the mean rainfall in SSA countries remained
roughly constant during the first part of the 20th century until the 1950s, peaking in the
late 1950s. However, since this peak, rainfall has been on a clear downward trend. As a
matter of fact, apart from a peak in 1980, mean rainfall has been for the most part lower
than during the first 60 years of the century. These trends suggest that there has been an
important climatic change in SSA since about roughly the late 1970s. Figure 2 shows, in
contrast, that average annual rainfall in non sub-Saharan developing countries displays no
such trend.
Urbanization
Our source to construct the urbanization data stems from the UN World
Urbanization Prospects [32], where urbanization is defined as the share of population
living in cities to total population living in the country, and for which information is
given over 5-year periods. Definitions of urbanization are those used by national statistics
14 In a recent study, Miguel et al [22] similarly use a country-level rainfall-variation measure in order to instrument growth in African countries.
13

offices based on their latest census data. Thus, different countries having different
definitions of cities, our measure of urbanization is not consistent across countries.15
One has, however, to note that data from the World Urbanization Prospects is adjusted,
whenever possible, when there are definitional changes between two censuses in a
country. Consequently, one can confidently consider that definitional differences of
urbanization across countries are time invariant, and thus absorbed by the fixed effect.
Figures from the UN World Urbanization Prospects reveal that urbanization
growth rates in SSA countries have been steadily above those of the rest of the
developing world over the past half century. For example, in 2000 Africa’s share of urban
to total population reached 37 per cent (UN [32]), driven by an average annual growth
rate of the urban population share of 4.4 per cent between 1950 to 2000. In comparison
the rest of the developing world experienced average annual growth rates of urbanization
in the order of only 2.5 per cent over the same period.
Other Data
In terms of controlling for other potential determinants of urbanization in our
econometric modelling we chose a set of covariates that are standard in the literature
studying the determinants of urbanization (Ades and Glaeser [1], Brueckner [7], Davis
and Henderson [8], Gugler [13] among others). First, we use the size of a country’s
population and this measure interacted with land area since for a given population, a
larger land area reduces population density, and thus influences transport within the
country, which in turn might impact on urbanization through standard
forward/backward linkages (Krugman and Livas Elizondo [19]). Information measuring
these two variables is derived from the Penn World Tables (PWT) and the World
Development Indicators (WDI), respectively. It has also been argued that openness to
15 For instance, Argentina includes in its urbanization variables population centres with 2,000 inhabitants or more, whereas this threshold is 5,000 for Mali.
14
international markets is intrinsically linked to urbanization as countries with higher shares
of trade in GDP rarely have their population concentrated in a single city. The rationale
for this is that, given imported goods are not cheaper in large cities, consumers spread
over space to save on congestion costs (Ades and Glaeser [1]). We thus also control for
openness using the measure contained in the PWT.
In the endogenous growth literature, a close connection between urbanization
and national economic growth has been recognized; see, for instance, Lucas [20].
Although the causality has been subject of intense debates, it is a well-admitted fact that
sustained economic growth has always been accompanied by urbanization. In their panel
data study, McCoskey and Kao [21] have for instance shown that a long run relationship
between urbanization, output per worker and capital per worker cannot be rejected on a
sample of 30 developing countries. We thus add a measure of GDP/capita as a control
regressor in our specification.
More recently, it has also been shown that civil wars within a country and
bordering countries can influence differences in rates of economic development across
countries (Murdoch and Sandler [25]), and that during periods of armed conflicts one can
usually observe increases in urban immigration because people often seek safety and try
to escape famines in well-supplied urban areas (Berhanu and White [5]). As a proxy for
this we use the civil war variable constructed by Murdoch and Sandler [25], which is
measured as the number of years of civil wars in a country. Furthermore, Barro [3] has
shown that there is a negative link between urbanization and democracy. Non-
democratic institutions may disfavour urbanization on the ground that cities make it
easier for people to meet and communicate. As Weber [35] already noted, city air makes
one free. Conversely, assembling people makes it easier for an autocrat to monitor and
control the people, and as a corollary, more democratic institutions would then facilitate
15
displacement of people through migrations, among others rural-urban migrations. To
account for this, we use the democracy variable from the POLITY database, which
ranges from 0 (lowest) to 10 (highest) and measures general openness of political
institutions.
Finally, during periods of colonization there notably were restrictions on intra-
national movements of population, especially for African natives, in certain regions of
Africa. Thus, in order to take account of this we use a decolonization indicator variable,
equal to 0 when countries were colonized and 1 otherwise. The information on the date
of decolonization has been taken from the CIA factbook.16
Summary Statistics
Using available data on rainfall and the other control variables listed above left us
with a sample of 78 developing countries, of which 36 are SSA and the remainder are
non-sub-Saharan African (henceforth NSSA), for five-year periods over the years 1960-
1990. Furthermore, for some five-year periods, data was missing for some countries, so
that our panel is of an unbalanced nature.
Summary statistics of all our explanatory variables across the two groups are
given in Table 2. Accordingly, one finds, as would be expected, that urbanization is
lower in SSA than elsewhere. One should also note that normalised rainfall is lower,
compared to rainfall figures in NSSA nations. In terms of the other variables, one
discovers that SSA countries are poorer, but have greater openness. Also, while they are
less democratic, they have nevertheless experienced less civil wars. Moreover, the
summary statistics on population size and land area suggest that African countries are
much less populated and have lower population densities on average. Finally, during our
16 For details; see: http://www.cia.gov/cia/publications/factbook/
16

sample period there were more periods of colonialization in SSA than in NSSA
countries.
Section V: Econometric Results
In order to validate the basic hypothesis of the paper, we run parametric
estimations examining the determinants, including climatic change, of urbanization. In
particular, we estimate
Uit = α + βXit + δRit + λt + μi + εit (9)
where U is the log of urbanization rate, defined as the share of urban to total population,
R is our primary explanatory variable, i.e., log of rainfall, X is a vector of other time
varying potential determinants, λ are year specific effects common to all countries, μ are
time invariant country specific effects possibly correlated with other explanatory
variables, and ε is the usual error term. In order to purge the effects of μ, i.e., all time
invariant determinants, from (9) we, as is common in cross-country studies with time
dimension, use a fixed effects estimator.
Our results of estimating (9), first without including our proxy for climatic
change, are shown in the first column of Table 3. As can be seen, only openness and
democracy play significant roles in determining the rate of urbanization. In this regard,
one should note that openness is in line with a priori expectation, i.e., economies that are
more open also have higher rates of urbanization, while democracy encourages lower
urbanization. In the second column of the same table we subsequently included our
measure of climatic change, i.e., rainfall. The negative and highly significant coefficient
on this proxy provides strong support for our main hypothesis embodied in (9), where,
accordingly, decreases in rainfall encourage migration to urban areas. The size of the
17
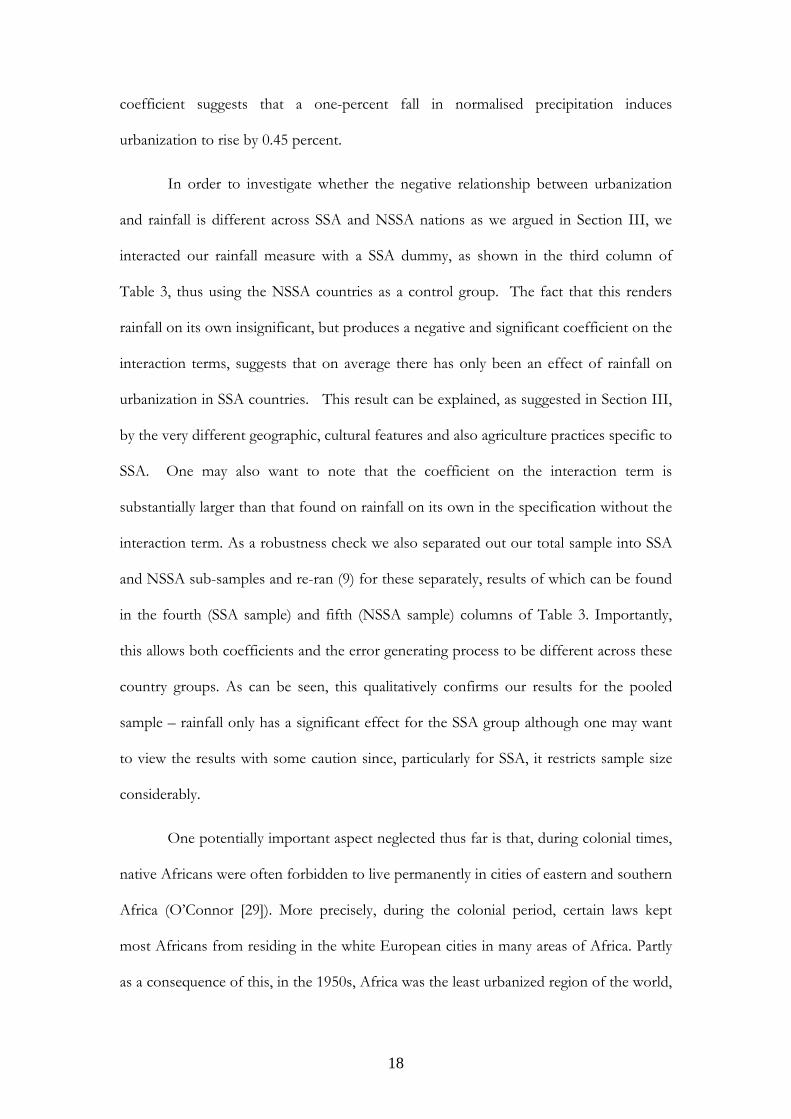
coefficient suggests that a one-percent fall in normalised precipitation induces
urbanization to rise by 0.45 percent.
In order to investigate whether the negative relationship between urbanization
and rainfall is different across SSA and NSSA nations as we argued in Section III, we
interacted our rainfall measure with a SSA dummy, as shown in the third column of
Table 3, thus using the NSSA countries as a control group. The fact that this renders
rainfall on its own insignificant, but produces a negative and significant coefficient on the
interaction terms, suggests that on average there has only been an effect of rainfall on
urbanization in SSA countries. This result can be explained, as suggested in Section III,
by the very different geographic, cultural features and also agriculture practices specific to
SSA. One may also want to note that the coefficient on the interaction term is
substantially larger than that found on rainfall on its own in the specification without the
interaction term. As a robustness check we also separated out our total sample into SSA
and NSSA sub-samples and re-ran (9) for these separately, results of which can be found
in the fourth (SSA sample) and fifth (NSSA sample) columns of Table 3. Importantly,
this allows both coefficients and the error generating process to be different across these
country groups. As can be seen, this qualitatively confirms our results for the pooled
sample – rainfall only has a significant effect for the SSA group although one may want
to view the results with some caution since, particularly for SSA, it restricts sample size
considerably.
One potentially important aspect neglected thus far is that, during colonial times,
native Africans were often forbidden to live permanently in cities of eastern and southern
Africa (O’Connor [29]). More precisely, during the colonial period, certain laws kept
most Africans from residing in the white European cities in many areas of Africa. Partly
as a consequence of this, in the 1950s, Africa was the least urbanized region of the world,
18
with roughly 15 per cent of its inhabitants living in urban centers, compared to figures
above 30 per cent in the rest of the developing world and around 60 per cent in the
developed countries. These strict prohibitions disappeared after independence except in
South Africa.17 Thus, when the African colonies obtained their independence, migration
to cities increased sharply, changing the racial composition of cities and leading to rapidly
mounting urban populations. Following a catch up movement, urbanization accelerated
rapidly after independence with mass movement of population away from the rapidly
deteriorating agricultural sector and the fall in world raw commodity prices in the early
1980s (Miller and Singh [23]).
Given that part of the time series used here captures times of decolonialization,
particularly in SSA, we have further investigated the possibility that rainfall’s impact on
urbanization in SSA countries may have changed for some countries in our estimations.
In order to do so, we have interacted a decolonization dummy jointly with the SSA
dummy and the rainfall variable in the last column of Table 3. Moreover, in order to
ensure that we are not just capturing other factors that altered with colonial
independence, we also appropriately included the dummy on its own, its interaction with
rainfall, and its interaction with the SSA dummy. Firstly, the coefficient of the
interaction term with the SSA dummy suggests that urbanization in SSA increased
significantly after countries became independent as one would naturally expect following
the discussion above. More importantly, however, while the coefficient on the
interaction term between the SSA dummy and rainfall remains negative and statistically
highly significant, the coefficient on the interaction term of the decolonization dummy,
17 The case of South Africa is of particular interest. It gained its independence in 1910, but segregation laws continued to persist, especially after the adoption of the policy of apartheid in 1948. During the 19th century, separate villages for African and colored people were established in the smaller towns. Official segregative tendencies were given a boost by the outbreak of bubonic plague in Cape Town and Port Elizabeth in 1901, with the establishment of new state-controlled African locations several kilometres from the centers of the two cities (Swanson [30]). This in turn drastically limited the pace of urbanization in South Africa.
19
the SSA dummy, and rainfall also displays a statistically significant negative coefficient.
This implies that in times of independence, rainfall has had a reinforced impact on
internal migration towards cities. This result, in turn, is consistent with the argument
according to which decolonization has allowed greater internal movement of individuals,
in response to climatic conditions.
Section VI: Conclusion
In this paper we have examined whether climatic change in terms of decreasing
trends in rainfall may provide some explanation towards the very different urbanization
patterns that have taken place in sub-Saharan Africa compared to other developing
countries over the last several decades. Our analysis suggests that indeed this has been
the case. Specifically, we find that while shortages in rainfall have acted to increase rates
of urbanization on the sub-Saharan African continent, there is no evidence of such for
the rest of the developing world. Moreover, our analysis suggests that this link was
reinforced after colonial independence of sub-Saharan African countries, which often
resulted in the simultaneous lifting of legislation prohibiting the free internal movement
of native Africans.
20
References
[1] A. Ades, E. Glaeser, Trade and Circuses: Explaining Urban Giants, Quarterly
Journal of Economics. 110 (1995) 195-228. [2] S. Barrios, L. Bertinelli, E. Strobl, Dry Times in Africa: Rainfall and Africa's
Growth Performance, Center for Operations Research and Econometrics (CORE) Discussion Paper 61 (2003). [3] R. Barro, Determinants of Democracy, Journal of Political Economy, 107 (1999)
158-183. [4] C. Benson, E. Clay, The Impact of Drought on Sub-Saharan Economies, World
Bank Technical Paper No. 401 (1998). [5] B. Berhanu, M. Whit, War, famine, and female migration in Ethiopia, Economic
Development and Cultural Change, 49 (2000) 91-113. [6] D.E. Bloom, J.D. Sachs, Geography, Demography, and Economic Growth in
Africa, Brookings Papers on Economic Activity 2 (1998) 207-273.
[7] J. Brueckner, Analyzing Third World Urbanization: A Model with Empirical Evidence, Economic Development and Cultural Change, 38 (1990) 587-610. [8] J. Davis, J.V. Henderson, Evidence on the Political Economy of the Urbanization
Process, Journal of Urban Economics, 53 (2003) 98-125. [9] P. Drechsel, L. Gyiele, D. Kunze, O. Cofie, Population density, soil nutrient
depletion, and economic growth in sub-Saharan Africa, Ecological Economics 38(2001) 251-258. [10] E. El-Hinnawi, Environmental Refugees, United Nations Environment Programme, Nairobi (1985). [11] M. Fay, C. Opal, Urbanization without Growth: A not so uncommon Phenomenon, World Bank Working Paper 2412 (2000). [12] R. Gommes, F. Petrassi, Rainfall variability and drought in sub-Saharan Africa since 1960. FAO Agrometeorology Series 9 (1996). [13] J. Gugler, Overurbanization Reconsidered, Economic Development and Cultural Change, 31 (1982) 173-189 [14] J.R. Harris, M.P. Todaro, Migration, Unemployment and Development: A Two-Sector Analysis, American Economic Review, 60 (1970), 126-142. [15] Intergovernmental Panel on Climate Change, Climate Change 2001: Impacts, Adaptation and Vulnerability - Contribution of Working Group II to the Third Assessment Report of IPCC (2001).
21
[16] J. Jacobson, Environmental Refugees: a Yardstick of Habitability, World Watch Paper 86 (1988). [17] R.W. Jones, A three-factor model in theory, trade, and history, in: (J.N. Bhagwati, R.W. Jones, R.A. Mundell, J. Vanek, (Eds.), Trade, Balance of Payments, and Growth, North-Holland, Amsterdam, 1971, pp. 3-21. [18] A. Kelley, African Urbanization and City Growth: Perspectives, Problems, and Policies. Unpublished manuscript, Duke University (1991). [19] P. Krugman, R. Livas Elizondo, Trade Policy and the Third World Metropolis, Journal of Development Economics, 49 (1996) 137-150. [20] R. Lucas, On the mechanics of economic development, Journal of Monetary Economics, 22 (1988) 3-42. [21] S. McCoskey, C. Ka, A Panel Data Investigation of the Relationship Between Urbanization and Growth, mimeo Syracuse University (1998). [22] E. Miguel, S. Satyanath, E. Sergenti, Economic Shocks and Civil Conflict: An Instrumental Variables Approach, Journal of Political Economy, 112 (2004) 725-753. [23] H.M. Miller, R.N. Singh, Urbanization during the Postcolonial Days, in: J.D. Tarver (Ed.), Urbanization in Africa: A Handbook, , Greenwood Press, London, 1994. [24] T.D. Mitchell, , M. Hulme, M. New, Climate data for political areas. Area 34 (2002) 109-112. [25] J. Murdoch, and J. Sandler, Economic Growth, Civil Wars, and Spatial Spillovers, Journal of Conflict Resolution, 46 (2002) 91-110. [26] N. Myers, Environmental refugees in a globally warmed world, BioScience, 43 (1993) 752-60. [27] S.E. Nicholson, Recent rainfall fluctuations in Africa and their relationship to past conditions over the continent, The Holocene, 4 (1994) 121-131. [28] S.E. Nicholson, Climatic and Environmental Change in Africa During the Last Two Centuries, Climate Research, 17 (2001) 123-144. [29] A. O’Connor, The African City, Africana Publishing Company, New York (1983). [30] M.W. Swanson, The Sanitation Syndrome: Bubonic Plague and Urban Native Policy in the Cape Colony 1900-1909, Journal of African History, 18 (1977) 387-410. [31] M. Todaro, Economic development in the Third World. Longman: New York (1989). [32] UN, World Urbanization Prospects: The 2003 Revision. United Nations Department of Economic and Social Affairs/Population Division (2003).
22

[33] UNEP, World Atlas of Desertification, United Nations Environment Program, Edward Arnold, London (1997). [34] R.T. Watson, M.C. Zinyowera, R.H. Moss, D.J.Dokken, The Regional Impacts of Climate Change. An Assessment of Vulnerability, Special Report of IPCC Working Group II, Cambridge University Press (1998). [35] M. Weber, Wirtschaft und Gesellschaft, Grundriß der Sozialökonomik, J.C.B. Mohr (Paul Siebeck), Tübingen (1922). Translation: Economy and Society, G. Roth, C. Wittich (Eds.), Bedminister Press, New York (1968). [36] World Bank, Entering the 21st century, World Development Report. World Bank Publication, Oxford University Press, Oxford (2000). [37] K.C. Zachariah, J. Conde, Migration in West Africa: Demographic Aspects. Oxford University Press, New York (1981).
23
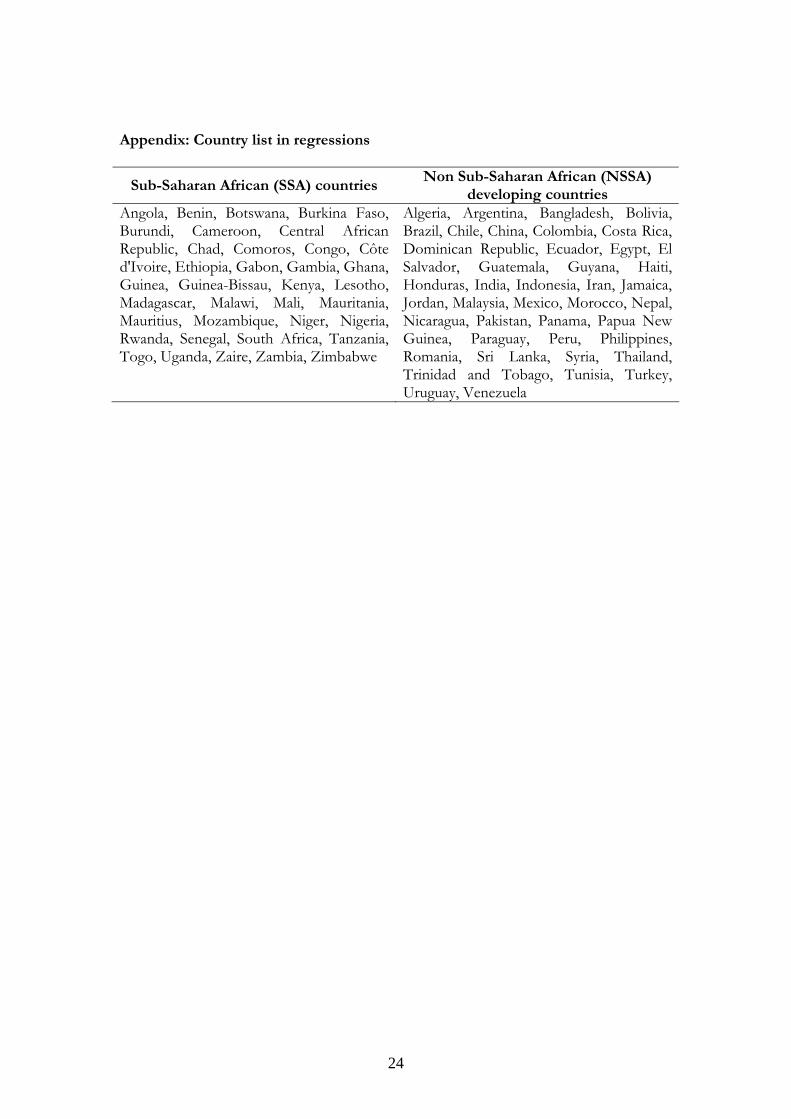
Appendix: Country list in regressions
Sub-Saharan African (SSA) countries Non Sub-Saharan African (NSSA)
developing countries Angola, Benin, Botswana, Burkina Faso, Burundi, Cameroon, Central African Republic, Chad, Comoros, Congo, Côte d'Ivoire, Ethiopia, Gabon, Gambia, Ghana, Guinea, Guinea-Bissau, Kenya, Lesotho, Madagascar, Malawi, Mali, Mauritania, Mauritius, Mozambique, Niger, Nigeria, Rwanda, Senegal, South Africa, Tanzania, Togo, Uganda, Zaire, Zambia, Zimbabwe
Algeria, Argentina, Bangladesh, Bolivia, Brazil, Chile, China, Colombia, Costa Rica, Dominican Republic, Ecuador, Egypt, El Salvador, Guatemala, Guyana, Haiti, Honduras, India, Indonesia, Iran, Jamaica, Jordan, Malaysia, Mexico, Morocco, Nepal, Nicaragua, Pakistan, Panama, Papua New Guinea, Paraguay, Peru, Philippines, Romania, Sri Lanka, Syria, Thailand, Trinidad and Tobago, Tunisia, Turkey, Uruguay, Venezuela
24
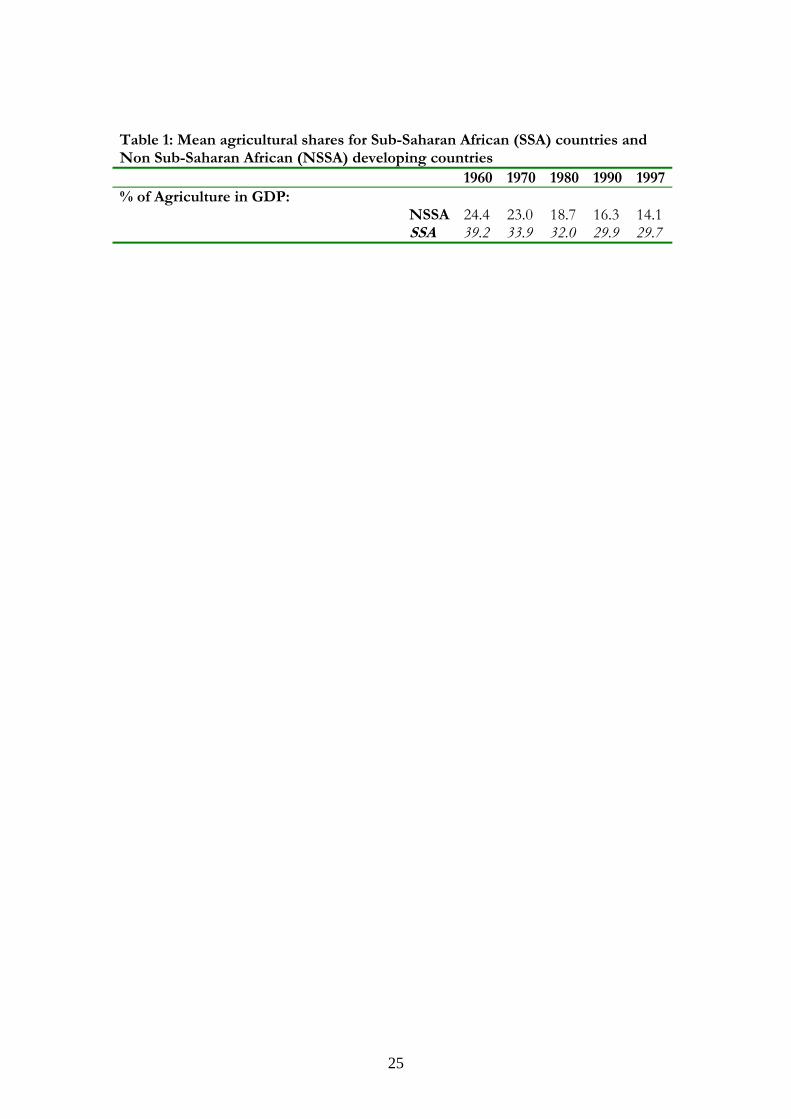
Table 1: Mean agricultural shares for Sub-Saharan African (SSA) countries and Non Sub-Saharan African (NSSA) developing countries 1960 1970 1980 1990 1997% of Agriculture in GDP: NSSA 24.4 23.0 18.7 16.3 14.1 SSA 39.2 33.9 32.0 29.9 29.7
25
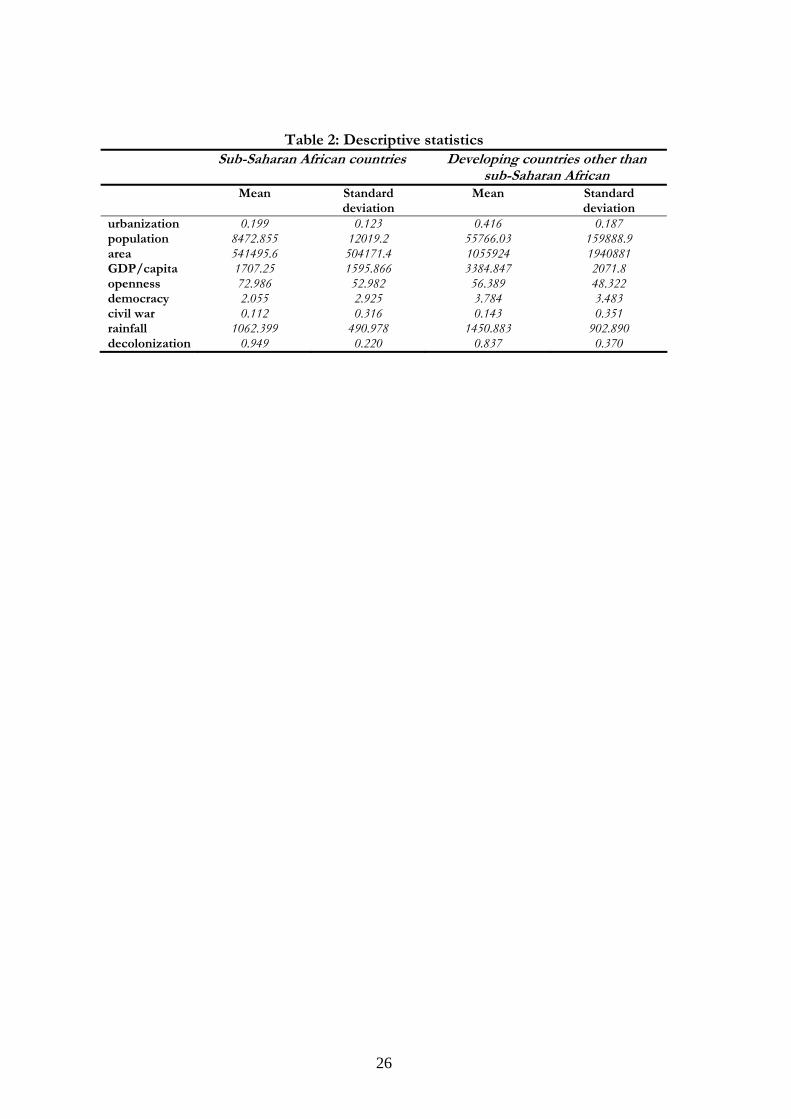
Table 2: Descriptive statistics Sub-Saharan African countries Developing countries other than
sub-Saharan African Mean Standard
deviation Mean Standard
deviation urbanization 0.199 0.123 0.416 0.187 population 8472.855 12019.2 55766.03 159888.9 area 541495.6 504171.4 1055924 1940881 GDP/capita 1707.25 1595.866 3384.847 2071.8 openness 72.986 52.982 56.389 48.322 democracy 2.055 2.925 3.784 3.483 civil war 0.112 0.316 0.143 0.351 rainfall 1062.399 490.978 1450.883 902.890 decolonization 0.949 0.220 0.837 0.370
26
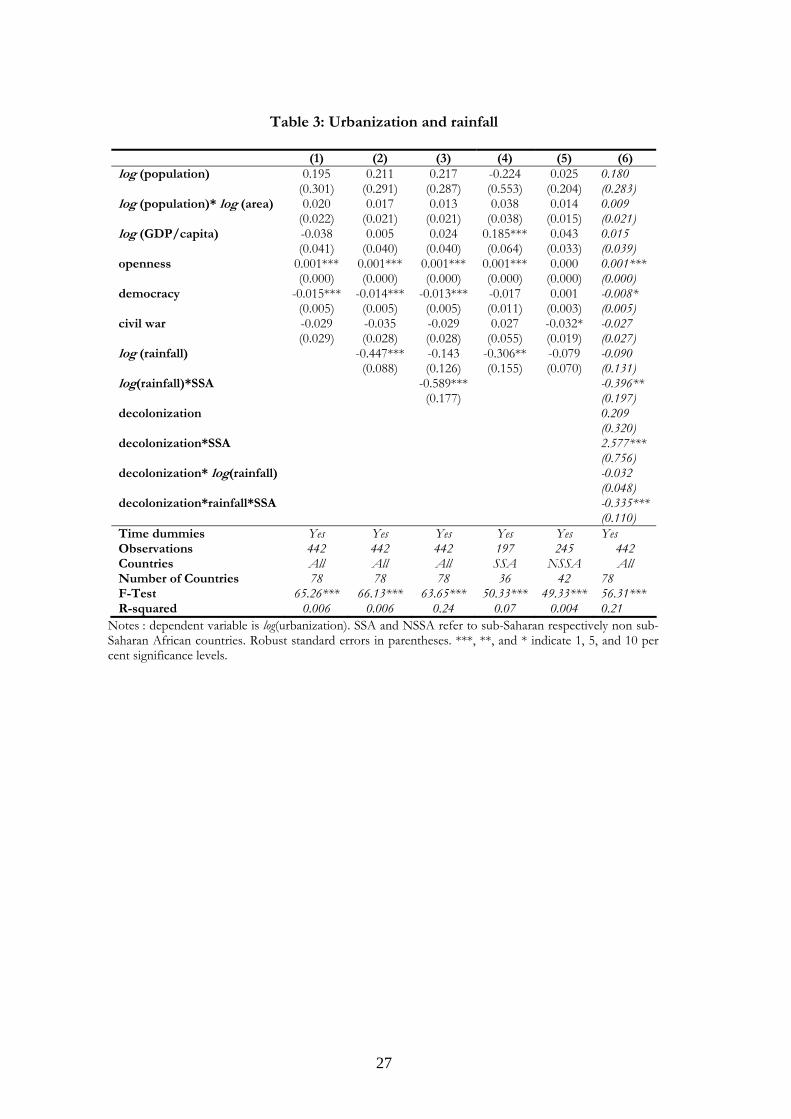
Table 3: Urbanization and rainfall
(1) (2) (3) (4) (5) (6) log (population) 0.195 0.211 0.217 -0.224 0.025 0.180 (0.301) (0.291) (0.287) (0.553) (0.204) (0.283) log (population)* log (area) 0.020 0.017 0.013 0.038 0.014 0.009 (0.022) (0.021) (0.021) (0.038) (0.015) (0.021) log (GDP/capita) -0.038 0.005 0.024 0.185*** 0.043 0.015 (0.041) (0.040) (0.040) (0.064) (0.033) (0.039) openness 0.001*** 0.001*** 0.001*** 0.001*** 0.000 0.001*** (0.000) (0.000) (0.000) (0.000) (0.000) (0.000) democracy -0.015*** -0.014*** -0.013*** -0.017 0.001 -0.008* (0.005) (0.005) (0.005) (0.011) (0.003) (0.005) civil war -0.029 -0.035 -0.029 0.027 -0.032* -0.027 (0.029) (0.028) (0.028) (0.055) (0.019) (0.027) log (rainfall) -0.447*** -0.143 -0.306** -0.079 -0.090 (0.088) (0.126) (0.155) (0.070) (0.131) log(rainfall)*SSA -0.589*** -0.396** (0.177) (0.197) decolonization 0.209 (0.320) decolonization*SSA 2.577*** (0.756) decolonization* log(rainfall) -0.032 (0.048) decolonization*rainfall*SSA -0.335*** (0.110) Time dummies Yes Yes Yes Yes Yes Yes Observations 442 442 442 197 245 442 Countries All All All SSA NSSA All Number of Countries 78 78 78 36 42 78 F-Test 65.26*** 66.13*** 63.65*** 50.33*** 49.33*** 56.31*** R-squared 0.006 0.006 0.24 0.07 0.004 0.21
Notes : dependent variable is log(urbanization). SSA and NSSA refer to sub-Saharan respectively non sub-Saharan African countries. Robust standard errors in parentheses. ***, **, and * indicate 1, 5, and 10 per cent significance levels.
27
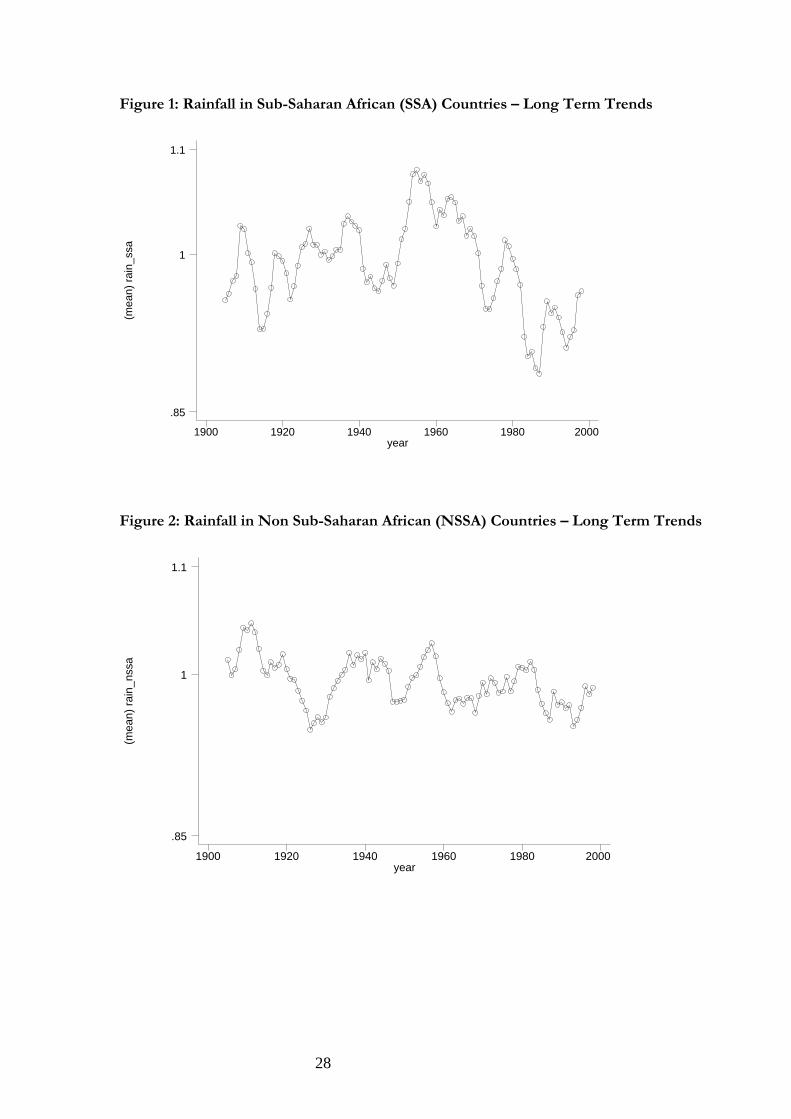
Figure 1: Rainfall in Sub-Saharan African (SSA) Countries – Long Term Trends
(mea
n) ra
in_s
sa
year1900 1920 1940 1960 1980 2000
.85
1
1.1
Figure 2: Rainfall in Non Sub-Saharan African (NSSA) Countries – Long Term Trends
(mea
n) ra
in_n
ssa
year1900 1920 1940 1960 1980 2000
.85
1
1.1
28