copyright by jose ernesto parra perez 2016
TRANSCRIPT

Copyright
by
Jose Ernesto Parra Perez
2016
The Thesis Committee for Jose Ernesto Parra Perez
Certifies that this is the approved version of the following thesis:
Experimental Investigation of Viscous Forces during
Surfactant Flooding of Fractured Carbonate Cores
APPROVED BY
SUPERVISING COMMITTEE:
Gary A. Pope
Matthew T. Balhoff
Supervisor:
Co-supervisor:
Experimental Investigation of Viscous Forces during
Surfactant Flooding of Fractured Carbonate Cores
by
Jose Ernesto Parra Perez, B.S. P.E.
Thesis
Presented to the Faculty of the Graduate School of
The University of Texas at Austin
in Partial Fulfillment
of the Requirements
for the Degree of
Master of Science in Engineering
The University of Texas at Austin
August 2016

Dedication
To my parents, my sister and Lore
v
Acknowledgements
First I want to express my most sincere gratitude to my supervisors Dr. Gary Pope
and Dr. Matthew Balhoff. Working and learning from and with you has been a pleasure
and a privilege. My deepest admiration goes to Dr. Pope who leads by example and who
has greatly inspired me to become better as a professional and as a person. My greatest
appreciation also goes to Dr. Balhoff for his tremendous commitment to challenging,
guiding and supporting me throughout my studies.
I would like to thank the people who contributed for performing this research,
Miguel Mejia, Sean Li, Mohsen Tagavifar and Nadeeka Upamali. I also want to thank
Chevron Energy Technology Co. for its support for this research and the sponsors of the
Chemical EOR industrial affiliates of The University of Texas at Austin.
I want to thank my friends Almas, Pável, Enrique, Héctor, José, Pengpeng,
Leonard, Beibit, Brian and Bruno, as well as my fellow students, the research staff and the
professors in the Department of Petroleum and Geosystems Engineering.
My deepest gratitude goes to my sponsor Instituto Mexicano del Petróleo (IMP) for
supporting and allowing me to pursue my graduate studies at UT. I look forward to going
back to México and contributing to make my country better.
I would like to thank Dr. Fernando Samaniego for all the support throughout the
years and for inspiring me to pursue the highest goals. I also want to thank the people who
have supported me through my petroleum engineering career, Dr. Rafael R. Nieto, M.S. E.
María Isabel Villegas, M.S. E. José Huezo, Dr. Édgar Rangel and Dr. Pedro Silva.
Finally I want to thank my parents, my sister and Lore. You are the people that I
want to make the most proud of me. Thanks for everything.
vi
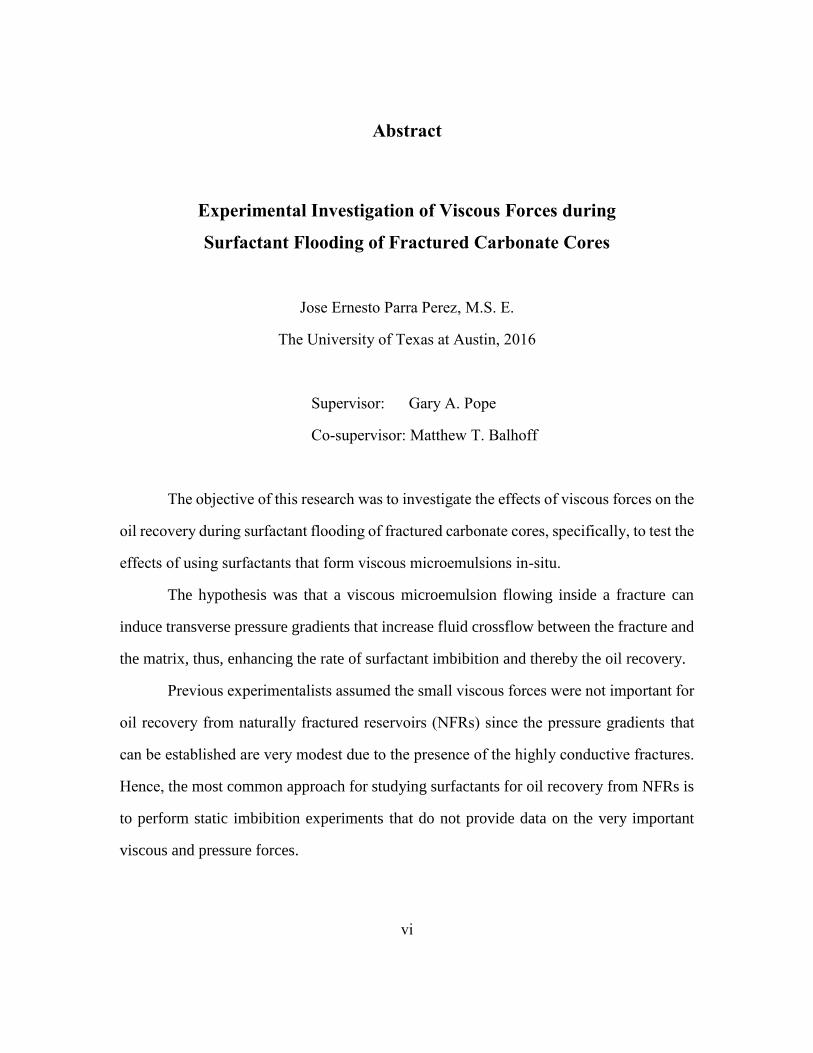
Abstract
Experimental Investigation of Viscous Forces during
Surfactant Flooding of Fractured Carbonate Cores
Jose Ernesto Parra Perez, M.S. E.
The University of Texas at Austin, 2016
Supervisor: Gary A. Pope
Co-supervisor: Matthew T. Balhoff
The objective of this research was to investigate the effects of viscous forces on the
oil recovery during surfactant flooding of fractured carbonate cores, specifically, to test the
effects of using surfactants that form viscous microemulsions in-situ.
The hypothesis was that a viscous microemulsion flowing inside a fracture can
induce transverse pressure gradients that increase fluid crossflow between the fracture and
the matrix, thus, enhancing the rate of surfactant imbibition and thereby the oil recovery.
Previous experimentalists assumed the small viscous forces were not important for
oil recovery from naturally fractured reservoirs (NFRs) since the pressure gradients that
can be established are very modest due to the presence of the highly conductive fractures.
Hence, the most common approach for studying surfactants for oil recovery from NFRs is
to perform static imbibition experiments that do not provide data on the very important
viscous and pressure forces.
vii
This is the first experimental study of the effect of viscous forces on the
performance of surfactant floods of fractured carbonate cores under dynamic conditions.
The effects of viscous forces on the oil recovery during surfactant flooding of
fractured carbonate cores were tested by conducting a series of ultralow interfacial tension
(IFT) surfactant floods using fractured Silurian Dolomite and Texas Cream Limestone
cores. The viscosity of the surfactant solution was increased by adding polymer to the
surfactant solution or by changing the salinity of the aqueous surfactant solution, which
affects the in-situ microemulsion viscosity. The fractured cores had an extreme
permeability contrast between the fracture and the matrix (ranging from 2500 to 90,000)
so as to represent typical conditions encountered in most naturally fractured reservoirs.
Also, non-fractured corefloods were performed in cores of each rock type for comparison
with the results from the fractured corefloods.
In all the experiments, the more viscous surfactants solutions achieved the greater
oil recovery from the fractured carbonate cores which contradicts conventional wisdom.
A new approach for surfactant flooding of naturally fractured reservoirs is
presented. The new approach consists of using a surfactant solution that achieves ultralow
IFT and that forms a viscous microemulsion. A viscous microemulsion can serve as a
mobility control agent analogous to mobility control with foams or polymer but with far
less complexity and cost.
The oil recovery from the fractured carbonate cores was greater for the surfactant
floods with the higher microemulsions, thus, it is expected that using viscous
microemulsion can enhance the oil recovery from naturally fractured reservoirs.
viii
Table of Contents
List of Tables ...........................................................................................................x
List of Figures ........................................................................................................ xi
Chapter 1 Introduction ...........................................................................................1
Chapter 2 Background ............................................................................................7
2.1 Naturally fractured reservoirs ...................................................................7
2.1.1 Definition and classification .........................................................7
2.1.2 Physical properties of naturally fractured carbonate reservoirs ..10
2.2 Surfactants and microemulsions .............................................................19
2.2.1 Surfactants...................................................................................20
2.2.2 Microemulsion phase behavior ...................................................21
2.2.3 Microemulsion viscosity .............................................................24
2.3 Surfactants recovery mechanisms in fractured media ............................27
2.3.1 Capillary driven imbibition .........................................................29
2.3.2 Gravity driven imbibition ...........................................................31
2.3.3 Scaling of imbibition...................................................................33
2.3.4 Viscous crossflow .......................................................................35
2.4 Surfactants floods in fractured carbonate media .....................................37
2.5 Summary .................................................................................................43
Chapter 3 Experimental Materials and Procedures ...............................................44
3.1 Fluids.......................................................................................................44
3.1.1 Microemulsion phase behavior ...................................................44
3.1.2 Microemulsion viscosity .............................................................47
3.2 Rocks.......................................................................................................49
3.3 Experimental apparatus ...........................................................................49
3.4 Fractured coreflood procedure ................................................................50
Chapter 4 Experimental Results and Analysis .......................................................53
4.1 Silurian Dolomite experiments ...............................................................56
ix
4.1.1 Fractured coreflood #1 ................................................................56
4.1.2 Fractured coreflood #2 ................................................................60
4.1.3 Non-fractured coreflood #1.........................................................63
4.1.4 Analysis of the Silurian Dolomite coreflood experiments ..........66
4.1.5 Static versus dynamic imbibition ................................................67
4.1.6 Limitations of using Silurian Dolomite cores .............................69
4.2 Texas Cream Limestone experiments .....................................................70
4.2.1 Fractured coreflood #3 ................................................................71
4.2.2 Fractured coreflood #4 ................................................................74
4.2.3 Fractured coreflood #5 ................................................................76
4.2.4 Fractured coreflood #6 ................................................................78
4.2.5 Non-fractured coreflood #2.........................................................80
4.2.6 Analysis of the results .................................................................82
Chapter 5 Conclusions and Future Work ...............................................................87
5.1 Conclusions .............................................................................................87
5.2 Future work .............................................................................................90
Bibliography ..........................................................................................................93
x
List of Tables
Table 2.1: Types of naturally fractured reservoirs (Cinco Ley 1996) ..................9
Table 2.2: Types of naturally fractured reservoirs (Nelson 2001) .....................10
Table 2.3: Scaling groups for gravity dominated imbibition .............................34
Table 3.1: Surfactant formulation at optimum conditions .................................46
Table 3.2: Mineralogy of Silurian Dolomite and Texas Cream Limestone .......49
Table 4.1: Fractured core properties ..................................................................54
Table 4.2: Non-fractured core properties ...........................................................54
Table 4.3: Performance data for the Silurian Dolomite coreflood
experiments .......................................................................................55
Table 4.4: Performance data for the Texas Cream Limestone coreflood
experiments .......................................................................................55
xi
List of Figures
Fig. 1.1: Matrix-fracture system of a mature naturally fractured reservoir .......1
Fig. 2.1: a) Actual fractured carbonate rock and b) Idealized reservoir for
modeling fluid flow (Warren and Root, 1963) ...................................8
Fig. 2.2: Elementary volume of a naturally fractured reservoir ......................10
Fig. 2.3: Slit representation of a fracture .........................................................13
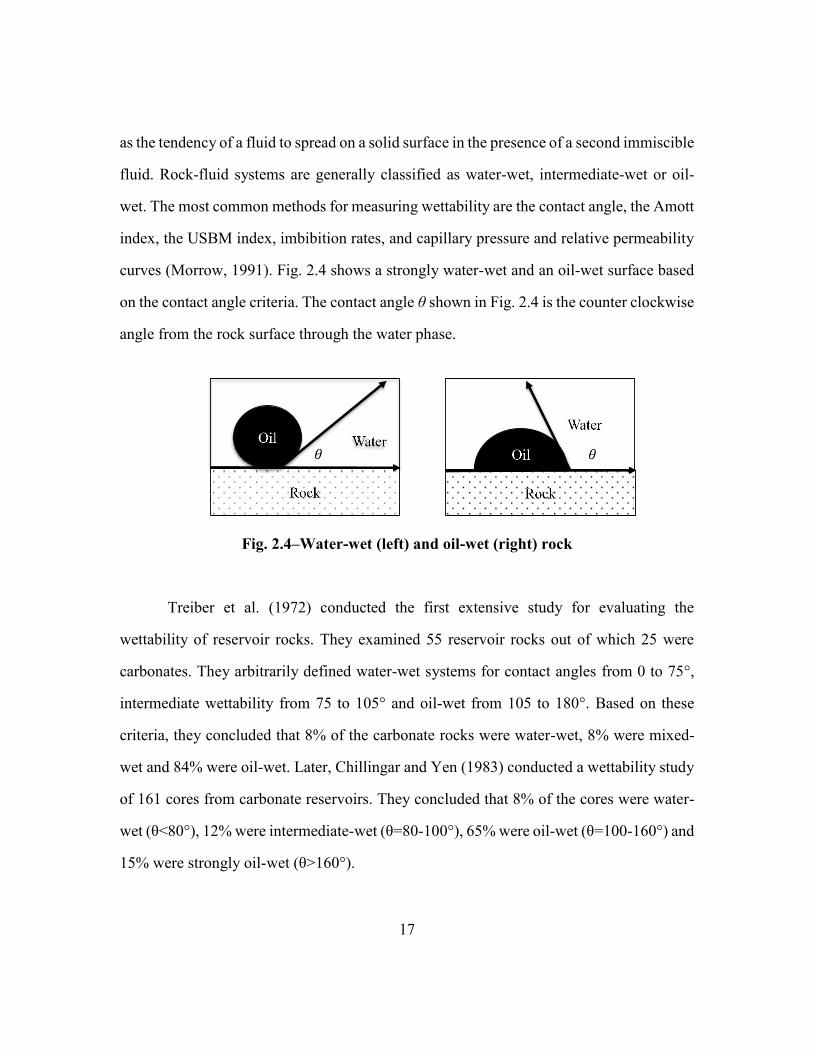
Fig. 2.4: Water-wet (left) and oil-wet (right) rock ..........................................17
Fig. 2.5: Phase behavior salinity scan showing Type I-III-II phase
environments .....................................................................................22
Fig. 2.6: Interfacial tensions and solubilization ratios versus salinity
(Healy et al., 1976)............................................................................23
Fig. 2.7: Microemulsion viscosity as a function of oil concentration
in the microemulsion (Tagavifar et al., 2016)...................................26
Fig. 2.8: Microemulsion viscosity as a function of shear rate
(Tagavifar et al., 2016)......................................................................27
Fig. 2.9: Static imbibition experiment .............................................................29
Fig. 2.10: a) Countercurrent and b) co-current imbibition profiles ...................31
Fig. 2.11: Flow in parallel layers with no hydraulic communication ................36
Fig. 2.12: Schematic representation of the physical fracture-matrix
system used for chemical floods (Najafabadi et al. 2008) ................38
Fig. 2.13: Transverse pressure gradients for a surfactant flood in a
fractured block (Abbasi et al., 2010) ................................................39
Fig. 2.14: Effect of microemulsion viscosity on oil recovery from
fractured media (Abbasi et al., 2010)................................................40
xii
Fig. 2.15: CT scan of a manually fractured carbonate reservoir core
(Lu et al., 2014) .................................................................................41
Fig. 2.16: Imbibition profile of ultralow IFT surfactants into an
oil-wet matrix (Mirzaei et al., 2016) .................................................42
Fig. 3.1: Oil and water solubilization ratios after a NaCl salinity scan at
78 °C and 90 days of equilibration. Oil volume fraction is 30% ......46
Fig. 3.2: Microemulsion viscosity as a function of salinity at 1 and 10 s-1
and 78°C. Oil volume fraction is 30% ..............................................47
Fig. 3.3: Microemulsion viscosity as a function of the oil volume fraction
in the microemulsion at 1 and 10 s-1 and 78 °C. Total oil volume
fraction is 30% ..................................................................................48
Fig. 3.4: Microemulsion viscosity as a function of shear rate for different
salinities at 78 °C. Oil volume fraction is 30% .................................48
Fig. 3.5: Coreflood experimental apparatus ....................................................50
Fig. 3.6: Artificially fractured Texas Cream Limestone core .........................52
Fig. 4.1: CT images at arbitrary cross sections of the fractured Silurian
Dolomite core used in the FRAC-1 experiment ...............................56
Fig. 4.2: Oil recovery from a fractured core for a surfactant flood followed
by a surfactant-polymer flood (fractured coreflood #1) ...................57
Fig. 4.3: Viscosity of the surfactant-polymer solution ....................................58
Fig. 4.4: Pressure drop for a surfactant flood followed by a surfactant-
polymer flood (fractured coreflood #1) ............................................59
Fig. 4.5: Photographs of Silurian Dolomite core a) before surfactant
imbibition (So= 1), b) after surfactant imbibition (So= 0.21). The
core was cut in half and at several cross sections after the
xiii
surfactant flood. The lighter shade at the bottom of the vertical
core indicates a lower oil saturation ..................................................60
Fig. 4.6: Oil recovery from a fractured core for a surfactant flood followed
by a surfactant-polymer flood (fractured coreflood #2) ..................62
Fig. 4.7: Pressure drop for a surfactant flood followed by a surfactant-
polymer flood (fractured coreflood #2) ............................................62
Fig. 4.8: Tracer test of the Silurian Dolomite core used in the
non-fractured experiment ..................................................................63
Fig. 4.9: Oil recovery from an ASP flood of a non-fractured Silurian
Dolomite core (non-fractured coreflood #1) .....................................65
Fig. 4.10: Pressure drop data for an ASP flood in a non-fractured Silurian
Dolomite core (non-fractured coreflood #1) .....................................66
Fig. 4.11: Oil recovery from the fractured and non-fractured corefloods
performed in Silurian Dolomite cores...............................................67
Fig. 4.12: Tertiary oil recovery from surfactant imbibition under static and
dynamic conditions (fractured coreflood experiments). The core
height is 10 cm for static imbibition and 30 cm for dynamic
imbibition ..........................................................................................69
Fig. 4.13: Oil recovery for the surfactant flood at optimum salinity.
Microemulsion viscosity is 17 cp (fractured coreflood #3) ..............72
Fig. 4.14: Pressure drop for the surfactant flood at optimum salinity.
Microemulsion viscosity is 17 cp (fractured coreflood #3) ..............73
Fig. 4.15: Oil recovery for the surfactant flood at optimum salinity.
Microemulsion viscosity is 17 cp (fractured coreflood #4) ..............75
xiv
Fig. 4.16: Pressure drop for the surfactant flood at optimum salinity.
Microemulsion viscosity is 17 cp (fractured coreflood #4) ..............75
Fig. 4.17: Oil recovery for the surfactant flood with a high microemulsion
viscosity of 75 cp (fractured coreflood #5). ......................................77
Fig. 4.18: Pressure drop for the surfactant flood with a high microemulsion
viscosity of 75 cp (fractured coreflood #5) .......................................78
Fig. 4.19: Oil recovery for a surfactant flood with low microemulsion
viscosity followed by a surfactant flood with high microemulsion
viscosity (fractured coreflood #6) .....................................................79
Fig. 4.20: Pressure drop for a surfactant flood with low microemulsion
viscosity followed by a surfactant flood with high microemulsion
viscosity (fractured coreflood #6) .....................................................80
Fig. 4.21: Surfactant flood oil recovery from a non-fractured Texas Cream
Limestone core (non-fractured coreflood #2) ...................................81
Fig. 4.22: Pressure data from a surfactant flood in a non-fractured Texas
Cream Limestone core (non-fractured coreflood #2) .......................82
Fig. 4.23: Effect of the microemulsion viscosity on the oil recovery from
fractured Texas Cream Limestone cores ..........................................83
Fig. 4.24: Surfactant imbibition profile into the matrix and oil expulsion
into the fracture .................................................................................84
Fig. 4.25: Viscous crossflow due to the formation and flow of a
microemulsion in the fracture ...........................................................85
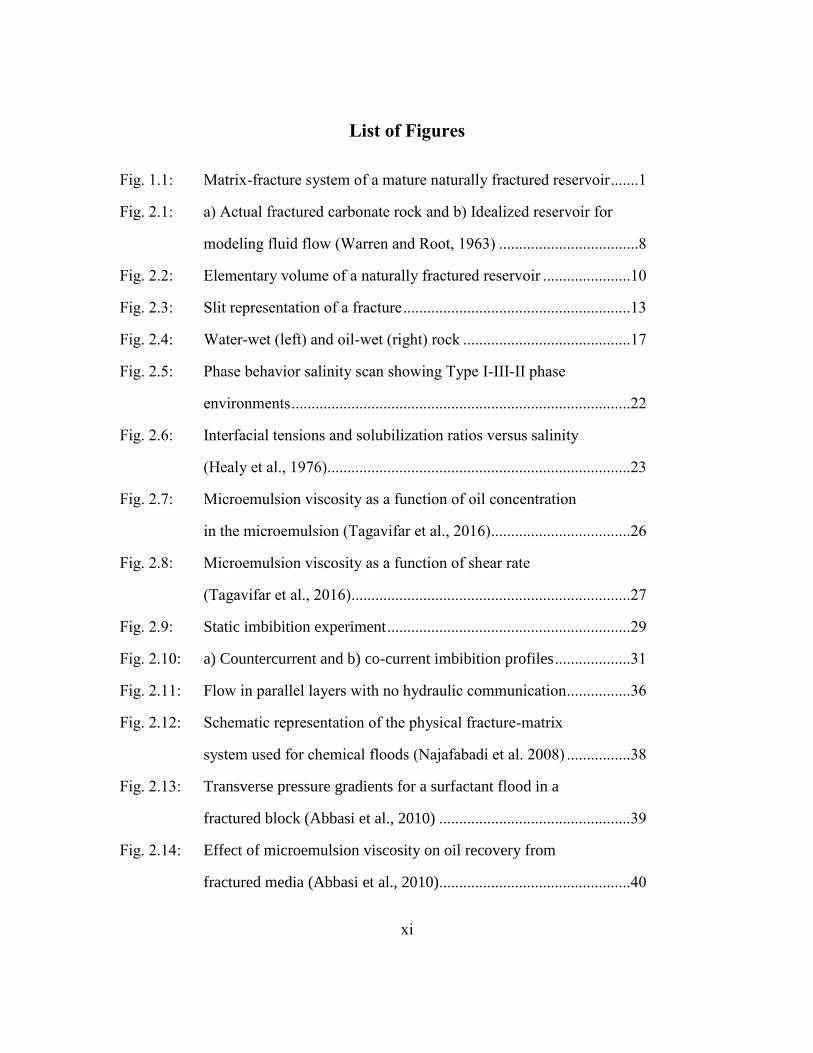
1
Chapter 1: Introduction
Naturally fractured carbonate reservoirs account for a considerable amount of the
world’s oil production and reserves. It is estimated that over 50% of the world’s oil reserves
are contained in carbonate reservoirs and that many of these reservoirs are naturally
fractured (Van Golf-Racht, 1982; Roehl and Choquette, 1985; Saidi, 1987; Chilingarian et
al., 1992; Aguilera, 1995; Nelson, 2001; Ahr 2008).
Naturally fractured reservoirs (NFRs) are composed of two distinct elements, a
fracture network that provides the essential permeability and a matrix that accounts for
most of the pore space. During primary production, the oil in the high permeability
fractures and neighboring matrix can easily flow towards the production wells leading to
very high flow rates. As the reservoir depletes, most of the oil in the fractures will be
recovered while most of the original oil in place (OOIP) will remain stored in the matrix
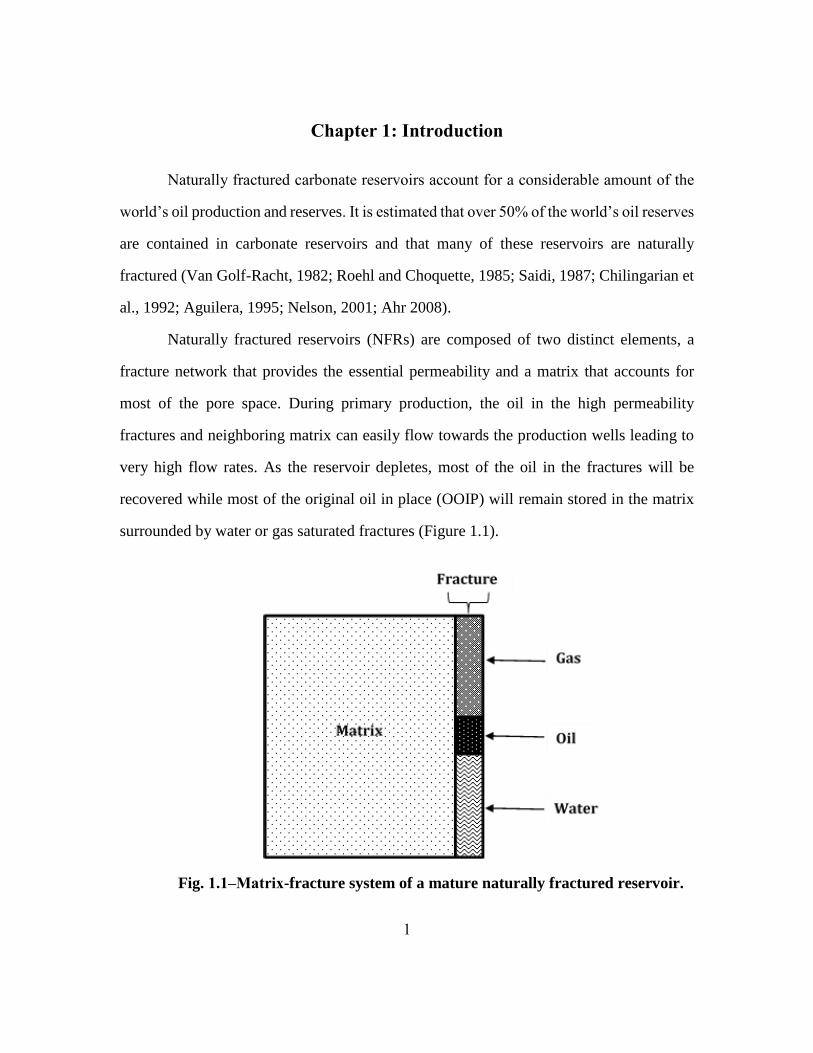
surrounded by water or gas saturated fractures (Figure 1.1).
Fig. 1.1‒Matrix-fracture system of a mature naturally fractured reservoir.
2
Oil recovery from the matrix of a mature naturally fractured carbonate reservoir is
challenging. Recovery can only be attained via a replacement process in which injection
fluids from secondary or enhanced oil recovery (EOR) techniques are transported into the
matrix (imbibition), while oil is expelled into the fractures where it can flow towards the
production wells.
The conventional recovery approach in NFRs has been to use pressure maintenance
techniques and/or secondary methods such as water or gas flooding that can successfully
imbibe into the matrix due to capillary or buoyancy forces (Saidi, 1987; Rodriguez et al.,
2004). However, secondary recovery processes are severely affected by two major aspects.
First, the once beneficial high permeability fractures now act as thief zones leading to
channeling and early breakthrough of injected fluids, resulting in poor reservoir
sweep/conformance. Second, capillary imbibition depends on the wettability of the
reservoir and carbonate reservoirs are often mixed wet or oil wet. When the reservoir is
water-wet, water can spontaneously imbibe into the matrix, thereby, displacing oil into the
fractures from where it is easily recovered. However, spontaneous imbibition of water into
the matrix is not significant when the matrix is oil wet. In some cases, gas is injected to
take advantage of gravity forces. Unfortunately, gas injection often results in severe
channeling and high separation costs.
Several techniques have been proposed to achieve imbibition and/or improve sweep
efficiency in NFRs, (Austad and Milter 1997, Seright 2000, Babadagli 2003; Hirasaki et
al., 2006; Boerrigter et al. 2007; Sydansk and Seright, 2007).
Surfactants have been considered for many years for enhanced oil recovery from
NFRs (Graham and Ortloff, 1970; Saidi and Hesselink, 1982). Surfactants have been used
for achieving imbibition into the oil-wet matrix of watered-out zones in NFRs and as
foaming agents during gas flooding operations to improve sweep efficiency by providing
3
mobility control or more commonly as permeability reducing agents during production
treatments in fractured wells with a high gas-oil ratio (GOR). Sweep improvement from
the watered-out zones in NFRs has been historically treated through the use of polymer
gels, which serve as blocking agents to divert the flow away from the high conductivity
fractures. However, the application of polymer gels is limited to near wellbore treatments
for production wells, since gels cannot be placed far into the reservoir and their application
only provides a short term solution for conformance control, since the injection fluids
(usually with a higher mobility when compared to oil) will eventually find the less
resistance paths in the reservoir (Sydansk and Seright 2007).
Imbibition of aqueous surfactant solutions into an oil-wet matrix can be achieved
by using surfactants that alter the wettability of the rock and/or lower the interfacial tension
(IFT) between the oil and brine. In the former case, the surfactants render the rock towards
a more water-wet state, thus achieving a positive capillary pressure that drives the
imbibition; in the latter, surfactants reduce the IFT to very low values so the capillary
pressure becomes negligible. At low IFT, surfactant imbibition is driven by buoyancy
forces.
The most common approach for studying surfactants for oil recovery from NFRs is
to perform static imbibition experiments. The core is placed inside a cell and then
surrounded by a brine solution. The oil recovery is measured as a function of time. Once
oil production ceases, the brine is replaced with a surfactant solution and the oil production
is measured. Static imbibition experiments have been used to test the effectiveness of a
wide range of surfactants (Austad and Milter 1997; Chen et al., 2001; Hirasaki and Zhang
2004; Xie et al., 2005; Adibhatla and Mohanty 2008; Zhang et al., 2009; Chen and Mohanty
2013; Li et al., 2016).
4
A lot of effort has also gone into developing scaling groups based on static
imbibition experiments (Mattax and Kyte, 1962; Iffly et al., 1972; Du Prey, 1978; Hagoort,
1980; Schechter et al., 1994, Zhang et al., 1996; Li and Horne, 2006; Li et al., 2016).
However, static imbibition experiments are not designed to provide data on the viscous and
pressure forces (dynamic effects) that are present during surfactant injection processes in
fractured media.
A few authors have investigated the dynamic effects of using aqueous surfactant
solutions for oil recovery from fractured media (Najafabadi et al., 2008; Abbasi et al., 2010;
Kiani et al., 2014; Lu et al., 2015; Mirzaei et al., 2015). These authors have shown that
viscous forces affect the imbibition process. Abbasi et al. (2010) used a simulation model
to predict that viscous pressure gradients transverse to the flow direction in the fractures
would increase the rate of surfactant imbibition into the matrix. Consequently, having a
more viscous surfactant solution flowing inside the fractures (due either to the addition of
polymer, foam or to the formation of a microemulsion) would enhance the oil recovery
from NFRs. An obvious way to increase the viscosity of an aqueous surfactant solution
would be to add polymer to the solution as is done for mobility control in surfactant floods
of non-fractured reservoirs. However, adding polymer is limited by both technical and
economic reasons. Polymer can decrease the rate of imbibition into the matrix by adsorbing
on the fracture face, plugging the pores of the matrix, and slowing diffusion of the
surfactant into the oil rich phase in the matrix. Most importantly, adding polymer increases
the cost when compared to that of solely using surfactants.
Surprisingly, there is not a single reference to experiments in the literature
regarding the use of surfactants in aqueous solutions with or without other chemicals for
simultaneously achieving imbibition and sweep improvement from the water-invaded
zones of naturally fractured reservoirs.
5
A new approach for surfactant enhanced oil recovery from NFRs was studied as
part of this research. In this new approach surfactants are designed to achieve both
imbibition and sweep improvement. The new approach consists of using a surfactant
solution that forms a viscous microemulsion when it mixes with the brine and oil.
A microemulsion has very different properties from those of the resident oil and
brine, and the injected surfactant solution. The mixture properties that most affect the oil
recovery are the interfacial tension between the microemulsion and oil, the interfacial
tension between microemulsion and water and the microemulsion viscosity. Studies in non-
fractured media have shown the great impact of the microemulsion properties on the oil
recovery (Healy et al., 1976; Pope and Nelson, 1978; Walker, 2010; Tagavifar et al., 2016).
For surfactant EOR in fractured media, low interfacial tension is required to drive the
imbibition process; then, as the surfactant imbibes into the matrix, oil is expelled into the
fractures where it mixes with the injected surfactant solution, thus, generating a
microemulsion. The newly formed microemulsion can have a viscosity several orders of
magnitude greater than that of the injected surfactant solution (very close to the viscosity
of water). A viscous microemulsion flowing inside the fractures will then serve as a
mobility control agent, inducing crossflow and increasing the rate of surfactant imbibition
into the matrix as it traverses through the reservoir from the injector to the producer.
The goal of this research was to test experimentally the hypothesis that a viscous
microemulsion flowing inside a fracture can increase the oil recovery from fractured media.
To test this hypothesis, tertiary surfactant floods were preformed following a waterflood
using mixed- to oil-wet fractured Texas Cream Limestone and Silurian Dolomite cores
with a permeability and porosity contrast characteristic of naturally fractured reservoirs (in
these experiments the fracture had a permeability on the order of hundreds of Darcy while
the matrix had an average permeability of 10 or 100 md for the two rock types
6
respectively). The experimental procedure consisted of developing a surfactant formulation
that achieved low IFT when mixed with an oil from a carbonate reservoir and synthetic
brine with high salinity and at a high temperature. The microemulsion viscosity was
changed by injecting the surfactant solution at different salinities. The experiments were
compared in terms of the rate and the ultimate oil recovery.
7
Chapter 2: Background
This chapter is divided into four sections; the first section provides an overview of
naturally fractured reservoirs and discusses the fundamental physical properties that govern
fluid flow in fractured media. The second section covers the basics of surfactants with
special emphasis on surfactants that reduce the interfacial tension to ultralow values and
on microemulsion rheology, which provides the theoretical basis for the experimental study
performed in this research. The third section discusses the mechanisms of oil recovery from
fractured carbonate rocks; special attention is given to gravity driven imbibition and
viscous crossflow effects; however, an overview of capillary driven imbibition is also
given. The fourth section summarizes the experimental and numerical studies of surfactant
floods in fractured carbonates and their implications for the present study.
2.1 NATURALLY FRACTURED RESERVOIRS
2.1.1 Definition and classification
Naturally fractured reservoirs (NFRs) are defined as those reservoirs that are
composed of two elements, a matrix and a fracture network. The matrix has the same
meaning as that pertaining to non-fractured reservoirs, but the fractures lead to distinct
physical properties and will be discussed throughout this section.
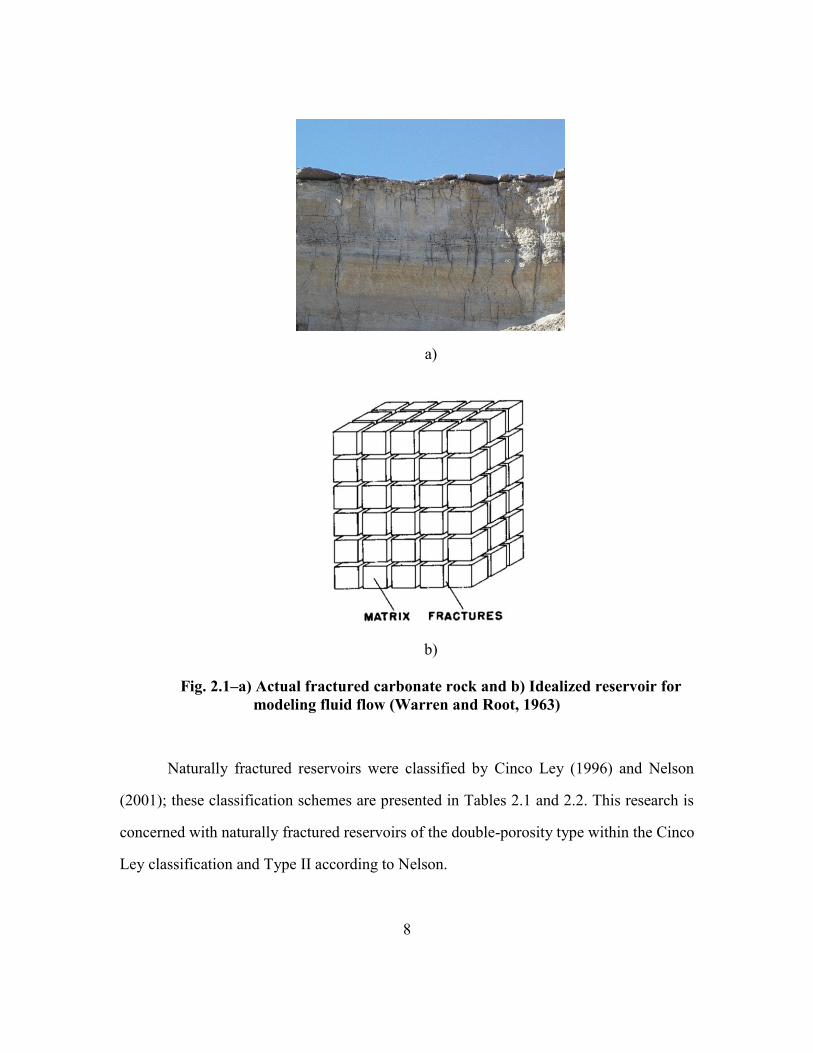
Fig. 2.1(a) is a photograph of a fractured carbonate outcrop rock (considered
analogous to NFRs). In the classical reservoir model used to represent naturally fractured
reservoirs (Barenblatt et al., 1960; Warren and Root 1963, Kazemi 1969; Kazemi and
Gilman; 1988), the matrix is represented as a series of identical rectangular blocks
separated by an orthogonal network of fractures as shown in Fig. 2.1(b).
8
a)
b)
Fig. 2.1‒a) Actual fractured carbonate rock and b) Idealized reservoir for
modeling fluid flow (Warren and Root, 1963)
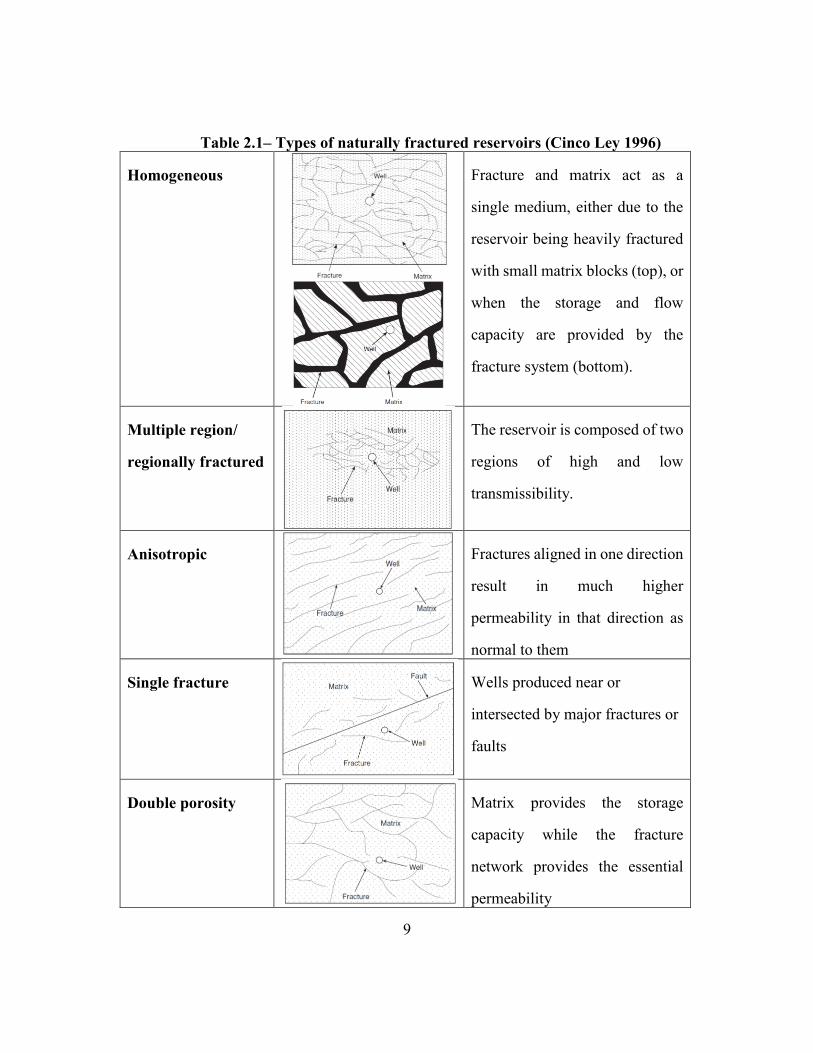
Naturally fractured reservoirs were classified by Cinco Ley (1996) and Nelson
(2001); these classification schemes are presented in Tables 2.1 and 2.2. This research is
concerned with naturally fractured reservoirs of the double-porosity type within the Cinco
Ley classification and Type II according to Nelson.
9
Table 2.1‒ Types of naturally fractured reservoirs (Cinco Ley 1996)
Homogeneous
Fracture and matrix act as a
single medium, either due to the
reservoir being heavily fractured
with small matrix blocks (top), or
when the storage and flow
capacity are provided by the
fracture system (bottom).
Multiple region/
regionally fractured
The reservoir is composed of two
regions of high and low
transmissibility.
Anisotropic
Fractures aligned in one direction
result in much higher
permeability in that direction as
normal to them
Single fracture
Wells produced near or
intersected by major fractures or
faults
Double porosity
Matrix provides the storage
capacity while the fracture
network provides the essential
permeability
10
Table 2.2‒Types of naturally fractured reservoirs (Nelson 2001)
Type 1 Fractures provide the essential porosity and permeability
Type 2 Fractures provide the essential reservoir permeability
Type 3 Fractures assist permeability in an already producible reservoir
Type 4 Fractures provide no additional porosity or permeability, but act as barriers
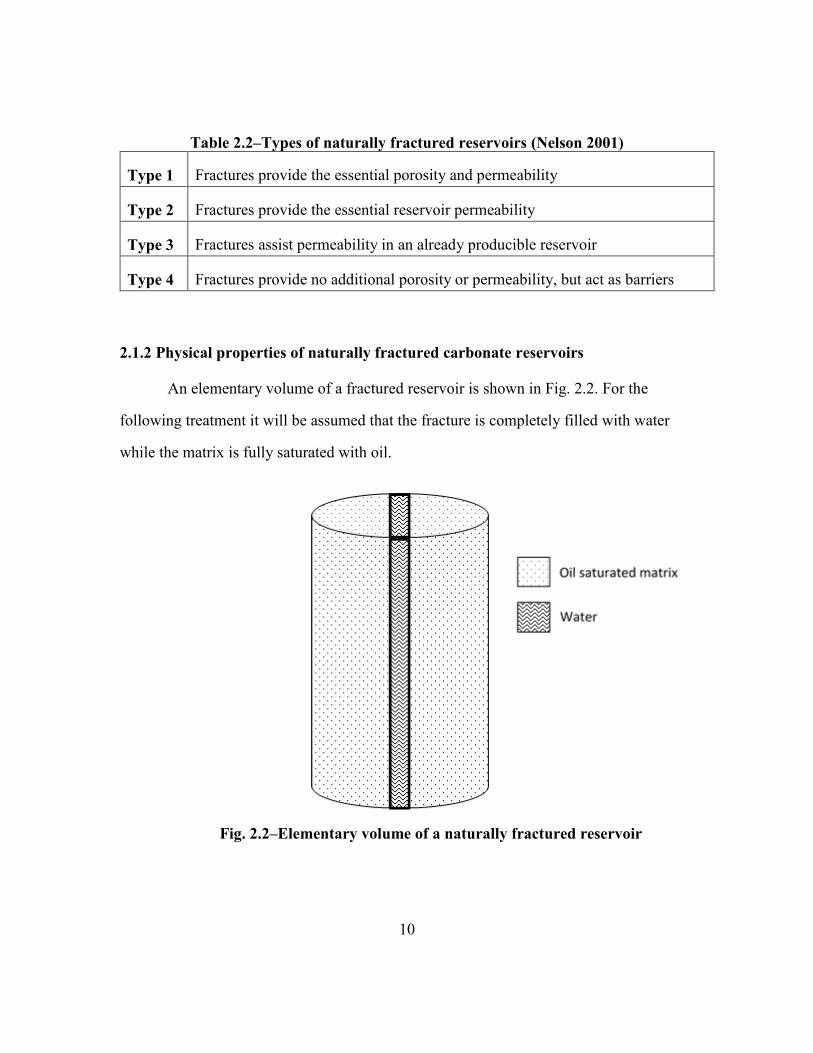
2.1.2 Physical properties of naturally fractured carbonate reservoirs
An elementary volume of a fractured reservoir is shown in Fig. 2.2. For the
following treatment it will be assumed that the fracture is completely filled with water
while the matrix is fully saturated with oil.
Fig. 2.2‒Elementary volume of a naturally fractured reservoir
11
2.1.2.1 Porosity
Matrix porosity is defined as the void volume in the matrix to the total bulk volume
of the reservoir. Analogously, fracture porosity is defined as the ratio of the void volume
in the fractures to the total bulk volume. Then, the total porosity in a NFR is the sum of the
matrix porosity and fracture porosity
∅𝑇 = ∅𝑚 + ∅𝑓 , (2.1)
where the subscripts m and f stand for the matrix and fracture respectively. The relative
contribution of the fracture porosity to the total porosity is typically small since most of
the fluids are stored in the matrix.
In the classical approach for modeling NFRs, fractures are represented as slits
between matrix blocks. However, fractures are not perfect slits since they usually have
some amount of contact and asperities. Parameters that account for this deviation have been
introduced under different forms, such as the intrinsic fracture porosity, ϕff, or the
roughness/friction factor, ε, (Witherspoon, 1980; Van Golf-Racht, 1982). The intrinsic
fracture porosity is defined as the effective void volume of a fracture to the volume of the
fracture when considered as a perfect slit, this parameter affects both the fracture storage
and flow capacity; the friction factor, on the other hand, only affects the fracture flow
capacity.
2.1.2.2 Fluid flow in fractured media
The general equation of fluid motion was given by Cauchy (1827) as follows:
𝜕
𝜕𝑡𝜌𝑣 = −[∇ ∙ 𝜌𝑣𝑣] − ∇𝑝 − [∇ ∙ 𝜏] + 𝜌𝑔. (2.2)
where ρ is the fluid density, v is the fluid velocity, τ is the shear stress, p is the fluid pressure,
and g is the gravitational acceleration. This equation states that fluid motion occurs due to
12
convection (first term on the right hand side), molecular transport (second and third terms
respectively) and by external forces, such as gravity (last term). If the fluids are assumed
to be incompressible and the acceleration terms are neglected (valid approximation in many
fluid flow through porous media applications where the Reynolds number is low, Re <<1),
the equation of motion reduces to:
∇𝑝 + [∇ ∙ 𝜏] − 𝜌𝑔 = 0, (2.3)
𝜏 = −𝜂𝛾,̇ (2.4)
where the shear stress 𝜏 is defined as the product of the shear rate �̇� and the viscosity η=η(�̇�)
or η=μ for Newtonian fluids, in which the viscosity is not a function of shear rate. The
pressure and gravity components are always present regardless of whether the fluid is under
static or dynamic conditions. However, viscous forces only come into play when there are
velocity gradients.
Fluid flow through fractures has been usually described with the slit analog of the
Hagen-Poiseuille equation for flow between parallel plates. Since this equation is important
for the design and analysis of this experimental study, it will be derived next.
Fig. 2.3 shows the schematic representation of a fracture and an arbitrary coordinate
system. For the following derivation, it is assumed that the fracture height, H, and length,
D, are large compared to the fracture aperture b so that end effects are negligible, that there
is only one fluid flowing and that flow occurs only in the vertical upward direction (later it
is shown that transverse flow is significant during surfactant flooding processes in fractured
media).
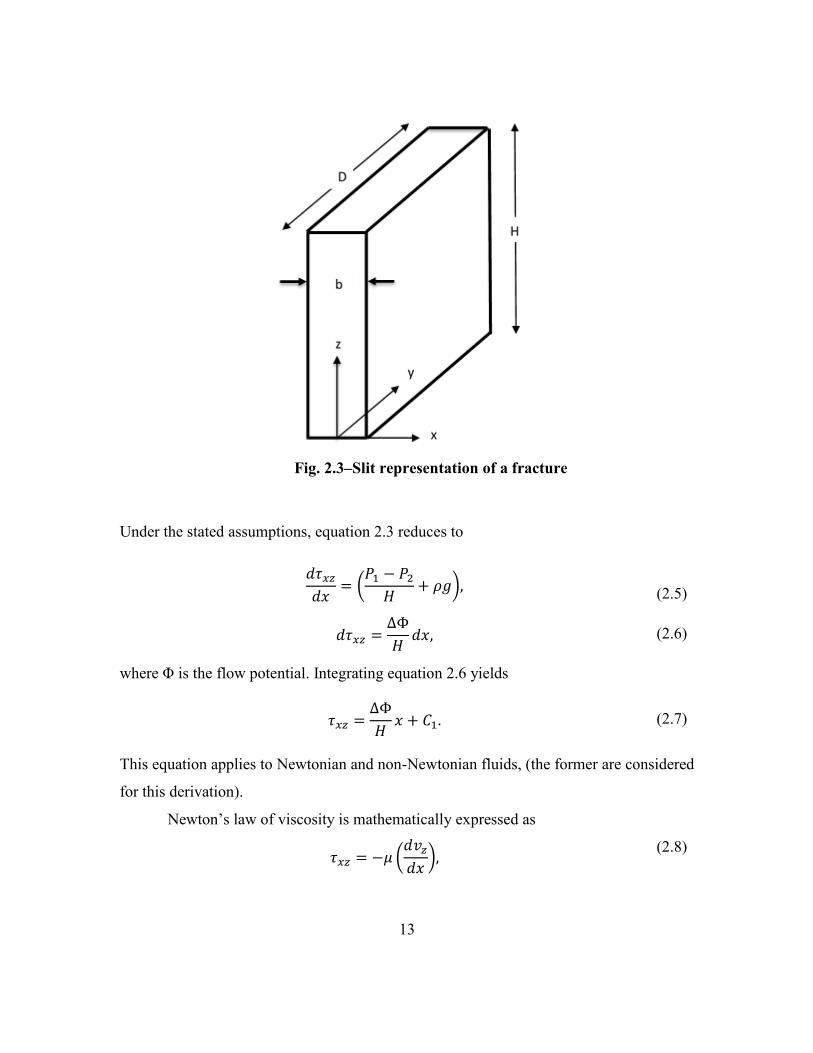
13
Fig. 2.3‒Slit representation of a fracture
Under the stated assumptions, equation 2.3 reduces to
𝑑𝜏𝑥𝑧
𝑑𝑥= (
𝑃1 − 𝑃2
𝐻+ 𝜌𝑔),
(2.5)
𝑑𝜏𝑥𝑧 =∆Φ
𝐻𝑑𝑥, (2.6)
where Φ is the flow potential. Integrating equation 2.6 yields
𝜏𝑥𝑧 =∆Φ
𝐻𝑥 + 𝐶1. (2.7)
This equation applies to Newtonian and non-Newtonian fluids, (the former are considered
for this derivation).
Newton’s law of viscosity is mathematically expressed as
𝜏𝑥𝑧 = −𝜇 (𝑑𝑣𝑧
𝑑𝑥),
(2.8)
14
where vz denotes the fluid velocity in the z direction. Inserting equation 2.8 into equation
2.7 leads to
𝑑𝑣𝑧 = (−∆Φ
𝜇𝐿𝑥 +
𝐶1
𝜇) 𝑑𝑥, (2.9)
integrating,
𝑣𝑧 = −∆𝛷
2𝜇𝐿𝑥2 +
𝐶1𝑥
𝜇+ 𝐶2.
(2.10)
The boundary conditions are evaluated at the walls where x=±b/2 at which the fluid
velocity is zero (no slip boundary condition). Then, the fluid velocity along any point in
the 𝑥 direction is given as
𝑣𝑧 =∆𝛷
2𝜇𝐿[(
𝑏
2)
2
− 𝑥2]. (2.11)
The average fluid velocity is obtained by dividing the volumetric flow rate over the cross
sectional area to flow Db as follows
< 𝑣𝑧 >=∫ ∫ 𝑣𝑧
𝑏/2
−𝑏/2𝑑𝑥 𝑑𝑦
𝐷
0
∫ ∫ 𝑑𝑥𝑏/2
−𝑏/2
𝐷
0𝑑𝑦
, (2.12)
< 𝑣𝑧 >=
∆Φ2𝜇𝐿 [(
𝑏2)
2
𝑥 −𝑥3
3 ]
𝑥, (2.13)
< 𝑣𝑧 >=𝑏2∆𝛷
12𝜇𝐿.
(2.14)
The volumetric flow rate is given by the product of the average velocity and the cross
section area to flow
𝑞 =𝑏3𝐷
12𝜇
∆Φ
𝐻, (2.15)
this is the well-known slit analog of the Hagen-Poiseuille equation.
15
Combining equations 2.7, 2.8 and 2.15 yields the expression for the shear rate at the
fracture wall
�̇�𝑤 =6𝑞
𝐷𝑏2 (2.16)
2.1.2.3 Permeability
There are three major and distinct permeabilities in fractured media; these are the
matrix permeability, km, the fracture permeability, kf, and the effective permeability, ke,
which accounts for the fracture and matrix permeabilities and the bulk dimensions.
The permeability of the fracture shown in Fig. 2.2 is calculated using Darcy’s law
for 1D flow in the vertical direction,
𝑞 =𝐴𝑘
𝜇
∆Φ
𝐻, (2.17)
and equation 2.15, which leads to
𝑘 =𝑏3𝐷
12𝐴, (2.18)
where A can be the cross sectional area of the slit Db, which gives the permeability of the
fracture
𝑘𝑓 =𝑏2
12, (2.19)
and including the intrinsic fracture porosity (if any)
𝑘𝑓 =∅𝑓𝑓𝑏2
12, (2.20)
Or the total cross sectional area of the medium AT, which then gives the effective
permeability accounting for the fracture and matrix permeability’s and the bulk dimensions
(this would be equivalent to the permeability calculated by pressure transient tests)
16
𝑘𝑒 =𝑏3
3𝜋𝐷. (2.21)
The fracture permeability can also be calculated from the expression for single-phase flow
through parallel layers, which states that the total flow rate in a porous medium composed
of uniform layers with different permeabilities, is equal to the sum of the individual flow
rates in each layer, e.g., the fracture and the matrix. For the elementary volume shown in
Figure 2.2 this is denoted as
𝑞𝑇 = 𝑞𝑓 + 𝑞𝑚1 + 𝑞𝑚2, (2.22)
where the second subscript denotes the number of matrix elements. Inserting Darcy’s Law
in equation 2.22 yields
𝐴𝑇𝑘
𝜇
∆Φ
𝐻=
𝐴𝑓𝑘𝑓
𝜇(
∆Φ
𝐻) +
𝐴𝑚1𝑘𝑚1
𝜇(
∆Φ
𝐻) +
𝐴𝑚2𝑘𝑚2
𝜇(
∆Φ
𝐻). (2.23)
Assuming homogeneous matrix blocks with the same dimensions and that the same
pressure drawdown is applied to each layer, leads to
𝑘𝑒 =𝐴𝑓𝑘𝑓 + 2𝐴𝑚𝑘𝑚
𝐴𝑇, (2.24)
and the fracture permeability can be calculated as
𝑘𝑓 =𝐴𝑇𝑘𝑒 − 2𝐴𝑚𝑘𝑚
𝐴𝑓. (2.25)
2.1.2.4 Wettability
Sections 2.1.2.1 to 2.1.2.3 dealt exclusively with rock properties and considered
that only one fluid phase was present; however, at least two fluid phases are generally
present in petroleum reservoirs. The first phenomenon that arises from a porous medium
containing two or more immiscible phases is known as wettability. Wettability is defined
17
as the tendency of a fluid to spread on a solid surface in the presence of a second immiscible
fluid. Rock-fluid systems are generally classified as water-wet, intermediate-wet or oil-
wet. The most common methods for measuring wettability are the contact angle, the Amott
index, the USBM index, imbibition rates, and capillary pressure and relative permeability
curves (Morrow, 1991). Fig. 2.4 shows a strongly water-wet and an oil-wet surface based
on the contact angle criteria. The contact angle θ shown in Fig. 2.4 is the counter clockwise
angle from the rock surface through the water phase.
Fig. 2.4‒Water-wet (left) and oil-wet (right) rock
Treiber et al. (1972) conducted the first extensive study for evaluating the
wettability of reservoir rocks. They examined 55 reservoir rocks out of which 25 were
carbonates. They arbitrarily defined water-wet systems for contact angles from 0 to 75°,
intermediate wettability from 75 to 105° and oil-wet from 105 to 180°. Based on these
criteria, they concluded that 8% of the carbonate rocks were water-wet, 8% were mixed-
wet and 84% were oil-wet. Later, Chillingar and Yen (1983) conducted a wettability study
of 161 cores from carbonate reservoirs. They concluded that 8% of the cores were water-
wet (θ<80°), 12% were intermediate-wet (θ=80-100°), 65% were oil-wet (θ=100-160°) and
15% were strongly oil-wet (θ>160°).
18
The effects of wettability on oil recovery have been investigated by several authors
(Amott, 1959; Donaldson et al., 1969; Anderson, 1987; Morrow, 1990). When water is
injected into a water-wet fractured reservoir, spontaneous imbibition occurs due the
capillary pressure between the water and oil. The capillary pressure is a function of
wettability.
2.1.2.5 Capillary pressure
For oil and water, capillary pressure is defined as the oil pressure minus the water
pressure:
𝑃𝑐 = 𝑃𝑜 − 𝑃𝑤 . (2.26)
For flow in a capillary tube, e.g., matrix pores; capillary pressure is defined as
𝑃𝑐 =2𝜎𝑐𝑜𝑠𝜃
𝑟, (2.27)
where σ is the interfacial tension between the fluid phases and r is the pore radius. Equation
2.26 implies that capillary pressure can be positive, negative or zero. The terms in equation
2.27 indicate that capillary pressure is positive for θ<90° (water-wet), negative for θ>90°
(oil-wet) and 0 for θ=90° (mixed-wet). Also, capillary pressure decreases when the
interfacial tension is reduced and increases as the pore radius becomes smaller.
The order of magnitude of capillary pressure can be estimated as shown in the
following example. The absolute permeability is 10 md, porosity is 0.20, the interfacial
tension between oil and water is 20 mN/m and the contact angle is 135°.
Use of equation 2.27 requires an estimation of the pore radius. This can be obtained
with the Hagen-Poiseuille equation for flow through a capillary tube, which leads to
𝑘 =𝑟2∅
8. (2.28)
19
The pore radius is estimated to be:
𝑟 = √8𝑘
∅= √
8(10 md)
0.20[0.001 D
1 md
9.87x10⁻¹³m
1 D],
𝑟 = 6.28x10⁻⁷ m = 0.628 μm.
The capillary pressure is
𝑃𝑐 =2 (0.020
Nm
) cos135°
6.28x10⁻⁷m= −45038 Pa = −6.53 psi.
The negative sign indicates that imbibition will not occur unless this capillary
pressure can be overcome. Equation 2.27 indicates that this can be achieved by either
changing IFT or the contact angle. It is the purpose of the following sections to describe
the various mechanisms by which surfactants can promote imbibition.
2.2 SURFACTANTS AND MICROEMULSIONS
Most of the research concerning the use of surfactants for application into naturally
fractured reservoirs has focused on surfactants that alter the rock wettability by changing
the contact angle, while a considerably fewer number of authors have used surfactants that
reduce the interfacial tension to ultralow values at which the capillary pressure becomes
negligible. The present study focused on surfactants that reduce the interfacial tension to
ultralow values. The surfactant selection criteria are similar to the well-known criteria used
for designing surfactant flooding in non-fractured reservoirs and is described next.
20
2.2.1 Surfactants
Surface active agents commonly known as surfactants, are amphiphilic molecules
consisting of segregated hydrophilic and lipophilic portions. Surfactants are able to change
the surface and interfacial forces when in contact with other phases, i.e. oil and water.
Depending on the electric charge of their hydrophilic group when dissolved in an aqueous
solution, surfactants are classified into four categories.
1. Cationics. Positively charged. These were the first surfactants considered for
EOR applications in fractured carbonate rocks (Austad and Milter, 1997). These
surfactants were used for wettability alteration purposes and also to minimize
surfactant adsorption in the calcite (CaCO3) or dolomite (CaMg(CO3)2) mineral
surfaces which are also positively charged. Cationic surfactants have been
successful in recovering oil from oil-wet carbonates (Standness and Austad,
2000), however, they are more expensive when compared to other surfactants,
i.e. anionics, which in some cases have performed as good as or better than
cationics.
2. Anionics. Negatively charged. These have been the most common type of
surfactants used in CEOR applications for matrix reservoirs (almost all of them
in sandstones), mainly because of their resistance to adsorption, high
availability and low costs. Anionic surfactants, have also been tested in
carbonate rocks and have been able to recover significant amounts of oil (Chen
et al., 2001; Seethepalli et al., 2004, Adibhatla and Mohanty 2008; Lu et al.,
2014; Mirzaei et al., 2015; Li et al., 2016).
3. Nonionics. These molecules are not ionized. There are some references of using
nonionic surfactants resulting in high oil recovery from spontaneous imbibition
21
experiments using carbonate cores (Chen, 2001; Xie et al., 2005; Sharma 2013),
however, nonionics are much less popular than cationics or anionics.
4. Amphoterics/Zwitterionics. These surfactants possess cationic and anionic
groups but have not been used in CEOR because of their high costs.
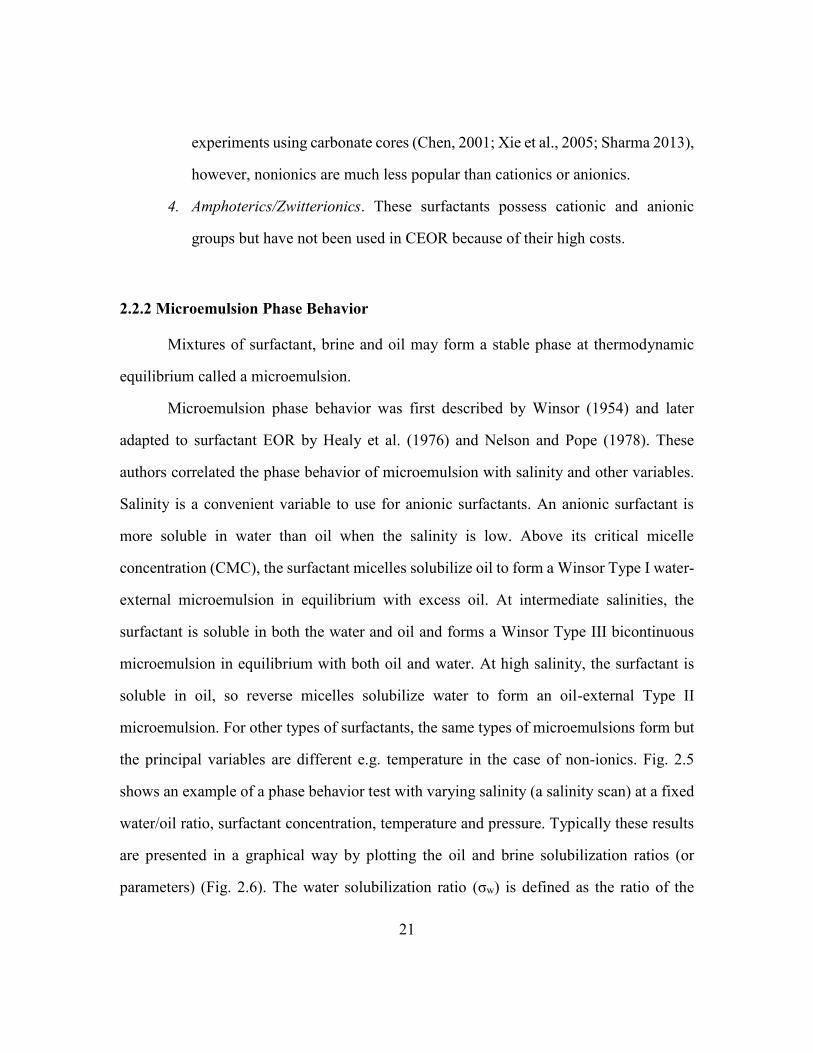
2.2.2 Microemulsion Phase Behavior
Mixtures of surfactant, brine and oil may form a stable phase at thermodynamic
equilibrium called a microemulsion.
Microemulsion phase behavior was first described by Winsor (1954) and later
adapted to surfactant EOR by Healy et al. (1976) and Nelson and Pope (1978). These
authors correlated the phase behavior of microemulsion with salinity and other variables.
Salinity is a convenient variable to use for anionic surfactants. An anionic surfactant is
more soluble in water than oil when the salinity is low. Above its critical micelle
concentration (CMC), the surfactant micelles solubilize oil to form a Winsor Type I water-
external microemulsion in equilibrium with excess oil. At intermediate salinities, the
surfactant is soluble in both the water and oil and forms a Winsor Type III bicontinuous
microemulsion in equilibrium with both oil and water. At high salinity, the surfactant is
soluble in oil, so reverse micelles solubilize water to form an oil-external Type II
microemulsion. For other types of surfactants, the same types of microemulsions form but
the principal variables are different e.g. temperature in the case of non-ionics. Fig. 2.5
shows an example of a phase behavior test with varying salinity (a salinity scan) at a fixed
water/oil ratio, surfactant concentration, temperature and pressure. Typically these results
are presented in a graphical way by plotting the oil and brine solubilization ratios (or
parameters) (Fig. 2.6). The water solubilization ratio (σw) is defined as the ratio of the
22
volume of water to the volume of surfactant in the microemulsion. Similarly the oil
solubilization ratio (σo) is defined as the ratio of the oil volume to the volume of surfactant
in the microemulsion.
𝜎𝑜 =𝑉𝑜
𝑉𝑠, (2.29a)
𝜎𝑤 =𝑉𝑤
𝑉𝑠. (2.29b)
Fig. 2.5‒Phase behavior salinity scan showing Type I-III-II phase environments
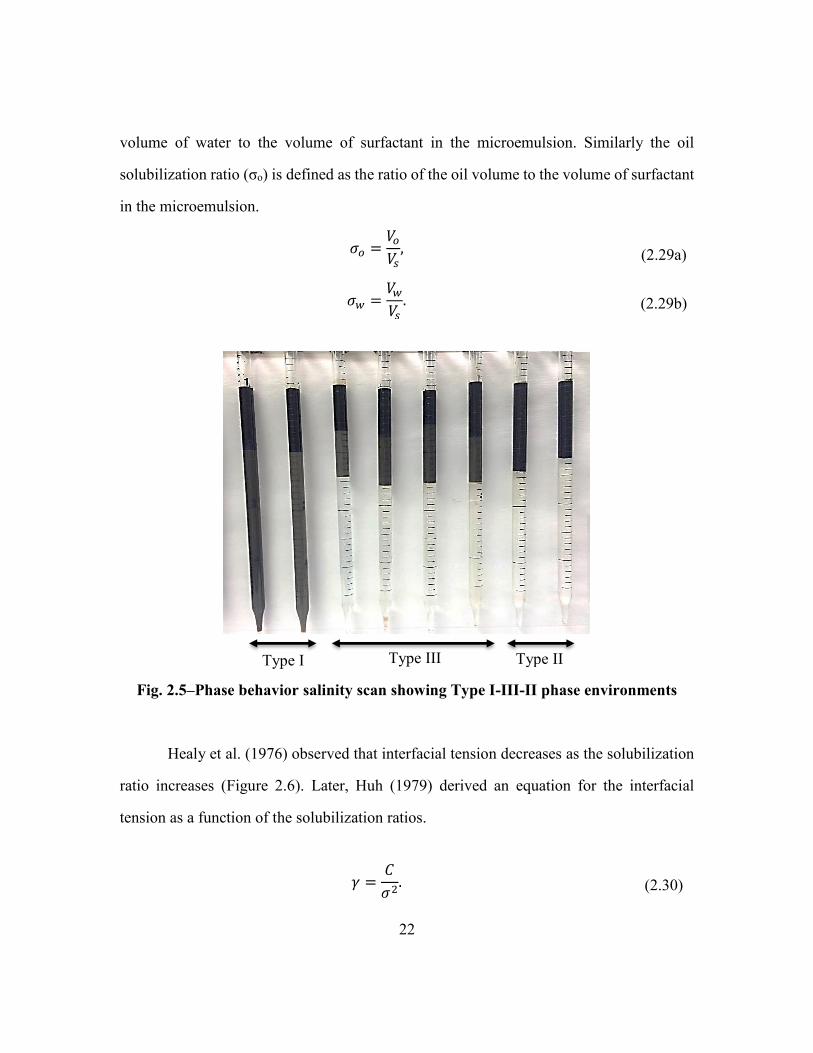
Healy et al. (1976) observed that interfacial tension decreases as the solubilization
ratio increases (Figure 2.6). Later, Huh (1979) derived an equation for the interfacial
tension as a function of the solubilization ratios.
𝛾 =𝐶
𝜎2. (2.30)
Type I Type III Type II
23
where C is a constant, usually taken as 0.3, γ is the IFT and σ any solubilization ratio. This
equation has been validated with extensive experimental data and is very useful since IFTs
can be calculated from phase behavior measurements.
Fig. 2.6‒Interfacial tensions and solubilization ratios versus salinity (Healy et
al., 1976)
Healy et al., (1976) introduced the concept of optimal salinity to refer to the
intersection point of either the oil/water solubilization ratio curves or to the microemulsion-
oil/microemulsion-water IFT curves, which were found to be very close (Fig. 2.6). Winsor
defined the cohesive energy ratio, R, as the ratio of the interaction energy between
surfactant and oil to the interaction energy between surfactant and water. When R = 1, the
surfactant equally interacts with both oil and water and forms an optimal microemulsion
with equally low IFT between the microemulsion and excess water and the microemulsion
and excess oil.
Vo/Vs Vw/Vs
24
Subsequent research demonstrated that Type III microemulsions are the most
favorable for oil displacement and, further, that use of a salinity gradient during surfactant
flooding provides the greatest window of opportunity to pass through the optimal salinity
(Nelson and Pope, 1978), while at the same time, taking advantage of the high solubility
of the surfactant in oil at higher than optimal salinities and of the surfactant in water
solubility at lower salinities. The salinity gradient also provides a robust design to account
for reservoir variations, reduces surfactant retention and is widely used during surfactant
flooding of non-fractured reservoirs.
2.2.3 Microemulsion viscosity
Section 2.2.2 stated the importance of microemulsion phase behavior, its
relationship with interfacial tensions and its effects on oil recovery. Recently, Walker et al.
(2012) showed that the microemulsion viscosity has a significant effect on tertiary oil
recovery. The authors used multiple surfactant formulations and conducted non-fractured
core floods using microemulsion with both low and high viscosity. Microemulsion
viscosity was changed by increasing temperature, adding co-solvent and through soap
generation by using alkali with active oils. They found the best results using Newtonian
microemulsions with low viscosity. When the viscosity continues to increase at low shear
rate (shear thinning), the microemulsion retention increases due to phase trapping.
Walker et al. pointed out the need for an improved microemulsion viscosity model.
Then, in what was surely one of the most significant advances for surfactant EOR,
Tagavifar et al. (2014) developed a new microemulsion viscosity model based on
fundamental principles. The viscosity is calculated as a function of the oil volume fraction
in the microemulsion using the following equation:
25
𝜂0 =𝜇𝑜exp (𝑣′𝜙)exp(𝑣𝜙′)
𝜙 exp(𝑣′𝜙) + 𝜆𝑟𝜙′exp(𝑣𝜙′), (2.31)
𝜙 =𝛾𝑜
𝛾𝑜 + 𝛾𝑤 (2.32)
where η0 is the microemulsion zero shear rate viscosity, 𝜆r is the viscosity ratio between
oil and water μo/μw, ϕ is the oil volume fraction in the microemulsion, defined as C23 in
Lake et al. (2014) and most other sources, γ is the oil/brine solubilization ratio defined
previously, ϕ’= ϕ -1 and v is a matching parameter ranging from 0.25 to 2.5. This equation
collapses to the correct limits, η0=μw as ϕ → 0 and η0 = μo as ϕ → 1.
Tagavifar adapted the Cross model (Cross, 1965) for estimating microemulsion
viscosity as a function of shear rate.
𝜂(ϕ, �̇�) − 𝜂∞(ϕ)
𝜂0 − 𝜂∞(ϕ)=
1
1 + (𝛼�̇��̇�ℎ
)𝑃𝛼−1 ,
(2.33)
𝜂∞ = (ϕ𝜇𝑜 + ϕ′𝜇𝑤)(𝑓0 + 𝑓1) (2.34)
𝑓0 = (1 − ϕϕ′)𝑣 (2.35)
𝑓1 = 𝑐0(ϕϕ′[0.1 + (ϕ − ϕ𝑚)(ϕ′ − ϕ𝑚)])2, (2.36)
where η∞ is the infinite shear viscosity to be used, except for dilute oil in water
microemulsions where η∞ = μw and for dilute water in oil microemulsions where η∞ = μo. The
terms fo and f1 represent thermodynamic interactions in the fluid and c0 is used for scaling
these interactions; �̇�ℎ and 𝑃𝛼 are the Cross model parameters for characterizing shear
thinning effects and α = 1 unless rheology alteration methods are employed (Tagavifar
2014).
26
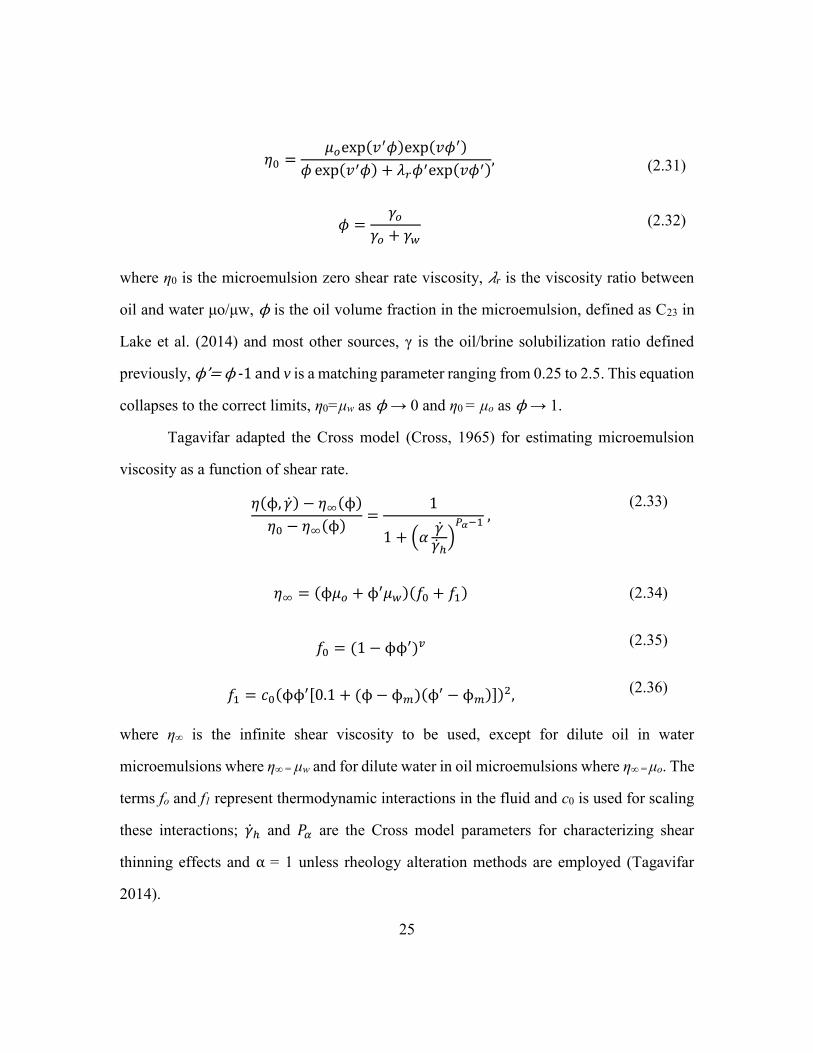
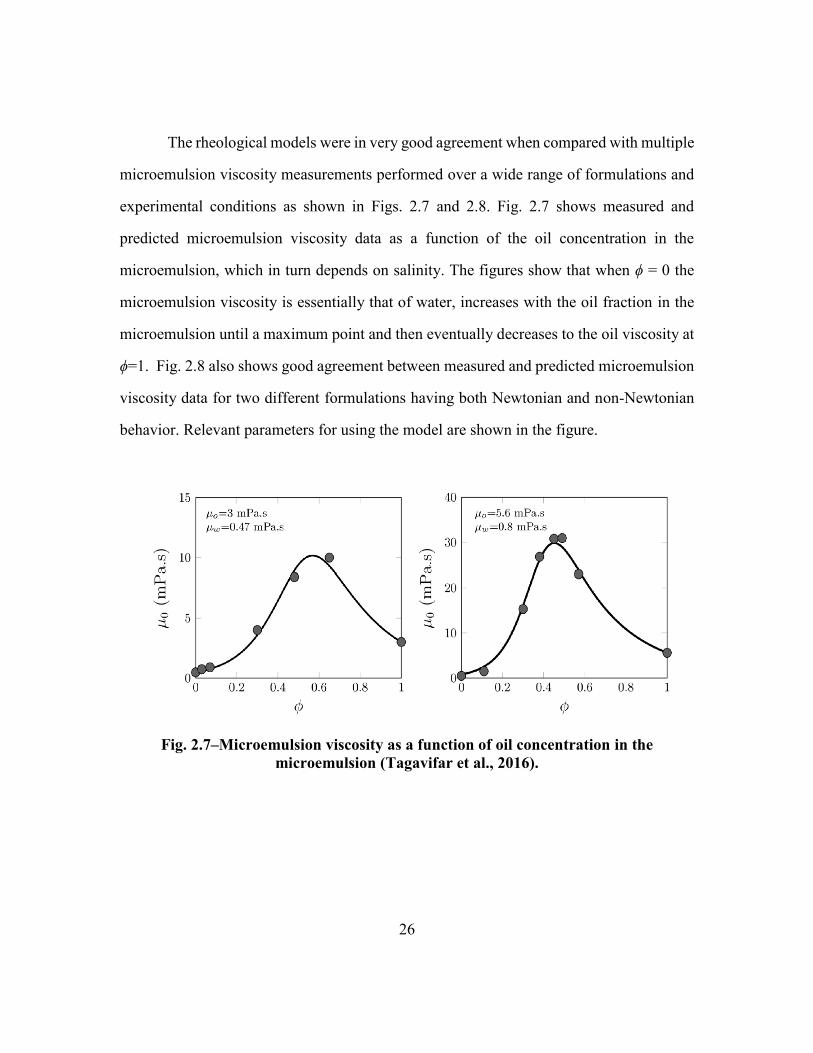
The rheological models were in very good agreement when compared with multiple
microemulsion viscosity measurements performed over a wide range of formulations and
experimental conditions as shown in Figs. 2.7 and 2.8. Fig. 2.7 shows measured and
predicted microemulsion viscosity data as a function of the oil concentration in the
microemulsion, which in turn depends on salinity. The figures show that when ϕ = 0 the
microemulsion viscosity is essentially that of water, increases with the oil fraction in the
microemulsion until a maximum point and then eventually decreases to the oil viscosity at
ϕ=1. Fig. 2.8 also shows good agreement between measured and predicted microemulsion
viscosity data for two different formulations having both Newtonian and non-Newtonian
behavior. Relevant parameters for using the model are shown in the figure.
Fig. 2.7‒Microemulsion viscosity as a function of oil concentration in the
microemulsion (Tagavifar et al., 2016).
27
Fig. 2.8‒Microemulsion viscosity as a function of shear rate (Tagavifar et al.,
2016).
The core flood results from Walker et al. (2012) and Jang et al. (2016) have
demonstrated that viscous microemulsions are undesirable for oil recovery from non-
fractured rocks. However, as will be shown later, viscous microemulsions are favorable for
oil recovery from fractured media, thus, a good understanding and characterization of
microemulsion rheological behavior is fundamental for designing and optimizing
surfactant flooding processes.
2.3 SURFACTANTS RECOVERY MECHANISMS IN FRACTURED MEDIA
The purpose of this section is to describe the fundamental mechanisms for oil
recovery from naturally fractured reservoirs using surfactants for enhanced oil recovery.
There are four mechanisms causing flow/transport of chemical species in
permeable media; these are viscous, capillary, gravity and diffusion forces.
28
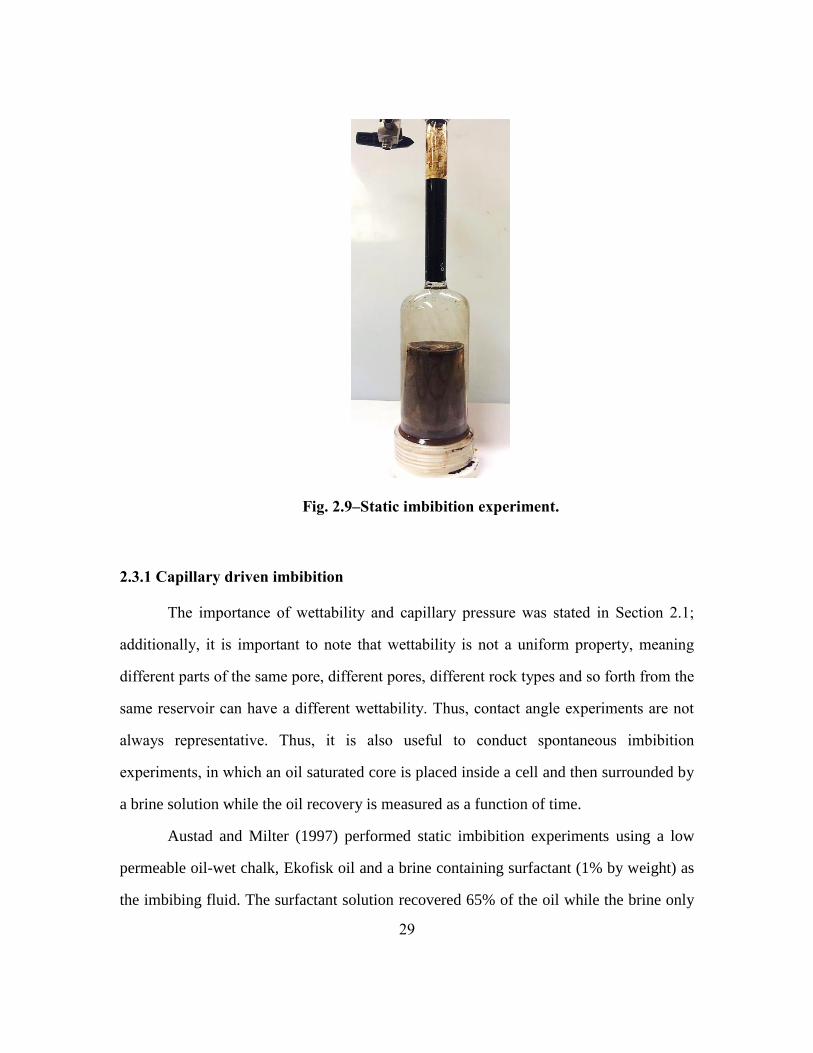
Capillary and gravity forces are the widely accepted driving mechanisms for oil
recovery from oil-wet carbonate rocks and have been extensively studied with static
imbibition experiments (Fig. 2.9).
Diffusion as a driving force for oil recovery from NFRs was studied by Stoll et al.
(2008). They conducted both imbibition experiments and a theoretical analysis, and
concluded that surfactant imbibition by diffusion is too slow to improve the oil recovery
economically. This argument was later supported by the simulation studies of Najafabadi
et al. (2008) and Abbasi et al. (2010), who used UTCHEM: a 3D, multicomponent,
multiphase, compositional simulator developed at the Center for Petroleum and
Geosystems Engineering at the University of Texas at Austin, to model a wide range of
chemical floods in fractured media.
The effect of viscous forces on imbibition (commonly known as viscous crossflow,
i.e. during fluid flow through layers of different permeability) has been generally neglected
during surfactant flooding applications in fractured media. However, as shown numerically
by Abbasi et al. (2010) and Kiani et al. (2014), viscous forces play a major role during
surfactant EOR processes from fractured carbonate rocks.
29
Fig. 2.9‒Static imbibition experiment.
2.3.1 Capillary driven imbibition
The importance of wettability and capillary pressure was stated in Section 2.1;
additionally, it is important to note that wettability is not a uniform property, meaning
different parts of the same pore, different pores, different rock types and so forth from the
same reservoir can have a different wettability. Thus, contact angle experiments are not
always representative. Thus, it is also useful to conduct spontaneous imbibition
experiments, in which an oil saturated core is placed inside a cell and then surrounded by
a brine solution while the oil recovery is measured as a function of time.
Austad and Milter (1997) performed static imbibition experiments using a low
permeable oil-wet chalk, Ekofisk oil and a brine containing surfactant (1% by weight) as
the imbibing fluid. The surfactant solution recovered 65% of the oil while the brine only
30
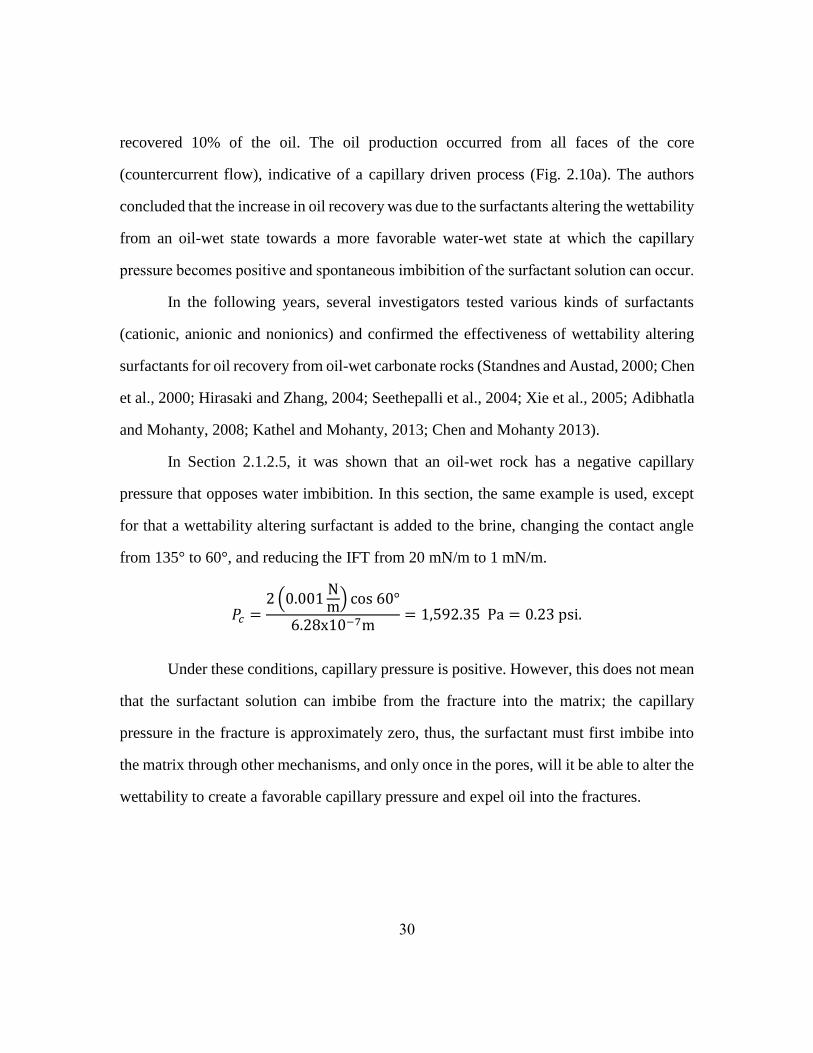
recovered 10% of the oil. The oil production occurred from all faces of the core
(countercurrent flow), indicative of a capillary driven process (Fig. 2.10a). The authors
concluded that the increase in oil recovery was due to the surfactants altering the wettability
from an oil-wet state towards a more favorable water-wet state at which the capillary
pressure becomes positive and spontaneous imbibition of the surfactant solution can occur.
In the following years, several investigators tested various kinds of surfactants
(cationic, anionic and nonionics) and confirmed the effectiveness of wettability altering
surfactants for oil recovery from oil-wet carbonate rocks (Standnes and Austad, 2000; Chen
et al., 2000; Hirasaki and Zhang, 2004; Seethepalli et al., 2004; Xie et al., 2005; Adibhatla
and Mohanty, 2008; Kathel and Mohanty, 2013; Chen and Mohanty 2013).
In Section 2.1.2.5, it was shown that an oil-wet rock has a negative capillary
pressure that opposes water imbibition. In this section, the same example is used, except
for that a wettability altering surfactant is added to the brine, changing the contact angle
from 135° to 60°, and reducing the IFT from 20 mN/m to 1 mN/m.
𝑃𝑐 =2 (0.001
Nm) cos 60°
6.28x10⁻⁷m= 1,592.35 Pa = 0.23 psi.
Under these conditions, capillary pressure is positive. However, this does not mean
that the surfactant solution can imbibe from the fracture into the matrix; the capillary
pressure in the fracture is approximately zero, thus, the surfactant must first imbibe into
the matrix through other mechanisms, and only once in the pores, will it be able to alter the
wettability to create a favorable capillary pressure and expel oil into the fractures.
31
Fig. 2.10‒ a) Countercurrent and b) co-current imbibition profiles.
2.3.2 Gravity driven imbibition
Typical surfactants used for EOR both reduce the IFT and change the wettability.
The reduction of IFT is typically more important than the change in wettability with respect
to conventional surfactant flooding. Capillary pressure becomes less important and gravity
more important, as the IFT decreases and eventually the imbibition process is dominated
by gravity forces.
Several authors have reported the successful use of surfactants to recovery oil from
oil-wet carbonates by reducing the IFT to low values (Hirasaki and Zhang, 2004; Adibhatla
and Mohanty, 2008, Mirzaei et al., 2015; Li et al., 2016). However, it is surprising that that
there have not been more studies of the low IFT approach to enhance imbibition.
Gravity driven imbibition (also known as gravity drainage within the gas EOR
discipline) occurs due to the potential gradient that arises from the density difference
between the fluids in the fracture and the fluids in the matrix. Gravity driven processes
develop co-current flow profiles as shown in Fig. 2.10b.
32
The following example illustrates the mechanisms underlying gravity driven
imbibition. Figure 2.2 is used as the reference system in conjunction with the following
properties; water density, ρw=1000 kg/m3, oil density, ρo=900 kg/m3, block height, H=1 m.
The gravity potential is calculated as follows:
Φ𝑔 = ∆𝜌𝑔𝐻 (2.37)
Φ𝑔 = (100 kg/m3)(9.81m/s2)(1 m)
Φ𝑔 = 981 Pa = 0.14 psi
This value is lower than the capillary pressure calculated in Section 2.1.2, thus,
imbibition cannot occur. However, when the water is replaced by a surfactant solution that
lowers the interfacial tension to a value of 0.001 mN/m the capillary pressure becomes,
𝑃𝑐 =2 (1x10⁻⁶ N
m) cos135°
6.28x10⁻⁷m= −2.252 Pa = −3x10⁻⁴ psi.
In this case, the gravity potential is much higher than the opposing capillary
pressure and imbibition will occur.
In the previous calculations it was assumed that the surfactant had no effect on the
rock wettability. This is useful for demonstration purposes but is certainly an incorrect
assumption. In fact, it underestimates the potential of surfactants, since it has been shown
that the more favorable contact angles for oil recovery are strongly correlated with the
lowest IFTs (Reed and Healy, 1984; Gupta and Mohanty, 2008). The results of Li et al.
(2016) also support this argument. They conducted a large number of imbibition
experiments using oil-wet carbonate rocks of different sizes (in the horizontal and vertical
direction), as well as different oils and a variety of surfactant formulations that achieved
interfacial tensions ranging from 0.001 to 0.1 mN/m. The authors concluded that the
greatest oil recovery occurred when using surfactants that achieved the lowest IFT.
33
The contribution of gravity forces for oil mobilization at the pore scale is quantified
through a dimensionless ratio of gravity to capillary forces, known as the Bond number.
One such definition is as follows:
𝑁𝐵 =𝑘∆𝜌𝑔
𝜎, (2.38)
where σ is the interfacial tension. The Bond number has been used to estimate oil recovery
from NFRs, (Kamath 2001; Tie and Morrow, 2005; Masalmeh, 2013).
A more general analysis of viscous and gravity forces leads to the trapping number
(Jin, 1995; Pope et al., 2000). The trapping number includes the vector sum of the viscous
and gravity forces. The viscous forces are quantified by the capillary number:
𝑁𝑐 =𝑘∇Φ
𝜎 (2.39)
where σ is the interfacial tension and ∇Φ potential gradient. The Trapping number been
used to understand the effect of these forces on enhanced oil recovery from non-fractured
oil reservoirs (Delshad et al., 1996). It also applies to oil recovery from NFRs, but has
gotten much less attention in such applications.
2.3.3 Scaling of imbibition
The Bond number has also been used to scale the effect of buoyancy on imbibition
(Iffly et al.1972; Du Prey, 1978; Schechter et al., 1994).
𝑁𝐵−1 = 𝐶
𝜎𝑐𝑜𝑠𝜃√𝜙/𝑘
∆𝜌𝑔𝐻, (2.40)
where C is a constant (equal to 4 for the capillary tube model). Schechter et al. (1994)
showed that imbibition is driven by capillary forces when NB-1>5, by gravity forces when
NB-1<1, and by both forces when 1<NB
-1<5.
34
In addition, models that correlate the results obtained from static imbibition
experiments into a greater scale have been presented for both capillary and gravity driven
imbibition. Extensive reviews of these scaling groups can be found in Abbasi (2010) and
Kathel (2015). The fact that so many scaling groups have been proposed over the past
several decades indicates that scaling up imbibition processes is a difficult problem. Many
authors have attempted to correlate their laboratory data using different definitions of
dimensionless time, but these correlations were later found to not accurately represent the
data of other investigators. Table 2.3 shows a few of the proposed scaling groups for gravity
driven imbibition.
Table 2.3‒Scaling groups for gravity dominated imbibition
Scaling group Parameters Reference
𝑡𝐷 =2𝑘𝑘𝑟𝑀𝐸
0 ∆𝜌𝑔𝐻
∅𝜇𝑀𝐸(𝑅2 + 𝑀𝐻2)𝑡 𝑀 =
𝑘𝑟𝑀𝐸0 𝜇𝑜
𝑘𝑟𝑜𝑜 𝜇𝑤
Li et al. (2016)
𝑡𝐷 =𝜆∗∆𝜌𝑔
∅(
1
𝐻+
8𝛼
𝜋𝐷) 𝑡
𝜆∗ =𝑘𝑘𝑟
∗
𝜇∗
𝛼~0.5
Mirzaei et al.,
(2016)
𝑡𝐷 =𝑘∆𝜌𝑔
∅𝜇𝑜𝐿𝑐𝑡
𝐿𝑐 =𝐻
(𝐿𝑥
2 )2
+ (𝐿𝑦
2 )2
+ 𝐻2
Hui et al.,
(2014)
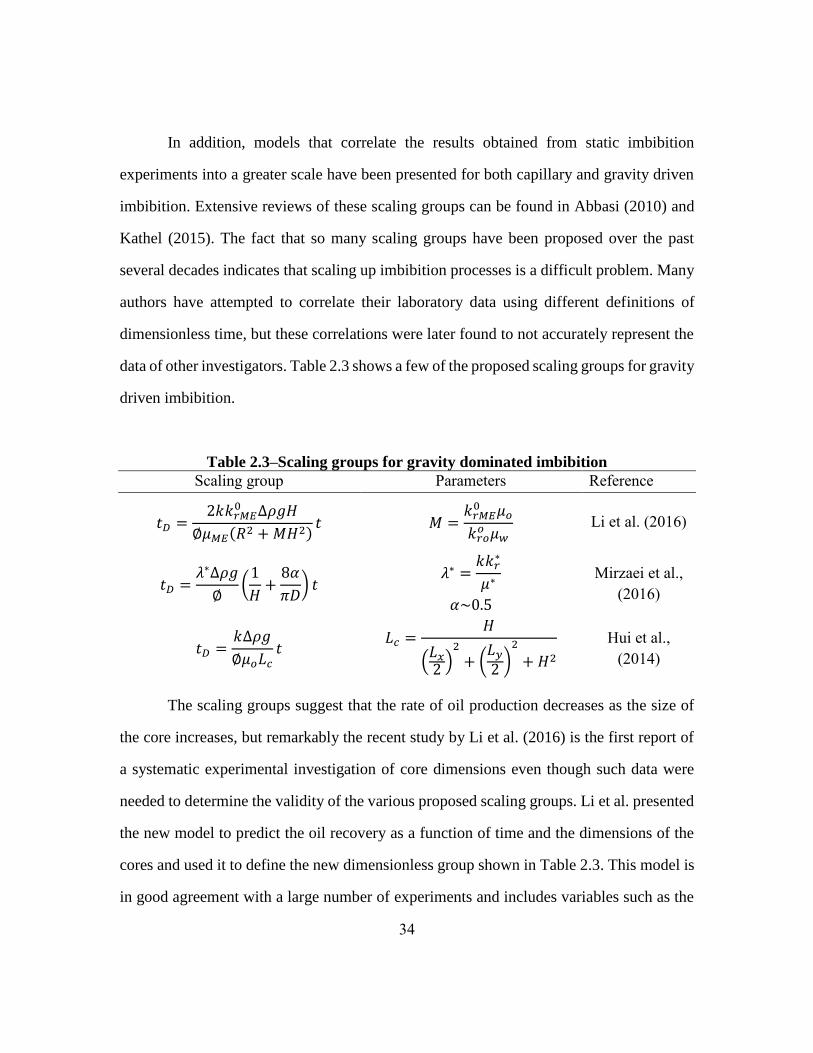
The scaling groups suggest that the rate of oil production decreases as the size of
the core increases, but remarkably the recent study by Li et al. (2016) is the first report of
a systematic experimental investigation of core dimensions even though such data were
needed to determine the validity of the various proposed scaling groups. Li et al. presented
the new model to predict the oil recovery as a function of time and the dimensions of the
cores and used it to define the new dimensionless group shown in Table 2.3. This model is
in good agreement with a large number of experiments and includes variables such as the
35
mobility ratio that have not been included in previous attempts to scale imbibition
experiments. Nevertheless, it is approximate and additional validation with more
experimental data would be desirable.
Neither the static imbibition experiments nor the model capture the dynamic effects
of the transverse pressure gradient, which is now known to be of first order importance
based on the new dynamic experiments reported in this thesis. In these models, the
subscripts ME stands for microemulsion, and the subscripts 0 and * denote the conditions
at which properties are evaluated; at the critical saturation of a residual phase or at the
imbibing front respectively. The other parameters have been previously defined.
2.3.4 Viscous crossflow
The effects of viscous forces have been extensively studied in applications other
than surfactant flooding of NFRs, i.e. for water and polymer floods in layered reservoirs.
Crossflow is defined as the flow transverse to the main bulk flow direction. Crossflow
occurs as a result of gradients in viscous, capillary, dispersion and gravity forces.
Viscous crossflow is caused by the difference in mobilities between the displaced
and displacing fluids. Analysis of viscous crossflow in layered horizontal reservoirs has
been given by several authors (Zapata and Lake, 1981; Clifford and Sorbie, 1985; Willhite,
1986; Sorbie, 1991; Lake et al., 2014).
Viscous crossflow can be explained by considering the two-dimensional cross
sectional reservoir shown in Fig. 2.11. The reservoir is composed of two layers with distinct
uniform properties, a high permeability layer on the bottom and a low permeability layer
on the top. The common starting point in the study of stratified systems with crossflow is
to invoke the assumption of vertical equilibrium (VE). VE implies that the pressures along
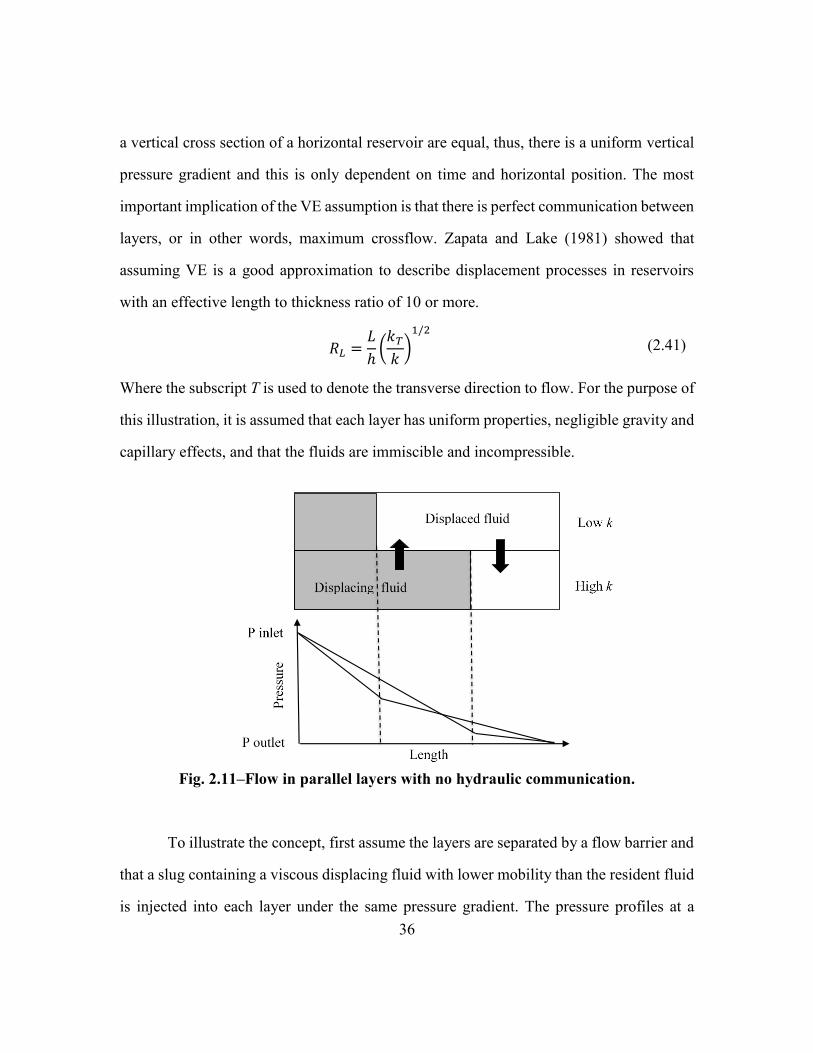
36
a vertical cross section of a horizontal reservoir are equal, thus, there is a uniform vertical
pressure gradient and this is only dependent on time and horizontal position. The most
important implication of the VE assumption is that there is perfect communication between
layers, or in other words, maximum crossflow. Zapata and Lake (1981) showed that
assuming VE is a good approximation to describe displacement processes in reservoirs
with an effective length to thickness ratio of 10 or more.
𝑅𝐿 =𝐿
ℎ(
𝑘𝑇
𝑘)
1/2
(2.41)
Where the subscript T is used to denote the transverse direction to flow. For the purpose of
this illustration, it is assumed that each layer has uniform properties, negligible gravity and
capillary effects, and that the fluids are immiscible and incompressible.
Fig. 2.11‒Flow in parallel layers with no hydraulic communication.
To illustrate the concept, first assume the layers are separated by a flow barrier and
that a slug containing a viscous displacing fluid with lower mobility than the resident fluid
is injected into each layer under the same pressure gradient. The pressure profiles at a
37
certain time t during the displacement are shown in Fig. 2.11. Since the overall pressure
drop is fixed, the rate of advance of the injected fluid in the low permeability layer is much
slower than in the high permeability layer. Next, the case of hydraulic communication
between the layers is considered. Again, VE implies that there is only one pressure at any
point in a vertical cross section. Therefore, in order to equalize the pressures and preserve
mass balance flow must occur between the layers. Crossflow occurs from the high to the
low permeability layer at the rear of the viscous fluid and from the low to the high
permeability layer ahead of the viscous fluid, causing the injected fluid to slow down in
the high permeability layer and speed up in the low permeability layer, thus, improving the
vertical sweep efficiency in the reservoir.
Viscous crossflow has been recognized as an important mechanism for oil recovery
during gas flooding operations in naturally fractured reservoirs (Hirasaki et al., 2004; Li et
al., 2010; Sydansk and Romero-Zerón, 2011; Lake et al., 2014; Ferno et al., 2016), but it
has been generally neglected during most studies of surfactant EOR in the same type of
reservoirs. However, fractured reservoirs can be considered as layered reservoirs with
extreme permeability contrast, therefore, viscous forces would be expected to improve
sweep efficiency.
2.4 SURFACTANTS FLOODS IN FRACTURED CARBONATE MEDIA
This section discusses some of the few experimental and numerical studies of
surfactant floods (dynamic imbibition) in fractured carbonate media.
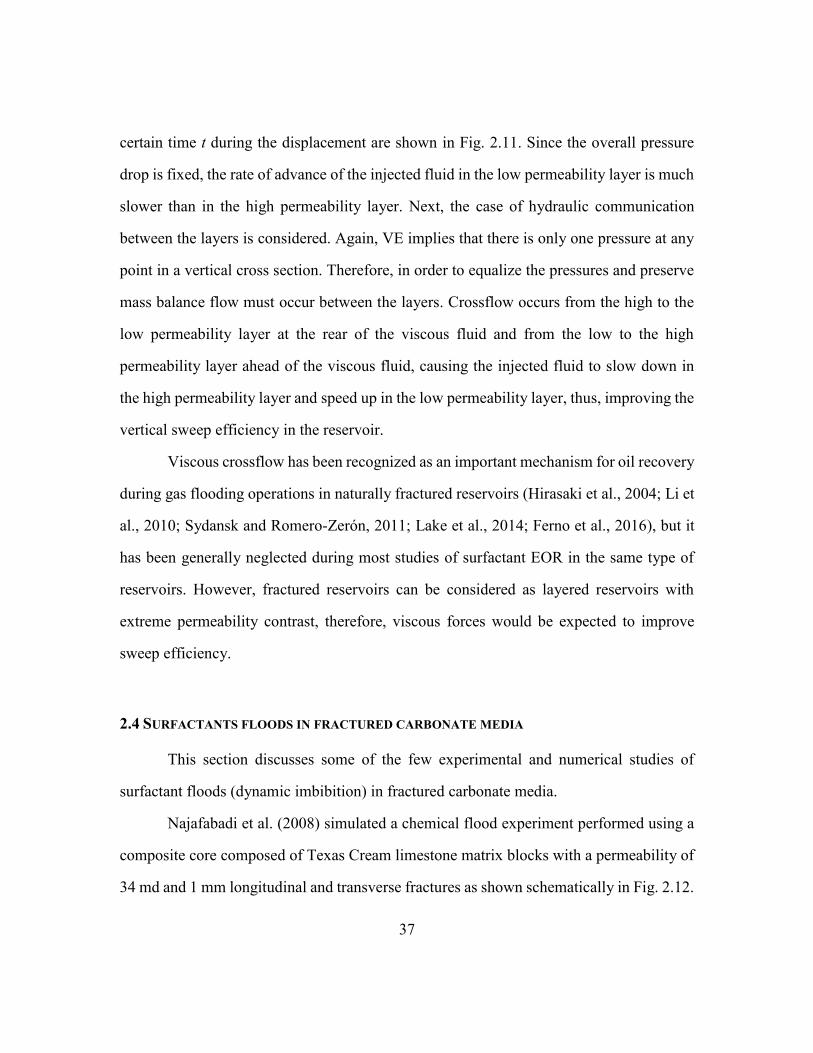
Najafabadi et al. (2008) simulated a chemical flood experiment performed using a
composite core composed of Texas Cream limestone matrix blocks with a permeability of
34 md and 1 mm longitudinal and transverse fractures as shown schematically in Fig. 2.12.
38
The experimental procedure was to saturate the core with oil. Next, a waterflood was
conducted followed by injection of alkali and then by an alkaline-surfactant flood. The
interstitial velocity in the fractures during the floods was about 30 ft/D and the pressure
drop was reported to be about 0.8 psi/ft. The waterflood recovered 15% of the OOIP, an
additional 15% was recovered by injection of alkali and 6% more was recovered by
injection of the alkaline-surfactant solution. The oil recovery mechanisms were modeled
as wettability alteration during the alkaline injection, and wettability alteration and low
interfacial tension during the AS flood.
Fig. 2.12‒Schematic representation of the physical fracture-matrix system used for
chemical floods (Najafabadi et al. 2008).
The authors used UTCHEM to model the experiment and tested the process
sensitivity to different variables, such as mesh refinement, fracture-matrix permeability
ratio, injection flow rate, molecular diffusion and injection scheme. The authors found that
the pressure drop during the alkaline-surfactant flood was slightly higher when compared
to the injection of alkali alone; they argued that this difference was due to the formation of
a microemulsion and pointed out the need to perform dynamic laboratory experiments to
evaluate the effects of viscous forces during chemical floods in fractured media.
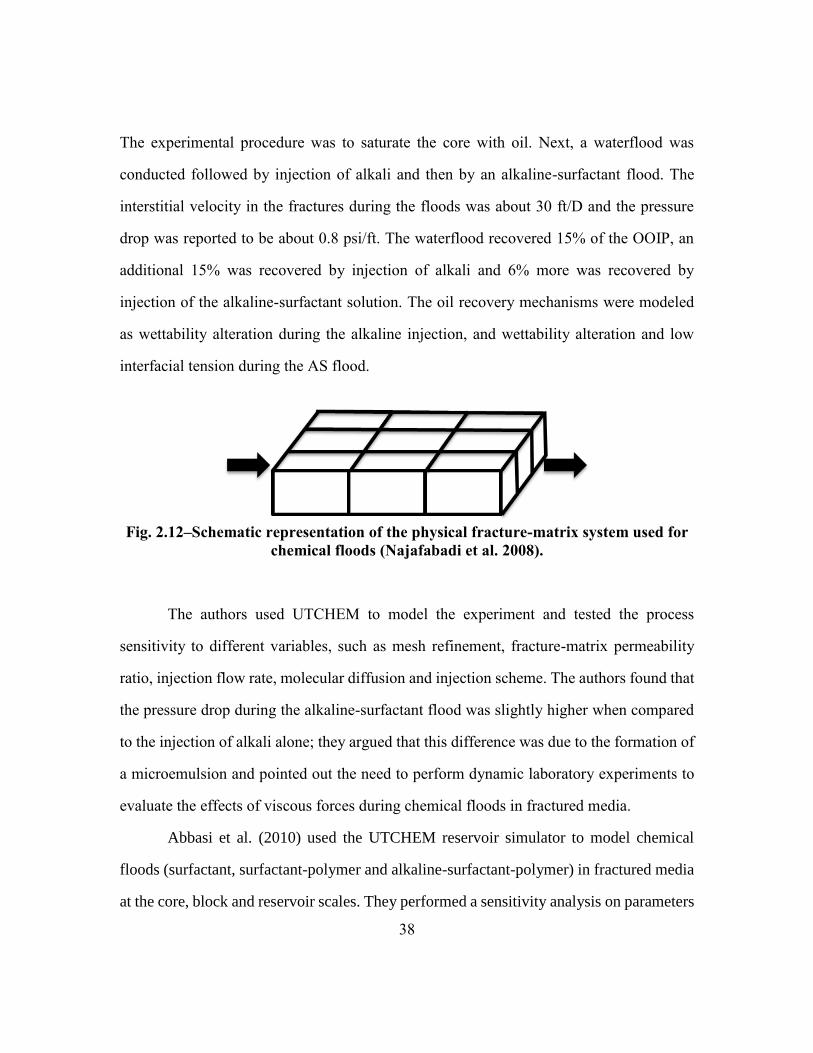
Abbasi et al. (2010) used the UTCHEM reservoir simulator to model chemical
floods (surfactant, surfactant-polymer and alkaline-surfactant-polymer) in fractured media
at the core, block and reservoir scales. They performed a sensitivity analysis on parameters
39
such as IFT, wettability alteration, diffusion coefficient, pressure gradient and viscosity.
The simulations indicated that viscous pressure gradients transverse to the flow direction
in the fractures increased the rate of surfactant imbibition into the matrix and thus increased
the oil recovery. Consequently, they found that having a more viscous surfactant solution
flowing inside the fractures (due either to the addition of polymer, foam or to the formation
of a microemulsion) can increase the rate of oil recovery from fractured media. Fig. 2.13
illustrates the effects of transverse pressure gradients during a surfactant flood in a
fractured block. The surfactant concentration profile is shown on the top and the matrix
and fracture pressure profiles are shown on the bottom. The pressure within the fracture
region containing the surfactant is higher than the pressure in the neighboring matrix (the
higher pressure in the fracture is due to the formation of microemulsion). The transverse
pressure gradient will induce crossflow/imbibition of the surfactant solution from the
fracture into the matrix.
Fig. 2.13‒Transverse pressure gradients for a surfactant flood in a fractured block
(Abbasi et al., 2010).
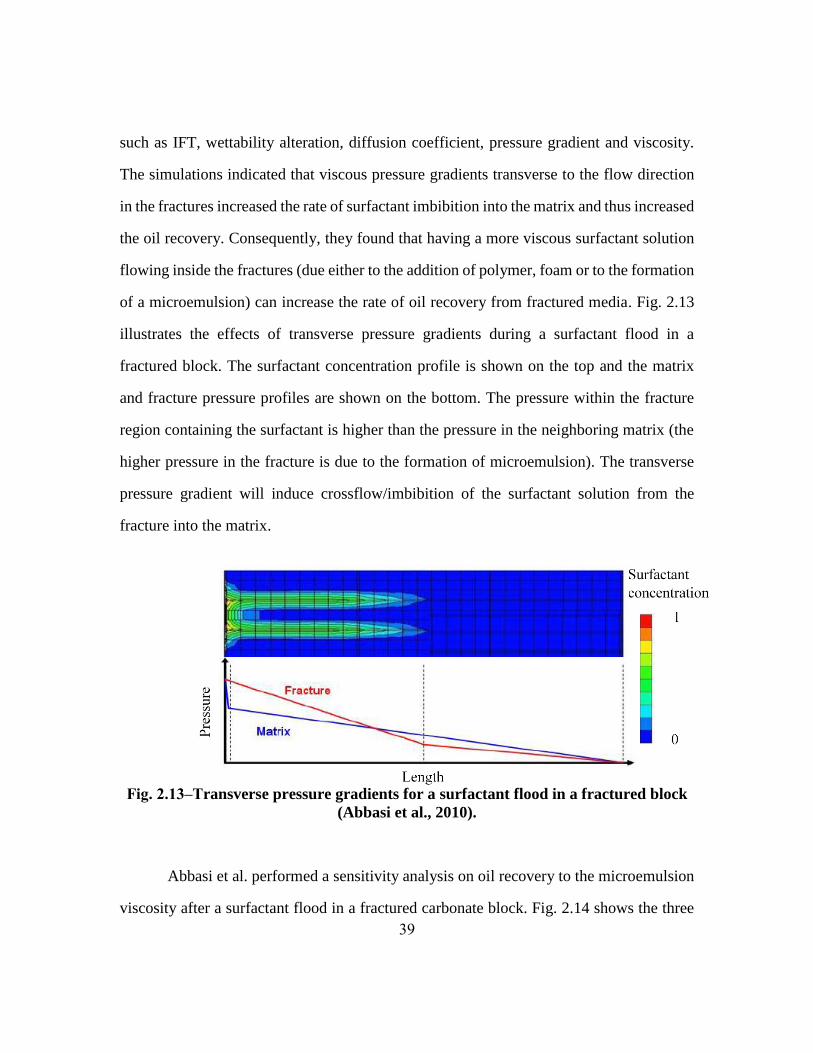
Abbasi et al. performed a sensitivity analysis on oil recovery to the microemulsion
viscosity after a surfactant flood in a fractured carbonate block. Fig. 2.14 shows the three
40
cases and indicates that the most viscous microemulsion achieves the greatest rate of oil
recovery, even though the ultimate oil recovery is not strongly affected. However, the rate
of recovery is the most important parameter in the design of EOR processes for fractured
media.
Fig. 2.14‒Effect of microemulsion viscosity on oil recovery from fractured media
(Abbasi et al., 2010).
Kiani et al. (2014) introduced a viscous displacement term in the matrix-fracture
transfer function of a dual porosity model and applied it to study surfactant processes in
naturally fractured reservoirs. They concluded that the addition of the viscous displacement
mechanism led to an increase in the oil recovery from a fractured reservoir since it enhances
the matrix-fracture fluid exchange.
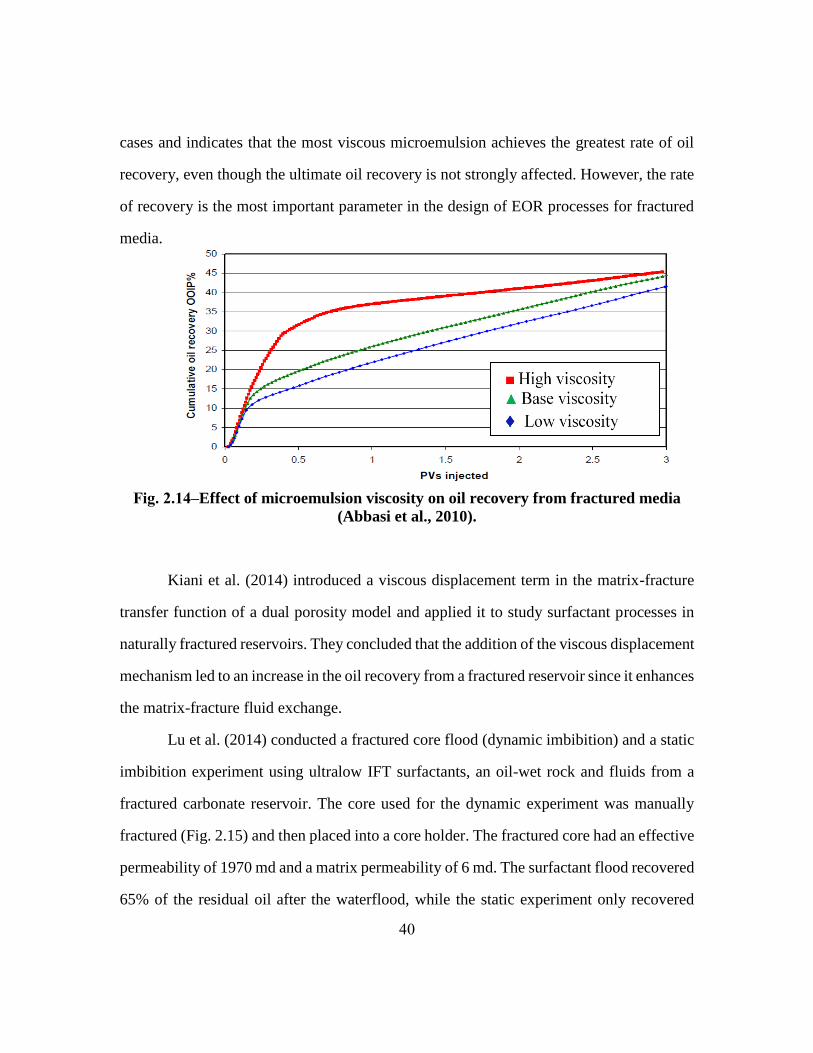
Lu et al. (2014) conducted a fractured core flood (dynamic imbibition) and a static
imbibition experiment using ultralow IFT surfactants, an oil-wet rock and fluids from a
fractured carbonate reservoir. The core used for the dynamic experiment was manually
fractured (Fig. 2.15) and then placed into a core holder. The fractured core had an effective
permeability of 1970 md and a matrix permeability of 6 md. The surfactant flood recovered
65% of the residual oil after the waterflood, while the static experiment only recovered
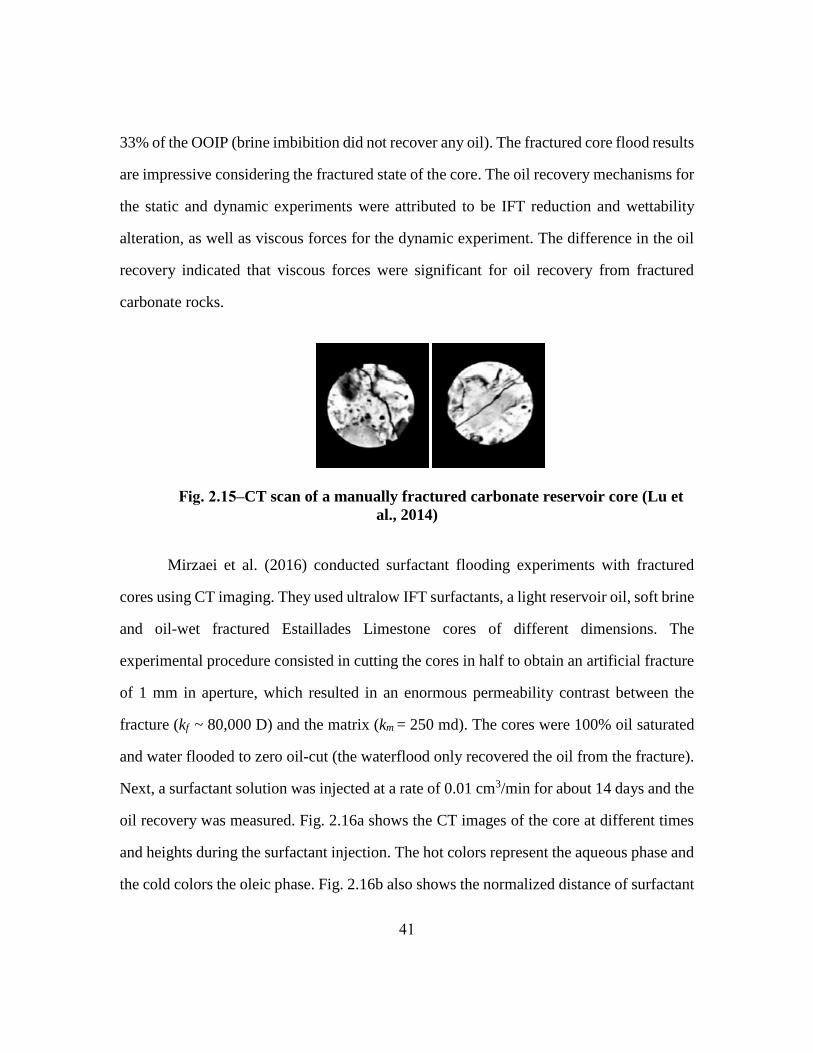
41
33% of the OOIP (brine imbibition did not recover any oil). The fractured core flood results
are impressive considering the fractured state of the core. The oil recovery mechanisms for
the static and dynamic experiments were attributed to be IFT reduction and wettability
alteration, as well as viscous forces for the dynamic experiment. The difference in the oil
recovery indicated that viscous forces were significant for oil recovery from fractured
carbonate rocks.
Fig. 2.15‒CT scan of a manually fractured carbonate reservoir core (Lu et
al., 2014)
Mirzaei et al. (2016) conducted surfactant flooding experiments with fractured
cores using CT imaging. They used ultralow IFT surfactants, a light reservoir oil, soft brine
and oil-wet fractured Estaillades Limestone cores of different dimensions. The
experimental procedure consisted in cutting the cores in half to obtain an artificial fracture
of 1 mm in aperture, which resulted in an enormous permeability contrast between the
fracture (kf ~ 80,000 D) and the matrix (km = 250 md). The cores were 100% oil saturated
and water flooded to zero oil-cut (the waterflood only recovered the oil from the fracture).
Next, a surfactant solution was injected at a rate of 0.01 cm3/min for about 14 days and the
oil recovery was measured. Fig. 2.16a shows the CT images of the core at different times
and heights during the surfactant injection. The hot colors represent the aqueous phase and
the cold colors the oleic phase. Fig. 2.16b also shows the normalized distance of surfactant
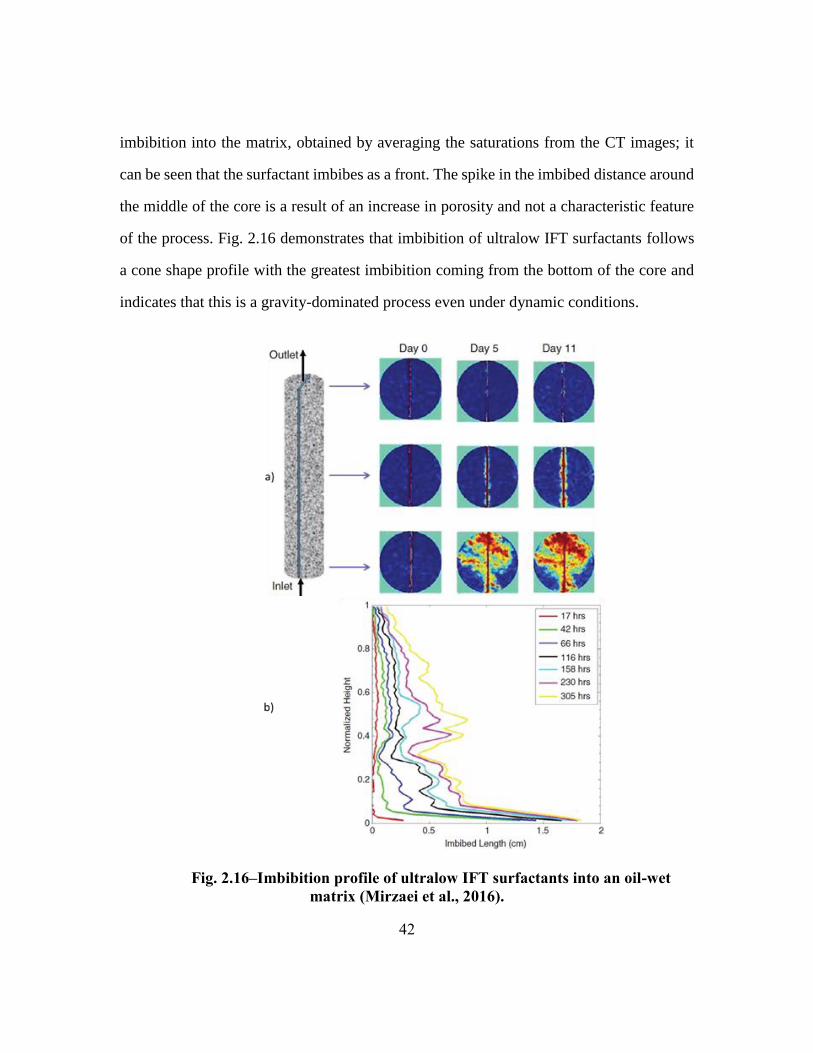
42
imbibition into the matrix, obtained by averaging the saturations from the CT images; it
can be seen that the surfactant imbibes as a front. The spike in the imbibed distance around
the middle of the core is a result of an increase in porosity and not a characteristic feature
of the process. Fig. 2.16 demonstrates that imbibition of ultralow IFT surfactants follows
a cone shape profile with the greatest imbibition coming from the bottom of the core and
indicates that this is a gravity-dominated process even under dynamic conditions.
Fig. 2.16‒Imbibition profile of ultralow IFT surfactants into an oil-wet
matrix (Mirzaei et al., 2016).
43
2.5 SUMMARY
Physical mechanisms pertaining to oil recovery from fractured reservoirs were
introduced in this chapter. Major aspects of surfactants whose main purpose is the
reduction of IFT to ultralow values were also discussed. The relationship between the
microemulsion rheological properties and the phase behavior introduced in this chapter is
of great importance for the experimental design presented in Chapter 3. Later it will be
shown that gravity and viscous forces are the main recovery mechanisms for the surfactant
imbibition experiments done during this research. The importance of viscous forces during
surfactant floods in fractured media has been demonstrated by previous simulation results,
however, there was until now no experimental study that focused solely on testing the effect
of viscous forces during surfactant floods in fractured carbonate rocks, this was the purpose
of this research.
44
Chapter 3: Experimental Material and Procedures
The purpose of this chapter is to introduce the experimental materials and
procedures that were used to conduct surfactant flooding experiments in fractured
carbonate cores.
The first step in this research was to develop a surfactant formulation that achieved
ultralow IFT when mixed with a light oil and a synthetic brine at a temperature of 78 °C.
Next, the microemulsion viscosity of the optimized formulation was measured at different
salinities and shear rates. A discussion on the experimental fluids is presented in Section
3.1 followed by a discussion of the rocks and the experimental apparatus in Sections 3.2
and 3.3, respectively.
A total of eight coreflood experiments were performed during this research. Six
fractured coreflood experiments abbreviated as FRAC-# and two non-fractured corefloods
abbreviated as non-FRAC-#. A coreflood (fractured or not) is also referred to as a dynamic
imbibition experiment. The general coreflood procedure is presented in Section 3.4. The
experimental results are presented in Chapter 4.
3.1 FLUIDS
3.1.1 Microemulsion phase behavior
The oil used in all experiments is a crude oil from a Middle East carbonate
reservoir. The oil density is 890 kg/m3. The dead oil has a viscosity of 12 cp at 78 °C. In
some experiments the crude oil was diluted with 10 wt. % toluene. The diluted oil viscosity
is 6 cp. The oil is not active, which means that it does not react with alkali.
The procedures used to measure the phase behavior and the criteria to select the
best formulations can be found in Levitt et al. (2009) and Flaaten et al. (2009) among many
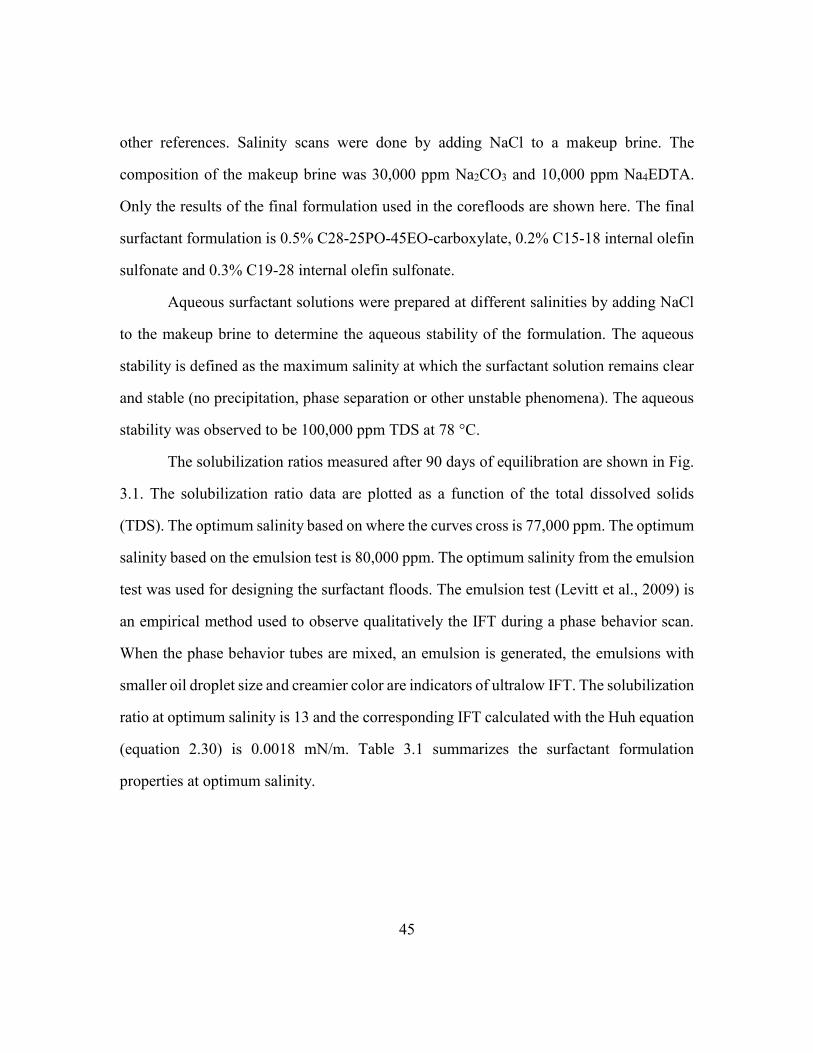
45
other references. Salinity scans were done by adding NaCl to a makeup brine. The
composition of the makeup brine was 30,000 ppm Na2CO3 and 10,000 ppm Na4EDTA.
Only the results of the final formulation used in the corefloods are shown here. The final
surfactant formulation is 0.5% C28-25PO-45EO-carboxylate, 0.2% C15-18 internal olefin
sulfonate and 0.3% C19-28 internal olefin sulfonate.
Aqueous surfactant solutions were prepared at different salinities by adding NaCl
to the makeup brine to determine the aqueous stability of the formulation. The aqueous
stability is defined as the maximum salinity at which the surfactant solution remains clear
and stable (no precipitation, phase separation or other unstable phenomena). The aqueous
stability was observed to be 100,000 ppm TDS at 78 °C.
The solubilization ratios measured after 90 days of equilibration are shown in Fig.
3.1. The solubilization ratio data are plotted as a function of the total dissolved solids
(TDS). The optimum salinity based on where the curves cross is 77,000 ppm. The optimum
salinity based on the emulsion test is 80,000 ppm. The optimum salinity from the emulsion
test was used for designing the surfactant floods. The emulsion test (Levitt et al., 2009) is
an empirical method used to observe qualitatively the IFT during a phase behavior scan.
When the phase behavior tubes are mixed, an emulsion is generated, the emulsions with
smaller oil droplet size and creamier color are indicators of ultralow IFT. The solubilization
ratio at optimum salinity is 13 and the corresponding IFT calculated with the Huh equation
(equation 2.30) is 0.0018 mN/m. Table 3.1 summarizes the surfactant formulation
properties at optimum salinity.
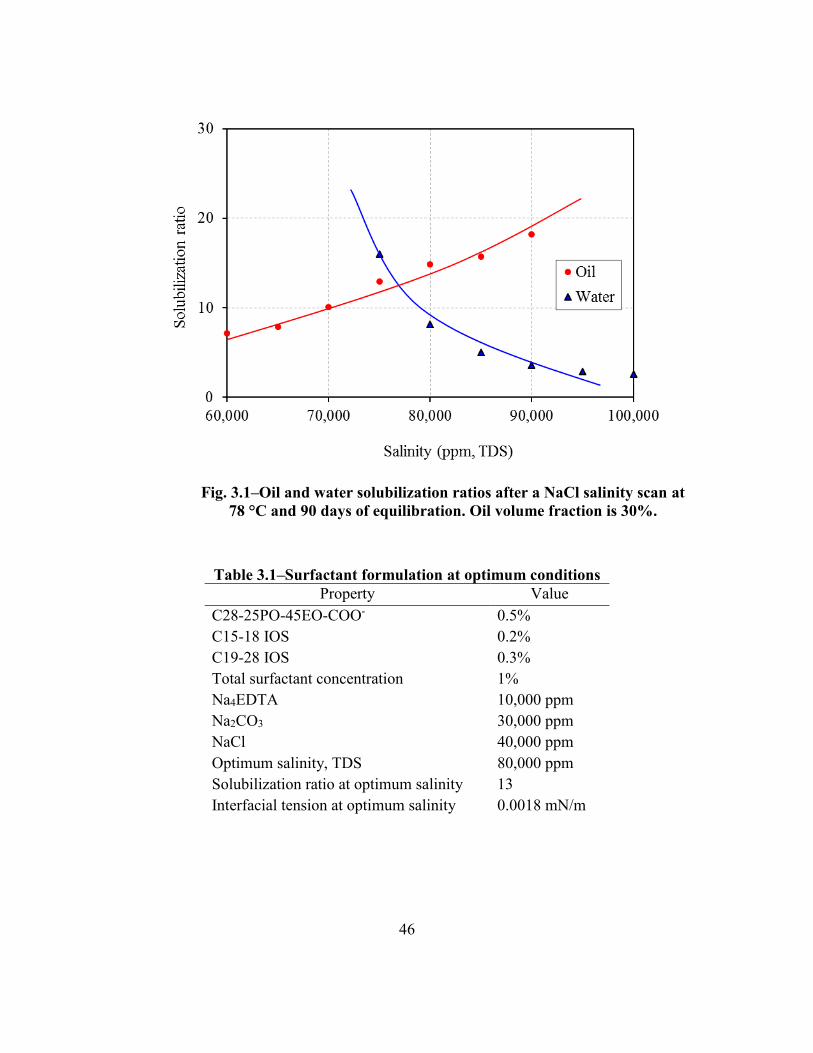
46
Fig. 3.1‒Oil and water solubilization ratios after a NaCl salinity scan at
78 °C and 90 days of equilibration. Oil volume fraction is 30%.
Table 3.1‒Surfactant formulation at optimum conditions
Property Value
C28-25PO-45EO-COO- 0.5%
C15-18 IOS 0.2%
C19-28 IOS 0.3%
Total surfactant concentration 1%
Na4EDTA 10,000 ppm
Na2CO3 30,000 ppm
NaCl 40,000 ppm
Optimum salinity, TDS 80,000 ppm
Solubilization ratio at optimum salinity 13
Interfacial tension at optimum salinity 0.0018 mN/m
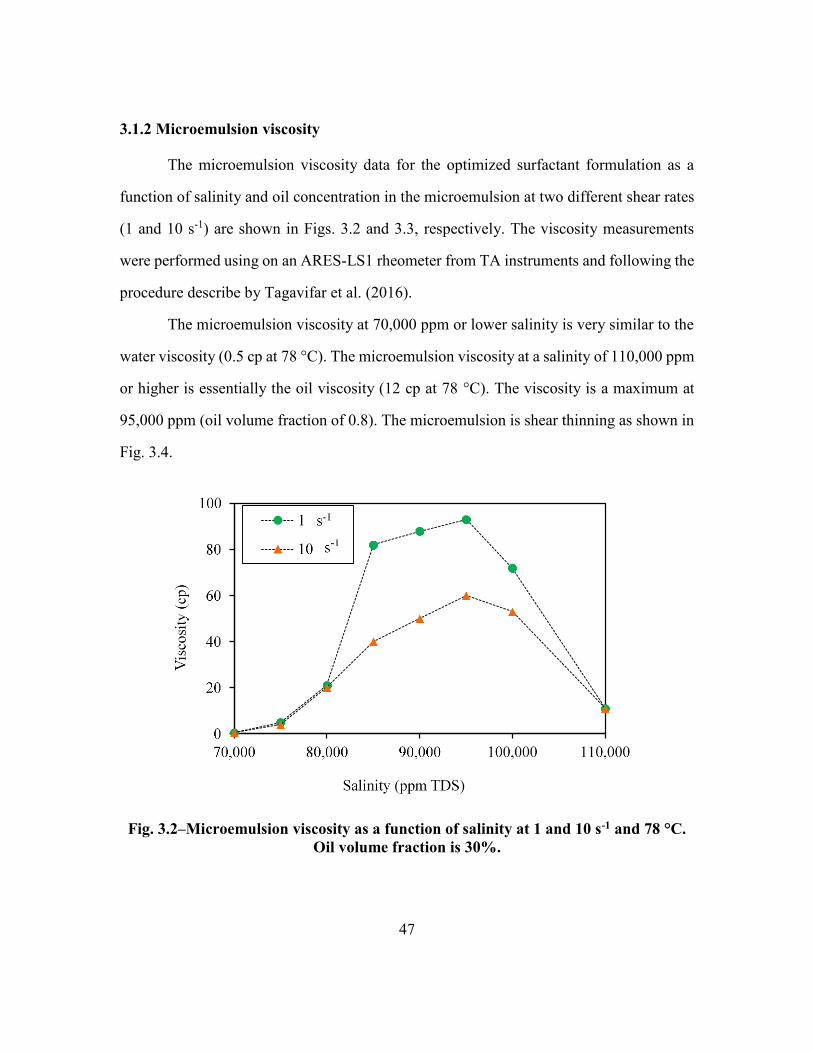
47
3.1.2 Microemulsion viscosity
The microemulsion viscosity data for the optimized surfactant formulation as a
function of salinity and oil concentration in the microemulsion at two different shear rates
(1 and 10 s-1) are shown in Figs. 3.2 and 3.3, respectively. The viscosity measurements
were performed using on an ARES-LS1 rheometer from TA instruments and following the
procedure describe by Tagavifar et al. (2016).
The microemulsion viscosity at 70,000 ppm or lower salinity is very similar to the
water viscosity (0.5 cp at 78 °C). The microemulsion viscosity at a salinity of 110,000 ppm
or higher is essentially the oil viscosity (12 cp at 78 °C). The viscosity is a maximum at
95,000 ppm (oil volume fraction of 0.8). The microemulsion is shear thinning as shown in
Fig. 3.4.
Fig. 3.2‒Microemulsion viscosity as a function of salinity at 1 and 10 s-1 and 78 °C.
Oil volume fraction is 30%.
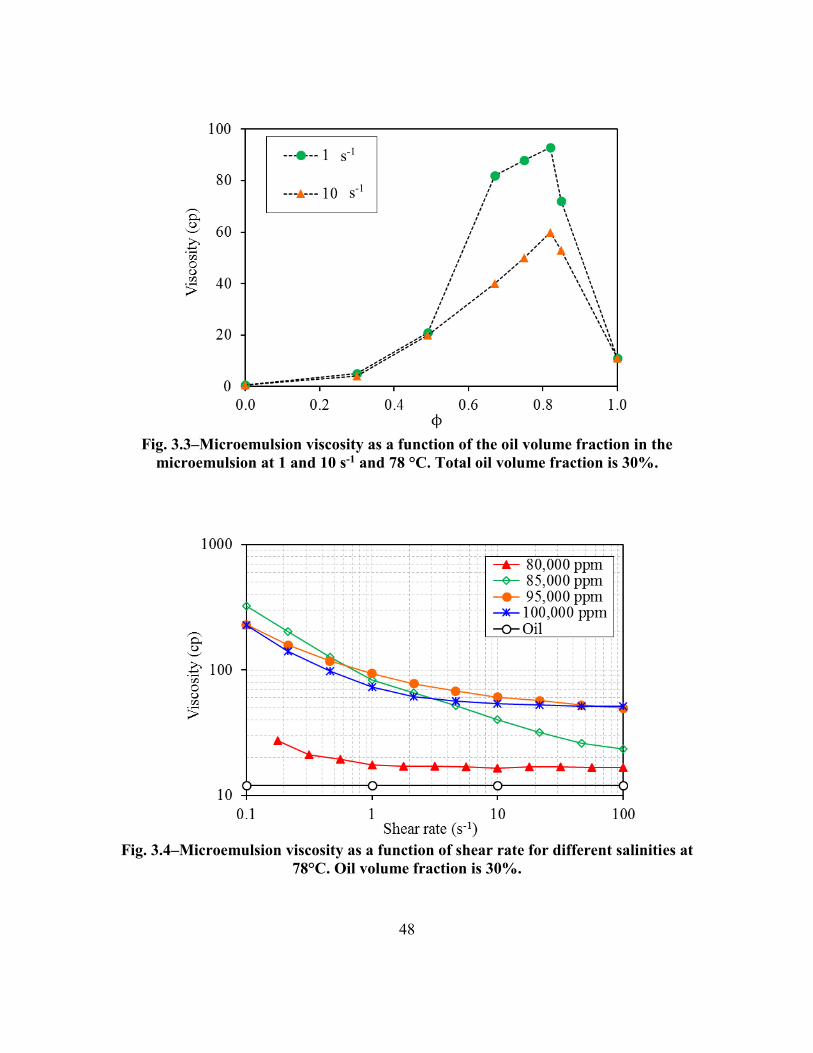
48
Fig. 3.3‒Microemulsion viscosity as a function of the oil volume fraction in the
microemulsion at 1 and 10 s-1 and 78 °C. Total oil volume fraction is 30%.
Fig. 3.4‒Microemulsion viscosity as a function of shear rate for different salinities at
78°C. Oil volume fraction is 30%.
s-1
s-1
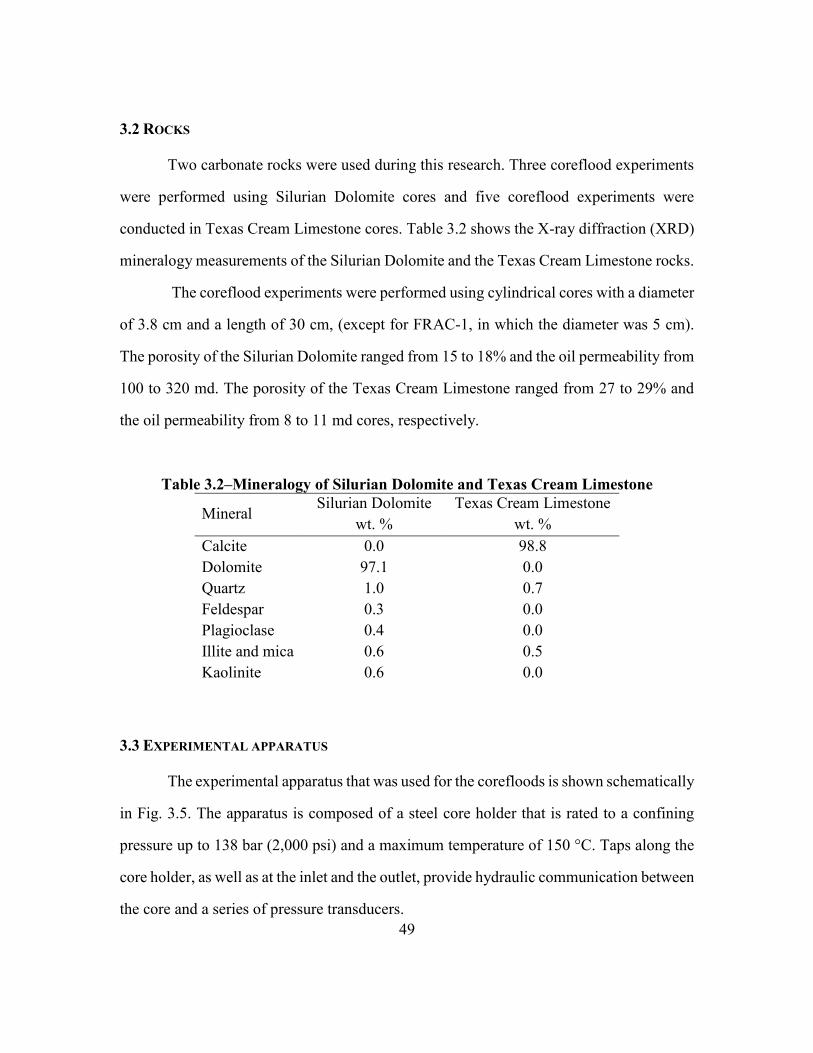
49
3.2 ROCKS
Two carbonate rocks were used during this research. Three coreflood experiments
were performed using Silurian Dolomite cores and five coreflood experiments were
conducted in Texas Cream Limestone cores. Table 3.2 shows the X-ray diffraction (XRD)
mineralogy measurements of the Silurian Dolomite and the Texas Cream Limestone rocks.
The coreflood experiments were performed using cylindrical cores with a diameter
of 3.8 cm and a length of 30 cm, (except for FRAC-1, in which the diameter was 5 cm).
The porosity of the Silurian Dolomite ranged from 15 to 18% and the oil permeability from
100 to 320 md. The porosity of the Texas Cream Limestone ranged from 27 to 29% and
the oil permeability from 8 to 11 md cores, respectively.
Table 3.2‒Mineralogy of Silurian Dolomite and Texas Cream Limestone
Mineral Silurian Dolomite
wt. %
Texas Cream Limestone
wt. %
Calcite 0.0 98.8
Dolomite 97.1 0.0
Quartz 1.0 0.7
Feldespar 0.3 0.0
Plagioclase 0.4 0.0
Illite and mica 0.6 0.5
Kaolinite 0.6 0.0
3.3 EXPERIMENTAL APPARATUS
The experimental apparatus that was used for the corefloods is shown schematically
in Fig. 3.5. The apparatus is composed of a steel core holder that is rated to a confining
pressure up to 138 bar (2,000 psi) and a maximum temperature of 150 °C. Taps along the
core holder, as well as at the inlet and the outlet, provide hydraulic communication between
the core and a series of pressure transducers.
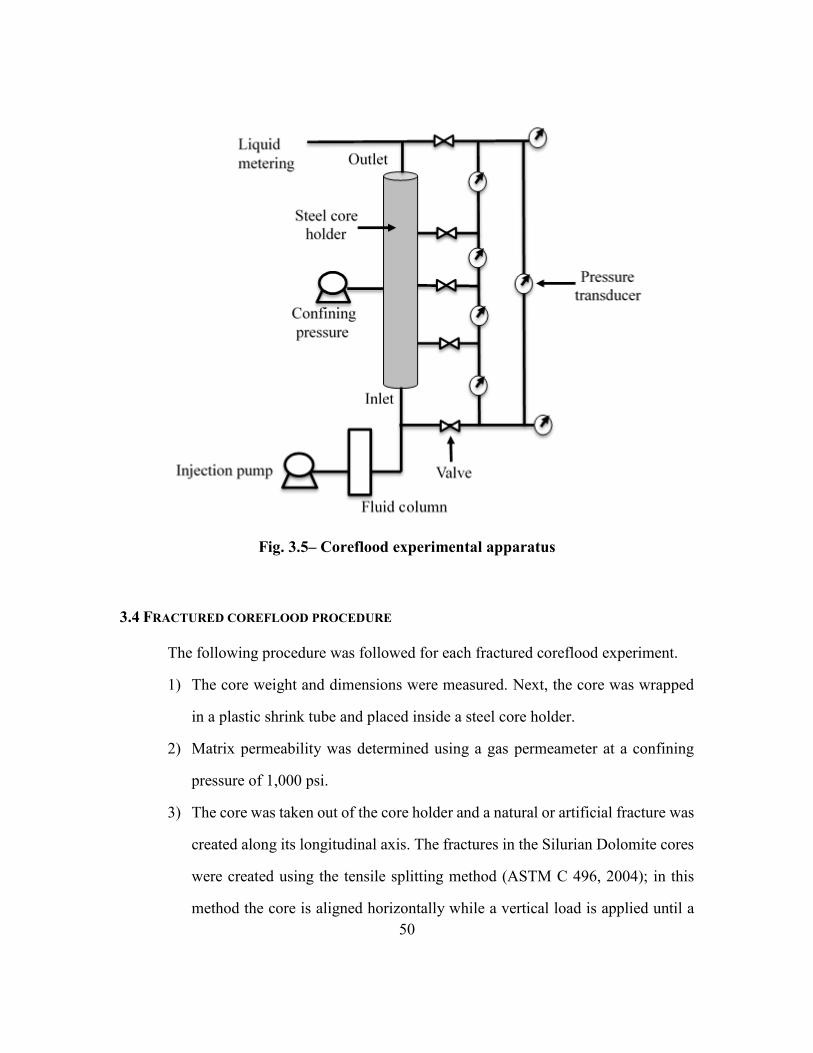
50
Fig. 3.5‒ Coreflood experimental apparatus
3.4 FRACTURED COREFLOOD PROCEDURE
The following procedure was followed for each fractured coreflood experiment.
1) The core weight and dimensions were measured. Next, the core was wrapped
in a plastic shrink tube and placed inside a steel core holder.
2) Matrix permeability was determined using a gas permeameter at a confining
pressure of 1,000 psi.
3) The core was taken out of the core holder and a natural or artificial fracture was
created along its longitudinal axis. The fractures in the Silurian Dolomite cores
were created using the tensile splitting method (ASTM C 496, 2004); in this
method the core is aligned horizontally while a vertical load is applied until a
51
crack is created. The fractures in the Texas Cream Limestone cores were created
artificially by cutting the cores in two halves using an electric saw (Fig. 3.6).
After fracturing, the core was placed back into the core holder. A Computerized
Tomography (CT) scanner was sometimes used to scan the cores before and
after fracturing.
4) The pore volume was determined by saturating the core with oil under vacuum;
the initial oil saturation, Soi= 1.
5) The fracture core was placed inside an oven at 78 °C and aged for seven days.
6) The fractured core was flooded with oil and the effective permeability was
determined. The fracture width and fracture permeability was calculated using
equations 2.18 and 2.19, respectively. The equivalent shear rate in the fracture
was calculated using equation 2.16.
7) The cores were waterflooded to zero oil cut at a rate of 0.3 cm3/min.
8) The cores were flooded with a surfactant solution at a rate of 0.01 cm3/min.
9) In some coreflood experiments, the viscosity of the surfactant solution was
increased by adding polymer or by increasing the salinity and additional
surfactant solution was injected at the same rate.
10) The effluent from the chemical flood was collected in 10 mL glass test tubes.
When present, emulsified oil was separated by increasing the temperature and
centrifuging the tubes.
Two non-fractured coreflood experiments were also performed for comparison
purposes. One experiment was conducted in a Silurian Dolomite and the other in a Texas
Cream Limestone core.
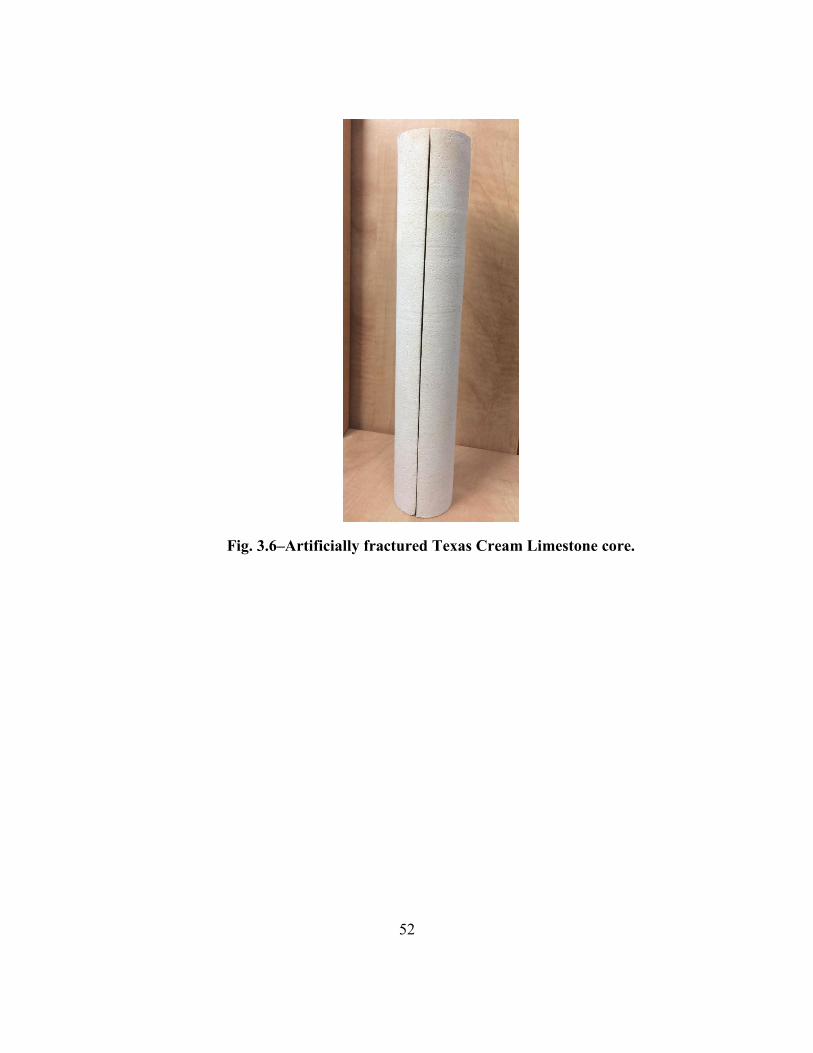
52
Fig. 3.6‒Artificially fractured Texas Cream Limestone core.
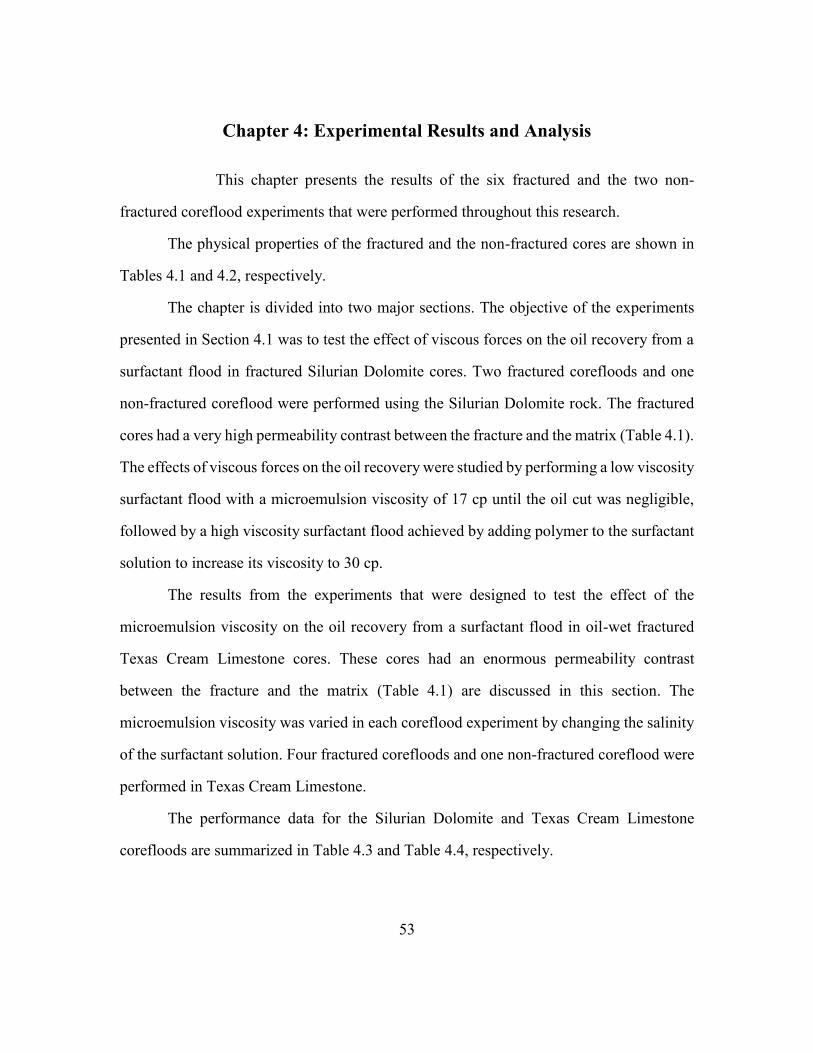
53
Chapter 4: Experimental Results and Analysis
This chapter presents the results of the six fractured and the two non-
fractured coreflood experiments that were performed throughout this research.
The physical properties of the fractured and the non-fractured cores are shown in
Tables 4.1 and 4.2, respectively.
The chapter is divided into two major sections. The objective of the experiments
presented in Section 4.1 was to test the effect of viscous forces on the oil recovery from a
surfactant flood in fractured Silurian Dolomite cores. Two fractured corefloods and one
non-fractured coreflood were performed using the Silurian Dolomite rock. The fractured
cores had a very high permeability contrast between the fracture and the matrix (Table 4.1).
The effects of viscous forces on the oil recovery were studied by performing a low viscosity
surfactant flood with a microemulsion viscosity of 17 cp until the oil cut was negligible,
followed by a high viscosity surfactant flood achieved by adding polymer to the surfactant
solution to increase its viscosity to 30 cp.
The results from the experiments that were designed to test the effect of the
microemulsion viscosity on the oil recovery from a surfactant flood in oil-wet fractured
Texas Cream Limestone cores. These cores had an enormous permeability contrast
between the fracture and the matrix (Table 4.1) are discussed in this section. The
microemulsion viscosity was varied in each coreflood experiment by changing the salinity
of the surfactant solution. Four fractured corefloods and one non-fractured coreflood were
performed in Texas Cream Limestone.
The performance data for the Silurian Dolomite and Texas Cream Limestone
corefloods are summarized in Table 4.3 and Table 4.4, respectively.
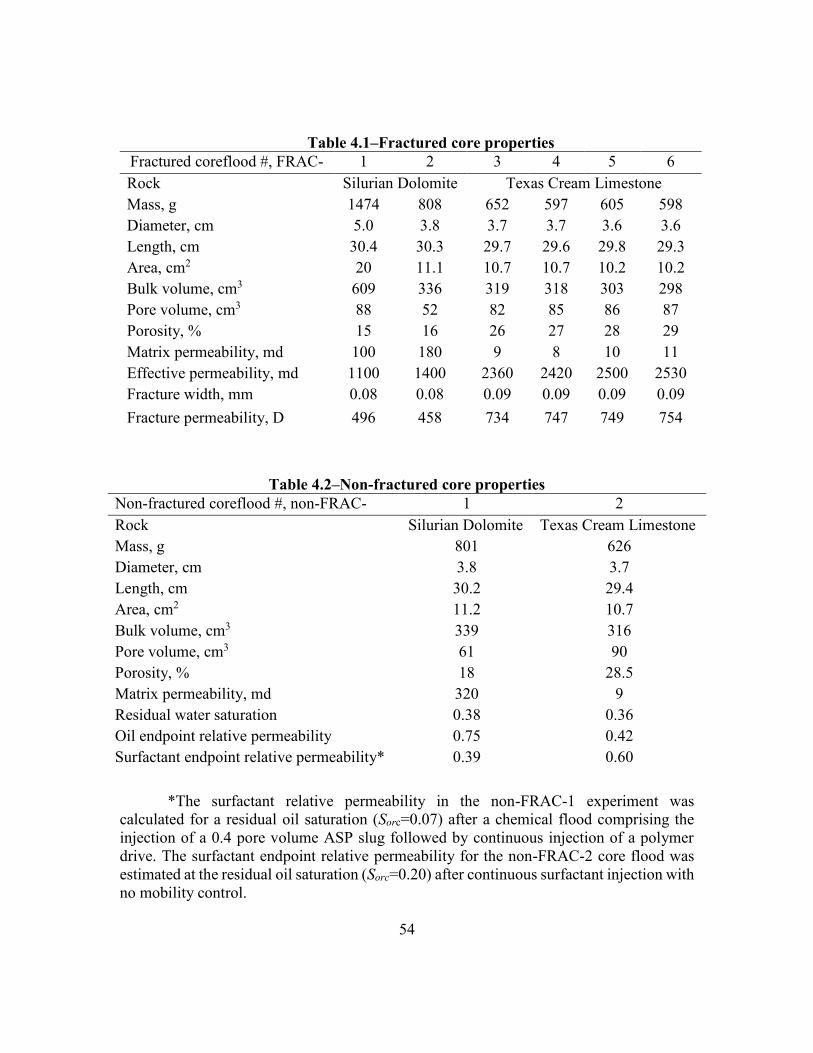
54
Table 4.1‒Fractured core properties
Fractured coreflood #, FRAC- 1 2 3 4 5 6
Rock Silurian Dolomite Texas Cream Limestone
Mass, g 1474 808 652 597 605 598
Diameter, cm 5.0 3.8 3.7 3.7 3.6 3.6
Length, cm 30.4 30.3 29.7 29.6 29.8 29.3
Area, cm2 20 11.1 10.7 10.7 10.2 10.2
Bulk volume, cm3 609 336 319 318 303 298
Pore volume, cm3 88 52 82 85 86 87
Porosity, % 15 16 26 27 28 29
Matrix permeability, md 100 180 9 8 10 11
Effective permeability, md 1100 1400 2360 2420 2500 2530
Fracture width, mm 0.08 0.08 0.09 0.09 0.09 0.09
Fracture permeability, D 496 458 734 747 749 754
Table 4.2‒Non-fractured core properties
Non-fractured coreflood #, non-FRAC- 1 2
Rock Silurian Dolomite Texas Cream Limestone
Mass, g 801 626
Diameter, cm 3.8 3.7
Length, cm 30.2 29.4
Area, cm2 11.2 10.7
Bulk volume, cm3 339 316
Pore volume, cm3 61 90
Porosity, % 18 28.5
Matrix permeability, md 320 9
Residual water saturation 0.38 0.36
Oil endpoint relative permeability 0.75 0.42
Surfactant endpoint relative permeability* 0.39 0.60
*The surfactant relative permeability in the non-FRAC-1 experiment was
calculated for a residual oil saturation (Sorc=0.07) after a chemical flood comprising the
injection of a 0.4 pore volume ASP slug followed by continuous injection of a polymer
drive. The surfactant endpoint relative permeability for the non-FRAC-2 core flood was
estimated at the residual oil saturation (Sorc=0.20) after continuous surfactant injection with
no mobility control.
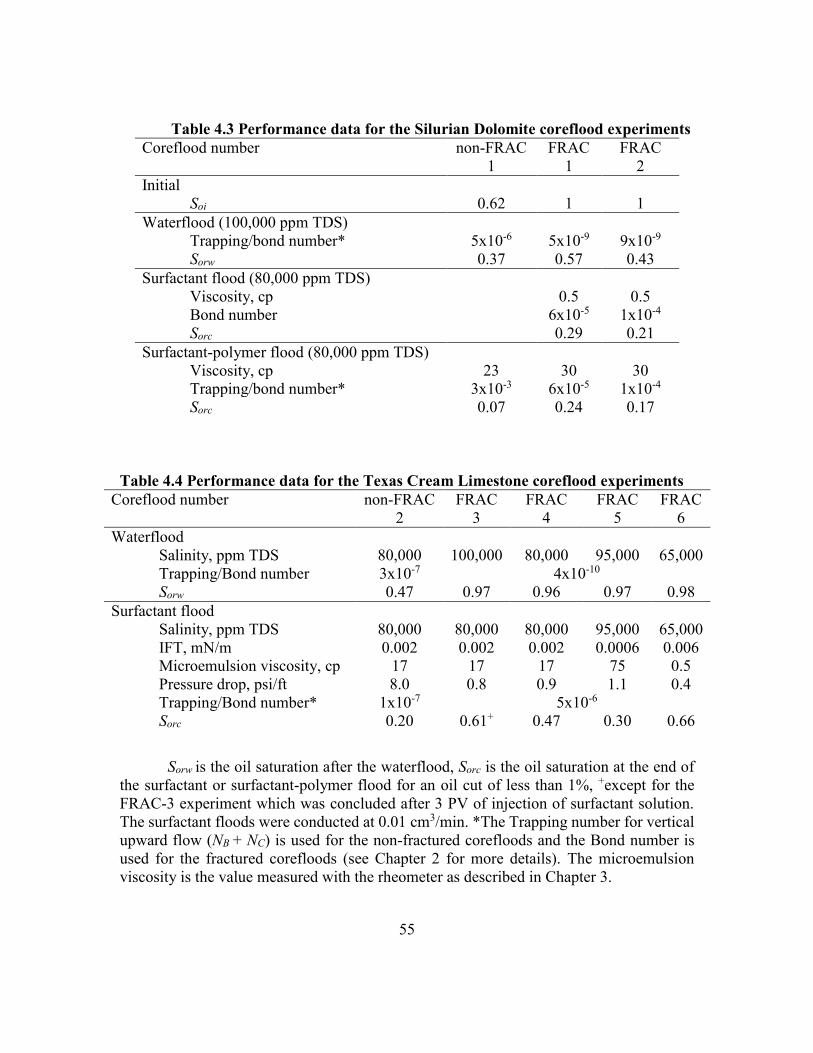
55
Table 4.3 Performance data for the Silurian Dolomite coreflood experiments
Coreflood number non-FRAC
1
FRAC
1
FRAC
2
Initial
Soi 0.62 1 1
Waterflood (100,000 ppm TDS)
Trapping/bond number* 5x10⁻⁶ 5x10⁻⁹ 9x10⁻⁹
Sorw 0.37 0.57 0.43
Surfactant flood (80,000 ppm TDS)
Viscosity, cp 0.5 0.5
Bond number 6x10⁻⁵ 1x10⁻⁴
Sorc 0.29 0.21
Surfactant-polymer flood (80,000 ppm TDS)
Viscosity, cp 23 30 30
Trapping/bond number* 3x10⁻³ 6x10⁻⁵ 1x10⁻⁴
Sorc 0.07 0.24 0.17
Table 4.4 Performance data for the Texas Cream Limestone coreflood experiments
Coreflood number non-FRAC
2
FRAC
3
FRAC
4
FRAC
5
FRAC
6
Waterflood
Salinity, ppm TDS 80,000 100,000 80,000 95,000 65,000
Trapping/Bond number 3x10⁻⁷ 4x10⁻¹⁰
Sorw 0.47 0.97 0.96 0.97 0.98
Surfactant flood
Salinity, ppm TDS 80,000 80,000 80,000 95,000 65,000
IFT, mN/m 0.002 0.002 0.002 0.0006 0.006
Microemulsion viscosity, cp 17 17 17 75 0.5
Pressure drop, psi/ft 8.0 0.8 0.9 1.1 0.4
Trapping/Bond number* 1x10⁻⁷ 5x10⁻⁶
Sorc 0.20 0.61+ 0.47 0.30 0.66
Sorw is the oil saturation after the waterflood, Sorc is the oil saturation at the end of
the surfactant or surfactant-polymer flood for an oil cut of less than 1%, +except for the
FRAC-3 experiment which was concluded after 3 PV of injection of surfactant solution.
The surfactant floods were conducted at 0.01 cm3/min. *The Trapping number for vertical
upward flow (NB + NC) is used for the non-fractured corefloods and the Bond number is
used for the fractured corefloods (see Chapter 2 for more details). The microemulsion
viscosity is the value measured with the rheometer as described in Chapter 3.
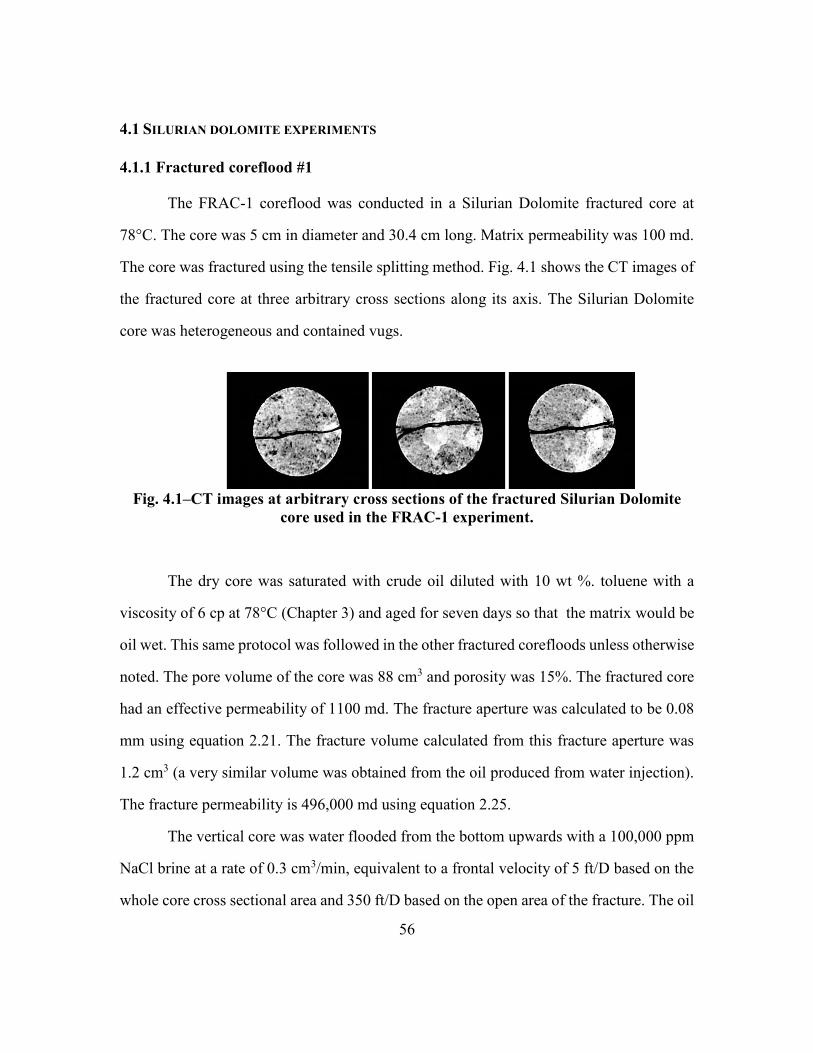
56
4.1 SILURIAN DOLOMITE EXPERIMENTS
4.1.1 Fractured coreflood #1
The FRAC-1 coreflood was conducted in a Silurian Dolomite fractured core at
78°C. The core was 5 cm in diameter and 30.4 cm long. Matrix permeability was 100 md.
The core was fractured using the tensile splitting method. Fig. 4.1 shows the CT images of
the fractured core at three arbitrary cross sections along its axis. The Silurian Dolomite
core was heterogeneous and contained vugs.
Fig. 4.1‒CT images at arbitrary cross sections of the fractured Silurian Dolomite
core used in the FRAC-1 experiment.
The dry core was saturated with crude oil diluted with 10 wt %. toluene with a
viscosity of 6 cp at 78°C (Chapter 3) and aged for seven days so that the matrix would be
oil wet. This same protocol was followed in the other fractured corefloods unless otherwise
noted. The pore volume of the core was 88 cm3 and porosity was 15%. The fractured core
had an effective permeability of 1100 md. The fracture aperture was calculated to be 0.08
mm using equation 2.21. The fracture volume calculated from this fracture aperture was
1.2 cm3 (a very similar volume was obtained from the oil produced from water injection).
The fracture permeability is 496,000 md using equation 2.25.
The vertical core was water flooded from the bottom upwards with a 100,000 ppm
NaCl brine at a rate of 0.3 cm3/min, equivalent to a frontal velocity of 5 ft/D based on the
whole core cross sectional area and 350 ft/D based on the open area of the fracture. The oil
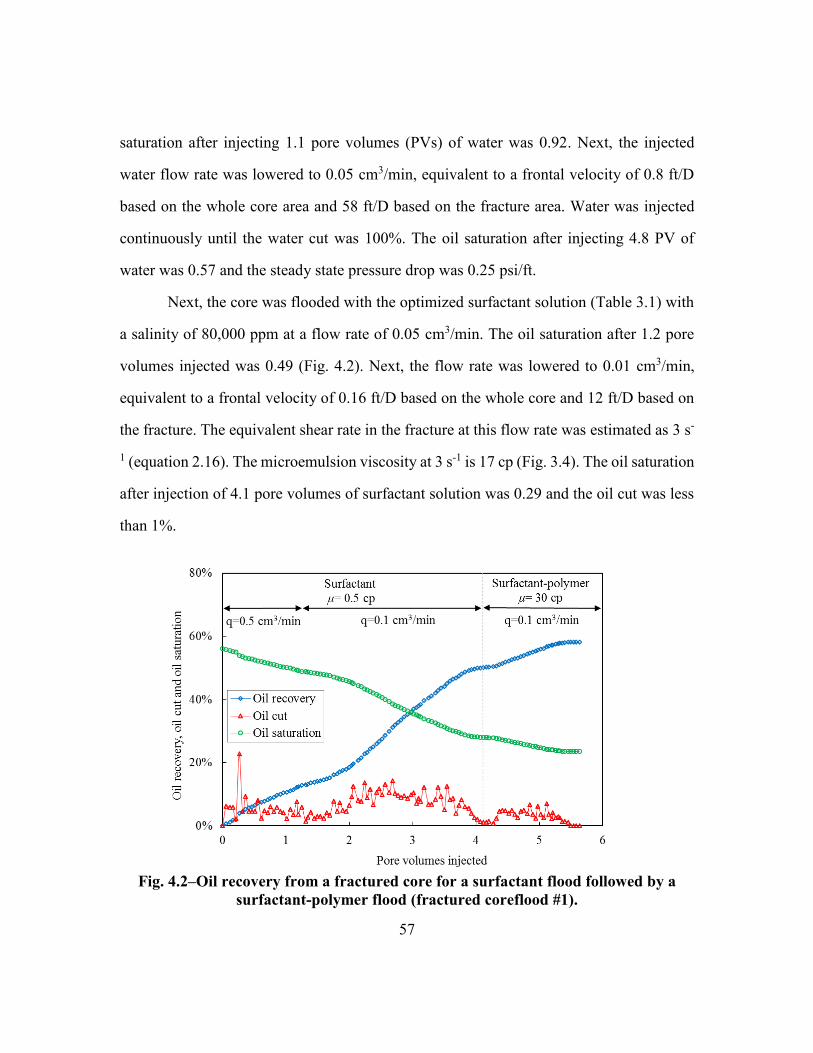
57
saturation after injecting 1.1 pore volumes (PVs) of water was 0.92. Next, the injected
water flow rate was lowered to 0.05 cm3/min, equivalent to a frontal velocity of 0.8 ft/D
based on the whole core area and 58 ft/D based on the fracture area. Water was injected
continuously until the water cut was 100%. The oil saturation after injecting 4.8 PV of
water was 0.57 and the steady state pressure drop was 0.25 psi/ft.
Next, the core was flooded with the optimized surfactant solution (Table 3.1) with
a salinity of 80,000 ppm at a flow rate of 0.05 cm3/min. The oil saturation after 1.2 pore
volumes injected was 0.49 (Fig. 4.2). Next, the flow rate was lowered to 0.01 cm3/min,
equivalent to a frontal velocity of 0.16 ft/D based on the whole core and 12 ft/D based on
the fracture. The equivalent shear rate in the fracture at this flow rate was estimated as 3 s-
1 (equation 2.16). The microemulsion viscosity at 3 s-1 is 17 cp (Fig. 3.4). The oil saturation
after injection of 4.1 pore volumes of surfactant solution was 0.29 and the oil cut was less
than 1%.
Fig. 4.2‒Oil recovery from a fractured core for a surfactant flood followed by a
surfactant-polymer flood (fractured coreflood #1).
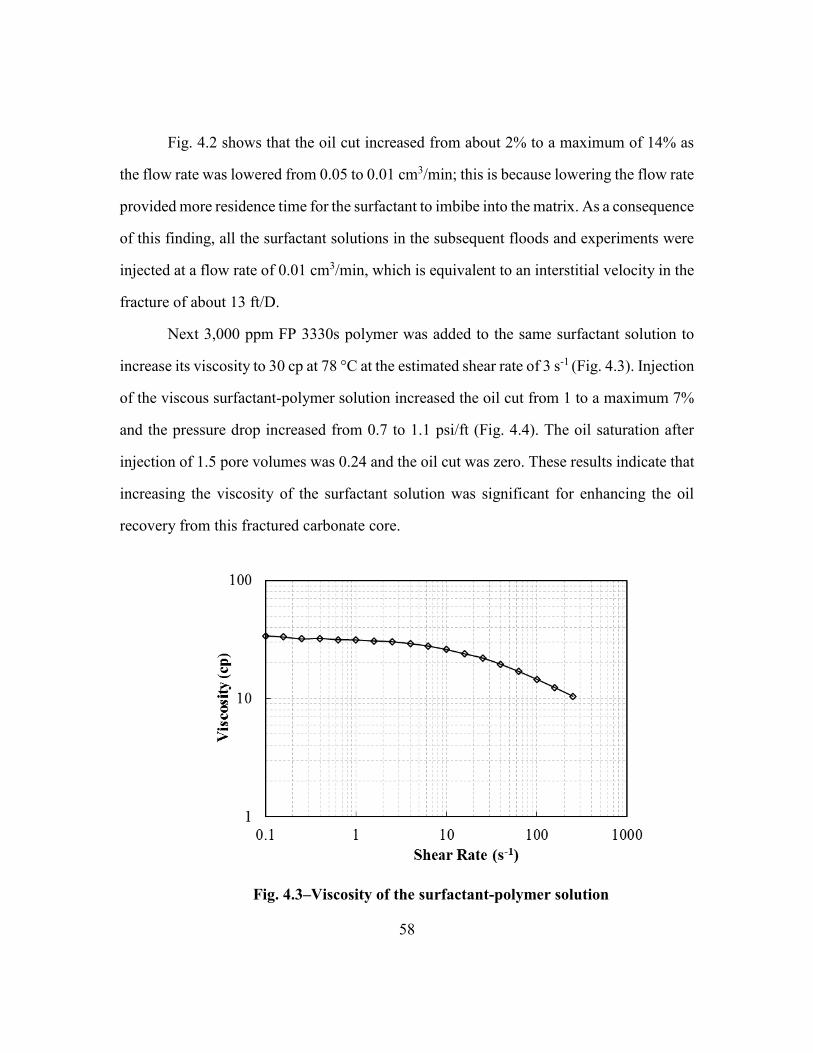
58
Fig. 4.2 shows that the oil cut increased from about 2% to a maximum of 14% as
the flow rate was lowered from 0.05 to 0.01 cm3/min; this is because lowering the flow rate
provided more residence time for the surfactant to imbibe into the matrix. As a consequence
of this finding, all the surfactant solutions in the subsequent floods and experiments were
injected at a flow rate of 0.01 cm3/min, which is equivalent to an interstitial velocity in the
fracture of about 13 ft/D.
Next 3,000 ppm FP 3330s polymer was added to the same surfactant solution to
increase its viscosity to 30 cp at 78 °C at the estimated shear rate of 3 s-1 (Fig. 4.3). Injection
of the viscous surfactant-polymer solution increased the oil cut from 1 to a maximum 7%
and the pressure drop increased from 0.7 to 1.1 psi/ft (Fig. 4.4). The oil saturation after
injection of 1.5 pore volumes was 0.24 and the oil cut was zero. These results indicate that
increasing the viscosity of the surfactant solution was significant for enhancing the oil
recovery from this fractured carbonate core.
Fig. 4.3‒Viscosity of the surfactant-polymer solution
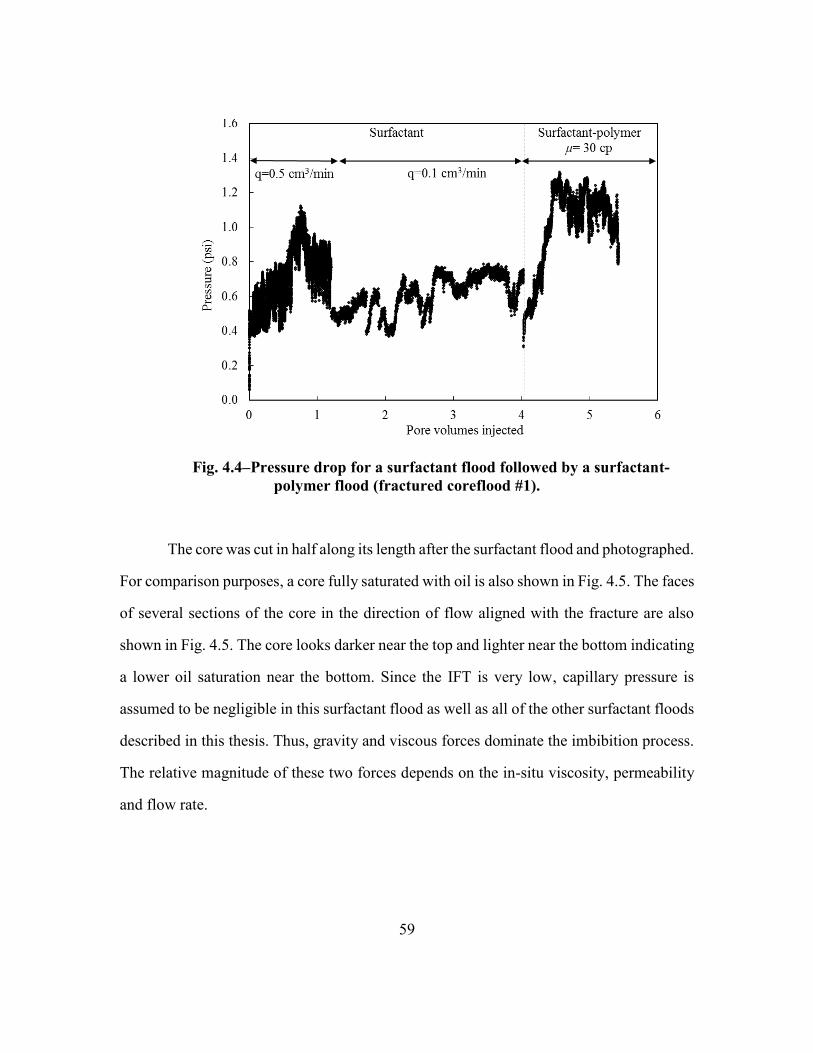
59
Fig. 4.4‒Pressure drop for a surfactant flood followed by a surfactant-
polymer flood (fractured coreflood #1).
The core was cut in half along its length after the surfactant flood and photographed.
For comparison purposes, a core fully saturated with oil is also shown in Fig. 4.5. The faces
of several sections of the core in the direction of flow aligned with the fracture are also
shown in Fig. 4.5. The core looks darker near the top and lighter near the bottom indicating
a lower oil saturation near the bottom. Since the IFT is very low, capillary pressure is
assumed to be negligible in this surfactant flood as well as all of the other surfactant floods
described in this thesis. Thus, gravity and viscous forces dominate the imbibition process.
The relative magnitude of these two forces depends on the in-situ viscosity, permeability
and flow rate.
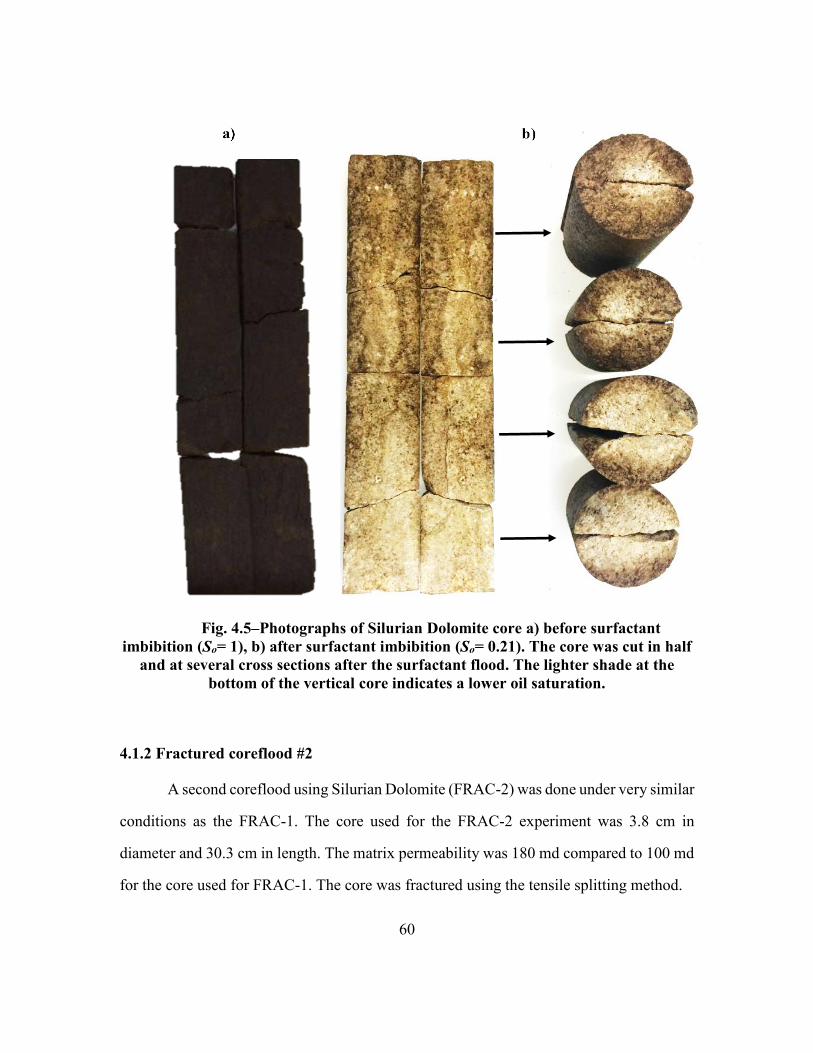
60
Fig. 4.5‒Photographs of Silurian Dolomite core a) before surfactant
imbibition (So= 1), b) after surfactant imbibition (So= 0.21). The core was cut in half
and at several cross sections after the surfactant flood. The lighter shade at the
bottom of the vertical core indicates a lower oil saturation.
4.1.2 Fractured coreflood #2
A second coreflood using Silurian Dolomite (FRAC-2) was done under very similar
conditions as the FRAC-1. The core used for the FRAC-2 experiment was 3.8 cm in
diameter and 30.3 cm in length. The matrix permeability was 180 md compared to 100 md
for the core used for FRAC-1. The core was fractured using the tensile splitting method.
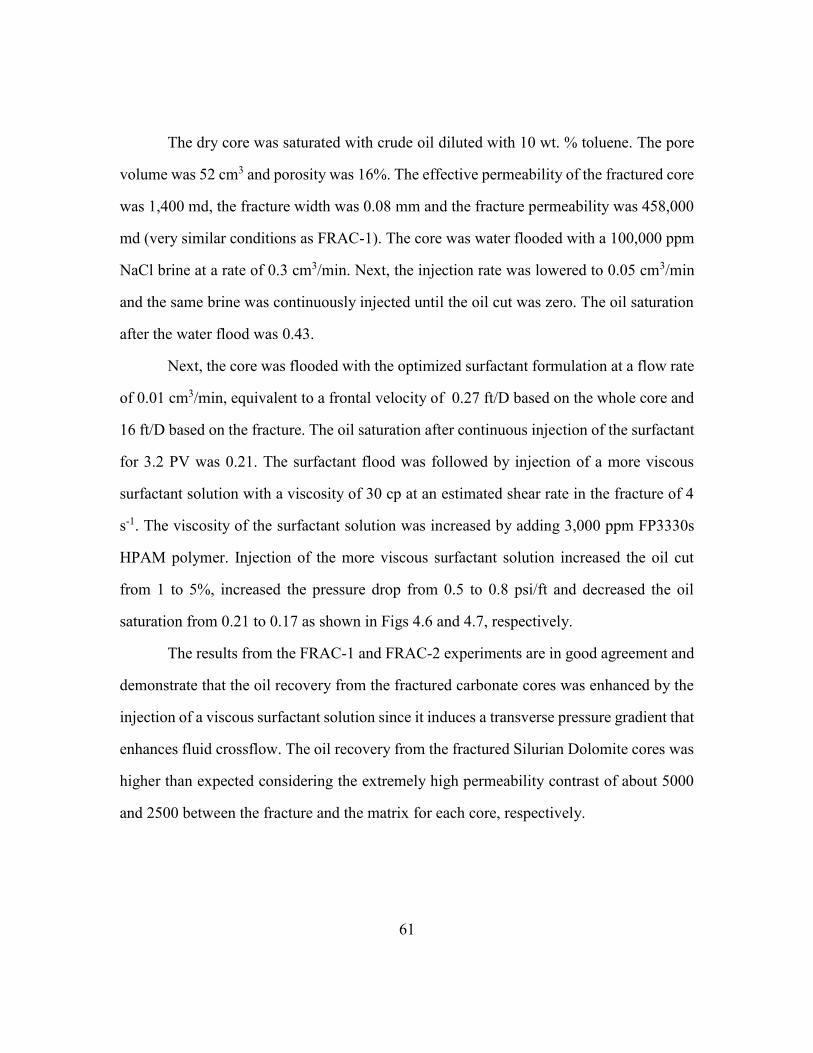
61
The dry core was saturated with crude oil diluted with 10 wt. % toluene. The pore
volume was 52 cm3 and porosity was 16%. The effective permeability of the fractured core
was 1,400 md, the fracture width was 0.08 mm and the fracture permeability was 458,000
md (very similar conditions as FRAC-1). The core was water flooded with a 100,000 ppm
NaCl brine at a rate of 0.3 cm3/min. Next, the injection rate was lowered to 0.05 cm3/min
and the same brine was continuously injected until the oil cut was zero. The oil saturation
after the water flood was 0.43.
Next, the core was flooded with the optimized surfactant formulation at a flow rate
of 0.01 cm3/min, equivalent to a frontal velocity of 0.27 ft/D based on the whole core and
16 ft/D based on the fracture. The oil saturation after continuous injection of the surfactant
for 3.2 PV was 0.21. The surfactant flood was followed by injection of a more viscous
surfactant solution with a viscosity of 30 cp at an estimated shear rate in the fracture of 4
s-1. The viscosity of the surfactant solution was increased by adding 3,000 ppm FP3330s
HPAM polymer. Injection of the more viscous surfactant solution increased the oil cut
from 1 to 5%, increased the pressure drop from 0.5 to 0.8 psi/ft and decreased the oil
saturation from 0.21 to 0.17 as shown in Figs 4.6 and 4.7, respectively.
The results from the FRAC-1 and FRAC-2 experiments are in good agreement and
demonstrate that the oil recovery from the fractured carbonate cores was enhanced by the
injection of a viscous surfactant solution since it induces a transverse pressure gradient that
enhances fluid crossflow. The oil recovery from the fractured Silurian Dolomite cores was
higher than expected considering the extremely high permeability contrast of about 5000
and 2500 between the fracture and the matrix for each core, respectively.
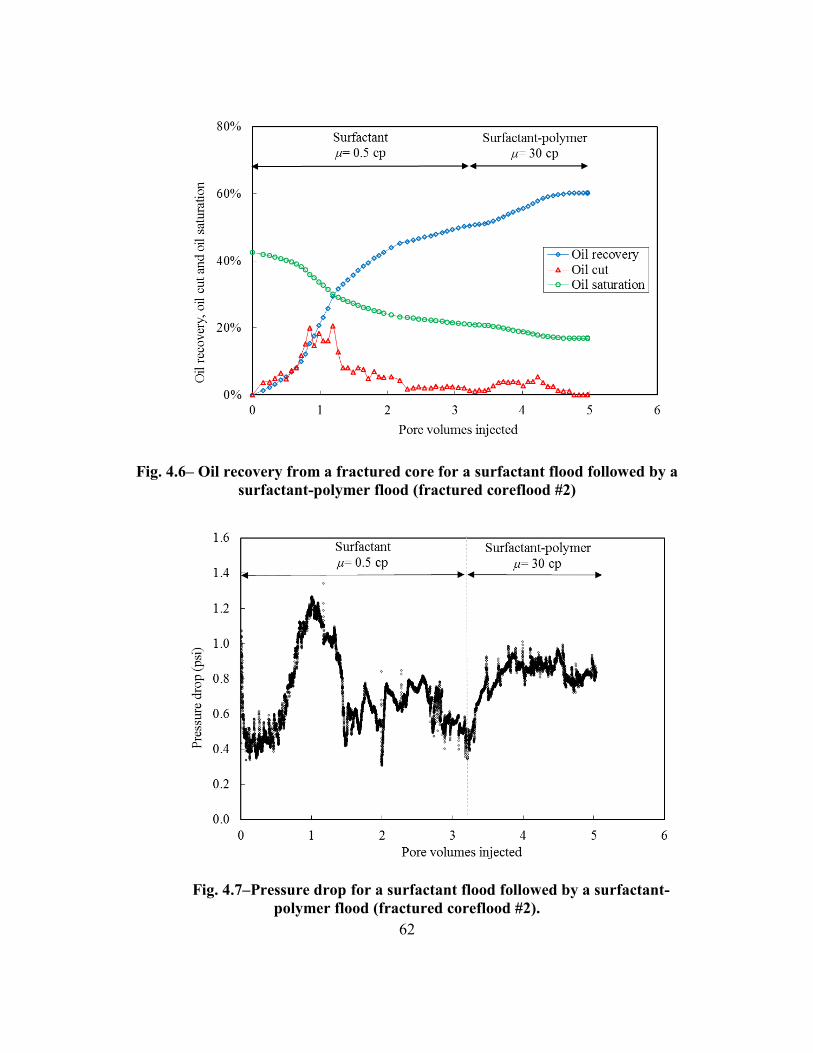
62
Fig. 4.6‒ Oil recovery from a fractured core for a surfactant flood followed by a
surfactant-polymer flood (fractured coreflood #2)
Fig. 4.7‒Pressure drop for a surfactant flood followed by a surfactant-
polymer flood (fractured coreflood #2).
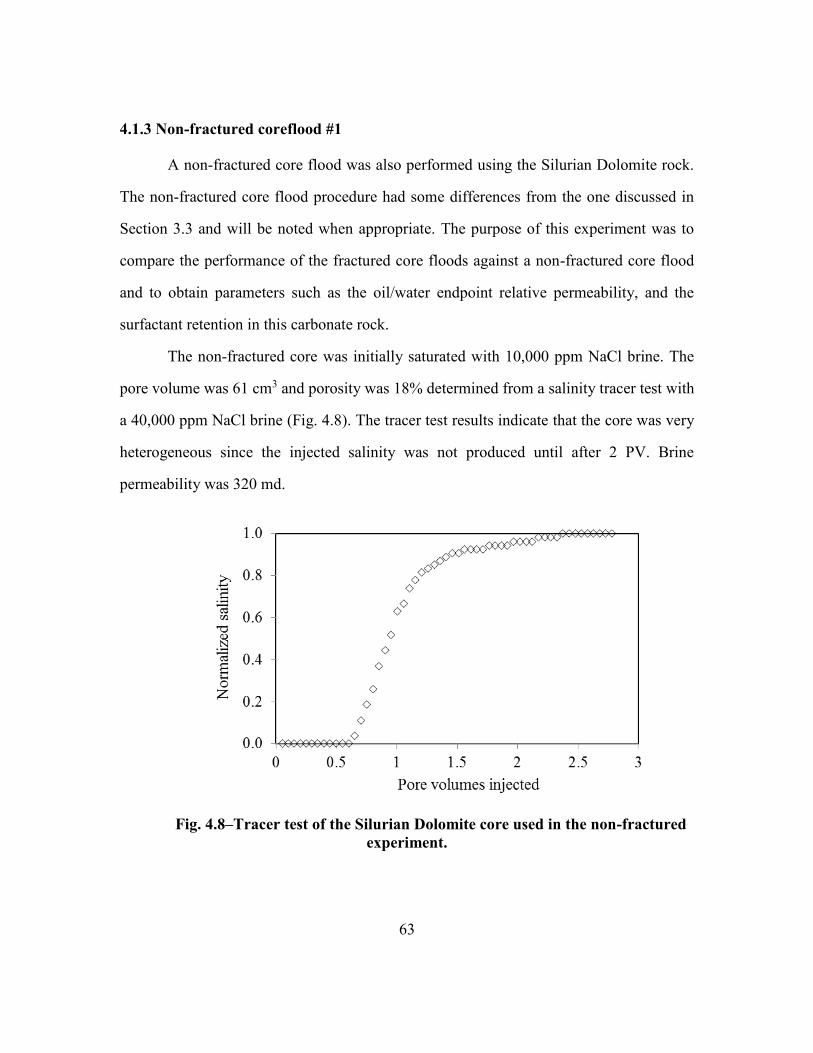
63
4.1.3 Non-fractured coreflood #1
A non-fractured core flood was also performed using the Silurian Dolomite rock.
The non-fractured core flood procedure had some differences from the one discussed in
Section 3.3 and will be noted when appropriate. The purpose of this experiment was to
compare the performance of the fractured core floods against a non-fractured core flood
and to obtain parameters such as the oil/water endpoint relative permeability, and the
surfactant retention in this carbonate rock.
The non-fractured core was initially saturated with 10,000 ppm NaCl brine. The
pore volume was 61 cm3 and porosity was 18% determined from a salinity tracer test with
a 40,000 ppm NaCl brine (Fig. 4.8). The tracer test results indicate that the core was very
heterogeneous since the injected salinity was not produced until after 2 PV. Brine
permeability was 320 md.
Fig. 4.8‒Tracer test of the Silurian Dolomite core used in the non-fractured
experiment.
64
The core was flooded with the reservoir oil diluted with 10 wt. % toluene. The
initial oil saturation was 0.62 and the endpoint oil relative permeability was 0.75.
Next, the core was water flooded with a 100,000 ppm NaCl brine at an interstitial
velocity of 10 ft/D. The steady state pressure drop was 14 psi/ft. The residual oil saturation
after the waterflood was 0.37 and the water endpoint relative permeability was 0.04.
A surfactant flood using polymer for mobility control was designed to achieve a
stable displacement and to satisfy retention. The idea was to observe the performance of a
conventional ASP flood in a non-fractured core to use as a reference for the more
complicated fractured corefloods. Corey type relative permeability curves were used to
calculate the total relative mobility curve 𝜆T (equation 4.1). The measured endpoint relative
permeability and viscosity values were used for the calculation. The Corey exponents were
assumed to be 2.0 for both water and oil.
1
𝜆𝑇=
𝑘𝑟𝑤
𝜇𝑤+
𝑘𝑟𝑜
𝜇𝑜, (4.1)
The required viscosity for a stable displacement was estimated to be 21 cp.
The pore volumes of surfactant solution required to satisfy retention was estimated
by calculating the retardation factor using the following equation.
𝐷𝑠 =(1 − ∅)𝜌𝑠𝜔4𝑠
∅𝜌4𝜔41,
(4.2)
where Ds is the retardation factor ω is the mass concentration and the subscripts 1,4 and s
stand for the aqueous phase, surfactant and solid respectively. A surfactant retention of
0.20 mg/g was assumed based on a similar ASP flood performed by this author.
𝐷𝑠 =(1 − 0.18) (2.84
gcm3) (0.0002
gg)
(0.18) (1g
cm3) (0.01gg)
= 0.26
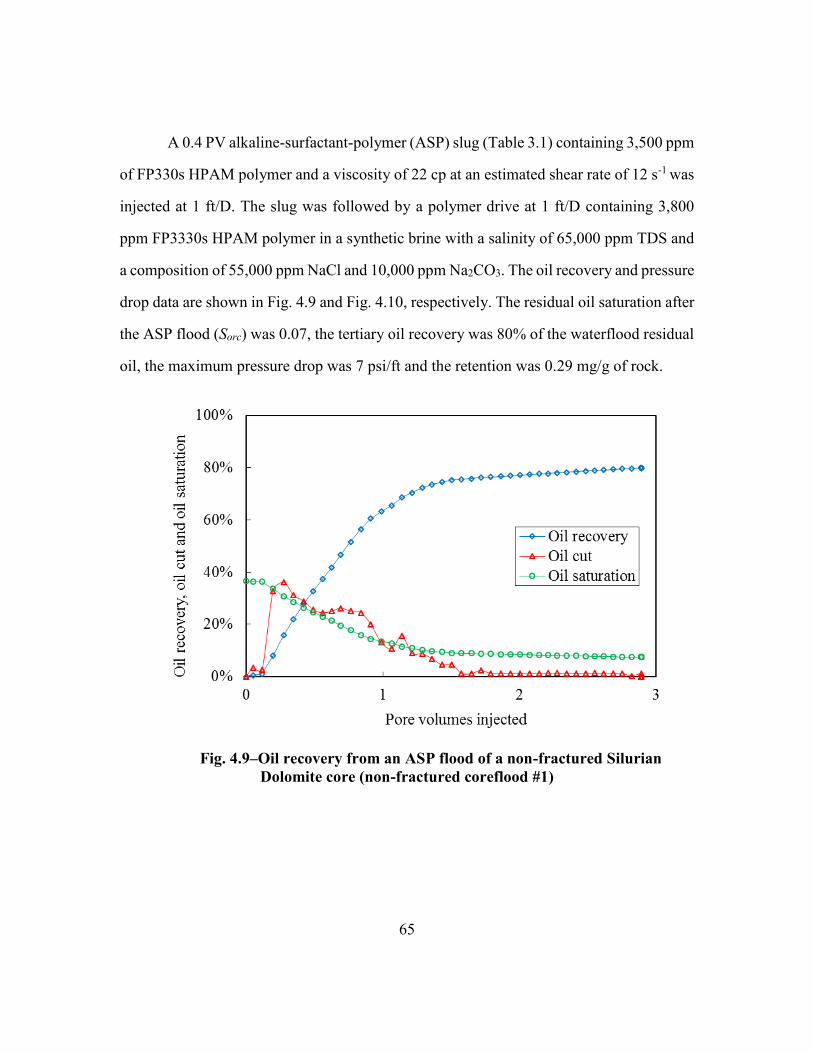
65
A 0.4 PV alkaline-surfactant-polymer (ASP) slug (Table 3.1) containing 3,500 ppm
of FP330s HPAM polymer and a viscosity of 22 cp at an estimated shear rate of 12 s-1 was
injected at 1 ft/D. The slug was followed by a polymer drive at 1 ft/D containing 3,800
ppm FP3330s HPAM polymer in a synthetic brine with a salinity of 65,000 ppm TDS and
a composition of 55,000 ppm NaCl and 10,000 ppm Na2CO3. The oil recovery and pressure
drop data are shown in Fig. 4.9 and Fig. 4.10, respectively. The residual oil saturation after
the ASP flood (Sorc) was 0.07, the tertiary oil recovery was 80% of the waterflood residual
oil, the maximum pressure drop was 7 psi/ft and the retention was 0.29 mg/g of rock.
Fig. 4.9‒Oil recovery from an ASP flood of a non-fractured Silurian
Dolomite core (non-fractured coreflood #1)
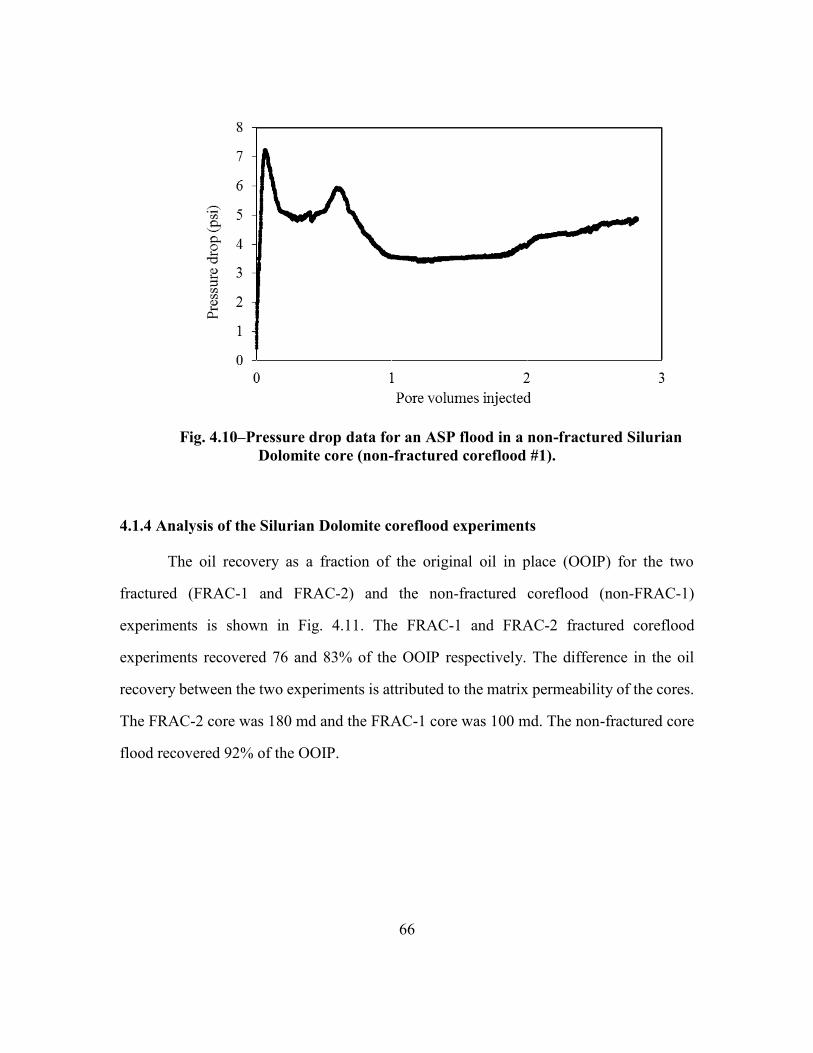
66
Fig. 4.10‒Pressure drop data for an ASP flood in a non-fractured Silurian
Dolomite core (non-fractured coreflood #1).
4.1.4 Analysis of the Silurian Dolomite coreflood experiments
The oil recovery as a fraction of the original oil in place (OOIP) for the two
fractured (FRAC-1 and FRAC-2) and the non-fractured coreflood (non-FRAC-1)
experiments is shown in Fig. 4.11. The FRAC-1 and FRAC-2 fractured coreflood
experiments recovered 76 and 83% of the OOIP respectively. The difference in the oil
recovery between the two experiments is attributed to the matrix permeability of the cores.
The FRAC-2 core was 180 md and the FRAC-1 core was 100 md. The non-fractured core
flood recovered 92% of the OOIP.
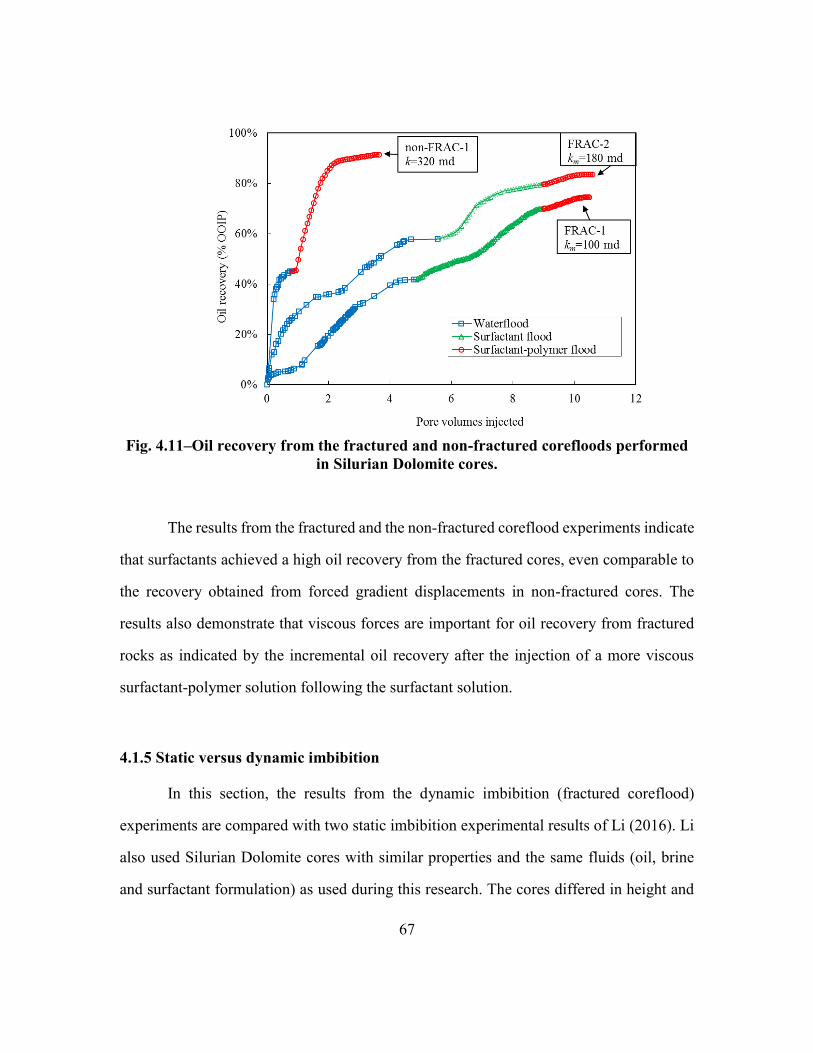
67
Fig. 4.11‒Oil recovery from the fractured and non-fractured corefloods performed
in Silurian Dolomite cores.
The results from the fractured and the non-fractured coreflood experiments indicate
that surfactants achieved a high oil recovery from the fractured cores, even comparable to
the recovery obtained from forced gradient displacements in non-fractured cores. The
results also demonstrate that viscous forces are important for oil recovery from fractured
rocks as indicated by the incremental oil recovery after the injection of a more viscous
surfactant-polymer solution following the surfactant solution.
4.1.5 Static versus dynamic imbibition
In this section, the results from the dynamic imbibition (fractured coreflood)
experiments are compared with two static imbibition experimental results of Li (2016). Li
also used Silurian Dolomite cores with similar properties and the same fluids (oil, brine
and surfactant formulation) as used during this research. The cores differed in height and
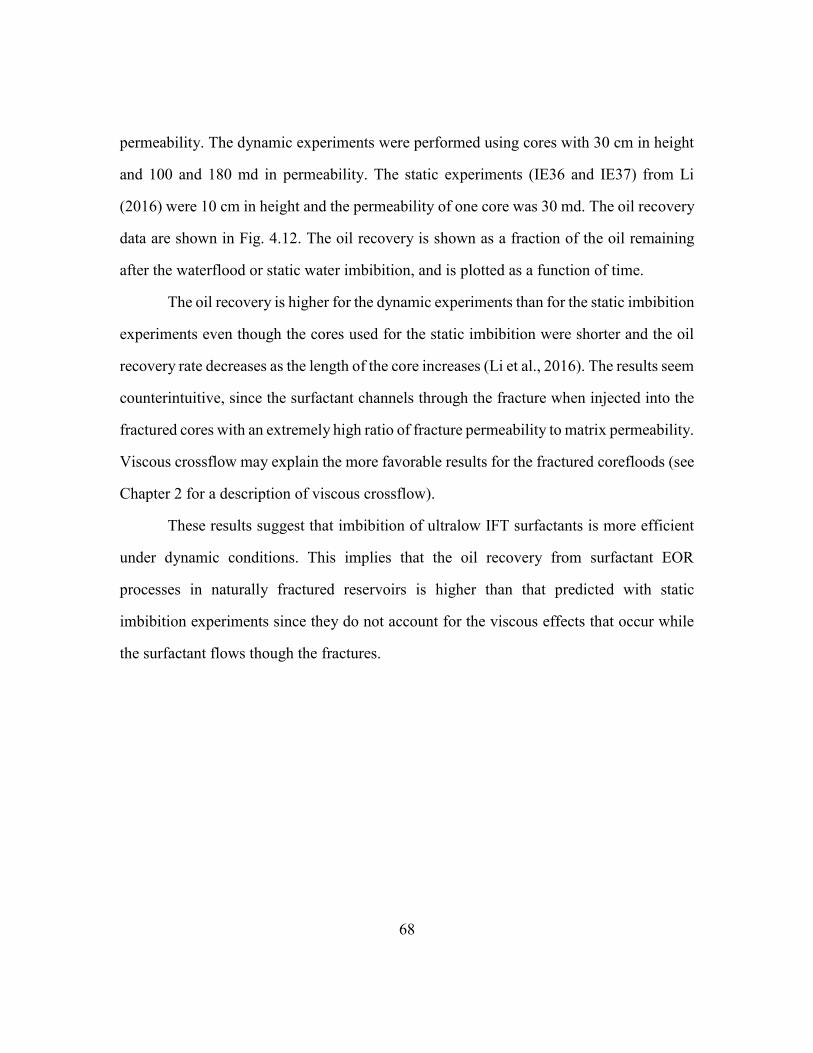
68
permeability. The dynamic experiments were performed using cores with 30 cm in height
and 100 and 180 md in permeability. The static experiments (IE36 and IE37) from Li
(2016) were 10 cm in height and the permeability of one core was 30 md. The oil recovery
data are shown in Fig. 4.12. The oil recovery is shown as a fraction of the oil remaining
after the waterflood or static water imbibition, and is plotted as a function of time.
The oil recovery is higher for the dynamic experiments than for the static imbibition
experiments even though the cores used for the static imbibition were shorter and the oil
recovery rate decreases as the length of the core increases (Li et al., 2016). The results seem
counterintuitive, since the surfactant channels through the fracture when injected into the
fractured cores with an extremely high ratio of fracture permeability to matrix permeability.
Viscous crossflow may explain the more favorable results for the fractured corefloods (see
Chapter 2 for a description of viscous crossflow).
These results suggest that imbibition of ultralow IFT surfactants is more efficient
under dynamic conditions. This implies that the oil recovery from surfactant EOR
processes in naturally fractured reservoirs is higher than that predicted with static
imbibition experiments since they do not account for the viscous effects that occur while
the surfactant flows though the fractures.
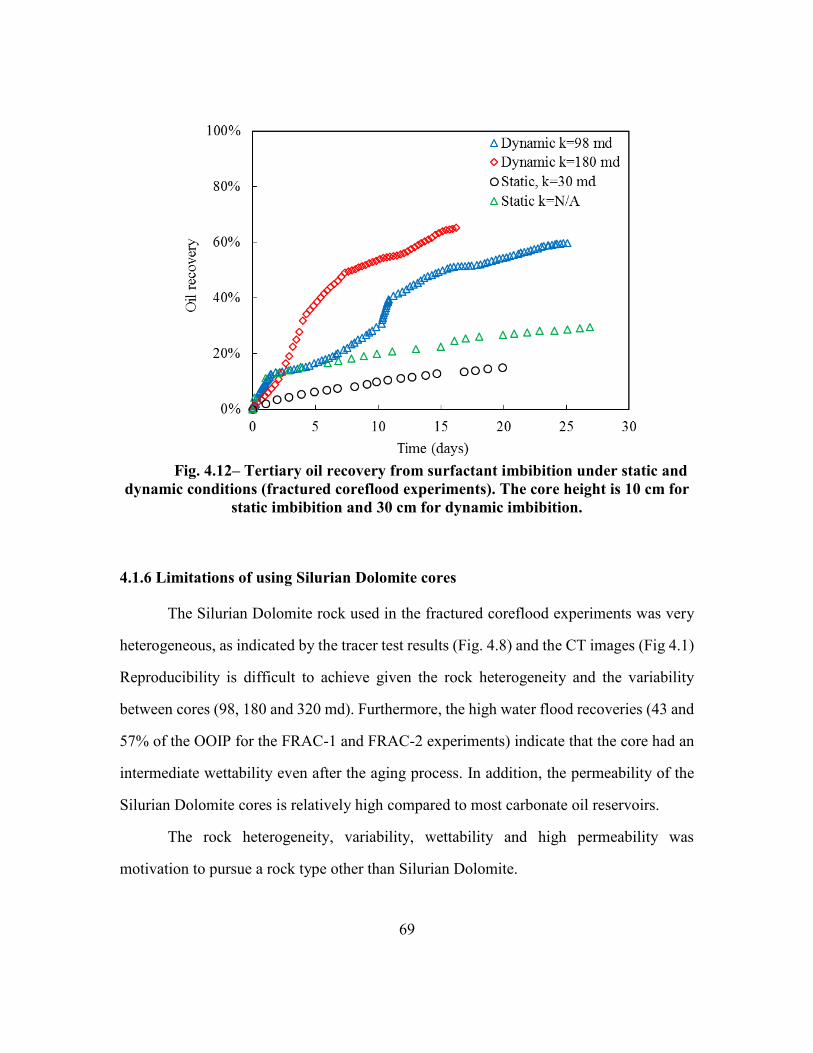
69
Fig. 4.12‒ Tertiary oil recovery from surfactant imbibition under static and
dynamic conditions (fractured coreflood experiments). The core height is 10 cm for
static imbibition and 30 cm for dynamic imbibition.
4.1.6 Limitations of using Silurian Dolomite cores
The Silurian Dolomite rock used in the fractured coreflood experiments was very
heterogeneous, as indicated by the tracer test results (Fig. 4.8) and the CT images (Fig 4.1)
Reproducibility is difficult to achieve given the rock heterogeneity and the variability
between cores (98, 180 and 320 md). Furthermore, the high water flood recoveries (43 and
57% of the OOIP for the FRAC-1 and FRAC-2 experiments) indicate that the core had an
intermediate wettability even after the aging process. In addition, the permeability of the
Silurian Dolomite cores is relatively high compared to most carbonate oil reservoirs.
The rock heterogeneity, variability, wettability and high permeability was
motivation to pursue a rock type other than Silurian Dolomite.
70
4.2 TEXAS CREAM LIMESTONE EXPERIMENTS
The objective of the experiments presented in this section was to test the effect of
the microemulsion viscosity on the oil recovery after a series of surfactant floods using
fractured Texas Cream Limestone cores. Texas Cream Limestone was selected since it is
relatively homogeneous (compared to other carbonates), has a typical permeability of 10
md, and after aging in oil for a few days less than 10% of the oil was recovered after several
weeks of brine imbibition, which indicates it was oil wet.
The Texas Cream Limestone cores were fractured artificially by cutting the cores
in two halves using an electric saw (Fig. 3.6). The artificial fractures provided more
reproducibility than the fractures created with the tensile splitting method. Dead oil with a
viscosity of 12 cp at 78 °C was used in all the Texas Cream Limestone experiments. The
PV and porosity were determined from the initial oil saturation. The fracture aperture was
controlled by adjusting the confining pressure that was applied to the core. The fracture
aperture is the most critical parameter affecting the effective permeability of the core
(which accounts for the fracture and matrix permeability and the core dimensions). All the
experiments performed in Texas Cream Limestone were designed to have an effective
permeability of about 2500 md, in agreement with the permeability that has been in
naturally fractured reservoirs such as the giant Cantarell oil field (Rodriguez et al., 2004).
The effective permeability was calculated from Darcy’s law while the core was oil flooded
and the fracture aperture was calculated by rearranging equation 2.21 as follows:
𝑏 = (3𝜋𝐷𝑘𝑒)1/3. (4.3)
The permeability of the fracture was determined from the equation for single-phase
flow through parallel layers (equation 2.25)
𝑘𝑓 =𝐴𝑇𝑘𝑒 − 2𝐴𝑚𝑘𝑚
𝐴𝑓. (4.4)
71
4.2.1 Fractured coreflood #3
The purpose of the FRAC-3 was to test the effect of the injection of a surfactant
solution at optimum salinity (Table 3.1) on the oil recovery from a fractured Texas Cream
Limestone core. The surfactant solution at optimum salinity was equilibrated with 30%
volume fraction oil at 78 °C and the viscosity of the middle phase microemulsion measured
after separating it from the excess oil and brine. The microemulsion viscosity data are
shown in Fig. 3.4. The microemulsion viscosity at the estimated shear rate in the fracture
of 3 s-1 is 17 cp.
The core was 3.7 cm in diameter and 29.7 cm long. The matrix permeability to air
was measured using a gas permeameter at 1000 psi and then used to determine the liquid
permeability from the Klinkenberg equation. The matrix permeability was 9 md.
The dry core was cut into two halves to create a fracture. Next the fractured core
was put into the core holder and saturated with dead oil with a viscosity of 12 cp at 78 °C
and aged for seven days so that the matrix would be oil wet. The core had a pore volume
of 82 cm3 and a porosity of 26%.
The fracture aperture was adjusted by increasing the confining pressure. The
effective oil permeability was 2360 md at 1200 psi confining pressure. The fracture width
was determined to be 0.09 mm and the fracture permeability was calculated to be 734,000
md.
The core was waterflooded with a 100,000 ppm NaCl brine at a rate of 0.3 cm3/min,
equivalent to a frontal velocity of 5 ft/D based on the whole core cross sectional area and
410 ft/D based on the fracture. The volume of oil recovered from the waterflood (2 cm3)
was similar to the fracture volume calculated from the effective permeability of the core
during the oil flood (1 cm3). The oil saturation after the water flood was 0.97 and the
pressure gradient at the end of the flood was 0.2 psi/ft.
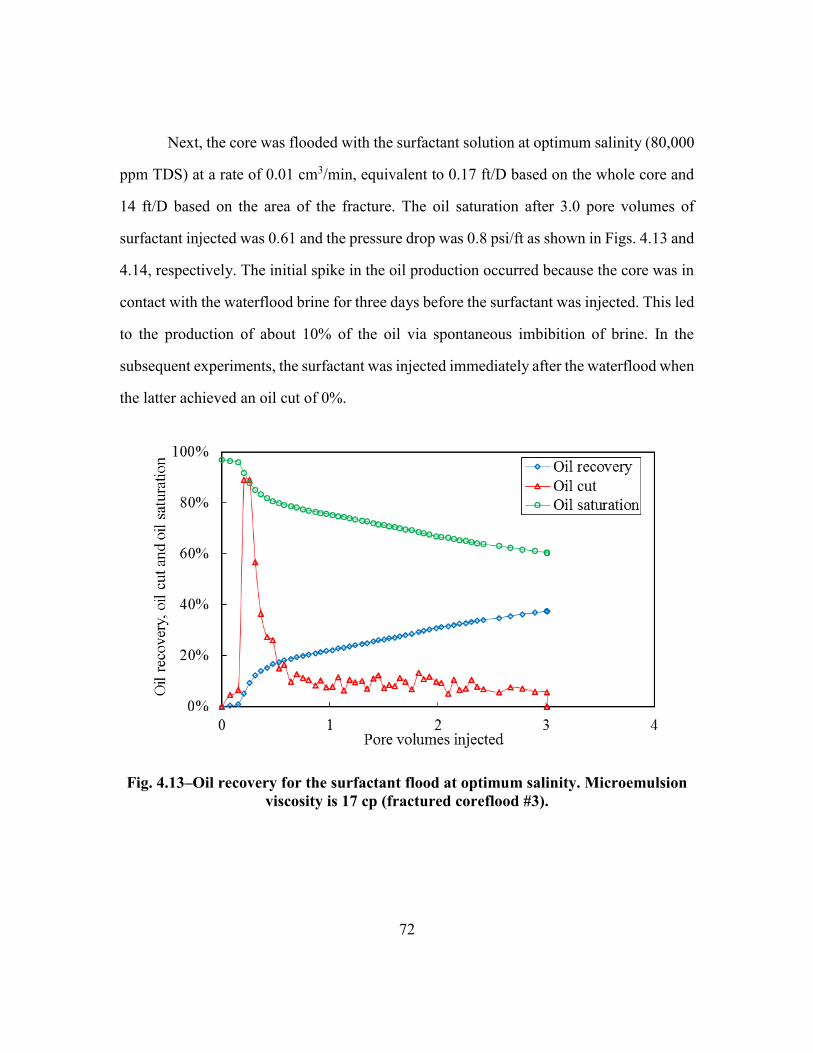
72
Next, the core was flooded with the surfactant solution at optimum salinity (80,000
ppm TDS) at a rate of 0.01 cm3/min, equivalent to 0.17 ft/D based on the whole core and
14 ft/D based on the area of the fracture. The oil saturation after 3.0 pore volumes of
surfactant injected was 0.61 and the pressure drop was 0.8 psi/ft as shown in Figs. 4.13 and
4.14, respectively. The initial spike in the oil production occurred because the core was in
contact with the waterflood brine for three days before the surfactant was injected. This led
to the production of about 10% of the oil via spontaneous imbibition of brine. In the
subsequent experiments, the surfactant was injected immediately after the waterflood when
the latter achieved an oil cut of 0%.
Fig. 4.13‒Oil recovery for the surfactant flood at optimum salinity. Microemulsion
viscosity is 17 cp (fractured coreflood #3).
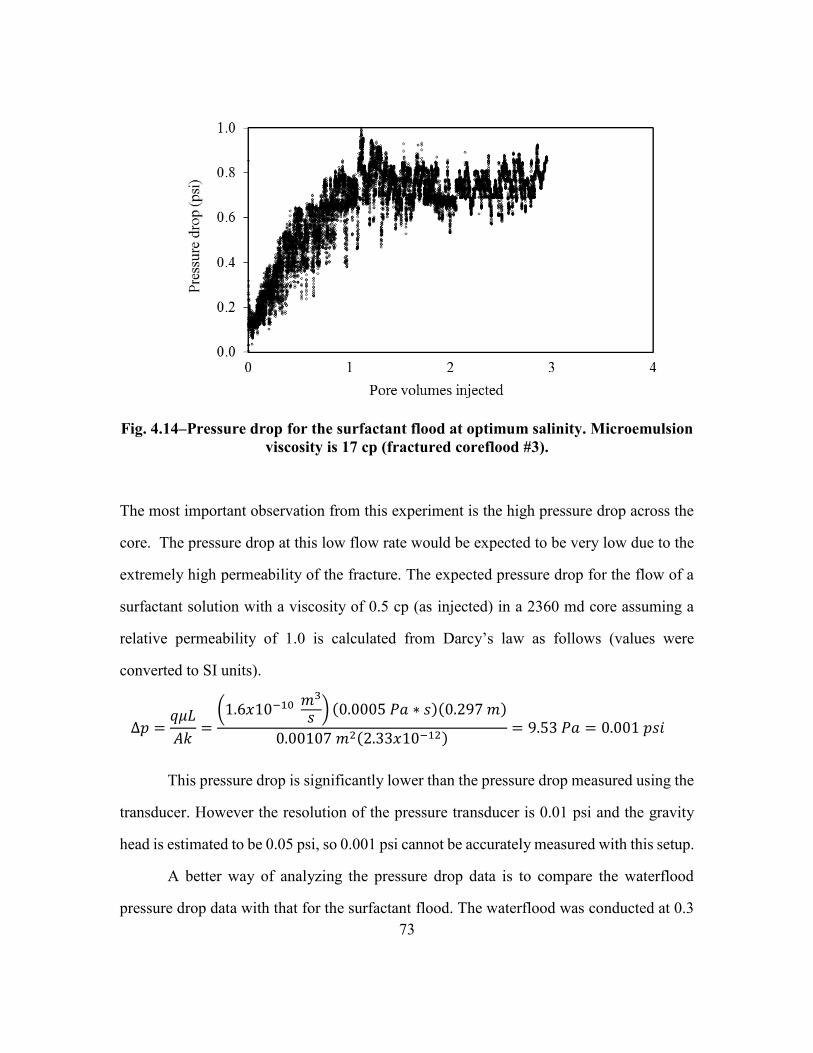
73
Fig. 4.14‒Pressure drop for the surfactant flood at optimum salinity. Microemulsion
viscosity is 17 cp (fractured coreflood #3).
The most important observation from this experiment is the high pressure drop across the
core. The pressure drop at this low flow rate would be expected to be very low due to the
extremely high permeability of the fracture. The expected pressure drop for the flow of a
surfactant solution with a viscosity of 0.5 cp (as injected) in a 2360 md core assuming a
relative permeability of 1.0 is calculated from Darcy’s law as follows (values were
converted to SI units).
∆𝑝 =𝑞𝜇𝐿
𝐴𝑘=
(1.6𝑥10−10 𝑚3
𝑠 ) (0.0005 𝑃𝑎 ∗ 𝑠)(0.297 𝑚)
0.00107 𝑚2(2.33𝑥10−12)= 9.53 𝑃𝑎 = 0.001 𝑝𝑠𝑖
This pressure drop is significantly lower than the pressure drop measured using the
transducer. However the resolution of the pressure transducer is 0.01 psi and the gravity
head is estimated to be 0.05 psi, so 0.001 psi cannot be accurately measured with this setup.
A better way of analyzing the pressure drop data is to compare the waterflood
pressure drop data with that for the surfactant flood. The waterflood was conducted at 0.3
74
cm3/min and had a pressure drop of 0.20 psi/ft. The surfactant flood was conducted at 0.01
cm3/min and would be expected to have a pressure drop of approximately 0.01 psi/ft,
however the surfactant flood had a pressure drop of 0.8 psi/ft, which is 80 times higher
than expected based on its aqueous phase viscosity. The most likely reason for the higher
pressure drop is the high viscosity of the microemulsion that forms in-situ when oil
produced from the matrix mixes with the injected surfactant solution in the fracture.
4.2.2 Fractured coreflood #4
The objective of the FRAC-4 experiment was to determine if the results of the
FRAC-3 experiment could be reproduced at least approximately. The core had a pore
volume of 85 cm3 as determined by saturating the core with oil and a porosity of 27%.
Matrix permeability was 8 md, the effective permeability was 2430 md at a confining
pressure of 1100 psi. The corresponding fracture width was 0.09 mm and the fracture
permeability 747,000 md.
The core was waterflooded with a 80,000 ppm NaCl brine at a rate of 0.3 cm3/min,
equivalent to a frontal velocity of 5 ft/D based on the whole core and 407 ft/D based on the
fracture. The oil saturation after the waterflood was 0.95.
The surfactant solution at optimum salinity was injected at a flow rate of 0.01
cm3/min equivalent to 0.16 ft/D based on the whole core and 14 ft/D based on the fracture.
The oil saturation after injection of 4.0 PV of surfactant solution was 0.47 and the pressure
drop was 0.9 psi/ft as shown in Figs. 4.15 and 4.16 respectively.
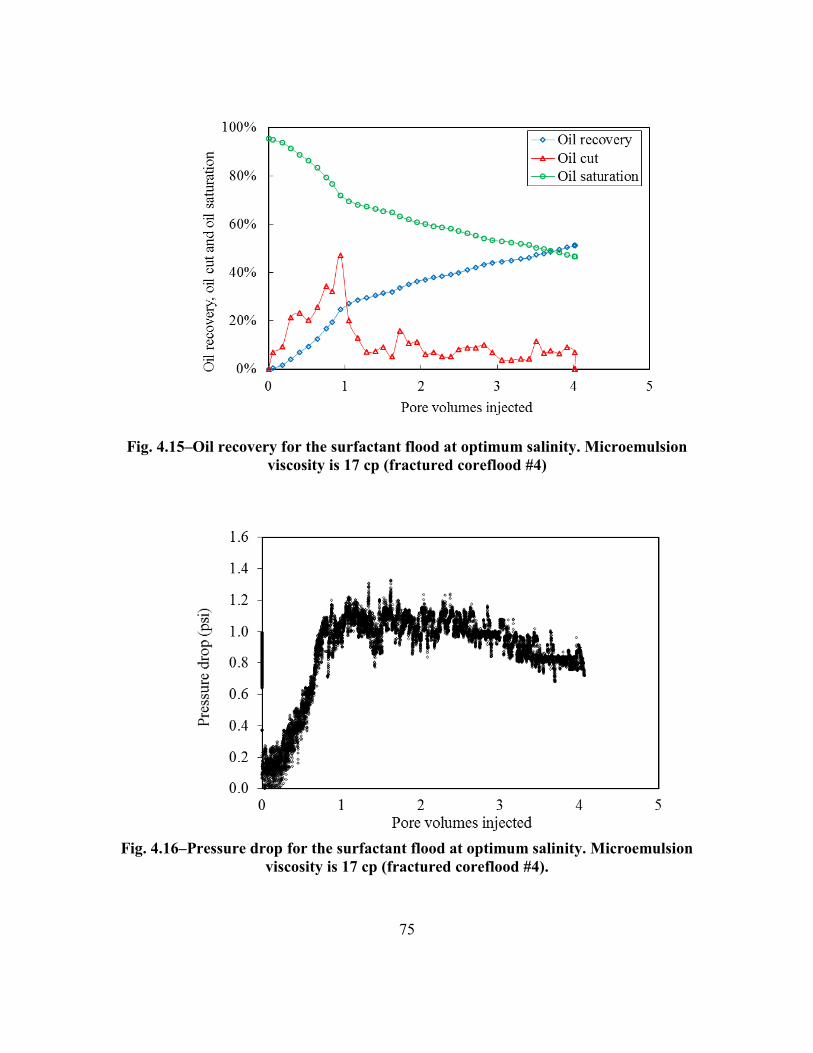
75
Fig. 4.15‒Oil recovery for the surfactant flood at optimum salinity. Microemulsion
viscosity is 17 cp (fractured coreflood #4)
Fig. 4.16‒Pressure drop for the surfactant flood at optimum salinity. Microemulsion
viscosity is 17 cp (fractured coreflood #4).
76
The most important observation from this repeat experiment is that the final
pressure drop was about the same as for fractured coreflood #3. Thus, the high pressure
drop was reproduced and suggested the viscosity of the microemulsion was indeed the
likely reason.
4.2.3 Fractured coreflood #5
The objective of the FRAC-5 experiment was to test the effect of a high
microemulsion viscosity on the oil recovery from a fractured Texas Cream Limestone core.
This was the first explicit test of a new hypothesis that higher microemulsion viscosity
would increase crossflow and thus oil recovery.
The core had a pore volume of 86 cm3, porosity of 28% and matrix permeability of
10 md. The effective permeability of the core after fracturing was 2500 md. The fracture
width was 0.094 mm and the fracture permeability was 749,000 md at a confining pressure
of 1300 psi.
The waterflood was performed with a 95,000 ppm NaCl brine, injected at a rate of
0.3 cm3/min until no oil was detected in the effluent. The oil saturation at the end of the
water flood was 0.97 since the waterflood only recovered oil from the fracture. The
pressure drop at the end of the waterflood was 0.25 psi/ft.
Next, a surfactant solution with a microemulsion viscosity of 75 cp at the estimated
shear in the fracture of 3 s-1 was injected at a rate of 0.01 cm3/min, equivalent to a frontal
velocity of 14 ft/D based on the fracture.
High microemulsion viscosity was achieved by injecting the surfactant solution at
a salinity of 95,000 ppm TDS (Fig. 3.2). Increasing the salinity also affects the interfacial
tension. The oil solubilization ratio at 95,000 ppm is estimated from Fig. 3.1 to be 22 and
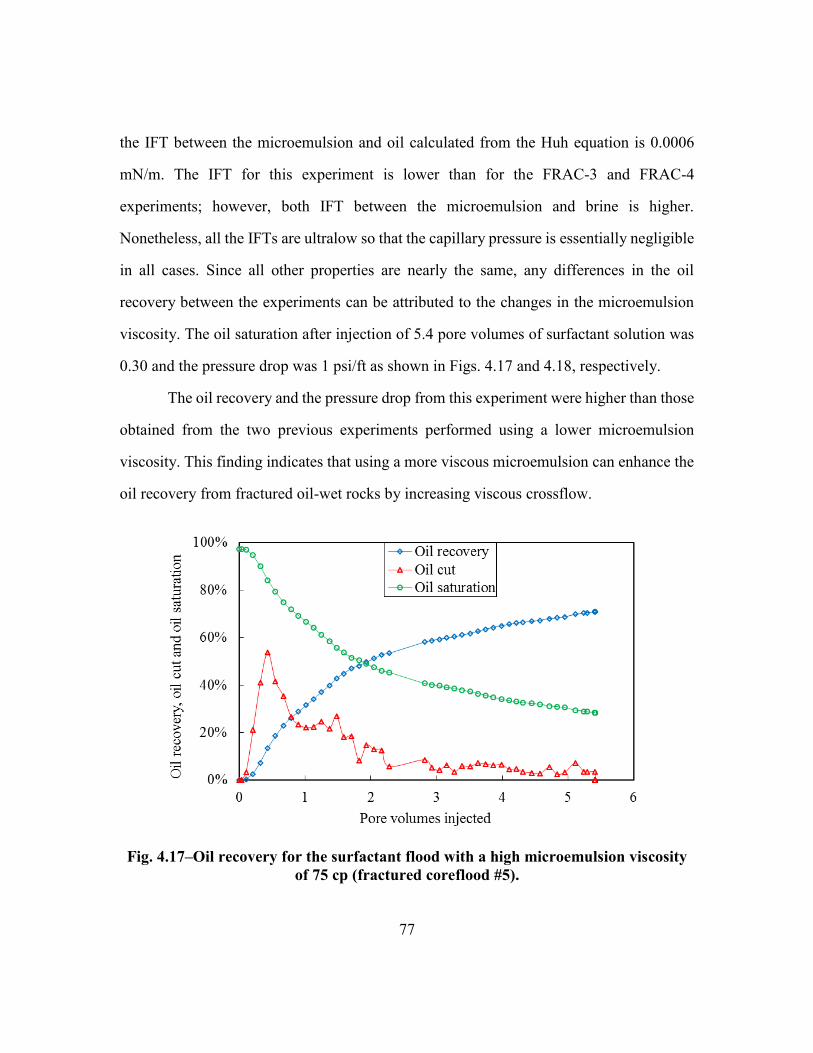
77
the IFT between the microemulsion and oil calculated from the Huh equation is 0.0006
mN/m. The IFT for this experiment is lower than for the FRAC-3 and FRAC-4
experiments; however, both IFT between the microemulsion and brine is higher.
Nonetheless, all the IFTs are ultralow so that the capillary pressure is essentially negligible
in all cases. Since all other properties are nearly the same, any differences in the oil
recovery between the experiments can be attributed to the changes in the microemulsion
viscosity. The oil saturation after injection of 5.4 pore volumes of surfactant solution was
0.30 and the pressure drop was 1 psi/ft as shown in Figs. 4.17 and 4.18, respectively.
The oil recovery and the pressure drop from this experiment were higher than those
obtained from the two previous experiments performed using a lower microemulsion
viscosity. This finding indicates that using a more viscous microemulsion can enhance the
oil recovery from fractured oil-wet rocks by increasing viscous crossflow.
Fig. 4.17‒Oil recovery for the surfactant flood with a high microemulsion viscosity
of 75 cp (fractured coreflood #5).
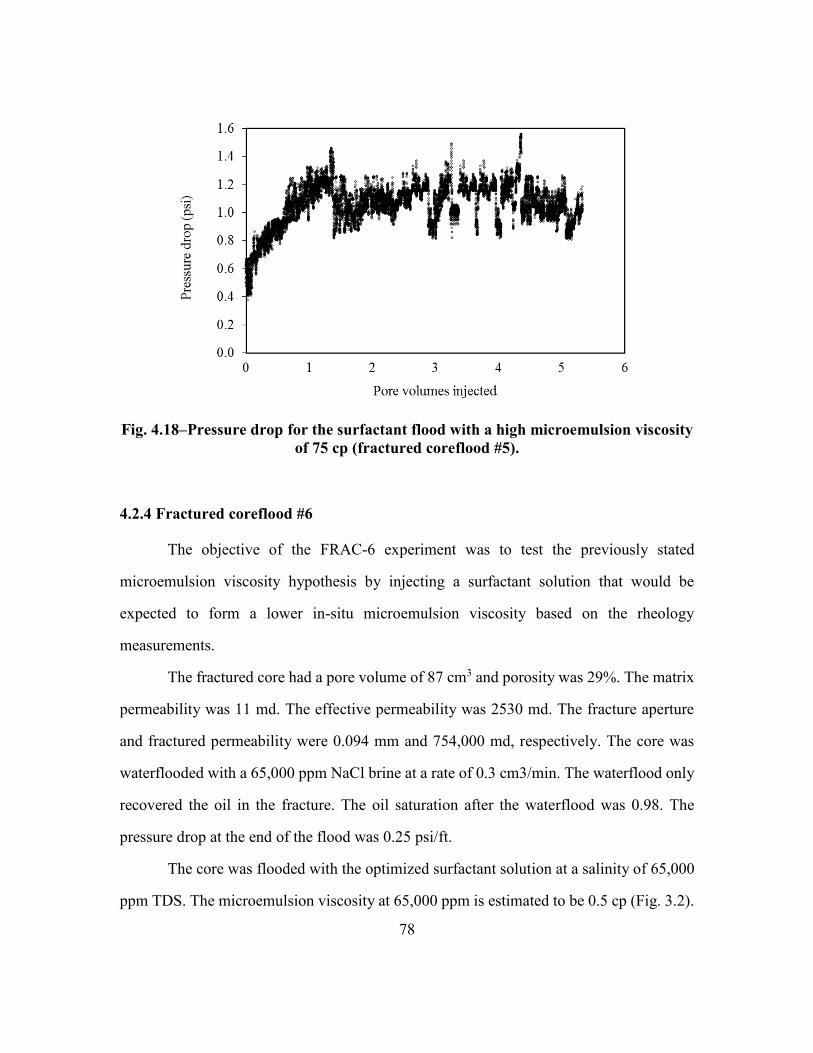
78
Fig. 4.18‒Pressure drop for the surfactant flood with a high microemulsion viscosity
of 75 cp (fractured coreflood #5).
4.2.4 Fractured coreflood #6
The objective of the FRAC-6 experiment was to test the previously stated
microemulsion viscosity hypothesis by injecting a surfactant solution that would be
expected to form a lower in-situ microemulsion viscosity based on the rheology
measurements.
The fractured core had a pore volume of 87 cm3 and porosity was 29%. The matrix
permeability was 11 md. The effective permeability was 2530 md. The fracture aperture
and fractured permeability were 0.094 mm and 754,000 md, respectively. The core was
waterflooded with a 65,000 ppm NaCl brine at a rate of 0.3 cm3/min. The waterflood only
recovered the oil in the fracture. The oil saturation after the waterflood was 0.98. The
pressure drop at the end of the flood was 0.25 psi/ft.
The core was flooded with the optimized surfactant solution at a salinity of 65,000
ppm TDS. The microemulsion viscosity at 65,000 ppm is estimated to be 0.5 cp (Fig. 3.2).
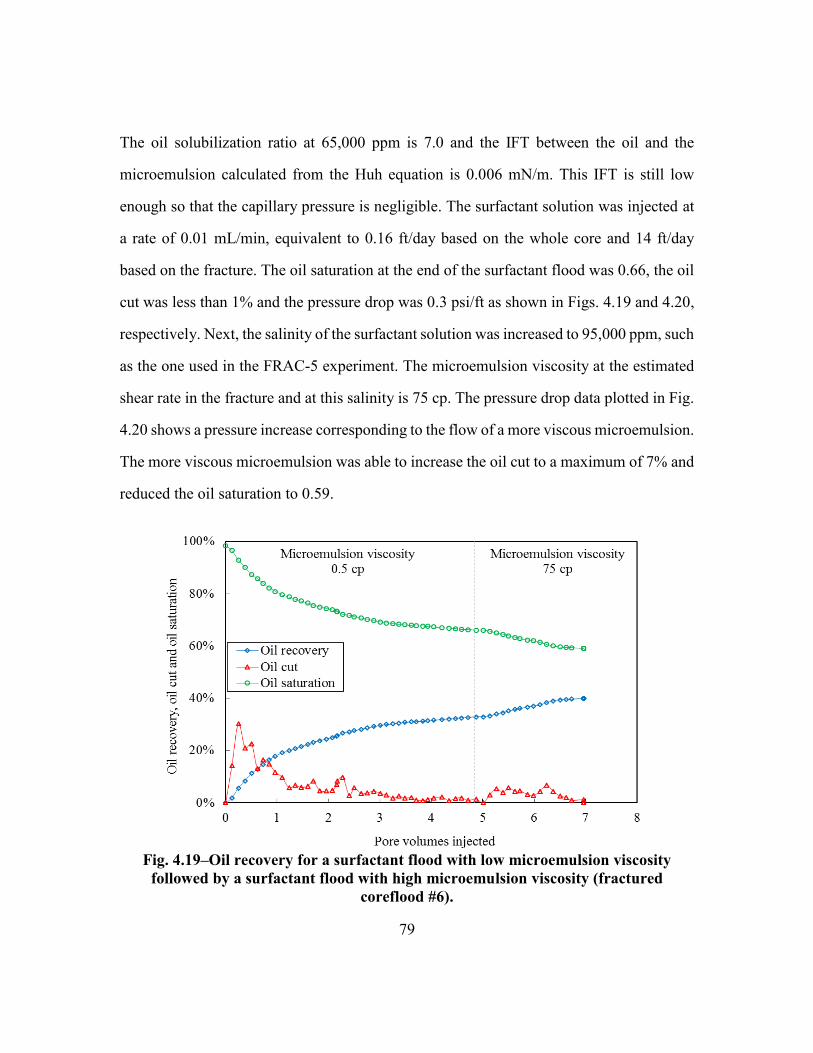
79
The oil solubilization ratio at 65,000 ppm is 7.0 and the IFT between the oil and the
microemulsion calculated from the Huh equation is 0.006 mN/m. This IFT is still low
enough so that the capillary pressure is negligible. The surfactant solution was injected at
a rate of 0.01 mL/min, equivalent to 0.16 ft/day based on the whole core and 14 ft/day
based on the fracture. The oil saturation at the end of the surfactant flood was 0.66, the oil
cut was less than 1% and the pressure drop was 0.3 psi/ft as shown in Figs. 4.19 and 4.20,
respectively. Next, the salinity of the surfactant solution was increased to 95,000 ppm, such
as the one used in the FRAC-5 experiment. The microemulsion viscosity at the estimated
shear rate in the fracture and at this salinity is 75 cp. The pressure drop data plotted in Fig.
4.20 shows a pressure increase corresponding to the flow of a more viscous microemulsion.
The more viscous microemulsion was able to increase the oil cut to a maximum of 7% and
reduced the oil saturation to 0.59.
Fig. 4.19‒Oil recovery for a surfactant flood with low microemulsion viscosity
followed by a surfactant flood with high microemulsion viscosity (fractured
coreflood #6).
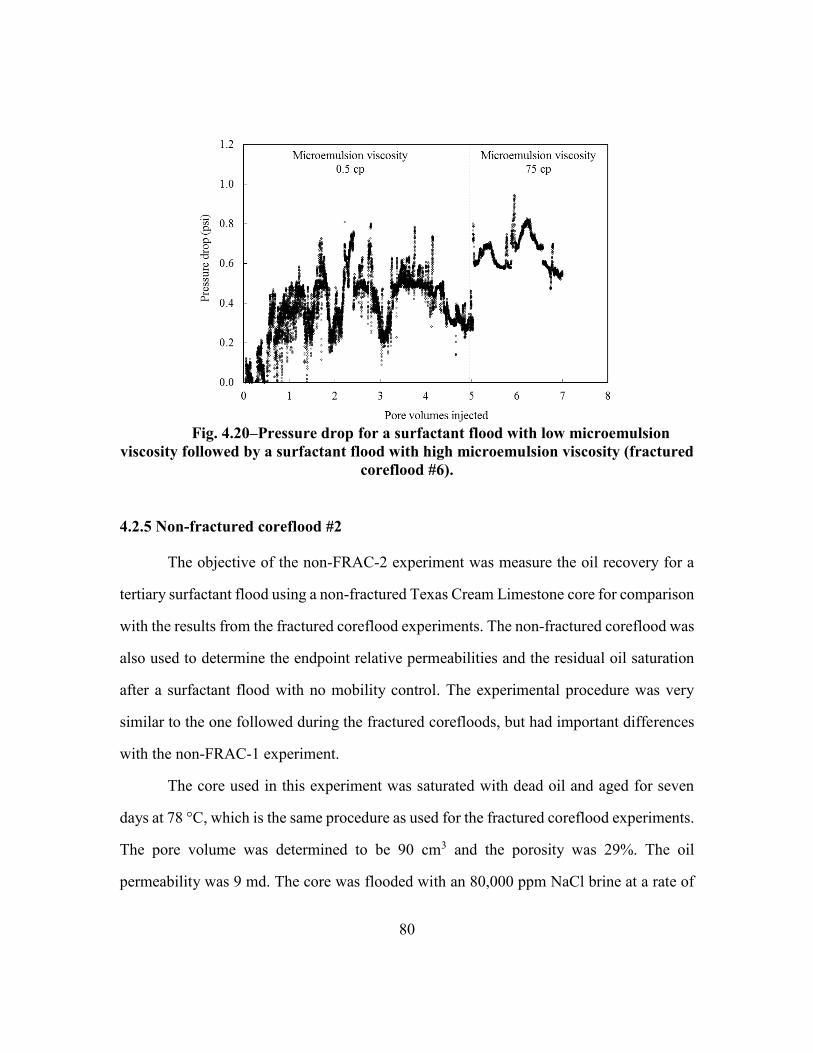
80
Fig. 4.20‒Pressure drop for a surfactant flood with low microemulsion
viscosity followed by a surfactant flood with high microemulsion viscosity (fractured
coreflood #6).
4.2.5 Non-fractured coreflood #2
The objective of the non-FRAC-2 experiment was measure the oil recovery for a
tertiary surfactant flood using a non-fractured Texas Cream Limestone core for comparison
with the results from the fractured coreflood experiments. The non-fractured coreflood was
also used to determine the endpoint relative permeabilities and the residual oil saturation
after a surfactant flood with no mobility control. The experimental procedure was very
similar to the one followed during the fractured corefloods, but had important differences
with the non-FRAC-1 experiment.
The core used in this experiment was saturated with dead oil and aged for seven
days at 78 °C, which is the same procedure as used for the fractured coreflood experiments.
The pore volume was determined to be 90 cm3 and the porosity was 29%. The oil
permeability was 9 md. The core was flooded with an 80,000 ppm NaCl brine at a rate of
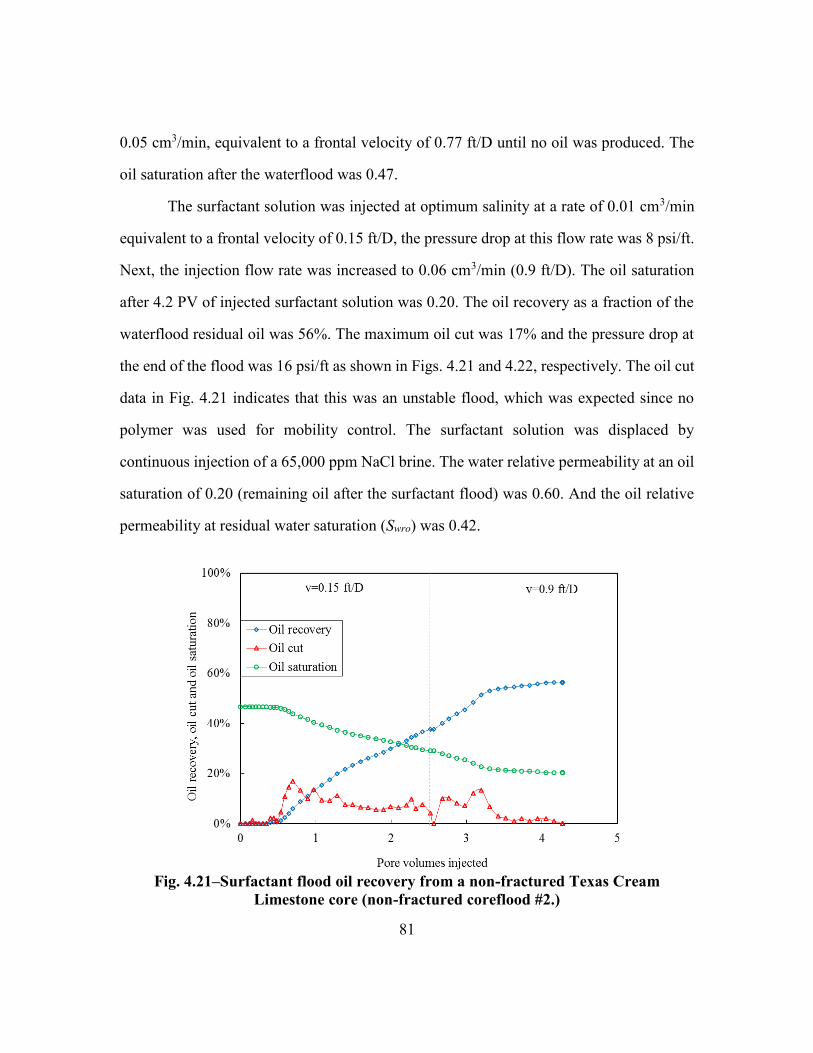
81
0.05 cm3/min, equivalent to a frontal velocity of 0.77 ft/D until no oil was produced. The
oil saturation after the waterflood was 0.47.
The surfactant solution was injected at optimum salinity at a rate of 0.01 cm3/min
equivalent to a frontal velocity of 0.15 ft/D, the pressure drop at this flow rate was 8 psi/ft.
Next, the injection flow rate was increased to 0.06 cm3/min (0.9 ft/D). The oil saturation
after 4.2 PV of injected surfactant solution was 0.20. The oil recovery as a fraction of the
waterflood residual oil was 56%. The maximum oil cut was 17% and the pressure drop at
the end of the flood was 16 psi/ft as shown in Figs. 4.21 and 4.22, respectively. The oil cut
data in Fig. 4.21 indicates that this was an unstable flood, which was expected since no
polymer was used for mobility control. The surfactant solution was displaced by
continuous injection of a 65,000 ppm NaCl brine. The water relative permeability at an oil
saturation of 0.20 (remaining oil after the surfactant flood) was 0.60. And the oil relative
permeability at residual water saturation (Swro) was 0.42.
Fig. 4.21‒Surfactant flood oil recovery from a non-fractured Texas Cream
Limestone core (non-fractured coreflood #2.)
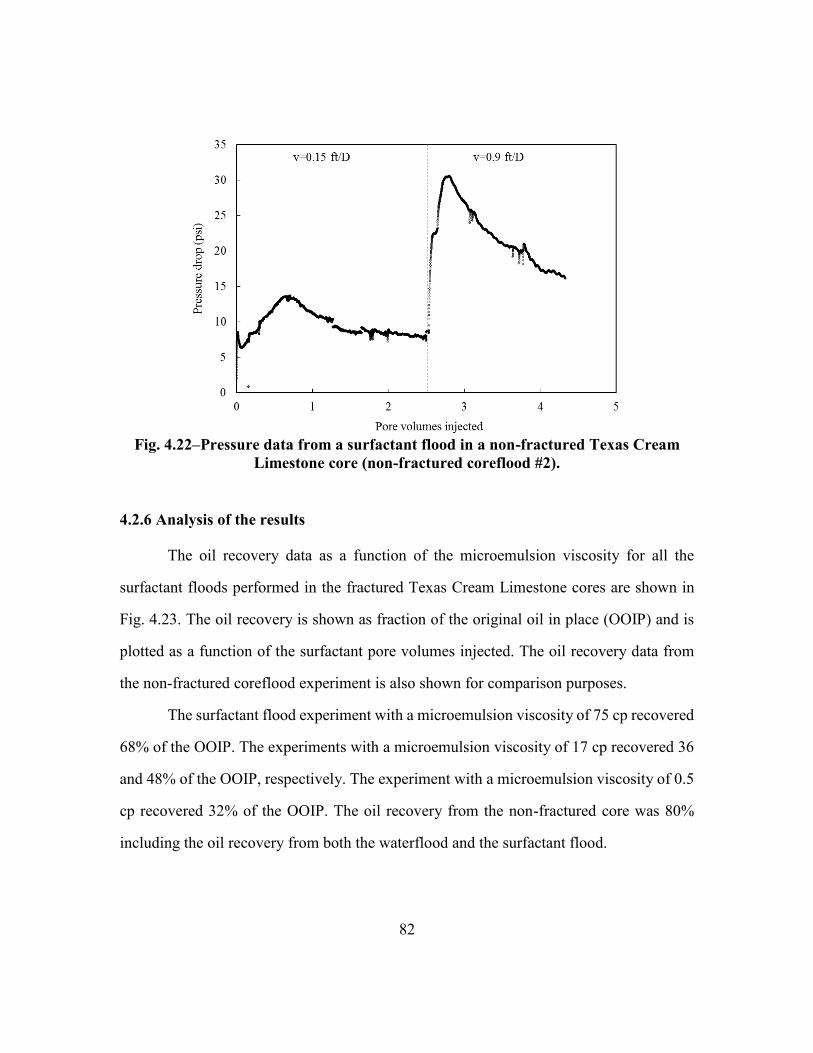
82
Fig. 4.22‒Pressure data from a surfactant flood in a non-fractured Texas Cream
Limestone core (non-fractured coreflood #2).
4.2.6 Analysis of the results
The oil recovery data as a function of the microemulsion viscosity for all the
surfactant floods performed in the fractured Texas Cream Limestone cores are shown in
Fig. 4.23. The oil recovery is shown as fraction of the original oil in place (OOIP) and is
plotted as a function of the surfactant pore volumes injected. The oil recovery data from
the non-fractured coreflood experiment is also shown for comparison purposes.
The surfactant flood experiment with a microemulsion viscosity of 75 cp recovered
68% of the OOIP. The experiments with a microemulsion viscosity of 17 cp recovered 36
and 48% of the OOIP, respectively. The experiment with a microemulsion viscosity of 0.5
cp recovered 32% of the OOIP. The oil recovery from the non-fractured core was 80%
including the oil recovery from both the waterflood and the surfactant flood.
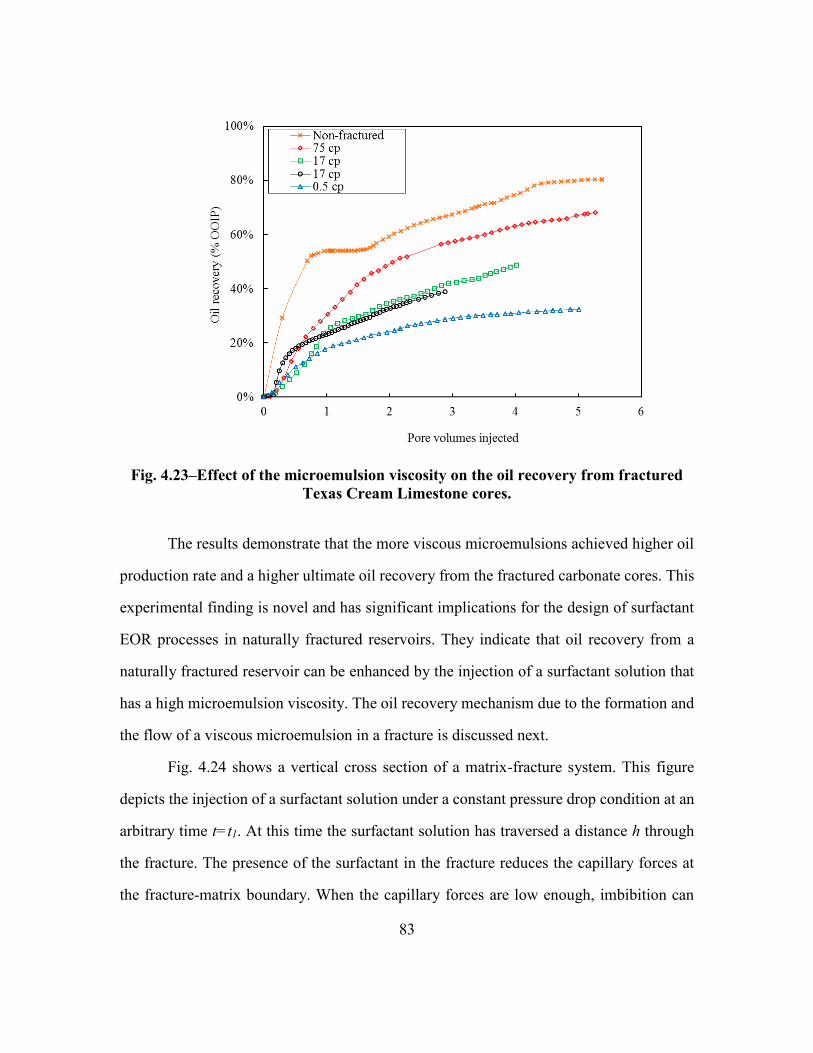
83
Fig. 4.23‒Effect of the microemulsion viscosity on the oil recovery from fractured
Texas Cream Limestone cores.
The results demonstrate that the more viscous microemulsions achieved higher oil
production rate and a higher ultimate oil recovery from the fractured carbonate cores. This
experimental finding is novel and has significant implications for the design of surfactant
EOR processes in naturally fractured reservoirs. They indicate that oil recovery from a
naturally fractured reservoir can be enhanced by the injection of a surfactant solution that
has a high microemulsion viscosity. The oil recovery mechanism due to the formation and
the flow of a viscous microemulsion in a fracture is discussed next.
Fig. 4.24 shows a vertical cross section of a matrix-fracture system. This figure
depicts the injection of a surfactant solution under a constant pressure drop condition at an
arbitrary time t=t1. At this time the surfactant solution has traversed a distance h through
the fracture. The presence of the surfactant in the fracture reduces the capillary forces at
the fracture-matrix boundary. When the capillary forces are low enough, imbibition can
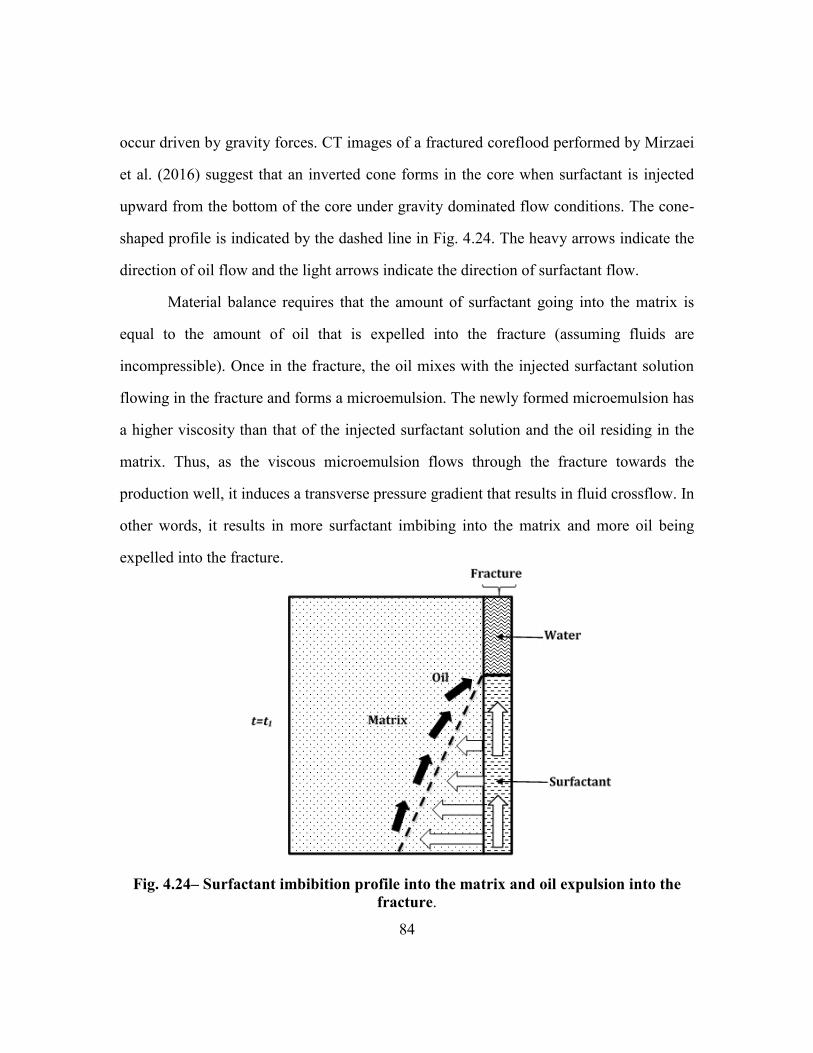
84
occur driven by gravity forces. CT images of a fractured coreflood performed by Mirzaei
et al. (2016) suggest that an inverted cone forms in the core when surfactant is injected
upward from the bottom of the core under gravity dominated flow conditions. The cone-
shaped profile is indicated by the dashed line in Fig. 4.24. The heavy arrows indicate the
direction of oil flow and the light arrows indicate the direction of surfactant flow.
Material balance requires that the amount of surfactant going into the matrix is
equal to the amount of oil that is expelled into the fracture (assuming fluids are
incompressible). Once in the fracture, the oil mixes with the injected surfactant solution
flowing in the fracture and forms a microemulsion. The newly formed microemulsion has
a higher viscosity than that of the injected surfactant solution and the oil residing in the
matrix. Thus, as the viscous microemulsion flows through the fracture towards the
production well, it induces a transverse pressure gradient that results in fluid crossflow. In
other words, it results in more surfactant imbibing into the matrix and more oil being
expelled into the fracture.
Fig. 4.24‒ Surfactant imbibition profile into the matrix and oil expulsion into the
fracture.
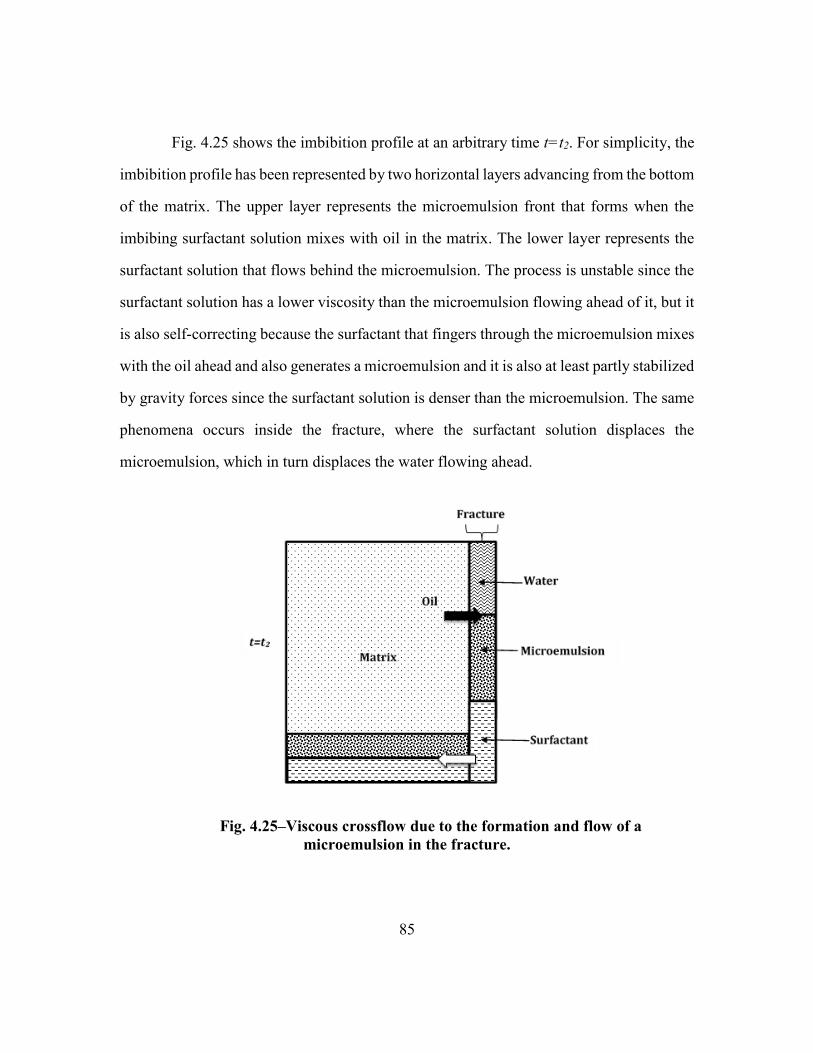
85
Fig. 4.25 shows the imbibition profile at an arbitrary time t=t2. For simplicity, the
imbibition profile has been represented by two horizontal layers advancing from the bottom
of the matrix. The upper layer represents the microemulsion front that forms when the
imbibing surfactant solution mixes with oil in the matrix. The lower layer represents the
surfactant solution that flows behind the microemulsion. The process is unstable since the
surfactant solution has a lower viscosity than the microemulsion flowing ahead of it, but it
is also self-correcting because the surfactant that fingers through the microemulsion mixes
with the oil ahead and also generates a microemulsion and it is also at least partly stabilized
by gravity forces since the surfactant solution is denser than the microemulsion. The same
phenomena occurs inside the fracture, where the surfactant solution displaces the
microemulsion, which in turn displaces the water flowing ahead.
Fig. 4.25‒Viscous crossflow due to the formation and flow of a
microemulsion in the fracture.
86
This qualitative interpretation is supported by the experimental pressure drop data
from the surfactant floods with different microemulsion viscosity. The pressure drop for
the high microemulsion viscosity (75 cp) was 1.2 psi/ft, 0.9 psi/ft for the intermediate
microemulsion viscosity of 17 cp and 0.3 psi/ft for the low microemulsion viscosity (0.5
cp). Although the pressure drop data are not in close agreement with the expected values
based on the viscosity for these microemulsions as measured with the rheometer, this may
be because the composition of the external and in-situ microemulsions are not identical and
the viscosity depends on shear rate, which is not uniform in the core. Regardless, it seems
likely that higher microemulsion viscosity leads to higher pressure drops and that the
pressure drops are large enough to significantly increase the oil recovery from the fractured
limestone cores as indicated by the oil recovery data plotted in Fig. 4.23.
87
Chapter 5: Conclusions and Future Work
5.1 CONCLUSIONS
The research results presented in this thesis include experimental evidence
demonstrating the importance of viscous forces for oil recovery during surfactant flooding
of fractured carbonate cores. Most importantly, this research demonstrates that viscous
forces are naturally enhanced by using surfactants that form microemulsions with a high
viscosity inside the core.
The effects of viscous forces on the oil recovery during a surfactant flood in a
fractured carbonate core were investigated by conducting a series of ultralow IFT
surfactant floods using fractured Silurian Dolomite and Texas Cream Limestone cores.
The viscosity of the surfactant solution was increased by adding polymer to the
surfactant solution or by changing the salinity of the aqueous surfactant solution, which
affects the in-situ microemulsion viscosity.
The fractured cores had an extreme permeability contrast between the fracture and
the matrix (ranging from 2500 to 90,000) so as to represent typical conditions encountered
in most naturally fractured reservoirs. Non-fractured coreflood experiments were also
performed in cores of each rock type for comparison with the fractured corefloods.
This is the first experimental study of the effect of viscous forces on the
performance of surfactant floods of fractured carbonate cores under dynamic conditions.
Previous experimentalists assumed the small viscous forces were not important for oil
recovery from fractured reservoirs since the pressure gradients that can be established in
this type of reservoir are very low due to the presence of highly conductive fractures.
However, this study clearly indicates that viscous forces play an important role since even
small pressure gradients transverse to the flow direction in the fracture can induce fluid
crossflow between the fracture and the matrix.
88
Silurian Dolomite cores were used in the first two fractured coreflood experiments.
The ratio of the fracture permeability to the matrix permeability was 5000 for FRAC-1 and
2500 for FRAC-2. In both experiments, water was injected first, followed by a surfactant
solution and then by a surfactant-polymer solution with a higher viscosity. The oil recovery
as a fraction of the original oil in place (OOIP) after the waterflood, the surfactant flood
and the surfactant-polymer flood was 76% for the FRAC-1 and 83% for the FRAC-2
coreflood experiments. The oil recovery from the non-fractured Silurian Dolomite core
after a waterflood and an alkaline-surfactant-polymer flood was 93%. The oil recovery
from the fractured Silurian Dolomite cores was much higher than expected for a fractured
core with such a high permeability contrast. However, the most interesting finding from
this experiment is that the oil production rate and the pressure drop increased when the
more viscous surfactant-polymer solutions were injected.
The role of viscous forces was also indicated by comparing the oil recovery from
the two fractured Silurian Dolomite cores with two static surfactant imbibition experiments
using Silurian Dolomite cores and the same surfactant formulation (Li, 2016). The oil
recovery was much higher when surfactant imbibition occurred under dynamic conditions.
The incremental oil recovery from the dynamic imbibition experiments over the static
imbibition experiments is attributed to viscous forces since gravity and capillary forces are
present under both static and dynamic conditions, however, the viscous forces are greater
for the dynamic coreflood experiments compared to the static imbibition experiments.
The fractured coreflood experiments performed with a viscous surfactant-polymer
solution were useful in demonstrating the importance of viscous forces from fractured
carbonate cores. However, the use of polymer in the surfactant solution adds to the cost
and complexity of the process. A simpler approach would be to use surfactant solutions
that form viscous microemulsions in-situ to increase the viscous forces in the dynamic
89
displacements. Therefore, the second part of this research was dedicated to investigating
the effects of using viscous microemulsions for enhancing the oil recovery during
surfactant floods from fractured carbonate cores.
Four surfactant flooding experiments were performed in fractured Texas Cream
Limestone cores at 78 °C using surfactant solutions that form microemulsions with
different viscosity. The microemulsion viscosity was changed by adjusting the salinity of
the brine in the microemulsion (see Fig. 3.2). Microemulsion viscosities were measured at
78 °C on equilibrated samples at each salinity. The microemulsion viscosity values as
measured with the rheometer were 0.5, 17 and 75 cp, respectively, at the shear rates
estimated in the corefloods. All of the experiments were done under low IFT conditions so
that capillary pressure was negligible. The ratio of the fracture permeability to the matrix
permeability ranged between 70,000 and 90,000 for the Texas Cream Limestone cores.
The oil recovery was greater for the corefloods with the higher microemulsion
viscosities. The oil recovery for a surfactant that formed a microemulsion viscosity of 75
cp was 68% of the OOIP. The oil recovery for a microemulsion viscosity of 17 cp recovered
48% of the OOIP and the oil recovery for a microemulsion viscosity of 0.5 cp was 32% of
the OOIP. The oil recovery after a surfactant flood from a non-fractured core under similar
conditions as the fractured cores was 80%.
These results demonstrate that using surfactants that form microemulsions with a
high viscosity can enhance the oil recovery from fractured carbonates. The finding can be
explained as follows: there is a difference in the gravity head between the surfactant
solution in the vertical fracture and the oil in the matrix due to the lower density of the oil.
The higher pressure in the fracture causes the surfactant to imbibe into the matrix under a
small horizontal pressure gradient. When the surfactant mixes with the oil and brine in the
matrix, it forms a microemulsion. When the salinity is near its optimum value such as in
90
all of these experiments, the IFT is very low and capillary forces are negligible. However,
the oil and microemulsion relative permeabilities increase due to both the ultralow IFT and
the change in wettability from oil wet to more water wet conditions. This allows some of
the oil and microemulsion to flow from the matrix into the fracture where it also mixes
with surfactant solution and forms more microemulsion. As viscous microemulsions flow
through the fracture it generates transverse pressure gradients that increase the rate of
surfactant imbibition into the matrix. A more viscous microemulsion will induce greater
transverse pressure gradients that will result in more crossflow and more oil production.
These results imply that a viscous microemulsion can serve as a mobility control agent,
analogous to mobility control with foams or polymers but with far less complexity and
cost.
Overall, the results from this research demonstrate that viscous forces play a major
role on the oil recovery during surfactant floods of fractured carbonate rocks, which
contradicts conventional wisdom. The results also indicate that the oil recovery from
naturally fractured reservoirs can be enhanced by using surfactants that achieve ultralow
IFT and that provide mobility control by the formation and flow of viscous microemulsions
in the fractures.
5.2 FUTURE WORK
Future research should be dedicated to accurately quantifying the magnitude of
viscous forces on the oil recovery during surfactant floods in fractured rocks, More
fractured coreflood experiments will be needed, but also numerical simulations calibrated
with experimental data could be used to better analyze and optimize surfactant imbibition
processes in naturally fractured reservoirs.
91
The experimental data presented here is the first of its kind and should be used for
calibrating the numerical models that are used to simulate surfactant flooding in naturally
fractured reservoirs. The simulations should help us better understand the effect of the in-
situ microemulsion viscosity. Most simulations of imbibition processes have not used a
sufficiently fine numerical grid. However, if these simulations are to accurately capture the
physics of the process, very fine grid simulations need to be performed. The simulations
could also be used to compare the use of foam with the use of viscous microemulsions for
mobility control.
In addition, pore network models could provide a much better understanding of the
magnitude of transverse pressure gradients and in general of all the mechanisms causing
imbibition. To this date there is not a single reference regarding the investigation of
surfactant imbibition processes by using pore network models.
More fractured coreflood experiments should be performed with a wide variety of
oils, brines, surfactants and rocks. The effect of EDTA, alkali and co-solvent needs to be
investigated for rocks and brines with different geochemistry. A very interesting question
is the effect of the surfactant residence time on the imbibition and oil recovery.
More comparisons between static and dynamic imbibition experiments using the
same fluids, rocks and core dimensions would also be useful.
Several classical scaling groups have been developed for gravity and capillary
driven imbibition but none of them took into account the transverse pressure gradients that
are induced by fluid flow inside a fracture and demonstrated herein to be significant for
enhancing fluid crossflow between the fracture and the matrix. Furthermore, none of the
scaling groups have been developed to account for the microemulsion viscosity and none
of them were validated using cores of different diameters among other severe limitations.
The analytical model recently developed by Li et al., (2016) for low IFT surfactant
92
imbibition is the only available scaling group that accounts for the microemulsion viscosity
and that has been tested with a series of experiments using cores of different sizes, but no
such model is available for dynamic experiments.
The issue of surfactant utilization should also be studied if this process is to become
economically feasible. The implementation of this process will require that a small
surfactant slug can achieve a high oil recovery in a reasonable length of time. This research
has contributed to this goal by demonstrating that using viscous microemulsions can
enhance the rate of oil recovery from fractured carbonate cores. Although much more
remains to be done to meet the challenges of enhanced oil recovery from naturally fractured
reservoirs, the significant progress made during this and other recent research on surfactant
imbibition is a good start and justifies some optimism that this goal will eventually be
achieved.
93
Bibliography
Abbasi, A. Y. 2010. Simulation study of Surfactant Transport Mechanisms in Naturally
Fractured Reservoirs. MS Thesis. The University of Texas at Austin, Austin,
Texas, (August 2010).
Abbasi, A. Y., Pope, G. A., and Delshad, M. 2010. Mechanistic Modeling of Chemical
Transport in Naturally Fractured Oil Reservoirs. Presented at the SPE Improved
Oil Recovery Symposium, Tulsa, Oklahoma, 24-28 April. SPE-129661-MS.
http://dx.doi.org/10.2118/129661-MS.
Adams, W. T., and Schievelbein, V. H. 1987. Surfactant Flooding Carbonate Reservoirs.
SPE Reservoir Engineering 2 (04); 619-626. SPE-12686-PA.
http://dx.doi.org/10.2118/12686-PA.
Adibhatla, B. and Mohanty, K. K. 2008. Oil Recovery from Fractured Carbonates by
Surfactant-Aided Gravity Drainage: Laboratory Experiments and Mechanistic
Simulations,” SPE Res Eval & Eng, 11 (01): 119-130. SPE-99773-PA.
http://dx.doi.org/10.2118/99773-PA.
Aguilera, R. 1980. Naturally Fractured Reservoirs, first edition, Tulsa, Oklahoma,
Petroleum Publishing Company.
Aguilera, R. 1995. Naturally Fractured Reservoirs, second edition, Tulsa, Oklahoma,
PennWell Publishing Company.
Ahr, W. M. 2008, Geology of Carbonate Reservoirs: The Identification, Description and
Characterization of Hydrocarbon Reservoirs in Carbonate Rocks, Hoboken, New
Jersey: Wiley.
Amott, E. (1959, January 1). Observations Relating to the Wettability of Porous Rock.
Petroleum Transactions, AIME 216: 156-162. SPE-1167-G.
Anderson, W. G. 1987. Wettability Literature Survey-Part 6: The Effects of Wettability on
Waterflooding. Journal of Petroleum Technology 39 (12): 1605-1622. SPE-16471-
PA. http://dx.doi.org/10.2118/16471-PA.
ASTM C496/C 496M–04, Standard Test Method for Splitting Tensile Strength of
Cylindrical Concrete Specimens1, 2004. PA, USA, American Society of Testing
Materials.
Austad, T. and Milter, J. 1997. Spontaneous Imbibition of Water into Low Permeable
Chalk at Different Wettabilities Using Surfactants. Presented at the International
Symposium for oilfield chemistry, Houston, Texas, 18-21 February. SPE-37236-
MS. http://dx.doi.org/10.2118/37236-MS.
94
Babadagli, T. 2003. Selection of proper enhanced oil recovery fluid for efficient matrix
recovery in fractured oil reservoirs. Colloids and Surfaces A: Physicochemical and
Engineering Aspects 223(1-3): 157-175. doi:10.1016/S0927-7757(03)00170-5.
Barenblatt, G. I., Zheltov, I. P. and Kochina, I. N. 1960. Basic Concepts in the Theory of
Seepage of Homogeneous Liquids if Fissured Rocks (Strata). Journal of Applied
Mathematics and Mechanics 24 (5): 1286-1303. doi:10.1016/0021-
8928(60)90107-6.
Bavière, M. 1991. Basic Concepts in Enhanced Oil Recovery Processes. London: Elsevier
Applied Science.
Boerrigter, P. M., Verlaan, M., and Yang, D. 2007. EOR Methods to Enhance Gas Oil
Gravity Drainage. Society of Petroleum Engineers. Presented at the SPE/EAGE
Reservoir Characterization and Simulation Conference, 28-31 October, Abu Dhabi,
UAE SPE-111403-MS. http://dx.doi.org/10.2118/111403-MS.
Bourrel, M. and Schechter, R. S. 2010. Microemulsions and Related Systems, second
edition. Paris: Editions Technip.
Carlisle, C., Al-Maraghi, E., Al-Saad, B. et al. 2014. One-Spot Pilot Results in the
Sabriyah-Mauddud Carbonate Formation in Kuwait Using a Novel Surfactant
Formulation. Presented at the SPE Improved Oil Recovery Symposium, Tulsa,
Oklahoma, USA, 12-16 April. SPE-169153-MS.
http://dx.doi.org/10.2118/169153-MS.
Chen, H. L., Lucas, L. R., Nogaret, L. et al. 2001. Laboratory Monitoring of Surfactant
Imbibition with Computerized Tomography. SPE Res Eval & Eng 4 (01): 16-25.
SPE-69197-PA. http://dx.doi.org/10.2118/69197-PA.
Chen, P. and K.K. Mohanty. 2013. Surfactant-Mediated Spontaneous Imbibition in
Carbonate Rocks at Harsh Reservoir Conditions,” SPE Journal 18 (1): 124-133.
SPE-153960-PA. http://dx.doi.org/10.2118/153960-PA.
Chilingarian, G. V., Mazzullo, S. J. and Rieke, H. H. 1992. Carbonate Reservoir
Characterization: A Geologic-Engineering Analysis, part I, Amsterdam, Elsevier
Science.
Chilingarian, G. V., Mazzullo, S. J. and Rieke, H. H. 1996. Carbonate Reservoir
Characterization: A Geologic-Engineering Analysis, part II, Amsterdam, Elsevier
Science.
Chilingar, G. V. and Yen, T. F. 1983. Some Notes on Wettability and Relative
Permeabilities of Carbonate Reservoir Rocks, II. Energy Sources 7 (1): 67-75.
0090-8312.
Cinco-Ley, H. 1996. Well-Test Analysis for Naturally Fractured Reservoirs. Journal of
Petroleum Technology 48 (01): 51-54. SPE-31162-JPT.
http://dx.doi.org/10.2118/31162-JPT.
95
Cinco-Ley, H. and Samaniego-V., F. 1981. Transient Pressure Analysis for Fractured
Wells. SPE Journal 33 (09): 1749-1766. SPE-7490-PA.
http://dx.doi.org/10.2118/7490-PA.
Clifford, P. J., and Sorbie, K. S. 1985. The Effects of Chemical Degradation on Polymer
Flooding. Presented at the SPE Oilfield and Geothermal Chemistry Symposium,
Phoenix, Arizona, USA, 9-11 March. SPE-13586-MS.
http://dx.doi.org/10.2118/13586-MS.
Delshad, M., Najafabadi, N. F., Anderson et al. 2009. Modeling Wettability Alteration By
Surfactants in Naturally Fractured Reservoirs. SPE Reservoir Evaluation and
Engineering 13 (03): 361-370. SPE-100081-PA. http://dx.doi.org/10.2118/100081-
PA
Delshad, M., Pope, G. A. and Sepehrnoori, K. 1996. A compositional simulator for
modeling surfactant enhanced aquifer remediation, 1 formulation. Journal of
Contaminant Hydrology 23 (4): 303-327. doi:10.1016/0169-7722(95)00106-9.
Donaldson, E. C., Thomas, R. D., and Lorenz, P. B. 1969. Wettability Determination and
Its Effect on Recovery Efficiency. SPE Journal 9 (01): 13-20. SPE-2338-PA.
http://dx.doi.org/10.2118/2338-PA.
Du Prey, L. 1978. Gravity and Capillarity Effects on Imbibition in Porous Media. SPE
Journal, 18 (3): 195-206. SPE-6192-PA.
http://dx.doi.org/10.2118/6192-PA
Flaaten, A. K., Nguyen, Q. P., Pope, G.A. et al. 2009. A Systematic Laboratory Approach
to Low-Cost, High-Performance Chemical Flooding. SPE Reservoir Evaluation &
Engineering, 12 (5): 713-723. SPE 113469-PA. http://dx.doi.org/10.2118/113469-
PA.
Ferno, M. A., Gauteplass, J., Pancharoen et al. 2016. Experimental Study of Foam
Generation, Sweep Efficiency, and Flow in a Fracture Network. SPE Journal
preprint. SPE-170840-PA. http://dx.doi.org/10.2118/170840-PA.
Graham, J. and Ortloff, G. D. 1970. Cyclic injection of surfactant for increasing oil
recovery from fractured matrix reservoirs. US 3548941.
Gilman, J. R., and Kazemi, H. 1988. Improved Calculations for Viscous and Gravity
Displacement in Matrix Blocks in Dual-Porosity Simulators. Journal of Petroleum
Technology 40 (01): 60-70. SPE-16010-PA.
http://dx.doi.org/10.2118/16010-PA.
Green, D. W. and Willhite, G. P. 1998. Enhanced Oil Recovery. Richardson, TX: SPE
Textbook Series Vol. 6.
Gupta, R., and Mohanty, K. K. 2008. Wettability Alteration of Fractured Carbonate
Reservoirs. Presented at the SPE Symposium on Improved Oil Recovery, Tulsa,
Oklahoma, 20-23 April. SPE-113407-MS. http://dx.doi.org/10.2118/113407-MS.
96
Healy, R. N., Reed, R. L. and Stenmark, D. G. 1976. Multiphase Microemulsion Systems.
SPE Journal 16 (03): 147-160. SPE-5565-PA.
http://dx.doi.org/10.2118/5565-PA.
Hirasaki, G. J., Miller, C. A., Pope, G. A. et al. 2004. Surfactant Based Enhanced Oil
Recovery and Foam Mobility Control. DE-FC26-03NT15406, Houston, Texas.
Hirasaki, G., and Zhang, D. L. 2004. Surface Chemistry of Oil Recovery From Fractured,
Oil-Wet, Carbonate Formations. SPE J. 9 (02): 151-162. SPE-88365-PA.
http://dx.doi.org/10.2118/88365-PA.
Huh, C. 1979. Interfacial Tensions and Solubilizing Ability of a Microemulsion Phase that
Coexists with Oil and Brine. J. of Colloid and Interface Science 71 (2): 408-426.
DOI:10.1016/0021-9797(79)90249-2.
Hui, M., Fyrozjaee, M. and Kamath, J. 2014. Scaling Gravity-Drainage Oil Recovery from
Fractured Reservoirs Using 3D Discrete Fracture Models. Presented at the SPE
Annual Caspian Technical Conference and Exhibition, Astana, Kazakhstan, 12-14
November. SPE-172295-MS.
http://dx.doi.org/10.2118/172295-MS
Iffly, R., Rousselet, D. C. and Vermeulen, J. L. 1972. Fundamental Study of Imbibition in
Fissured Oil Fields. Presented at the Annual Fall Meeting of the SPE of AIME. San
Antonio, Texas, 8-11 October. SPE-4102-MS.
http://dx.doi.org/10.2118/4102-MS
Jang, S. H., Liyanage, P. J., Tagavifar, M. et al. 2016. A Systematic Method for Reducing
Surfactant Retention to Extremely Low Levels. Presented at the SPE Improved Oil
Recovery Conference, Tulsa, Oklahoma, 11-13 April. SPE-179685-MS.
http://dx.doi.org/10.2118/179685-MS.
Jin, M. 1995. A Study of Non-Aqueous Phase Liquid Characterization and Surfactant
Remediation. PhD dissertation, The University of Texas at Austin, Austin, Texas.
Kamath, J., Meyer, R. F. and Nakagawa, F. M. 2001. Understanding Waterflood Residual
Oil Saturation of Four Carbonate Rock Types. Presented at the SPE Annual
Technical Conference and Exhibition, New Orleans, Louisiana, USA, 30
September-3 October. SPE-71505-MS. http://dx.doi.org/10.2118/71505-MS.
Kathel, P. and Mohanty, K. K. 2013. EOR in Tight Oil Reservoirs through Wettability
Alteration. Presented at the SPE Annual Technical Conference and Exhibition,
New Orleans, Louisiana, USA, 30 September-2 October. SPE-166281-MS.
http://dx.doi.org/10.2118/166281-MS.
Kathel, P. 2015. Experiments and Modeling of Wettability Alteration in Low Permeability
Porous Media. PhD Dissertation, The University of Texas at Austin, Austin, Texas
(December 2015).
97
Kazemi, H. 1969. Pressure Transient Analysis of Naturally Fractured Reservoirs with
Uniform Fracture Distribution. SPE Journal 9 (04): 451-562.
SPE-2156-A. http://dx.doi.org/10.2118/2156-A.
Kiani, M., Kazemi, H., Ozkan, E et al. 2011. Pilot Testing Issues of Chemical EOR in
Large Fractured Carbonate Reservoirs. Presented at the SPE Annual Technical
Conference and Exhibition, 30 October-2 November, Denver, Colorado, USA, 30
October-2 November. SPE-146840-MS. http://dx.doi.org/10.2118/146840-MS.
Kiani, M., Alamdari, B. B., and Kazemi, H. 2014. Modeling of Viscous Displacement in
Dual-Porosity Naturally Fractured Reservoirs: Application to Surfactant Enhanced
Oil Recovery. Presented at the SPE Improved Oil Recovery Symposium, Tulsa,
Oklahoma, USA, 12-16 April. SPE-169076-MS.
http://dx.doi.org/10.2118/169076-MS.
Lake, L. W., Johns, R. T., Rossen W. R. and Pope, G. A. 2014. Fundamentals of Enhanced
Oil Recovery. Richardson, Texas, Society of Petroleum Engineers.
Larson, R. G., Davis, H. T., and Scriven, L. E. 1982. Elementary Mechanisms of Oil
Recovery by Chemical Methods. Journal of Petroleum Technology 34 (02): 243-
258. SPE-8840-PA. http://dx.doi.org/10.2118/8840-PA.
Levitt, D., Jackson, A., Heinson, C., Britton, L. N. et al. 2009. Identification and Evaluation
of High-Performance EOR Surfactants. SPE Reservoir Evaluation and Engineering
12 (02): 243-253. SPE-100089-PA. http://dx.doi.org/10.2118/100089-PA.
Li, Y., Lu, J., Churchwell, L., Tagavifar, M. et al. 2016. Scaling of Low IFT Imbibition in
Oil-Wet Carbonates. Presented at the SPE Improved Oil Recovery Conference,
Tulsa, Oklahoma, USA, 11-13 April. SPE-179684-MS.
http://dx.doi.org/10.2118/179684-MS.
Li, K., and Horne, R. N. 2006. Generalized Scaling Approach for Spontaneous Imbibition:
An Analytical Model. SPE Reservoir Evaluation and Engineering 9 (03): 251-258.
SPE-77544-PA. http://dx.doi.org/10.2118/77544-PA.
Li, R. F., Yan, W., Liu, S. et al. 2010. Foam Mobility Control for Surfactant Enhanced Oil
Recovery. SPE Journal 15 (04): 934-948. SPE-113910-PA.
http://dx.doi.org/10.2118/113910-PA
Lu, J., Goudarzi, A., Chen, P. et al. 2014. Enhanced oil recovery from high-temperature,
high-salinity naturally fractured carbonate reservoirs by surfactant flood. Journal
of Petroleum Science and Engineering. 124: 122-131.
doi:10.1016/j.petrol.2014.10.016.
Masalmeh, S. K. 2013. Determination of Waterflooding Residual Oil Saturation for Mixed
to Oil-Wet Carbonate Reservoir and its Impact on EOR. Presented at the SPE
Reservoir Characterization and Simulation Conference and Exhibition, Abu Dhabi,
UAE, 16-18 September. SPE-165981-MS. http://dx.doi.org/10.2118/165981-MS.
98
Mattax, C. C. and Kyte, J. R. 1962. Imbibition Oil Recovery from Fractured, Water-Drive
Reservoir. SPE Journal 2 (02): 177-184. SPE-187-PA.
http://dx.doi.org/10.2118/187-PA
Mirzaei, M. 2013. Imbibition of anionic surfactant solutions into the oil-wet matrix in
fractured reservoirs. PhD Dissertation, The University of Texas at Austin, Austin,
Texas (May 2013).
Mirzaei, M., DiCarlo, D. A. and Pope, G. A. 2016. Visualization and Analysis of Surfactant
Imbibition Into Oil-Wet Fractured Cores. SPE Journal 21 (01): 101-11. SPE-
166129-PA. http://dx.doi.org/10.2118/166129-PA.
Morrow, N. R. 1990. Wettability and Its Effect on Oil Recovery. Journal of Petroleum
Technology 42 (12): 1476-1484. SPE-21621-PA.
http://dx.doi.org/10.2118/21621-PA.
Najafabadi, N. F., Delshad, M., Sepehrnoori K. et al. 2008. Chemical Flooding of Fractured
Carbonates Using Wettability Modifiers. Presented at the SPE Symposium on
Improved Oil Recovery, Tulsa, Oklahoma, 20-23 April. SPE-113369-MS.
http://dx.doi.org/10.2118/113369-MS.
Narr, W. Schechter, D. W., Thompson, L. B. 2006. Naturally Fractured Reservoir
Characterization. Richardson, TX: SPE.
Nelson, R.A. 2001. Geologic Analysis of Naturally Fractured Reservoirs, second edition,
Houston, Texas, Gulf Professional Publishing.
Nelson, R. C., and Pope, G. A. (1978, October 1). Phase Relationships in Chemical
Flooding. SPE Journal 18 (05): 325-338. SPE-6773-PA.
http://dx.doi.org/10.2118/6773-PA.
Nelson, R.C., Lawson, J.B., Thigpen, D.R. et al. 1984. Cosurfactant-Enhanced Alkaline
Flooding. Presented at the SPE Enhanced Oil Recovery Symposium, Tulsa,
Oklahoma, 15-18 April. SPE-12672-MS.
http://dx.doi.org/10.2118/12672-MS.
Reed, R. L., and Healy, R. N. 1984. Contact Angles for Equilibrated Microemulsion
Systems. SPE Journal 24 (03): 342-350. SPE-8262-PA.
http://dx.doi.org/10.2118/8262-PA.
Rodríguez, F., Sánchez J. L. and Galindo A. Mechanisms and Main Parameters Affecting
Nitrogen Distribution in the Gas Cap of the Supergiant Akal Reservoir in the
Cantarell Complex. Presented at the SPE Annual Technical Conference and
Exhibition held in Houston, Texas, 26–29 September, 2004, SPE-90288-MS.
http://dx.doi.org/10.2118/90288-MS.
Roehl, P. O. and Choquette, P. W. 1985. Carbonate Petroleum Reservoirs, 1985 New
York, Springer-Verlag.
99
Pope, G. A., and Nelson, R. C. 1978. A Chemical Flooding Compositional Simulator. SPE
Journal 18 (05): 339-354. SPE-6725-PA. http://dx.doi.org/10.2118/6725-PA.
Pope, G. A. 1980. The Application of Fractional Flow Theory to Enhanced Oil Recovery.
SPE Journal 20 (03): 191-205. SPE-7660-PA. http://dx.doi.org/10.2118/7660-PA.
Pope, G. A., Wu, W., Narayanaswamy, G. et al. 2000 Modeling Relative Permeability
Effects in Gas-Condensate Reservoirs With a New Trapping Model. SPE Reservoir
Evaluation and Engineering 3 (02): 171-178. SPE-62497-PA.
http://dx.doi.org/10.2118/62497-PA.
Rangel-Germán, E. R., Akin, S. and Castanier, L. Multiphase-flow properties of fractured
porous media. Journal of Petroleum Science and Engineering 51 (3-4): 197-213.
doi:10.1016/j.petrol.2005.12.010.
Reiss, L. H. 1980. The Reservoir Engineering Aspects of Fractured Formations. France
Gulf, Editions Technip.
Saidi A. M. 1987. Reservoir Engineering of Fractured Reservoirs, Singapore, Total
Edition Presse.
Saidi, A. M. and Hesselink, F. T. 1982. Method for recovering oil from an underground
formation. US 4364431.
Samaniego-V., F. and Cinco-Ley, H. 1989 Pressure-Transient Analysis for Naturally
Fractured Gas Reservoirs: Field Cases. SPE Formation Evaluation 4 (03): 445-453.
SPE-12010-PA. http://dx.doi.org/10.2118/12010-PA.
Schechter, D.S, Zhou, D. and Orr Jr., F. M. 1994. Low IFT drainage and imbibition.
Journal of Petroleum Science and Engineering 11 (4): 283-300. doi:10.1016/0920-
4105(94)90047-7.
Seethepalli, A., Adibhatla, B. and Mohanty, K. K. 2004. Physicochemical Interactions
During Surfactant Flooding of Fractured Carbonate Reservoir. SPE Journal 9 (04):
411-418. SPE-89423-PA. http://dx.doi.org/10.2118/89423-PA.
Seright, R. S. 2001. Gel Propagation Through Fractures. SPE Prod & Oper 16 (4): 225-
231. SPE-74602-PA. http://dx.doi.org/10.2118/74602-PA.
Sharma, G. and Mohanty, K. K. 2013. Wettability Alteration in High-Temperature and
High-Salinity Carbonate Reservoirs. SPE Journal 18 (04): 646-655. SPE-147306-
PA. http://dx.doi.org/10.2118/147306-PA.
Sorbie, K. S. 1991. Polymer-improved oil recovery. Glasgow: Blackie.
Standnes D. C. and Austad, T. 2000. Wettability alteration in chalk 2. Mechanism for
wettability alteration from oil-wet to water-wet using surfactants. Journal of
Petroleum Science and Engineering 28: 123-143. doi:10.1016/S0920-
4105(00)00084-X.
100
Stoll, M., Hofman, J., Ligthelm, D. J., Faber, M. J., & van den Hoek, P. (2008, June 1).
Toward Field-Scale Wettability Modification—The Limitations of Diffusive
Transport. SPE Reservoir Evaluation and Engineering 11 (03): 633-640.
SPE-107095-PA. http://dx.doi.org/10.2118/107095-P.
Sydansk, R. D. and Romero-Zerón, L. 2011. Reservoir Conformance Improvement.
Richardson, Texas, SPE.
Sydansk, R. D. and Seright, R. S. 2007. When and Where Relative Permeability
Modification Water-Shutoff Treatments Can Be Successfully Applied. SPE Prod
& Oper 22 (02). SPE-99371-PA. http://dx.doi.org/10.2118/99371-PA.
Tagavifar, M., Herath, S., Weerasooriya et al. 2016. Measurement of Microemulsion
Viscosity and Its Implications for Chemical EOR. Presented at the SPE Improved
Oil Recovery Conference, Tulsa, Oklahoma, 11-13 April. SPE-179672-MS.
http://dx.doi.org/10.2118/179672-MS.
Taghavifar, M. 2014. Enhanced Heavy Oil Recovery By Hybrid Thermal-Chemical
Processes. PhD Dissertation, The University of Texas at Austin, Austin, Texas,
(May 2014).
Tie, H. and Morrow, N. R. 2005. Low-Flood-Rate Residual Saturations in Carbonate
Rocks. Presented at the International Petroleum Technology Conference held at
Doha, Qatar, 21-23 November. IPTC-10470-MS.
http://dx.doi.org/10.2523/IPTC-10470-MS.
Treiber, L. E. and Owens, W. W. 1972. A Laboratory Evaluation of the Wettability of Fifty
Oil-Producing Reservoirs. SPE Journal 12 (06): 531-540. SPE-3526-PA.
http://dx.doi.org/10.2118/3526-PA.
A. Nadeeka Upamali, K., Liyanage, P. J., Cai, J. et al. 2016. New Surfactants and Co-
Solvents Increase Oil Recovery and Reduce Cost. Presented at the SPE Improved
Oil Recovery Conference, Tulsa, Oklahoma, 11-13 April. SPE-179702-MS.
http://dx.doi.org/10.2118/179702-MS.
Van Golf-Racht, T. D. 1982. Fundamentals of Fractured Reservoir Engineering,
Amsterdam, Elsevier Scientific Publishing Company.
Walker, D., Britton, C., Kim, D. H. et al 2012. The Impact of Microemulsion Viscosity on
Oil Recovery. Presented at the SPE Improved Oil Recovery Symposium, Tulsa,
Oklahoma, USA, 14-18 April. SPE-154275-MS.
http://dx.doi.org/10.2118/154275-MS.
Warren, J. E., & Root, P. J. 1963. The Behavior of Naturally Fractured Reservoirs. SPE
Journal 3 (03): 245-255. SPE-426-PA. http://dx.doi.org/10.2118/426-PA.
Willhite, P. G. Waterflooding. Richardson, TX, SPE Textbook Series Vol.3.
Winsor, P. A. 1954. Solvent Properties of Amphiphilic Compounds. London: Butterworths
Scientific Publ. Ltd.
101
Witherspoon, P.A., Wang, J.S.Y., Iwai, K. et al. 1980. Validity of Cubic Law for Fluid
Flow in a Deformable Rock Fracture. Water Resources Research 16 (6): 1016-
1024. 80W0685.
Xie, X., Weiss, W. W., Tong, Z. et al. 2005. Improved Oil Recovery from Carbonate
Reservoirs by Chemical Stimulation. SPE Journal. 10 (03): 276-285. SPE-89424-
PA. http://dx.doi.org/10.2118/89424-PA.
Zapata, V. J. and Lake, L. W. 1981. A Theoretical Analysis of Viscous Crossflow.
Presented at the SPE Annual Technical Conference and Exhibition. San Antonio,
Texas, USA, 4-7 October. SPE-10111-MS. http://dx.doi.org/10.2118/10111-MS
Zhang, J., Nguyen, Q. P., Flaaten, A. et al. 2009. Mechanisms of Enhanced Natural
Imbibition with Novel Chemicals. SPE Res Eval & Eng 12 (06): 912-920. SPE-
113453-PA. http://dx.doi.org/10.2118/113453-PA.
Zhang, X., Morrow, N. R., and Ma, S. 1996. Experimental Verification of a Modified
Scaling Group for Spontaneous Imbibition. SPE Reservoir Engineering 11 (04):
280-285. SPE-30762-PA. http://dx.doi.org/10.2118/30762-PA