copyright © 2012 pearson education, inc. publishing as prentice hall. 1 breakeven analysis
TRANSCRIPT

Copyright © 2012 Pearson Education, Inc. Publishing as Prentice Hall.1
Breakeven Analysis

Copyright © 2012 Pearson Education, Inc. Publishing as Prentice Hall.2
Identify how changes in volume affect costs
Use CVP analysis to compute breakeven points
Use CVP analysis for profit planning, and graph the CVP relations
Use CVP methods to perform sensitivity analyses

Copyright © 2012 Pearson Education, Inc. Publishing as Prentice Hall.3
Distinguish between variable costing and absorption costing (see Appendix 19A, located at myaccountinglab.com)

Copyright © 2012 Pearson Education, Inc. Publishing as Prentice Hall.
Identify how changes in volume affect costs
4
11
Copyright © 2012 Pearson Education, Inc. Publishing as Prentice Hall.
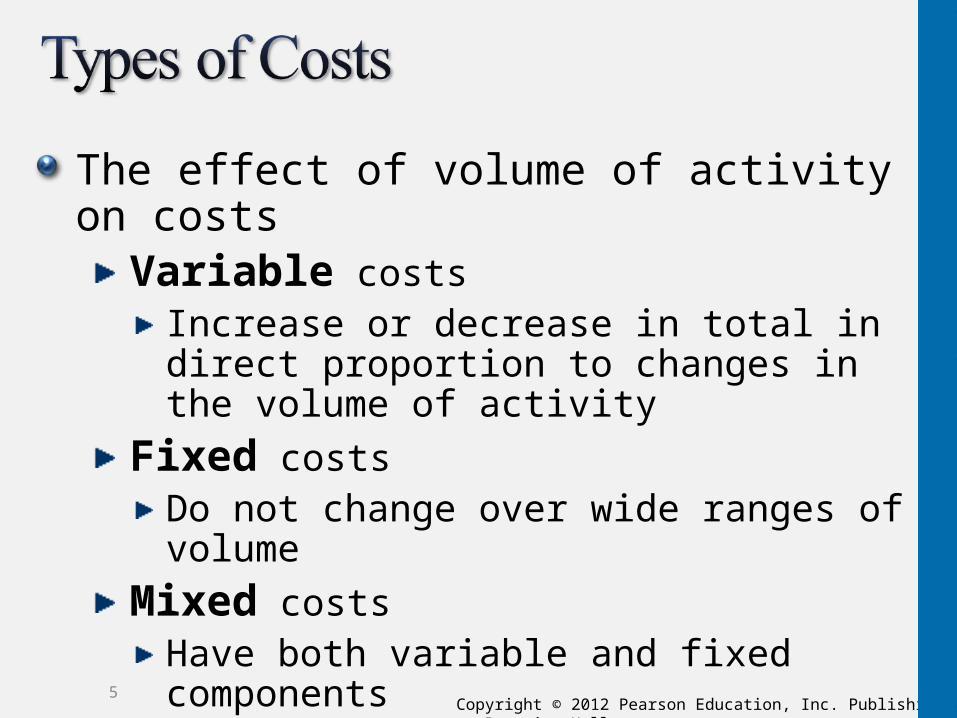
The effect of volume of activity on costsVariable costs
Increase or decrease in total in direct proportion to changes in the volume of activity
Fixed costsDo not change over wide ranges of volume
Mixed costsHave both variable and fixed components
5

Copyright © 2012 Pearson Education, Inc. Publishing as Prentice Hall.
Total variable costs change in direct proportion to changes in the volume of activity
If activity increases, so does the costUnit variable cost remains constant
Volume can be measured in many different ways:
Number of units soldNumber of units producedNumber of miles driven by a delivery vehicleNumber of phone calls placed
6

Copyright © 2012 Pearson Education, Inc. Publishing as Prentice Hall.7

Copyright © 2012 Pearson Education, Inc. Publishing as Prentice Hall.
Tend to remain the same in amount, regardless of variations in level of activityExamples:
Straight-line depreciationSalariesPart-time manager’s salary
Total fixed costs do not change, but the fixed cost per event depends on the number of events
The more activity, the less the fixed cost per unit
8

Copyright © 2012 Pearson Education, Inc. Publishing as Prentice Hall.9

Copyright © 2012 Pearson Education, Inc. Publishing as Prentice Hall.
Have both a fixed and variable componentExample:
Utilities that charge a set fee per month, plus a charge for usage
10

Copyright © 2012 Pearson Education, Inc. Publishing as Prentice Hall.11

Copyright © 2012 Pearson Education, Inc. Publishing as Prentice Hall.
Range of volume: Where total fixed costs remain constant and variable cost per unit remains constant
Outside the relevant range, costs can differ
12

Copyright © 2012 Pearson Education, Inc. Publishing as Prentice Hall.
Philadelphia Acoustics builds innovative speakers for music and home theater systems. Consider the following costs. Identify the costs as variable (V), fixed (F), or mixed (M).
13
1. Units of production depreciation on routers used to cut wood enclosures
2. Wood for speaker enclosures
3. Patents on crossover relays
4. Total compensation to salesperson, who receives a salary plus a commission based on meeting sales goals
5. Crossover relays
V
V
F
M
V

Copyright © 2012 Pearson Education, Inc. Publishing as Prentice Hall.
Philadelphia Acoustics builds innovative speakers for music and home theater systems. Consider the following costs. Identify the costs as variable (V), fixed (F), or mixed (M).
14
6. Straight-line depreciation on manufacturing plant
7. Grill cloth
8. Cell phone costs of salesperson (plan includes 1,200 minutes; overseas calls are charged at an average of $0.15 per minute)
9. Glue
10. Quality inspector’s salary
F
V
M
V
F

Copyright © 2012 Pearson Education, Inc. Publishing as Prentice Hall.
Use CVP analysis to compute breakeven points
15
22

Copyright © 2012 Pearson Education, Inc. Publishing as Prentice Hall.
Expresses the relationships among costs, volume, and profit or lossAnswers:
How many products or services must the company sell to break even?What will profits be if sales double?How will changes in selling price, variable costs, or fixed costs affect profits?
Assumptions:Managers can classify each cost as either variable or fixedOnly factor that affects total costs is change in volume, which increases variable and mixed costs
Fixed costs do not change
16

Copyright © 2012 Pearson Education, Inc. Publishing as Prentice Hall.
Sales level at which operating income is zero:
Total revenues equal total costs (expenses)Sales above breakeven result in a profitSales below breakeven result in a loss
Two methods to compute breakeven point:Income statement approach
Sales revenue − Total costs = Operating income
Contribution margin approachSales revenue – Variable costs = Contribution margin – Fixed costs = Operating income
17

Copyright © 2012 Pearson Education, Inc. Publishing as Prentice Hall.
Express income in equation form and then break it down into its components:
18
Copyright © 2012 Pearson Education, Inc. Publishing as Prentice Hall.
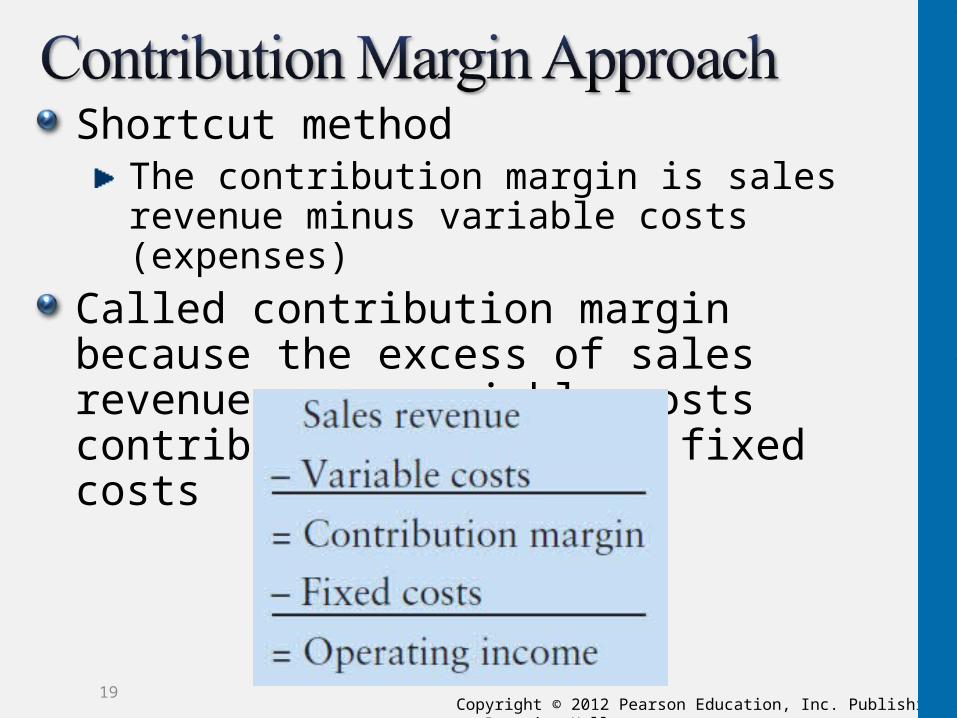
Shortcut methodThe contribution margin is sales revenue minus variable costs (expenses)
Called contribution margin because the excess of sales revenue over variable costs contributes to covering fixed costs
19

Copyright © 2012 Pearson Education, Inc. Publishing as Prentice Hall.
Rearrange the income statement—use the contribution margin to develop a shortcut method
Shortcut equation:
20
Copyright © 2012 Pearson Education, Inc. Publishing as Prentice Hall.
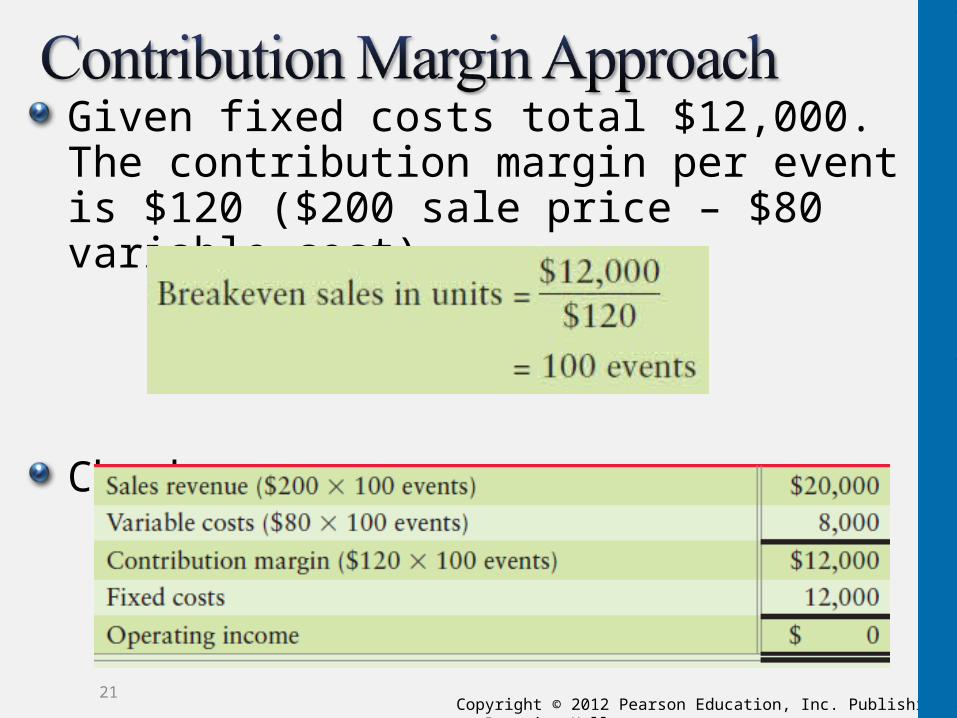
Given fixed costs total $12,000. The contribution margin per event is $120 ($200 sale price – $80 variable cost)
Check your answer
21

Copyright © 2012 Pearson Education, Inc. Publishing as Prentice Hall.
Ratio of contribution margin to sales revenueUsed to compute the breakeven point in terms of sales dollars
Contribution margin is equal to:Sales price – variable cost
Contribution margin divided by sales revenue yields a percentage
Percentage of each dollar of sales revenue that contributes toward fixed costs and profit
22
Copyright © 2012 Pearson Education, Inc. Publishing as Prentice Hall.
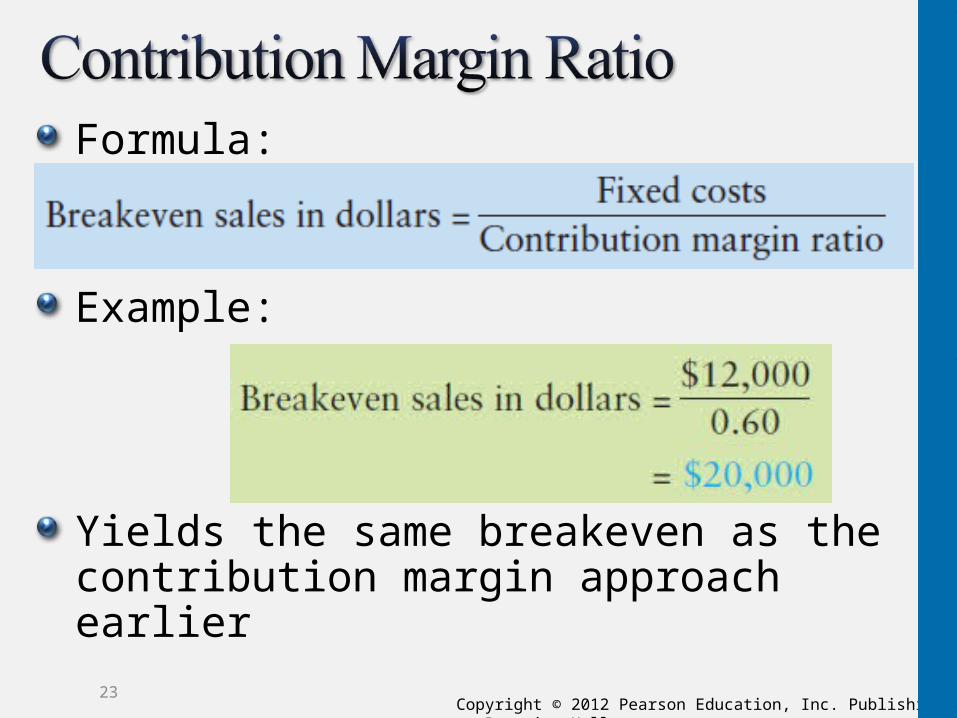
Formula:
Example:
Yields the same breakeven as the contribution margin approach earlier
23

Copyright © 2012 Pearson Education, Inc. Publishing as Prentice Hall.
Story Park competes with Splash World by providing a variety of rides. Story sells tickets at $50 per person as a one-day entrance fee. Variable costs are $10 per person, and fixed costs are $240,000 per month.1. Compute the number of tickets Story must sell to break even. Perform a numerical proof to show that your answer is correct.
24
Units sold = ($240,000 + 0) ÷ ($50 - $10)Units sold = $240,000 ÷ $40 = 6,000 units to breakeven

Copyright © 2012 Pearson Education, Inc. Publishing as Prentice Hall.
Story Park competes with Splash World by providing a variety of rides. Story sells tickets at $50 per person as a one-day entrance fee. Variable costs are $10 per person, and fixed costs are $240,000 per month.1. Compute the number of tickets Story must sell to break even. Perform a numerical proof to show that your answer is correct.
25
Total sales revenue $300,000-Variable cost 60,000 Contribution margin $240,000- Fixed cost 240,000 Operating income $ 0
Copyright © 2012 Pearson Education, Inc. Publishing as Prentice Hall.
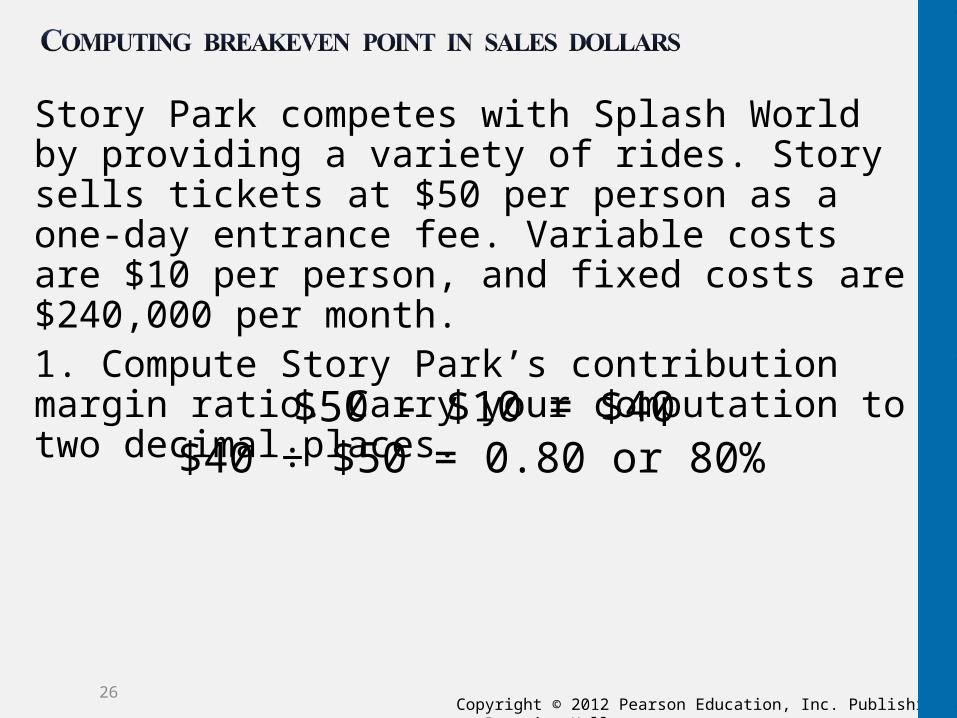
Story Park competes with Splash World by providing a variety of rides. Story sells tickets at $50 per person as a one-day entrance fee. Variable costs are $10 per person, and fixed costs are $240,000 per month.1. Compute Story Park’s contribution margin ratio. Carry your computation to two decimal places.
26
$50 - $10 = $40$40 ÷ $50 = 0.80 or 80%
Copyright © 2012 Pearson Education, Inc. Publishing as Prentice Hall.
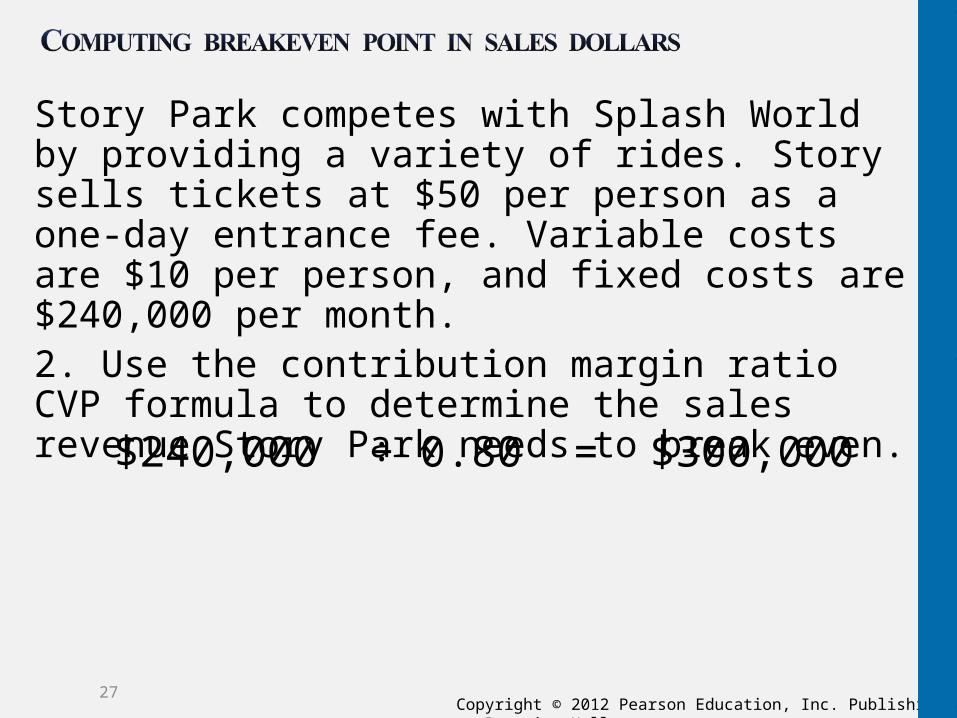
Story Park competes with Splash World by providing a variety of rides. Story sells tickets at $50 per person as a one-day entrance fee. Variable costs are $10 per person, and fixed costs are $240,000 per month.2. Use the contribution margin ratio CVP formula to determine the sales revenue Story Park needs to break even.
27
$240,000 ÷ 0.80 = $300,000

Copyright © 2012 Pearson Education, Inc. Publishing as Prentice Hall.
Use CVP analysis for profit planning, and graph the CVP relations
28
33

Copyright © 2012 Pearson Education, Inc. Publishing as Prentice Hall.
Managers more interested in:Sales level needed to earn a target profitProfits they can expect to earnHow many products or service events must be sold to earn a specific operating profit
Use either methodSet operating profit equal to desired profit
29

Copyright © 2012 Pearson Education, Inc. Publishing as Prentice Hall.
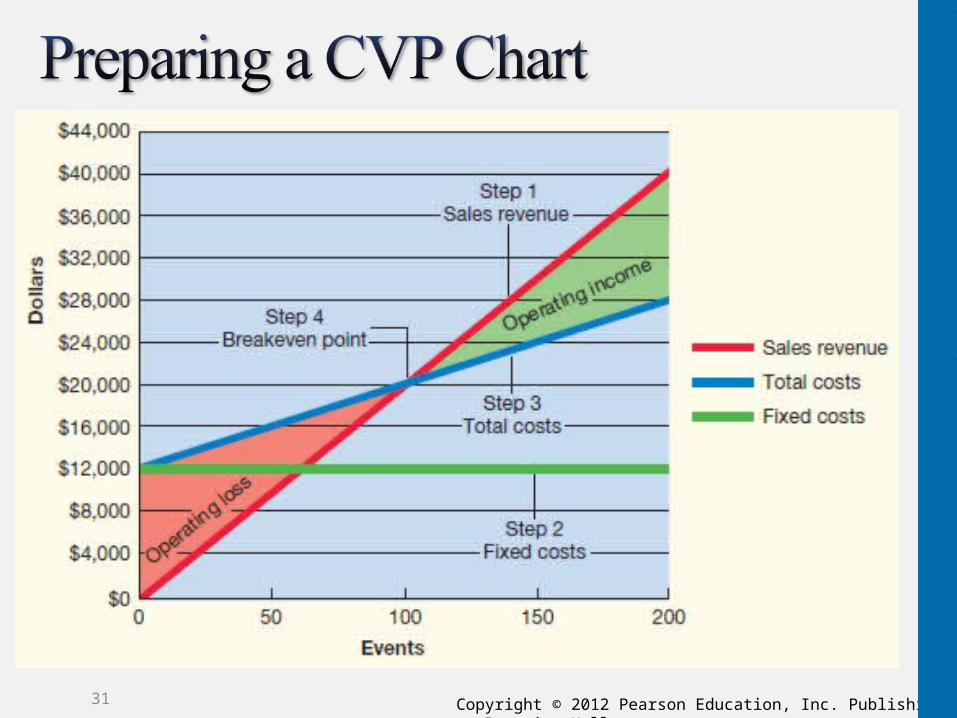
Graph provides a picture that shows how changes in the levels of sales will affect profitsFour steps:1. Choose a sales volume and plot the point for total
sales revenue at that volume2. Draw the fixed cost line3. Draw the total cost line (total costs are the sum of
variable costs plus fixed costs) 4. Identify the breakeven point and the areas of
operating income and loss
30
Copyright © 2012 Pearson Education, Inc. Publishing as Prentice Hall.31
Copyright © 2012 Pearson Education, Inc. Publishing as Prentice Hall.
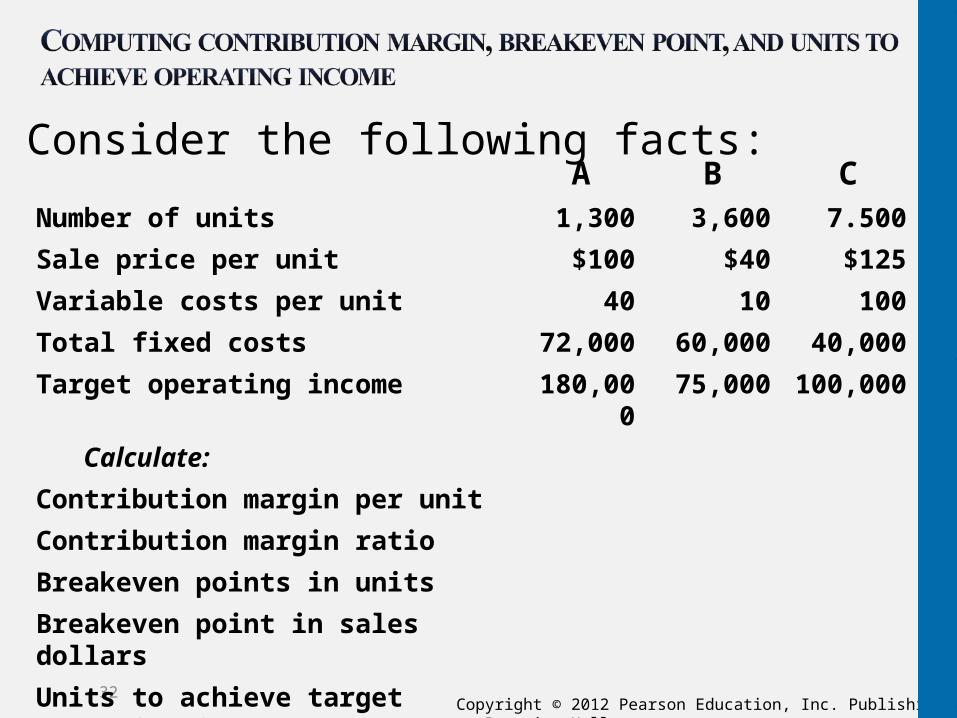
Consider the following facts:
32
A B CNumber of units 1,300 3,600 7.500
Sale price per unit $100 $40 $125
Variable costs per unit 40 10 100
Total fixed costs 72,000 60,000 40,000
Target operating income 180,000 75,000 100,000
Calculate:
Contribution margin per unit
Contribution margin ratio
Breakeven points in units
Breakeven point in sales dollars
Units to achieve target operating income

Copyright © 2012 Pearson Education, Inc. Publishing as Prentice Hall.
Consider the following facts:
33
A B CNumber of units 1,300 3,600 7.,00
Sale price per unit $100 $40 $125
Variable costs per unit 40 10 100
Total fixed costs 72,000 60,000 40,000
Target operating income 180,000 75,000 100,000
Calculate:
Contribution margin per unit $60 $30 $25
Contribution margin ratio 60% 75% 20%
Breakeven points in units 1,200 2,000 1,600
Breakeven point in sales dollars $120,000 $80,000 $200,000
Units to achieve target operating income 4,200 4,500 5,600

Copyright © 2012 Pearson Education, Inc. Publishing as Prentice Hall.
John Kyler is considering starting a Web-based educational business, e-Prep MBA. He plans to offer a short-course review of accounting for students entering MBA programs. The materials would be available on a password-protected Web site; students would complete the course through self-study. Kyler would have to grade the course assignments, but most of the work is in developing the course materials, setting up the site, and marketing. Unfortunately, Kyler’s hard drive crashed before he finished his financial analysis.
However, he did recover the following partial CVP chart:1. Label each axis, the sales revenue line, the total costs line, the fixed costs, the operating income area, and the breakeven point.2. If Kyler attracts 300 students to take the course, will the venture be profitable?3. What are the breakeven sales in students and dollars?
34

Copyright © 2012 Pearson Education, Inc. Publishing as Prentice Hall.
1. Label each axis, the sales revenue line, the total costs line, the fixed costs, the operating income area, and the breakeven point.
2. If Kyler attracts 300 students to take the course, will the venture be profitable?
3. What are the breakeven sales in students and dollars?
35
Sales Revenue
Total Cost
Fixed Cost
Operating
income
Breakeven
Will not be profitable. Possible loss of $8,000
Breakeven at 400 students, $40,000 in sales

Copyright © 2012 Pearson Education, Inc. Publishing as Prentice Hall.
Use CVP methods to perform sensitivity analysis
36
44
Copyright © 2012 Pearson Education, Inc. Publishing as Prentice Hall.
Predict how changes in sale prices, cost, or volume affect profits“What-if?” analysisAllows managers to see how various business strategies affect profits
Changing selling priceChanging variable CostsChanging fixed Costs
37

Copyright © 2012 Pearson Education, Inc. Publishing as Prentice Hall.
How will the lower sale price affect the breakeven point?
Lower price yields higher unit sales to breakevenHigher prices yields lower unit sales to breakeven
38

Copyright © 2012 Pearson Education, Inc. Publishing as Prentice Hall.
How will increased costs affect the breakeven point?
Higher cost yields higher unit sales to breakevenLower cost yields lower unit sales to breakeven
39

Copyright © 2012 Pearson Education, Inc. Publishing as Prentice Hall.
How will the increased fixed costs affect the breakeven point?
Higher fixed costs yields higher unit sales to breakevenLower fixed costs yields lower unit sales to breakeven
40

Copyright © 2012 Pearson Education, Inc. Publishing as Prentice Hall.
Exhibit
41

Copyright © 2012 Pearson Education, Inc. Publishing as Prentice Hall.
Excess of expected sales over breakeven salesCushion, drop in sales, a company can absorb without incurring a lossMargin of safety in units
Margin of safety in dollars
42

Copyright © 2012 Pearson Education, Inc. Publishing as Prentice Hall.
Story Park competes with Splash World by providing a variety of rides. Story sells tickets at $50 per person as a one-day entrance fee. Variable costs are $10 per person, and fixed costs are $240,000 per month.1. Suppose Story Park cuts its ticket price from $50 to $40 to increase the number of tickets sold. Compute the new breakeven point in tickets and in sales dollars.
43
Units sold = ($240,000 + 0) ÷ ($40 - $10)Units sold = $240,000 ÷ $30 = 8,000 units to breakeven
$320,000 sales dollars to breakeven

Copyright © 2012 Pearson Education, Inc. Publishing as Prentice Hall.
Story Park competes with Splash World by providing a variety of rides. Story sells tickets at $50 per person as a one-day entrance fee. Variable costs are $10 per person, and fixed costs are $240,000 per month.2. Ignore the information in Requirement 1. Instead, assume that Story Park increases the variable cost from $10 to $20 per ticket. Compute the new breakeven point in tickets and in sales dollars.
44
Units sold = ($240,000 + 0) ÷ ($50 - $20)Units sold = $240,000 ÷ $30 = 8,000 units to breakeven
= $400,000 in sales dollars

Copyright © 2012 Pearson Education, Inc. Publishing as Prentice Hall.
Story Park competes with Splash World by providing a variety of rides. Story sells tickets at $50 per person as a one-day entrance fee. Variable costs are $10 per person, and fixed costs are $240,000 per month.
1. If Story Park expects to sell 6,200 tickets, compute the margin of safety in tickets and in sales dollars.
45
Expected sales - Breakeven sales = Margin of safety in units6,200 – 6,000 = 200 in units
Margin of safety in units x Sales price = Margin of safety in dollars200 units x $50 = $10,000

Copyright © 2012 Pearson Education, Inc. Publishing as Prentice Hall.
Distinguish between variable costing and absorption costing
46
66
Copyright © 2012 Pearson Education, Inc. Publishing as Prentice Hall.
Absorption costing:Considers fixed manufacturing costs as inventoriable product costs
Variable costing:Considers fixed manufacturing costs as period costs (expenses)
47

Copyright © 2012 Pearson Education, Inc. Publishing as Prentice Hall.
Type of Cost Absorption Costing Variable Costing
Product Costs (capitalized as Inventory until expensed as Cost of goods sold)
Direct materialsDirect laborVariable manufacturing overheadFixed manufacturing overhead
Direct materialsDirect laborVariable manufacturing overhead
Period Costs (expensed in period incurred)
Variable nonmanufacturing costsFixed nonmanufacturing costs
Fixed manufacturing overheadVariable nonmanufacturing costsFixed nonmanufacturing costs
Income Statement Format
Conventional income statement
Contribution margin income statement
48

Copyright © 2012 Pearson Education, Inc. Publishing as Prentice Hall.
Variable costs are those costs that increase or decrease in total as the volume of activity increases or decreases. Fixed costs are costs that do not change over wide ranges of volume. Costs that have both variable and fixed components are called mixed costs.
49
Copyright © 2012 Pearson Education, Inc. Publishing as Prentice Hall.
The breakeven point is the sales level at which operating income is zero—total revenues equal total costs. The breakeven point can be found by using the income statement approach, using zero for operating income. The breakeven point can also be found by dividing total fixed cost by the contribution margin per unit (sales price per unit – variable cost per unit).Breakeven analysis can be used to calculate the sales volume needed to earn a certain amount of profit, called target profit. Target profit is the operating income that results when sales revenue minus variable costs and minus fixed costs equals management’s profit goal.
50

Copyright © 2012 Pearson Education, Inc. Publishing as Prentice Hall.
Graphing various activity levels and costs gives a visual representation of operating levels that generate net income and operating levels that result in net loss.Sensitivity analysis is a “what if” technique that asks what results are likely if selling price or costs change or if an underlying assumption changes. The income statement approach to breakeven is just adjusted for the new proposed values. The margin of safety is the “cushion” or drop in sales that the company can absorb before incurring a loss.
51

Copyright © 2012 Pearson Education, Inc. Publishing as Prentice Hall.
Most companies sell more than one product. Selling price and variable costs differ for each product, so each product makes a different contribution to profits. To calculate break even for each product, we compute the weighted-average contribution margin of all the company’s products. The combination of products that make up total sales, called the sales mix (or product mix), provides the weights that make up total product sales.
52

Copyright © 2012 Pearson Education, Inc. Publishing as Prentice Hall.
Variable costing assigns only variable manufacturing costs to products. Fixed manufacturing costs are considered period costs and are expensed immediately because the company incurs these fixed costs whether or not it produces any products or services. In variable costing, fixed manufacturing costs are not treated as product costs. Management accountants often prefer variable costing because contribution margin is readily apparent on the variable costing income statement.
53

Copyright © 2012 Pearson Education, Inc. Publishing as Prentice Hall.54
Copyright
All rights reserved. No part of this publication may be reproduced, stored in a retrieval system, or transmitted, in any form or by any means, electronic, mechanical, photocopying, recording, or otherwise, without the prior written permission of the publisher. Printed in the United States of America.