coordinated population forecast
TRANSCRIPT

Crook County Urban Growth Boundaries (UGB) & Area Outside UGBs
Through
2015
2065
Coordinated Population Forecast

1
Coordinated Population Forecast for Crook County, its Urban Growth Boundaries (UGB), and
Area Outside UGBs 2015-2065
Prepared by
Population Research Center
College of Urban and Public Affairs
Portland State University
June, 2015
This project is funded by the State of Oregon through the Department of Land
Conservation and Development (DLCD). The contents of this document do not
necessarily reflect the views or policies of the State of Oregon.

2
Project Staff:
Xiaomin Ruan, Population Forecast Program Coordinator
Risa S. Proehl, Population Estimates Program Manager
Jason R. Jurjevich, PhD. Assistant Director, Population Research Center
Kevin Rancik, GIS Analyst
Janai Kessi, Research Analyst
Carson Gorecki, Graduate Research Assistant
David Tetrick, Graduate Research Assistant
The Population Research Center and project staff wish to acknowledge and express
gratitude for support from the Forecast Advisory Committee (DLCD), the hard work of
our staff Deborah Loftus and Emily Renfrow, data reviewers, and many people who
contributed to the development of these forecasts by answering questions, lending
insight, providing data, or giving feedback.

3
How to Read this Report
This report should be read with reference to the documents listed below—downloadable on the
Forecast Program website (http://www.pdx.edu/prc/opfp).
Specifically, the reader should refer to the following documents:
Methods and Data for Developing Coordinated Population Forecasts—Provides a detailed
description and discussion of the forecast methods employed. This document also describes the
assumptions that feed into these methods and determine the forecast output.
Forecast Tables—Provides complete tables of population forecast numbers by county and all sub-
areas within each county for each five-year interval of the forecast period (i.e., 2015-2065). These
tables are also located in Appendix C of this report.

4
Table of Contents
Executive Summary ....................................................................................................................................... 6
Historical Trends ........................................................................................................................................... 8
Population ................................................................................................................................................. 8
Age Structure of the Population ............................................................................................................... 9
Race and Ethnicity ................................................................................................................................... 10
Births ....................................................................................................................................................... 10
Deaths ..................................................................................................................................................... 12
Migration ................................................................................................................................................ 12
Historical Trends in Components of Population Change ........................................................................ 13
Assumptions for Future Population Change ............................................................................................... 15
Assumptions for the County and Larger Sub-Areas ................................................................................ 15
Supporting Information and Specific Assumptions ................................................................................ 16
Forecast Trends ........................................................................................................................................... 17
Forecast Trends in Components of Population Change ......................................................................... 18
Glossary of Key Terms ................................................................................................................................. 21
Appendix A: Supporting Information .......................................................................................................... 22
Appendix B: Specific Assumptions .............................................................................................................. 24
Appendix C: Detailed Population Forecast Results ..................................................................................... 25

5
Table of Figures Figure 1. Crook County and Sub-Areas—Historical and Forecast Populations, and Average Annual Growth
Rates (AAGR) ................................................................................................................................................. 7
Figure 2. Crook County—Total Population by Five-year Intervals (1975-2010 and 2010-2014) .................. 8
Figure 3. Crook County and Sub-areas—Total Population and Average Annual Growth Rate (AAGR) (2000
and 2010) ...................................................................................................................................................... 9
Figure 4. Crook County—Age Structure of the Population (2000 and 2010) ............................................... 9
Figure 5. Crook County—Hispanic or Latino and Race (2000 and 2010) .................................................... 10
Figure 6. Crook County and Oregon—Total Fertility Rates (2000 and 2010) ............................................. 10
Figure 7. Crook County—Age Specific Fertility Rate (2000 and 2010)........................................................ 11
Figure 8. Oregon—Age Specific Fertility Rate (2000 and 2010) ................................................................. 11
Figure 9. Crook County and Sub-Areas—Total Births (2000 and 2010) ...................................................... 12
Figure 10. Crook County and Sub-Areas—Total Deaths (2000 and 2010) .................................................. 12
Figure 11. Crook County and Oregon—Five-year Migration Rates (2000-2010) ........................................ 13
Figure 12. Crook County—Components of Population Change (2000-2014) ............................................. 14
Figure 13. Crook County—Total Forecast Population by Five-year Intervals (2015-2065) ........................ 17
Figure 14. Crook County and Larger Sub-Areas—Forecast Population and AAGR ..................................... 18
Figure 15. Crook County and Larger Sub-Areas—Share of Countywide Population Growth ..................... 18
Figure 16. Crook County—Age Structure of the Population (2015, 2035, and 2065) ................................ 19
Figure 17. Crook County—Components of Population Change, 2015-2065 .............................................. 20
Figure 22. Crook County—Population by Five-Year Age Group ................................................................. 25
Figure 23. Crook County's Sub-Areas—Total Population ........................................................................... 26

6
Executive Summary
Historical
Different growth patterns occur in different parts of the County and these local trends within the
Prineville UGB and the area outside the UGB collectively influence population growth rates for the
county as a whole.
Crook County’s total population has grown slowly since 2000; with average annual growth rates of less
than one percent between 2000 and 2010 (Figure 1); however the area outside the Prineville UGB
experienced more rapid population growth during the 2000s. Prineville, the only UGB, posted an
average annual growth rate of 0.6 percent, while the area outside the UGB grew at an average annual
rate of 1.2 percent during the 2000 to 2010 period.
Crook County experienced substantial swings in net migration throughout the last decade (2000 to
2010), as a result the countywide population growth rate also fluctuated. At the same time an aging
population not only led to an increase in deaths, but also resulted in a smaller proportion of women in
their childbearing years. This along with more women choosing to have fewer children and have them at
older ages has led to a decline in the number of births. The growing number of deaths and shrinking
number of births led to natural decrease—more deaths than births—beginning in 2011. While net in-
migration and natural increase contributed to substantial population growth from 2005 to 2008, both of
these numbers shrank during more recent years—leading to population decline between 2009 and
2012.
Forecast
Total population in Crook County as a whole as well as within its sub-areas will likely grow at a slightly
faster pace in the first 20 years of the forecast period (2015 to 2035) relative to the last 30 years (Figure
1). The tapering of growth rates is largely driven by an expected aging population—a demographic trend
which will lead to declining natural increase (births minus deaths). As natural increase declines,
population growth will become increasingly reliant on net in-migration.
Even so, Crook County’s total population is expected to increase by more than 2,700 over the next 20
years (2015-2035) and by more than 4,500 over the entire 50-year forecast period (2015-2065). The
Prineville UGB is forecast to show slightly stronger population growth—relative to the 2000s— in the
initial 20-year forecast period, but is expected to slow down substantially during the last 30 years. The
area outside the UGB will likely grow at a steadier rate than Prineville throughout the forecast period.

7
Figure 1. Crook County and Sub-Areas—Historical and Forecast Populations, and Average Annual Growth Rates (AAGR)
2000 2010
AAGR
(2000-2010) 2015 2035 2065
AAGR
(2015-2035)
AAGR
(2035-2065)
Crook County 19,182 20,978 0.9% 21,135 23,916 25,640 0.6% 0.2%
Prineville1 10,540 11,213 0.6% 11,256 12,845 13,383 0.7% 0.1%
Outside UGBs 8,642 9,765 1.2% 9,879 11,071 12,257 0.6% 0.3%
Sources: U.S. Census Bureau, 2000 and 2010 Censuses; Population Research Center (PRC)
1 For simplicity the Prineville UGB is referred to by its primary city's name.
Historical Forecast
8
Historical Trends Different growth patterns occur in different parts of the County. Each of Crook County’s sub-areas was
examined for any significant demographic characteristics or changes in population or housing growth
that might influence their individual forecasts. Factors that were analyzed include age composition of
the population, ethnicity and race, births, deaths, and migration. It should be noted that population
trends of individual sub-areas often differ from those of the county as a whole. However, in general,
population growth rates for the county are collectively influenced by local trends within its sub-areas.
Population
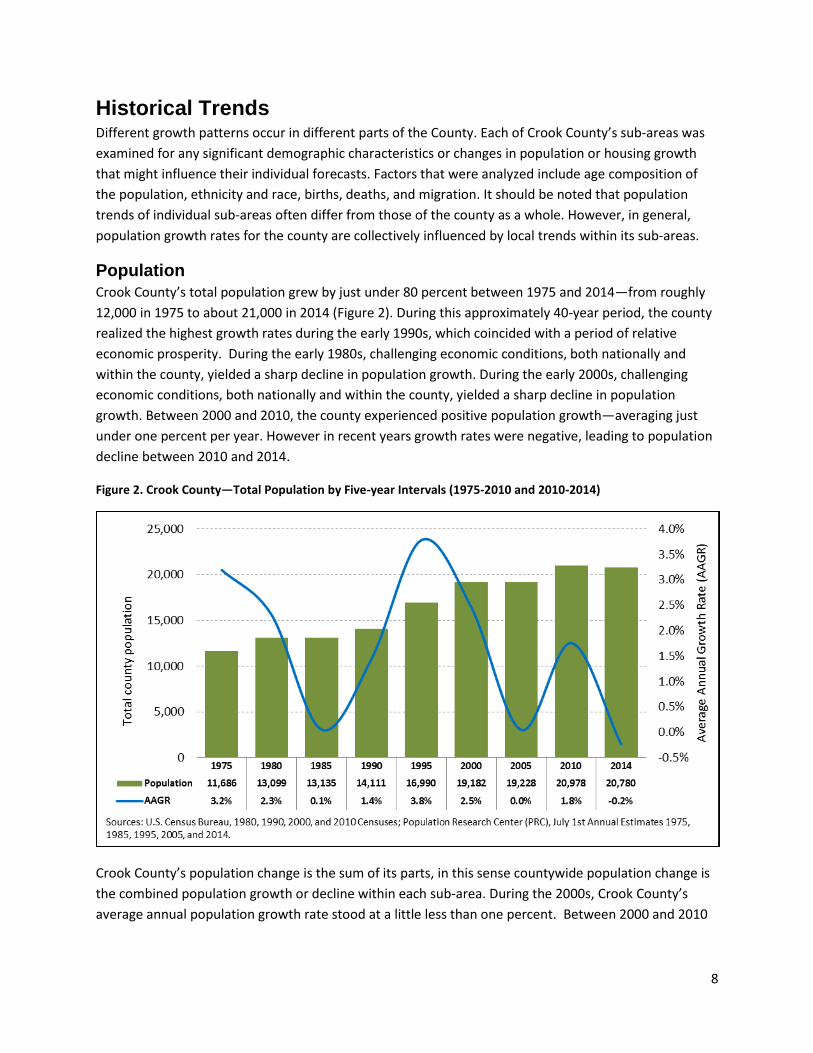
Crook County’s total population grew by just under 80 percent between 1975 and 2014—from roughly
12,000 in 1975 to about 21,000 in 2014 (Figure 2). During this approximately 40-year period, the county
realized the highest growth rates during the early 1990s, which coincided with a period of relative
economic prosperity. During the early 1980s, challenging economic conditions, both nationally and
within the county, yielded a sharp decline in population growth. During the early 2000s, challenging
economic conditions, both nationally and within the county, yielded a sharp decline in population
growth. Between 2000 and 2010, the county experienced positive population growth—averaging just
under one percent per year. However in recent years growth rates were negative, leading to population
decline between 2010 and 2014.
Figure 2. Crook County—Total Population by Five-year Intervals (1975-2010 and 2010-2014)
Crook County’s population change is the sum of its parts, in this sense countywide population change is
the combined population growth or decline within each sub-area. During the 2000s, Crook County’s
average annual population growth rate stood at a little less than one percent. Between 2000 and 2010

9
the Prineville UGB grew more slowly, on average, than the area outside its UGB and as a result it
declined as a share of total countywide population (Figure 3).
Figure 3. Crook County and Sub-areas—Total Population and Average Annual Growth Rate (AAGR) (2000 and 2010)
Age Structure of the Population
Similar to most areas across Oregon, Crook County’s population is aging. An aging population
significantly influences the number of deaths, but also yields a smaller proportion of women in their
childbearing years, which may result in a decline in births. This demographic trend underlies some of the
population change that has occurred in recent years. From 2000 to 2010 the proportion of county
population 65 or older grew from about 15 percent to 20 percent (Figure 4). Further underscoring the
countywide trend in aging—the median age went from about 39 in 2000 to 46 in 2010.1
Figure 4. Crook County—Age Structure of the Population (2000 and 2010)
1 Median age is sourced from the U.S. Census Bureau’s 2000 and 2010 Censuses.
2000 2010
AAGR
(2000-2010)
Share of
County 2000
Share of
County 2010
Crook County 19,182 20,978 0.9% 100.0% 100.0%
Prineville1 10,540 11,213 0.6% 54.9% 53.5%
Outside UGBs 8,642 9,765 1.2% 45.1% 46.5%Sources: U.S. Census Bureau, 2000 and 2010 Censuses1 For simplicity the Prineville UGB is referred to by its primary city's name.

10
Race and Ethnicity
While the statewide population is aging, another demographic shift is occurring across Oregon—
minority populations are growing as a share of total population. A growing minority population affects
both the number of births and average household size. The Hispanic population within Crook County
increased substantially from 2000 to 2010 (Figure 5), while the White, non-Hispanic population
increased by a smaller amount (in relative terms) over the same time period. This increase in the
Hispanic population and other minority populations brings with it several implications for future
population change. First, both nationally and at the state level, fertility rates among Hispanic and
minority women have tended to be higher than among White, non-Hispanic women. Second, Hispanic
and minority households tend to be larger relative to White, non-Hispanic households.
Figure 5. Crook County—Hispanic or Latino and Race (2000 and 2010)
Births
Historical fertility rates for Crook County mirror trends similar to Oregon; while total fertility rates
decreased for both the county and state from 2000 to 2010 (Figure 6), fertility for older women
marginally increased in both Crook County and Oregon (Figure 7 and Figure 8). As Figure 7
demonstrates, fertility rates for younger women in Crook County are lower in 2010 compared to earlier
decades, and women are choosing to have children at older ages. These statistics largely mirror
statewide changes, with total fertility in the county and state remaining below replacement fertility.
Figure 6. Crook County and Oregon—Total Fertility Rates (2000 and 2010)
Hispanic or Latino and Race
Absolute
Change
Relative
Change
Total population 19,182 100.0% 20,978 100.0% 1,796 9.4%
Hispanic or Latino 1,082 5.6% 1,463 7.0% 381 35.2%
Not Hispanic or Latino 18,100 94.4% 19,515 93.0% 1,415 7.8%
White alone 17,532 91.4% 18,758 89.4% 1,226 7.0%
Black or African American alone 6 0.0% 30 0.1% 24 400.0%
American Indian and Alaska Native alone 235 1.2% 273 1.3% 38 16.2%
Asian alone 82 0.4% 96 0.5% 14 17.1%
Native Hawaiian and Other Pacific Islander alone 6 0.0% 11 0.1% 5 83.3%
Some Other Race alone 12 0.1% 12 0.1% 0 0.0%
Two or More Races 227 1.2% 335 1.6% 108 47.6%
Sources: U.S. Census Bureau, 2000 and 2010 Censuses
2000 2010
Total Fertility Rate (TFR)
2000 2010
Crook County 1.98 1.79
Oregon 1.98 1.79Sources: U.S. Census Bureau, 2000 and 2010 Censuses.
Oregon Health Authority, Center for Health Statistics.
Calculations by Population Research Center (PRC).

11
Figure 7. Crook County—Age Specific Fertility Rate (2000 and 2010)
Figure 8. Oregon—Age Specific Fertility Rate (2000 and 2010)
Figure 9 shows the number of births by the area in which the mother resides. Please note that the
number of births fluctuates from year to year. For example a sub-area with an increase in births

12
between two years could easily show a decrease for a different time period; however for the 10-year
period from 2000 to 2010 the county as well as both of its sub-areas saw a decrease in births (Figure 9).
Figure 9. Crook County and Sub-Areas—Total Births (2000 and 2010)
Deaths
While the population in the county as a whole is aging, more people are living longer. For Crook County
in 2000, life expectancy for males was 75 years and for females was 76 years. By 2010, life expectancy
had increased to 78 for males and 81 for females. For both Crook County and Oregon, the survival rates
changed little between 2000 and 2010—underscoring the fact that mortality is the most stable
component of population change. Even so, the total number of countywide deaths increased (Figure
10).
Figure 10. Crook County and Sub-Areas—Total Deaths (2000 and 2010)
Migration
The propensity to migrate is strongly linked to age and stage of life. As such, age-specific migration rates
are critically important for assessing these patterns across five-year age cohorts. Figure 11 shows the
historical age-specific migration rates by five-year age group, both for Crook County and Oregon. The
migration rate is shown as the number of net migrants per person by age group.
From 2000 to 2010, younger individuals (ages with the highest mobility levels) moved out of the county
in search of employment and education opportunities, as well as military service. At the same time
however, the county attracted a substantial number of older migrants—likely moving into the county to
retire or moving closer to family members or to senior care facilities.
2000 2010
Absolute
Change
Relative
Change
Share of
County 2000
Share of
County 2010
Crook County 214 181 -33 -15.4% 100.0% 100.0%
Prineville1 144 121 -23 -16.2% 67.4% 66.9%
Outside UGB 70 60 -10 -13.9% 32.6% 33.1%
Source: Oregon Health Authority, Center for Health Statistics. Aggregated by Population Research Center (PRC).
1 For simplicity the Prineville UGB is referred to by its primary city's name.
2000 2010
Absolute
Change
Relative
Change
Crook County 205 232 27 13.2%
Source: Oregon Health Authority, Center for Health Statistics. Aggregated by Population
Research Center (PRC).

13
Figure 11. Crook County and Oregon—Five-year Migration Rates (2000-2010)
Historical Trends in Components of Population Change
In summary, Crook County’s fluctuating population growth in the 2000s was the direct result of
substantial swings in net migration (Figure 12). Meanwhile an aging population not only led to an
increase in deaths, but also resulted in a smaller proportion of women in their childbearing years. This
along with more women choosing to have fewer children and have them at older ages has led to a
decline in the number of births. The growing number of deaths and shrinking number of births led to
natural decrease—more deaths than births—beginning in 2011. While net in-migration and natural
increase contributed to substantial population growth from 2005 to 2008, both these numbers shrank
during more recent years—leading to population decline between 2009 and 2012.

14
Figure 12. Crook County—Components of Population Change (2000-2014)

15
Assumptions for Future Population Change Evaluating past demographic trends provides clues about what the future will look like, and helps
determine the most likely scenarios for population change. Past trends also explain the dynamics of
population growth specific to local areas. Relating recent and historical population change to events that
influence population change serves as a gauge for what might realistically occur in a given area over the
long-term.
Assumptions about fertility, mortality, and migration were developed for Crook County’s population
forecast as well as the forecasts for larger sub-areas2. The assumptions are derived from observations
based on life course events, as well as trends unique to Crook County and its larger sub-areas. The
forecast period is 2015-2065.
Assumptions for the County and Larger Sub-Areas
During the forecast period, as the population in Crook County is expected to continue to age, fertility
rates will continue to decline. Total fertility in Crook County is forecast to decrease, although only
marginally, from a little more than 1.8 children per woman in 2015 to a little less than 1.8 children per
woman by 2065. Similar patterns of declining total fertility are expected within the county’s larger sub-
areas.
Changes in mortality and life expectancy are more stable compared to fertility and migration. One
influential factor affecting mortality and life expectancy is advances in medical technology. The county
and larger sub-areas are projected to follow the statewide trend of increasing life expectancy
throughout the forecast period—progressing from a life expectancy of 80 years in 2010 to 87 in 2060.
However in spite of increasing life expectancy and the corresponding increase in survival rates, Crook
County’s aging population is expected to result in an overall increase in the number of deaths
throughout the forecast period. Larger sub-areas within the county are expected to experience a similar
increase in deaths as their population ages.
Migration is the most volatile and challenging demographic component to forecast due to the many
factors influencing migration patterns. Economic, social, and environmental factors—such as
employment, educational opportunities, housing availability, family ties, cultural affinity, climate
change, and natural amenities—occurring both inside and outside the study area can affect both
directionality and volume of migration. Net migration rates are expected to change in line with historical
trends unique to Crook County. Net out-migration of younger persons and net in-migration of older
individuals are assumed to persist throughout the forecast period. Countywide, average annual net
migration is expected to increase from 44 net in-migrants in 2015 to 295 net in-migrants in 2035. Over
the last 30 years of the forecast period, average annual net migration is expected to be steadier,
increasing to 314 net in-migrants by 2065. With natural increase diminishing in its potential to
2
County sub-areas with populations greater than 8,000 in the forecast launch year were forecast using the cohort-component method. County sub-areas with populations less than 8,000 in forecast launch year were forecast using the housing-unit method. Crook County had no sub-areas with populations less than 8,000 in forecast launch year. See Glossary of Key Terms at the end of this report for a brief description of these methods or refer to the Methods document for a more detailed description of these forecasting techniques.

16
contribute to population growth, net in-migration will become an increasingly important component of
population growth.
Supporting Information and Specific Assumptions
Assumptions used for developing population forecasts are partially derived from surveys and other
information provided by local planners and agencies. See Appendix A for a summary of all submitted
surveys and other information that was directly considered in developing the sub-area forecasts. Also,
see Appendix B for specific assumptions used in each sub-area forecast.

17
Forecast Trends Under the most-likely population growth scenario in Crook County, countywide and sub-area
populations are expected to increase over the forecast period. The countywide population growth rate
is forecasted to peak in 2030 and then slowly decline throughout the forecast period. Forecasting
tapered population growth is largely driven by an aging population, which is expected to contribute to
an increase in deaths, as well as a decrease in births—fewer women within child bearing years ages 10
to 49. The aging population is expected to contribute to growing natural decrease over the forecast
period. Net migration is expected to remain relatively steady throughout the forecast period, barely
offsetting the declining natural increase. The combination of these factors will likely result in a slowly
declining population growth rate as time progresses through the forecast period.
Crook County’s total population is forecast to grow by a little more than 4,500 persons (21 percent)
from 2015 to 2065, which translates into a total countywide population of 25,640 in 2065 (Figure 13).
The population is forecast to grow at the highest rate—approximately 0.6 percent per year—in the near-
term (2015-2030). This anticipated population growth in the near-term is based on two core
assumptions: 1) Crook County’s economy will continue to strengthen in the near-term, and; 2) an
increasing number of Baby Boomers will retire to the county. The single largest component of growth in
this initial period is net in-migration. More than 2,100 net in-migrants are forecast for the 2015 to 2030
period.
Figure 13. Crook County—Total Forecast Population by Five-year Intervals (2015-2065)
Crook County’s only UGB, Prineville, is forecast to see population growth of nearly 1,600 from 2015 to
2035 (Figure 14)but is expected to grow at a much slower rate during the second half of the forecast

18
period, only adding a little more than 500 people from 2035 to 2065. The Prineville UGB is expected to
decline as a share of total county population over the forecast period.
Population outside the UGB is forecast to grow by nearly 1,200 people from 2015 to 2035, but is
expected to grow at a slower rate during the second half of the forecast period, adding about the same
amount of people (1,200) from 2035 to 2065. The population of the area outside the UGB is forecast to
increase as a share of total countywide population over the forecast period, composing 47 percent of
the countywide population in 2015 and about 48 percent in 2065.
Figure 14. Crook County and Larger Sub-Areas—Forecast Population and AAGR
The Prineville UGB is expected to capture the largest share of total countywide population growth
during the first 20 years of the forecast period (Figure 17); however as population growth decelerates in
Prineville the area outside the UGB will account for the largest share of countywide population growth
as time progresses through the forecast period.
Figure 15. Crook County and Larger Sub-Areas—Share of Countywide Population Growth
Forecast Trends in Components of Population Change
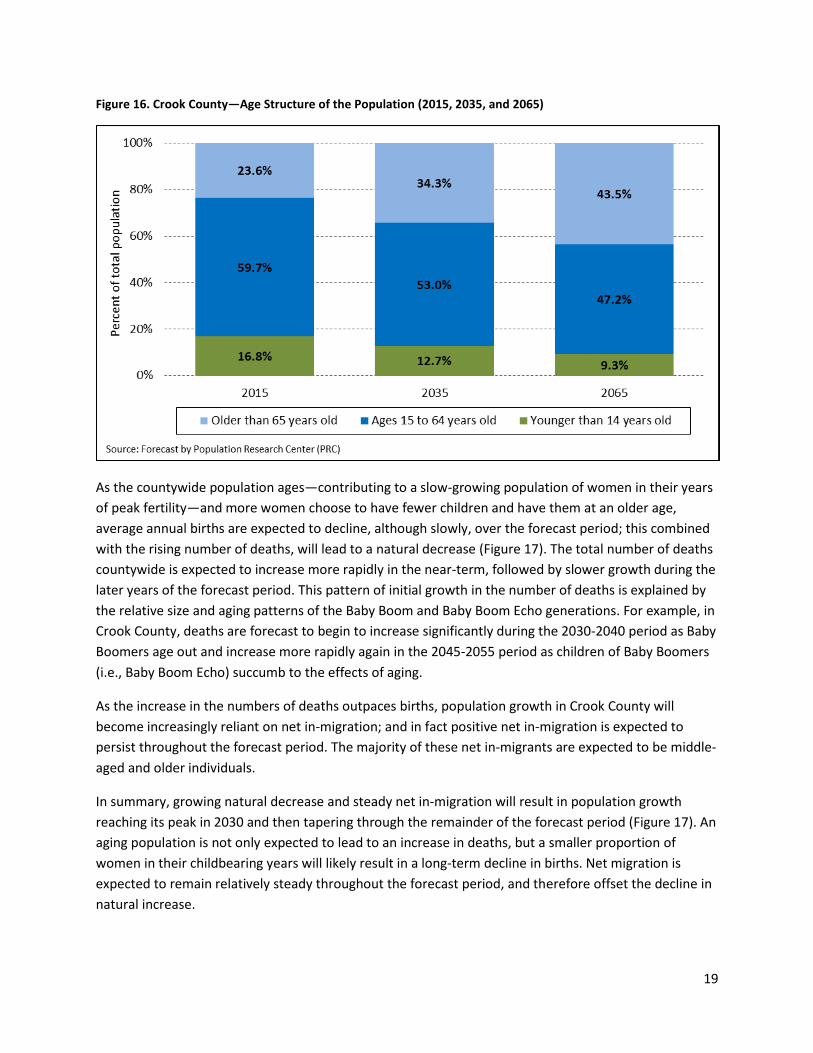
As previously discussed, a key factor in both declining births and increasing deaths is Crook County’s
aging population. From 2015 to 2035 the proportion of county population 65 or older is expected to
grow from a little less than 24 percent to more than 34 percent. By 2065 about 44 percent of the total
population is forecast to be 65 or older (Figure 16). For a more detailed look at the age structure of
Crook County’s population see the final forecast table published to the forecast program website
(http://www.pdx.edu/prc/opfp).
2015 2035 2065
AAGR
(2015-2035)
AAGR
(2035-2065)
Share of
County 2015
Share of
County 2035
Share of
County 2065
Crook County 21,135 23,916 25,640 0.6% 0.2% 100.0% 100.0% 100.0%
Prineville1 11,256 12,845 13,383 0.7% 0.1% 53.3% 53.7% 52.2%
Outside UGBs 9,879 11,071 12,257 0.6% 0.3% 46.7% 46.3% 47.8%
Source: Forecast by Population Research Center (PRC)
1 For simplicity Prineville UGB is referred to by its primary city's name.
2015-2035 2035-2065
Crook County 100.0% 100.0%
Prineville1 57.1% 31.2%
Outside UGBs 42.9% 68.8%
Source: Forecast by Population Research Center (PRC)
1 For simplicity Prineville UGB is referred to by its primary city's name.
19
Figure 16. Crook County—Age Structure of the Population (2015, 2035, and 2065)
As the countywide population ages—contributing to a slow-growing population of women in their years
of peak fertility—and more women choose to have fewer children and have them at an older age,
average annual births are expected to decline, although slowly, over the forecast period; this combined
with the rising number of deaths, will lead to a natural decrease (Figure 17). The total number of deaths
countywide is expected to increase more rapidly in the near-term, followed by slower growth during the
later years of the forecast period. This pattern of initial growth in the number of deaths is explained by
the relative size and aging patterns of the Baby Boom and Baby Boom Echo generations. For example, in
Crook County, deaths are forecast to begin to increase significantly during the 2030-2040 period as Baby
Boomers age out and increase more rapidly again in the 2045-2055 period as children of Baby Boomers
(i.e., Baby Boom Echo) succumb to the effects of aging.
As the increase in the numbers of deaths outpaces births, population growth in Crook County will
become increasingly reliant on net in-migration; and in fact positive net in-migration is expected to
persist throughout the forecast period. The majority of these net in-migrants are expected to be middle-
aged and older individuals.
In summary, growing natural decrease and steady net in-migration will result in population growth
reaching its peak in 2030 and then tapering through the remainder of the forecast period (Figure 17). An
aging population is not only expected to lead to an increase in deaths, but a smaller proportion of
women in their childbearing years will likely result in a long-term decline in births. Net migration is
expected to remain relatively steady throughout the forecast period, and therefore offset the decline in
natural increase.

20
Figure 17. Crook County—Components of Population Change, 2015-2065
21
Glossary of Key Terms
Cohort-Component Method: A method used to forecast future populations based on changes in births,
deaths, and migration over time.
Coordinated population forecast: A population forecast prepared for the county along with population
forecasts for its city urban growth boundary (UGB) areas and non-UGB area.
Housing unit: A house, apartment, mobile home or trailer, group of rooms, or single room that is
occupied or is intended for occupancy.
Housing-Unit Method: A method used to forecast future populations based on changes in housing unit
counts, vacancy rates, the average numbers of persons per household (PPH), and group quarter
population counts.
Occupancy rate: The proportion of total housing units that are occupied by an individual or group of
persons.
Persons per household (PPH): The average household size (i.e., the average number of persons per
occupied housing unit for a particular geographic area).
Replacement Level Fertility: The average number of children each woman needs to bear in order to
replace the population (to replace each male and female) under current mortality conditions in the U.S.
This is commonly estimated to be 2.1 children per woman.

22
Appendix A: Supporting Information Supporting information is based on planning documents and reports, and from submittals to PRC from city officials and staff, and other
stakeholders. The information pertains to characteristics of each city area, and to changes thought to occur in the future. Crook County did not
submit a survey response.
Prineville—Crook County
Observations about Population Composition (e.g.
about children, the elderly, racial ethnic groups)
Observations
about
Housing
(including
vacancy
rates)
Planned
Housing
Development
/Est. Year
Completion
Future Group
Quarters
Facilities
Future
Employers Infrastructure
Promotions
(Promos) and
Hindrances
(Hinders) to
Population
and Housing
Growth;
Other notes
** GIS counted.
4,090 total residential addresses in City Limits.
57.1% owner occupied.
PPH – 2.57 (City Comprehensive Plan)
Owner occupied vacancy rate less than 1%
42.9% tenant occupied.
PPH - 2.51 (City Comprehensive Plan)
Tenant occupied vacancy rate less than 2%
Owner
occupied
housing
vacancy rate
less than 1%.
Tenant
occupied
housing
vacancy rate
less than 2%.
Facebook and
Apple.
Promos:
Hinders:

23
Prineville—Crook County
Current City calculated population – 10,483 persons
** GIS counted.
4,937 residential addresses in City Limits plus UGB.
57.1% owner occupied.
PPH – 2.57
Owner occupied vacancy rate less than 1%
42.9% tenant occupied.
PPH - 2.51
Tenant occupied vacancy rate less than 2%
Current City Limits plus UGB calculated population –
12,384 persons
Highlights or summary of influences on or
anticipation of population and housing growth from
planning documents and studies
Other information (e.g. planning documents, email
correspondence, housing development survey)

24
Appendix B: Specific Assumptions
Prineville
The total fertility rate (TFR) is assumed to decline over the forecast period—although more slowly than
it has historically—from a rate slightly higher than observed in 2010. Survival rates for 2060 are assumed
to be a little below those forecast for the county as a whole. Prineville has historically had slightly lower
survival rates than observed countywide; this corresponds with a slightly shorter life expectancy. Age-
specific net migration rates are assumed to generally follow county historical patterns, but will remain at
slightly higher rates over the forecast period.
Outside UGBs
The total fertility rate (TFR) is assumed to decline over the forecast period—although more slowly than
it has historically—from a rate slightly higher than observed in 2010. Survival rates for 2060 are assumed
to be about the same as those forecast for the county as a whole. Age-specific net migration rates are
assumed to generally follow county historical patterns, but will remain at slightly higher rates over the
forecast period.

25
Appendix C: Detailed Population Forecast Results
Figure 18. Crook County—Population by Five-Year Age Group
Age Group 2015 2020 2025 2030 2035 2040 2045 2050 2055 2060 2065
00-04 983 935 937 929 919 886 839 794 762 736 708
05-09 1,206 1,085 1,046 1,024 1,001 986 950 900 854 821 791
10-14 1,357 1,355 1,235 1,164 1,124 1,094 1,077 1,039 986 938 899
15-19 1,315 1,372 1,395 1,240 1,151 1,106 1,076 1,061 1,025 976 925
20-24 697 793 844 889 785 725 696 679 671 651 617
25-29 886 725 836 910 956 841 777 747 730 723 700
30-34 1,038 984 815 961 1,041 1,091 960 888 856 838 828
35-39 1,176 1,103 1,063 901 1,058 1,144 1,198 1,057 980 947 926
40-44 1,150 1,256 1,198 1,180 996 1,167 1,261 1,324 1,169 1,087 1,048
45-49 1,218 1,260 1,398 1,362 1,338 1,127 1,321 1,432 1,507 1,335 1,239
50-54 1,515 1,346 1,409 1,596 1,551 1,520 1,281 1,506 1,636 1,727 1,528
55-59 1,769 1,701 1,535 1,642 1,855 1,800 1,766 1,493 1,760 1,919 2,023
60-64 1,843 2,014 1,957 1,803 1,924 2,173 2,110 2,079 1,763 2,087 2,275
65-69 1,929 2,142 2,378 2,362 2,173 2,320 2,623 2,556 2,531 2,157 2,555
70-74 1,307 1,662 1,915 2,193 2,287 2,125 2,280 2,591 2,537 2,527 2,153
75-79 848 1,006 1,334 1,590 1,803 2,026 1,876 2,046 2,343 2,312 2,304
80-84 507 575 712 981 1,240 1,429 1,616 1,508 1,660 1,915 1,892
85+ 389 364 396 495 714 983 1,256 1,542 1,688 1,909 2,231
Total 21,135 21,678 22,404 23,222 23,916 24,543 24,962 25,240 25,457 25,604 25,640

26
Figure 19. Crook County's Sub-Areas—Total Population
2015 2020 2025 2030 2035 2040 2045 2050 2055 2060 2065
Prineville UGB 11,256 11,533 11,935 12,416 12,845 13,238 13,472 13,569 13,593 13,536 13,383
Outside UGBs 9,879 10,145 10,470 10,806 11,071 11,305 11,489 11,671 11,864 12,068 12,257

Photo Credit: Chimney Rock area formations along the Crooked River south of Prineville.
(Photo No. croDA0077) Gary Halvorson, Oregon State Archives
http://www.sos.state.or.us/archives/pages/records/local/county/scenic/crook/43.html