cooling tower performance analysis
TRANSCRIPT

Cooling Tower Performance
Analysis
A Novel
Integrated Approach
Ilayaraja Palani
Aditya Birla Mgmt Corp Pvt Ltd

System Description
Design
• Induced draft counter flow
• Flow rate - 2000 m3/hr
• Heat load - 16 Gcal/h
• Wet bulb - 29°C
• Supply Temp - 33 ˚C
• Return Temp - 41 ˚C
• Fill “Munters CF12060”
Operating
• Plant Load - 65%
• CT Thermal Load - 55 %
• Supply Temp - 34.7 ˚C
• Return Temp - 38.2 ˚C
• VFD inline for CT fans
• No flow meter

Problem Statement
For Cooling tower less than 2 years old , Supply temperature remains high at around 35
˚C. Approach of ~ 8 ˚C.
Limits Production ramp up plan.
Plant tried to improve the performance of cooling tower with the CT supplier.
Actions like increasing Blade angle did not yield results.
To augment increase in production, unit decided to invest in additional cell and pumps.
Additional Cell requires Capex of around 1 Cr and increase in load ~ 150 KW
Can we fix it ?

Elements affecting CT Performance
CT Performance
L/G
Water Quality
CW Network
Fills

Graphical analysis of L/G Ratio
Corporate Technical & Energy Services
En
thalp
y
T1 T3 T2
Water Temperature
Psychrometric Chart
Operating Line
L/G is slope. Hot and
cold water temp (T2 and
T1) is the terminal points
Enthalpy Driving
Force
L/G>1.66
L/G=1.66
L/G<1.66
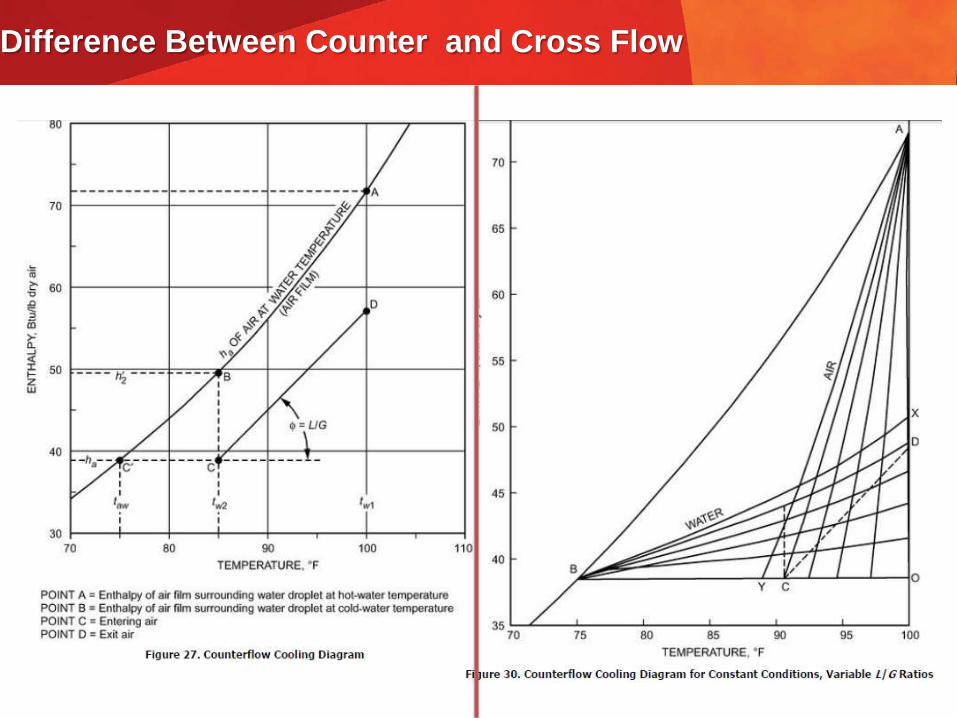
Difference Between Counter and Cross Flow

Difference in NTU for Cross and Counterflow
Wet bulb temp of air 29 C
L/G ratio 1.2
Water in temp 41 C

Measurement & Analysis
Parameters UOM Design Operatin
g
Cooling water Flow m3/hr 2000 2600
Inlet Temperature ͦC 41 38.2
Outlet Temperature ͦC 33 34.7
Range ͦC 8 3.5
Approach ͦC 4 8.7
L/G 1.6 3
Wet Bulb Temperature ͦC 29 26
Design NTU (KaV/L)-1.54
Water Evaporated – kg/hr*(ft3/ft2)
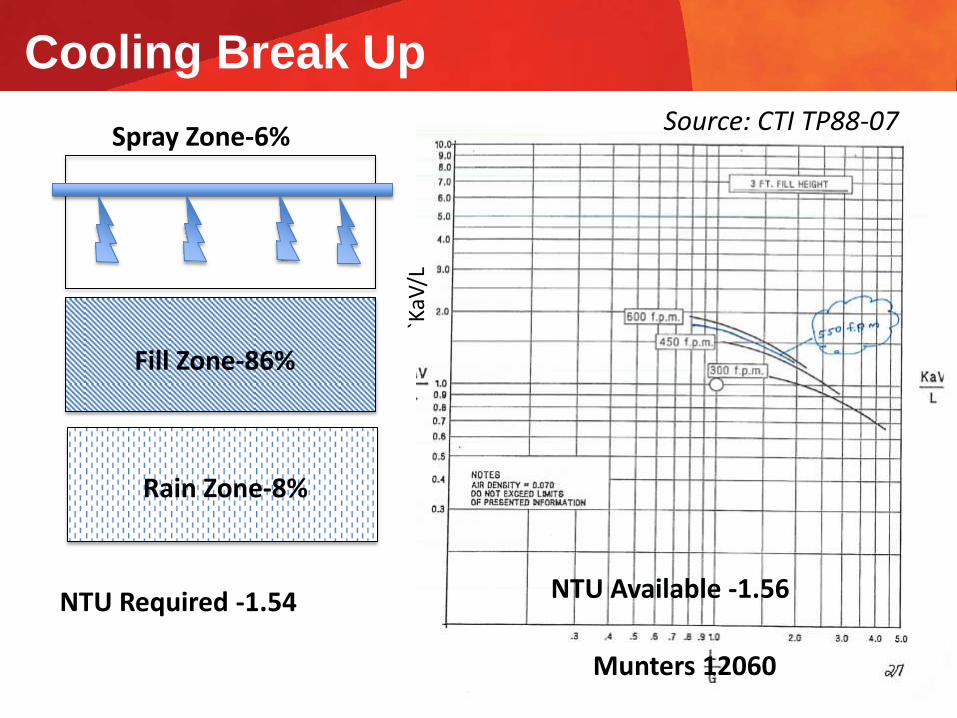
Cooling Break Up
Spray Zone-6%
Fill Zone-86%
Rain Zone-8%
Munters 12060
Source: CTI TP88-07
NTU Required -1.54 NTU Available -1.56
`KaV
/L
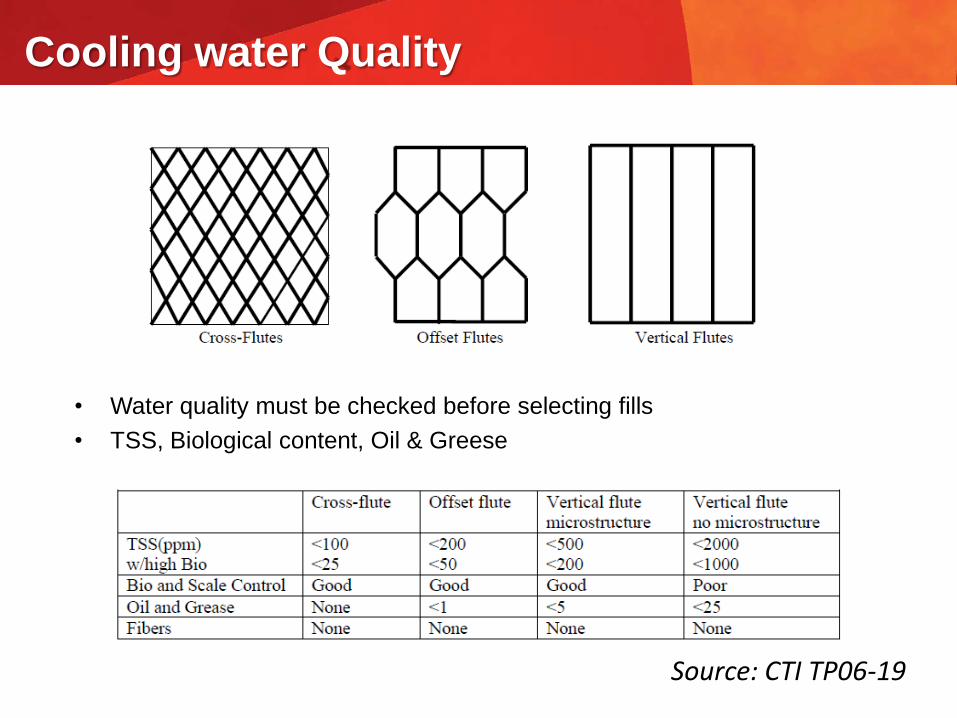
• Water quality must be checked before selecting fills
• TSS, Biological content, Oil & Greese
Cooling water Quality
Source: CTI TP06-19

Corrective Actions & Improvements
Circulation rate reduced from 2600 to 1900 m3/h
Fan VFD is bypassed.
The range is increased from 3.5 to 5°Deg C.
Supply temp improved from 35 to 33.5 deg C.
Cooling tower treatment program to be reviewed.
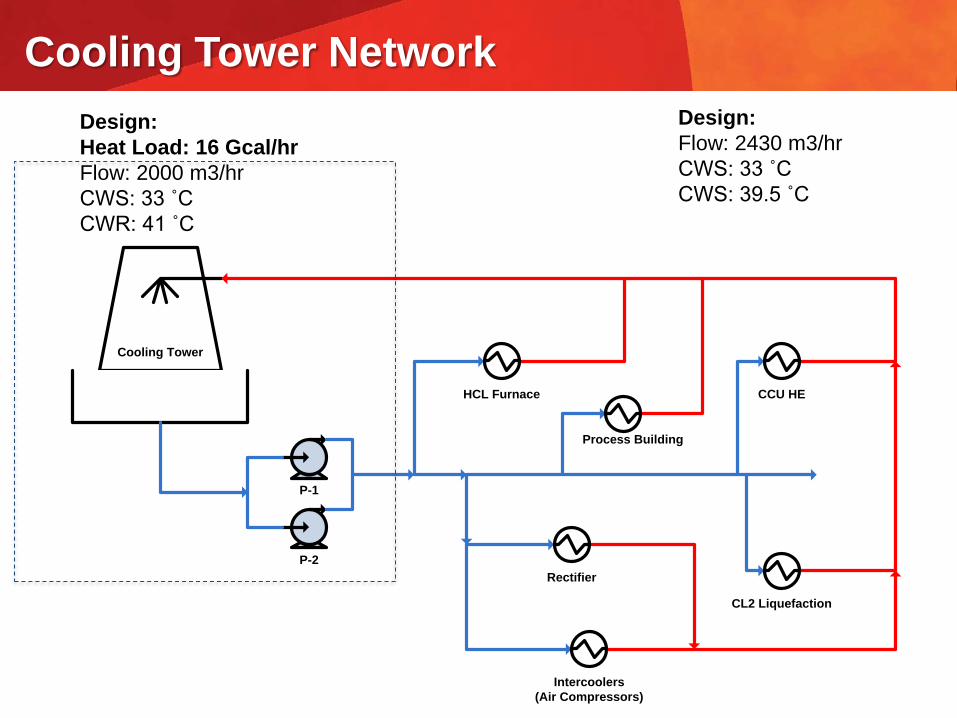
Cooling Tower Network
Cooling Tower
P-1
P-2
HCL Furnace
Process Building
CCU HE
Rectifier
Intercoolers
(Air Compressors)
CL2 Liquefaction
Design:
Heat Load: 16 Gcal/hr
Flow: 2000 m3/hr
CWS: 33 ˚C
CWR: 41 ˚C
Design:
Flow: 2430 m3/hr
CWS: 33 ˚C
CWS: 39.5 ˚C

HE 1
HE 2
HE 3
Parallel Arrangement
HE 1
HE 2 HE 3
Series/Parallel Arrangement
T
T1
T2
Q
Cooling Tower Network

33.00
35.00
36.70
39.48
42.70
32
34
36
38
40
42
44
0 2000 4000 6000 8000 10000 12000 14000 16000 18000
˚C
Qcas (kW)
Composite Curve & CW Supply Line
Composite Curve CW Supply Line Linear (CW Supply Line)
Parameters Existing Proposed Units
Total Heat Load 16 16 Gcal/h Cooling Water Supply Temperature 33.0 33.0 ˚C
Cooling Water Return Temperature 39.5 41.0 ˚C
Cooling Water Flow rate 2430 1960 m3/hr
Potential Reduction in CW Flow Rate 470 m3/hr
Revised CW Return Temp.
Defining The Target

Cooling Tower Network Evolution
Cooling Tower
P-1
P-2
Flow = 2430 m3/hr
CWS = 33 ºC
891 m3/hr
35 m3/hr
153 m3/hr
471 m3/hr
417 m3/hr
461 m3/hr
CWR = 38.2 ºC
HCL Furnace
Process Building
Rectifier
Intercoolers
(Air Compressor)
CCU HE
CL2 Liquefaction
34.5 ˚C
33˚C
Capex saved – 100 lakhs
Opex saved – Rs. 88 Lacs/yr.
Cooling Tower
P-1
P-2
Flow = 1960 m3/hr
CWS = 33 ºC
420 m3/hr
35 m3/hr
153 m3/hr
471 m3/hr
417 m3/hr
461 m3/hr
891 m3/hr
HCL Furnace
Process Building
CCU HE
CL2 Liquefaction
Rectifier
Intercoolers
(Air Compressor)
CWR = 40 ºC
CWR 41 deg C
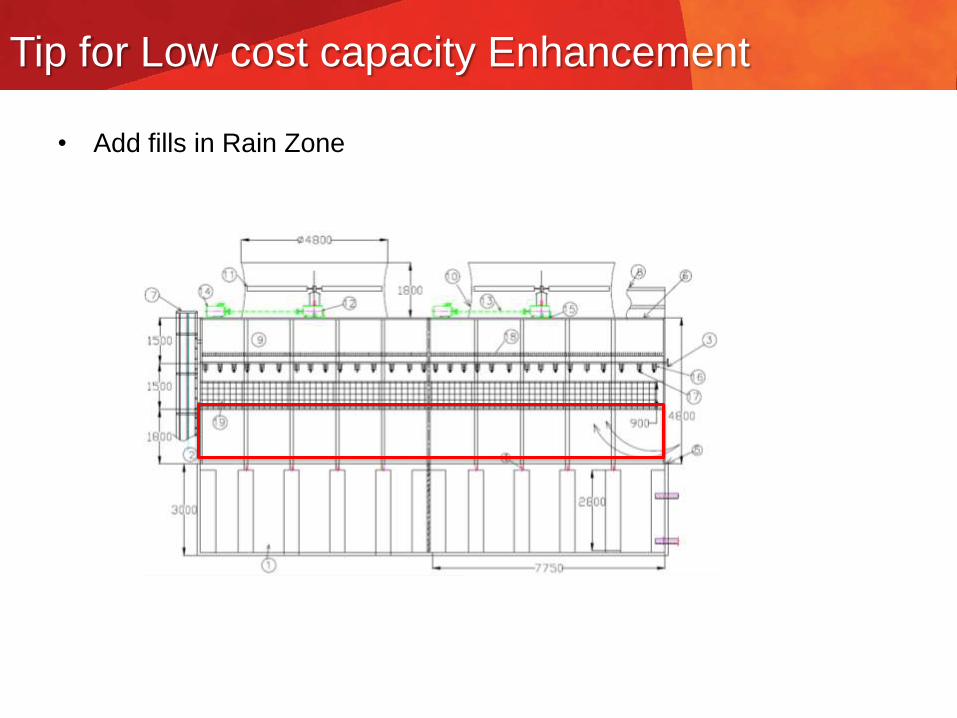
• Add fills in Rain Zone
Tip for Low cost capacity Enhancement
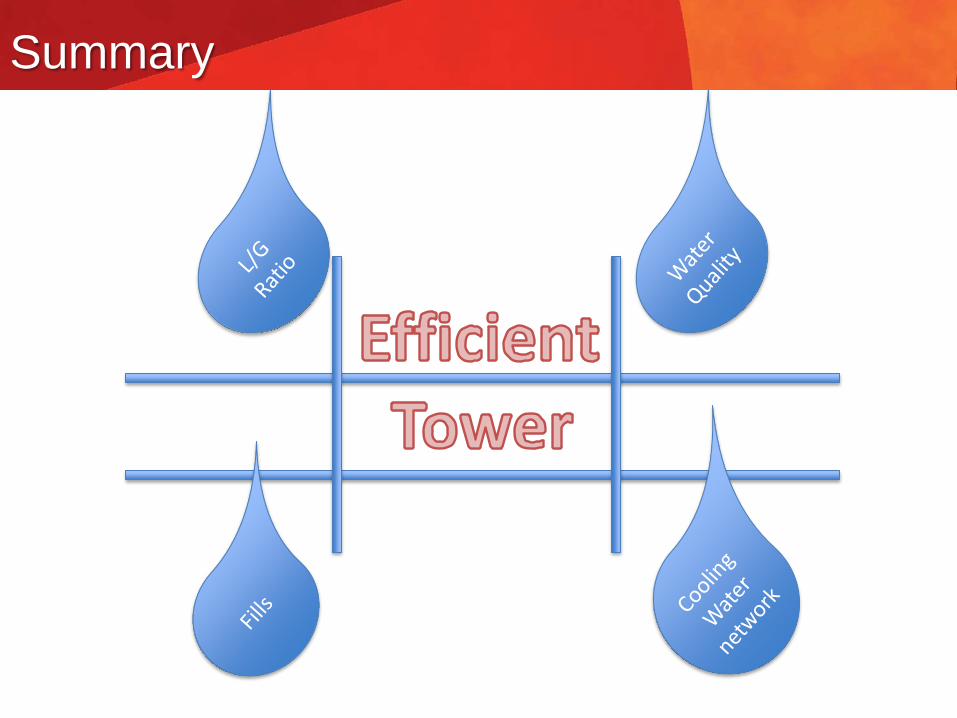
Summary

Thank You.