convective initiation and flow regimes of severe storms across the central high plains scott f....
Post on 21-Dec-2015
220 views
TRANSCRIPT

Convective Initiation and Flow Regimes of Severe Storms
Across the Central High Plains
Scott F. BlairNational Weather Service
Goodland, Kansas

Overview
Goodland County Warning Area19 Counties Served
Overall Purpose
Spatial / Temporal Characteristics of Convective Initiation (CI)
Flow Regime Type Associated With Severe Convection
Scope of Study
Limited to examine severe weather occurring within the GLD CWA
Determine any signals to better anticipate local severe weather traits

Central High Plains

Nebraska
Kansas
Oklahoma
Wyoming
Colorado
New Mexico
Central High Plains
2500
ft
Cheyenne Ridge
Raton Ridge
Palmer DivideGLD CWA

Severe Weather Criteria - Defined
1” Diameter Hail
Remained consistent with current warning operations
50+ Knot Winds All Tornadoes
Severe Weather Climatology (1950 – 2006)
CI / Flow Regime Event Investigations (1997 – 2006)
Built Upon Defined Criteria

Tornado Wind Hail
Total0
500
1000
1500
2000
2500
1950 - 2006 Severe Reports
Total
Severe Weather Climatology1950 – 2006 Severe Reports
688
1713
2504

Tornado Wind Hail
MJJ
Total0
500
1000
1500
2000
2500
1950 - 2006 Severe Reports
MJJ
Total
Severe Weather Climatology1950 – 2006 Severe Reports
688
1713
2504
565
1244
1923

Tornado Wind Hail
MJJ
Total0
500
1000
1500
2000
2500
1950 - 2006 Severe Reports
MJJ
Total
May, June, and July
82% Tornadoes77% Hail73% Wind
76% ALL Severe Weather Occurred May – July
Climatological Three-Month Maximum of Severe Weather
Ten-Year Period (1997–2006) Further Examined
Severe Weather Climatology1950 – 2006 Severe Reports

Convective Initiation
First 45 dBZ echo resolved in 0.5 degree reflectivity to represent initiation
Origin of deep moist convection ultimately producing 1st severe report in GLD CWA
Unlimited domain for the origin of convective initiation
New convection (mergers, clusters, outflow) associated with original activity NOT used
45 dBZ
Severe W
x

Convective InitiationSpatial Distribution
285 Event CasesMay – July (1997-2006)

Convective InitiationSpatial Distribution
285 Event CasesMay – July (1997-2006)
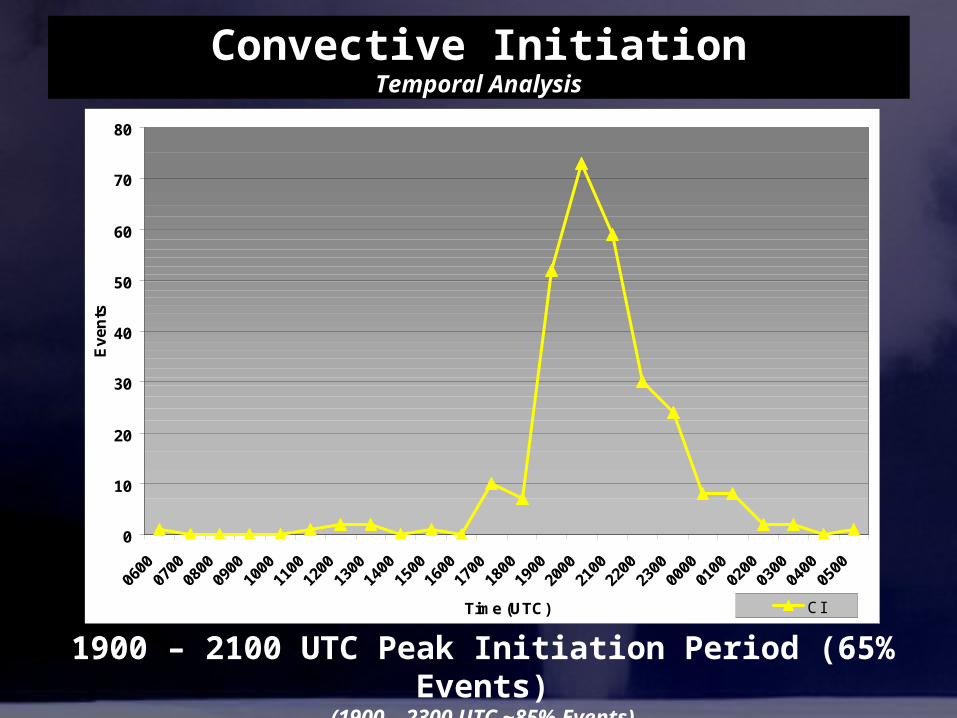
Convective InitiationTemporal Analysis
1900 – 2100 UTC Peak Initiation Period (65% Events)(1900 – 2300 UTC ~85% Events)
0
10
20
30
40
50
60
70
80
0600
0700
0800
0900
1000
1100
1200
1300
1400
1500
1600
1700
1800
1900
2000
2100
2200
2300
0000
0100
0200
0300
0400
0500
Time (UTC)
Ev
en
ts
CI

Convective Initiation vs. 1st Severe
0
10
20
30
40
50
60
70
800
60
0
07
00
08
00
09
00
10
00
11
00
12
00
13
00
14
00
15
00
16
00
17
00
18
00
19
00
20
00
21
00
22
00
23
00
00
00
01
00
02
00
03
00
04
00
05
00
Time (UTC)
Ev
en
ts
0
5
10
15
20
25
30
35
40
CI Tor Wind Hail
Temporal analysis parsed by CI and 1st severe report / type from event day
Con
vect
ive
Initi
atio
n 1st S
evere Report

Convective Initiation vs. 1st Severe
0
10
20
30
40
50
60
70
80
0600
0700
0800
0900
1000
1100
1200
1300
1400
1500
1600
1700
1800
1900
2000
2100
2200
2300
0000
0100
0200
0300
0400
0500
Time (UTC)
Eve
nts
0
5
10
15
20
25
30
35
40
CI Tor Wind Hail
Peak CI Period:1900 UTC – 2100 UTC
Peak 1st Hail Report Period:2200 UTC – 0000 UTC
Peak 1st Tor Report Period:2300 UTC – 0000 UTC
Peak 1st Wind Report Period:2300 UTC – 0100 UTC
Large majority of cases exhibit strong diurnal preference in regards to time of CI and time of 1st resultant severe type
Data suggests greatest operational concern with regards to CI and 1st severe event between 1900 UTC and 0100 UTC

500 mb Flow Regimes
Surrounding Upper Air Sites Utilized Data Stratified by 45 Degree Increments
Investigated 500 mb Flow for Each Event Day
22.5
292.5
247.5
202.5 157.5
337.5
W
NW
N
SW
S
___________________________________________________________________________
Determine any signal that might exist with respect to the origin of severe convection per specific flow regime

500 mb Flow Regimes
Distribution of Events:
West (43%)Southwest (33%)Northwest (20%)
Regime Distribution - Entire Study Period
NSNW
WSW
Preferred flow regimes by month?

500 mb Flow Regimes
1997-2006 Flow Regimes
0.00%
10.00%
20.00%
30.00%
40.00%
50.00%
May June July
South Southwest West Northwest North

500 mb Flow Regimes
NW292.5 - 337.5
W247.5 – 292.5
SW247.5 – 202.5 S
202.5 – 157.5
N337.5 – 22.5
FlowRegimes

500 mb Flow Regimes
NW292.5 - 337.5
W247.5 – 292.5
SW247.5 – 202.5 S
202.5 – 157.5
N337.5 – 22.5
FlowRegimes

Limitations
NCDC National Mosaic Reflectivity ImageryRadar data available every 30 minutes to 1 hour
2 km radar resolution
In-Depth Study Period Restricted
to 10 Year Database
Study Domain Narrowed to Goodland CWA

Closing Remarks
May, June, and July climatological three-month
maximum of severe weather for GLD CWA
~ 285 CI event cases (1997 – 2006)
Spatial distribution CI overall analogous with some
clustering in identifiable topographical locations
Temporal analysis established strong diurnal preference
with regards to CI and 1st resultant severe weather type
Preferred flow regimes were favored in specific geographic locations
Flow regimes tended to transition throughout the
progression of months during the study period

Questions ???
Thank You !
Contact Information:
AcknowledgementsAlbert Pietrycha (SOO – NWS GLD)
NWS Goodland Resources