contrs=row turbo-compressor - cranfield...
TRANSCRIPT

t ~,. o %, (~'<~,.%'.%'~';-I,~ \ - 2 ] : % - ' - ] L J ~ " " ]LT-IV-'Z-EZLL~ i,i,
. ~'~.l~- "~k~t[ . , ! ' £ . , : t...~'a.:=, f2,,.~ a ,z '~ 'Lat- i ,L; ,C' , t ld ~ ',[i (6e0~)
£ . ~ . ~ . W~chnieal P~lao~
, , ... 1 7 . " . ] t £ , ' - Z ...... t ........ g-
d I
i 2J
;~s. li r,
M I N I S T R Y O F S U P P L Y
q
A E R O N A U T I C A L , R E S E A R C H C O U N C I L 'o-":--.:~ ....... '::~ =
R E P O R T S A N D M E M O R A N D A
< I i, L v~ ',, ,,', {2 ~,/'
L O N D O N : HIS M A J E S T Y ' S S T A T I O N E R Y O F F I C E
I 9 5 I
Z,R~rcE I IS 6d N E T
Crow** Copyright Reeerved
Contrs=Row Turbo-compressor .ests By
A. D. B A X T E R , M.ENc . and C. W. R. S M I T H , A.M.I.MEcH.Eo

, -~.,;--.. ~ .~ LT,~; : 2 2 " . ~ ~ ' - - . . . .
Contra-flow Turbo-compressor Tests By
A. D. BAXTER, M.ENG. and C. W. R. SMITH, A.M.I.M~cH.E.
C O M M U N I C A T E D BY T H E PRINCIPAL D I R E C T O R OF SCIENTIFIC R E S E A R C H (AIR), M I N I S T R Y OF S U P P L Y
Reports azd Me~orazcla 737o. 2 6 o7"
J~ze, I 9 4 2
t , . - - . . . . :-;
~' ~ /~ J, -. '~¢ie v 1
Summary.--Several methods of constructing contra-flow turbo-compiessor wheels have been investigated by mechanical tests on single-stage wheels. The results have been incorporated in a complete unit which has been designed and tested at the Royal Aircraft Establishment for research purposes. I t was designed to pass 200 lb/min of air at 25,000 It with a compression ratio of 2-7 : 1 and a temperature at inlet to the turbine of 145 deg C.
In designing, the compressor results from aerofoil cascade tests were extrapolated beyond the limits then covered (1938). Subsequent cascade experiments showed that the compressor efficiency would be low and that the blading used would be stalled under design conditions. Tests on the unit confirmed this, indicating that a compressor efficiency of about 70 per cent was the maximum obtainable, whereas the designed efficiency was 83 per cent, a figure which with present day knowledge is easily obtainable. A slight modification to the compressor-blade heights improved the efficiency and enabled the range of operation to be extended.
In the contra-flow unit the leakage between the shrouds separating the compressor and turbine annuli is a special problem. Owing to the departure from design conditions and the intake air boost the leakage observed on the unit was at times as much as 50 per cent of the entering air. The leakage likely to be obtained in a unit operating under designed conditions is estimated at 4 per cent.
Most Of the remainder of the running time was devoted to investigation of mechanical problems. These included ~che temperature gradients in the wheels, bearing cooling and lubrication, and constructional features. At a gas tem- perature of 400 deg C. the constricting section in the wheel disc caused a drop of temperature of 150 deg C. above the high pressure bearing housing. By increasing the cooling air mass flow this drop was increased to 250 deg C. The bearings were found to be satisfactory provided their temperature could be maintained at less than 200 deg C., but the oil metering supply was unsatisfactory. Some movement of the blades in the rotors was observed and relative axial expansion of t.he rotors andcasing led to rubbing at the high-pressure end. Trouble was also experienced with the large gland leakage areas at the shrouds and around the bearing housings.
I t was concluded that, in spite of the poor aerodynamic performance, there was no fundamental reason why similar units should not operate efficiently and why a good mechanical performance should not be obtained.
1. Introductio~¢.--The contra-flow type of tarbo-compressor combines the high efficiency of an axial compressor with the high efficiency of a multistage turbine and should, therefore, be an advance on the conventional type of turbo-compressor m which a centrifugal supercharger is driven by a single-stage turbine of comparatively low efficiency. Its theoretical advantages make it of considerable interest both as an exhaust-driven aero-engine supercharger and as an internal-combustion turbine.
In order to investigate the practical possibifities of this type of unit various designs of single- stage wheel were tested and a complete turbo-compressor constructed. This note describes the work on these items and the conclusions reached.
* R.A.E. Reports, E.3945 and E.3829--received 1st August, 1942.
1 (96514) A

2. Single-stage Wheels.--One .of the chief problems in the contra-flow type of turbo-com- pressors is tha t of producing mechanically reliable wheels capable of withstanding the high gas temperatures on the turbine side and avoiding distortion due to thermal stresses set up while running. To solve this problem, investigation has been made of various possible methods of constructing wheels and three of the more promising designs have been built and tested.
2.1. Descriptio~ of Wheels.--Sections of the three types of wheel tested are shown in Fig. 1. They have been designated respectively as (a) shrunk-ring type, (b) expansion-ring type, (c) inserted-blade type, and their main features are described below.
Each wheel consisted of a set of turbine blades and a set of compressor blades mounted on a hub which could rotate freely on a ball bearing. Hot gases flowed in one direction through the turbine blading, driving the wheel and causing the compressor blading to pump cold air in the opposite direction. In the designs tested the compressor blades were fixed to the hub and the turbine blades fitted outside them, but this was not an essential feature and the blading positions could be reversed without detriment to the performance. The blades were not designed for aerodynamic efficiency as the tests were purely mechanical, and in order to simplify manufacture, they were merely straight radial slabs machined at an angle to the plane of the wheel.
The fixing of the blades to each other and to the hub i n a mechanically sound manner and accommodation for differential expansion between tt~em were the chief aims of the designs and the methods adopted are shown in Fig. 1.
2.1.1. Shru~ck-ri~g Type.--The compressor blades were made integral with a duralumin hub and the turbine blades were machined from a solid ring of heat resisting steel. A second ring of nickel-chrome steel tapered on its inner diameter was shrunk on to the tips of the compressor blades. Five equally spaced pegs were inserted in this ring to centralise the turbine ring and limit the heat transfer from it. The turbine ring was not restrained radially and could expand as the temperature increased without affecting the inner ring or compressor blades. S m a l l projections on the inner diameter of the turbine ring and outer diameter of the shrunk ring fitted close together and iormed a gland which prevented leakage and circulation of hot gases or air between the rings.
The drive was transmitted through the pegs to the shrunk ring and thence through the compressor blades. The ring relied upon its shrinkage fit to t ransmit the torque and conse- quently its temperature relative to the compressor blades and the hub was important. Too high a temperature would reduce the grip and too low would result in crushing of the blades.
2.1.2. Expansion-ring Type.--This type was similar to the previous one in that the compressor blades were integral with a duralumin hub and the turbine blades were integral with a ring of heat resisting steel, but the connection between them was different. A duralumin ring surrounded the compressor blades and could be fixed by shrinkage or pegging. In the test wheel it was integral with the blades. An expansion ring of forged steel (K.E. 965) was hooked at one end into grooves in the turbine blade ring at a number of points and similarly at the other end into the compressor.ring. Thin projecting sections of these rings were peened over to secure the expansion ring in position.
This type limited the heat transmission to a low value but involved the machining and bending of thin sections of metal. The material (Rex 78) of the turbine wheel would not permit this and it was necessary to spline into it a ring of K.E. 965 to hold the expansion ring.
2.1.3. f~serted-blade Type.--In this design the hub was of carbon steel and the compressor and turbine blades of heat resisting steel. Each turbine blade was integral with a compressor blade and separated from it by a straight shroud. The compressor blade roots were dovetailed and keyed into axial slots in the hub where they were held in position by peening over metal on the hub~ When the blades were in position the shrouds formed a continuous ring which separated the air passage from the gas passage except for circumferential clearance left at the tips of each shroud to allow for expansion.
2

This type had the disadvantage of permitting a direct transfer of heat f romthe turbine to the compressor blading and so heating the air. The hub was much heavier than in the other cases and there was a danger of the unsupported tips of the shrouds opening outwards when subjected to centrifugal loading.
2.2. Test Arrangements.--The layout of the test rig is shown in Fig. 2. The wheel to be tested was mounted on a peg shaft held in a special casting. The hot gases were fed to the wheel through an annular discharge passage in the casting from a volute connected to a com- bustion chamber similar to that developed for gas turbines• The mass flow and temperature could be accurately controlled by air and fuel valves. Because of the inefficient blading it was necessary to blow air through the compressor blades and 'a large fan was used for this purpose. The air mass flow could be adjusted by the speed of the fan and it was kept approximately equal to the gas mass flow.
The gas temperature was measured immediately before the wheel by a chromel-alumel thermocouple inserted in the annular discharge passage. The position of the couple was selected so tha t the mean temperature was recorded. Readings taken around the annulus before the wheels Were mounted indicated that the temperature variation was at no point more than -¢- 15 deg C. from the mean. This variation had no effect on the rotating wheel which took up a temperature corresponding to the mean gas temperature as indicated by the thermocouple.
The speed of the wheel was measured by an electronic method because of the difficulties of fitting a mechanical tachometer. Electric impulses were recorded by a photocell when rays of light directed on it were interrupted during par t -of each revolution. The impulses were transmit ted to a cathode-ray oscilloscope, by which their rate was counted and the speed of. the wheel in r.p.m, deduced.
Oil was supplied to the bearing by a drip feed and a thermocouple was fixed against the stat ionary inner race to give some idea of its temperature• This temperature was higher than would occur in practice because of the heavy ribs of the test rig casting which permitted considerable heat transmission from the discharge annulus direct to the centre shaft.
2.3. Test Results.--The wheels were first rotated by cold air up to approximately half the designed speed to observe whether any distortion or weakness was apparent due to centrifugal force alone. After inspection hot gases were used to drive the wheels at low speeds. The gas temperatures were increased by steps and runs made to observe the effect of temperature. At the conclusion of each run the wheels were examined superficially at their critical points for signs of movement or distortion• Finally with the maximum temperature, the speed was increased by steps until trouble was encountered or the design conditions were achieved. Accurate measurements of dimensions were made before running and after the finM run.
The most severe conditions tha t the wheels were subjected to are summarised in the following table :
Gas temp Speed Remarks Wheel deg C. r.p.m.
• . Shrunk ring ..
Expansion ring ..
Inserted blade ..
550 460
660
750 755
3,350 8,000
7,500
12,000 15,000
Ring became loose
Designed conditions--satisfactory
Satisfactory 15 per cent overspeed~satisfactory
Measurements of bearing temperatures were also made, but have not been included in the table as t h e y were greatly influenced by the ratio of gas and air mass flows, air temperature
3 (96514) A 2

r
and heat transmission through the rig. The highest temperature observed was 120 deg C. and it was apparent that in a properly designed unit with the turbine blading outside, no bearing trouble should arise from overheat ing .
2.3.1. Shrunk ring.--The designed speed of this wheel was 13,000 r.p.m, which corresponded to the turbine blade tip speed of 485 ft/sec. A total of 17½ hours running was completed; but the maximum speed attained was 8,000 r.p.m, with a gas temperature of 460 deg C. During the running at low speed and a temperature of 550 deg C. the shrunk ring became slack and moved back on the tapered compressor blade tips so that on cooling it was quite loose. After re-shrinking in the correct position, evidence of loss of the interference fit while running was observed on several occasions although, after careful reduction of the temperature and speed, the ring became t ight again on cooling.
In order to obtain some idea of the relative temperatures of the various parts of the wheel a test was carried out with the wheel locked. Approximately constant and equal flows of com- pressor air and turbine gas were passed through the wheel. The air temperature was 45 deg C. and the gas temperature was varied from 270 deg C. to 720 deg C. Measurements of temper- ature were made at the points indicated in Fig. 1 (a). Number 1 thermoconple was inserted in the metal at the root of the turbine blades, number 2 in the shrunk ring and number 3 at the
roo t of the compressor blades. The results of these measurements are shown graphically in Fig. 3. The bearing temperature has been included and it will be noted that it was higher than the compressor hub temperature, thus indicating that it was receiving heat through the 'casing ribs and central shaft. At the highest gas temperature the compressor hub temperature fell away due to loss of the shrinkage contact with the steel ring. In view of the difficulty of maintaining the fit no further running was done.
2.3.2. Expansion ring.--A turbine wheel with an outer shroud was available for this design and was incorporated. I t limited the safe speed to 8,000 r.p.m, and the bending stress in the expansion ring limited the temperature to 650 deg C. A total of 6~ hours running was completed including one hour at 7,500 r.p.m, and 660 deg C. gas temperature, without incident.
Examination and measurement after completion of the test showed that the turbine ring had moved axially 0. 004 in. relative to the compressor ring. This might be due to slight distortion of the expansion ring, but this was not observable by eye. In all other respects the wheel was in good condition.
2.3.3. Inserted Blade.--This type had the same tip diameter as the shrunk ring wheel and was designed for the same speed of 13,000 r.p.m. The tests extended over 10~ hours during which a 15 per cent overspeed run was made at 15,000 r.p.m, and 750 deg C. for a period of 2 hours. No trouble was experienced and the general condition of the wheel on completion of the test was good. The blades were firmly fixed both radially and axially, but measurements indicated that they had moved radially outwards some 0.003 to 0-004 in. This was probably
d u e to the root fixings bedding down in the hub under centrifugal load. The unsupported tips of the shrouds had lifted slightly relative to the blade roots, the average lift being 0.004 in.
2.4. Conclusions.--The inserted-blade type was the most satisfactory from the mechanical point of view. The heat transmission between the gas and air was probably greater than in the other wheels, but the design was less complicated and no weakness was apparent at high temperatures and speeds.
The expansion-ring wheel also was satisfactory but the gas temperature was limited by the allowable bending stress in the expansion member. This is dependent on the width of the wheel and might prove a severe restriction.
In the shrunk-ring design the expansion and drive between the turbine wheel and shrunk ring were taken up without trouble by the pegs, but the fixing of the steel ring to the duralumin compressor blades was unsatisfactory because of the difficulty of maintaining the shrinkage fit at varying temperatures.
4

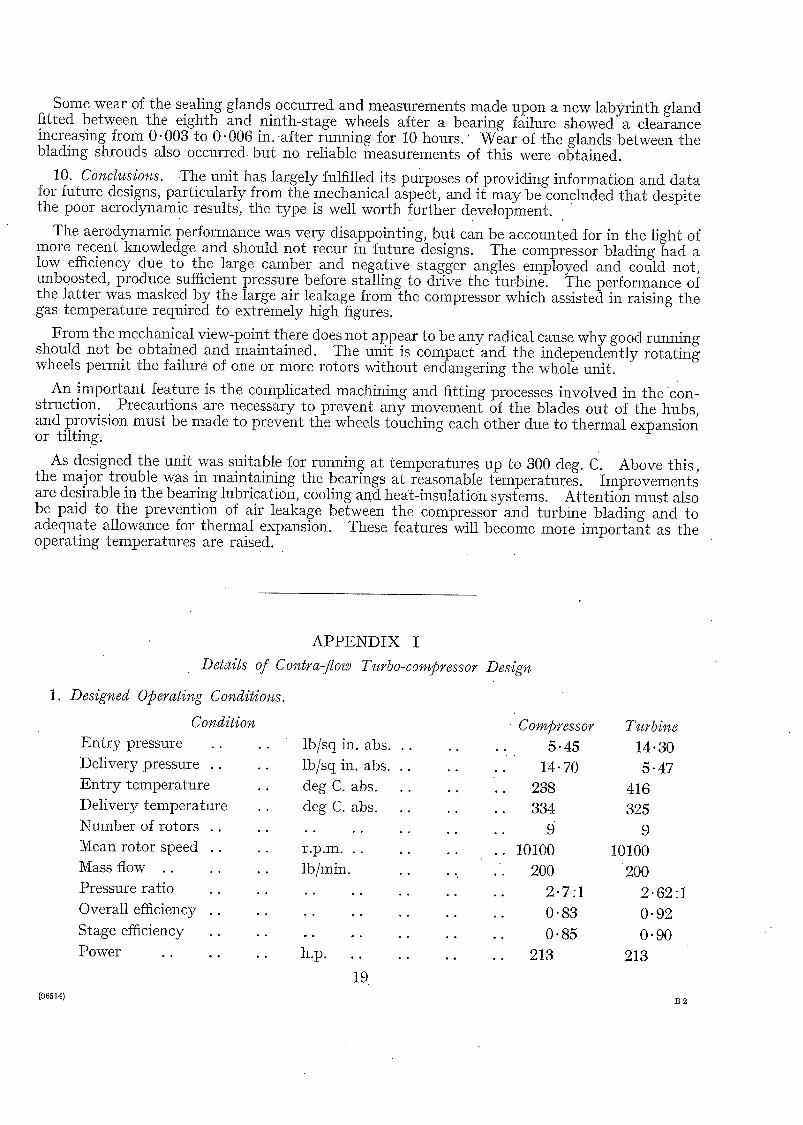
3. Design of Turbo-compressor.--Following the single-wheel tests, a turbo-compressor unit was designed as an exhaust driven supercharger to deliver 200 lb/min of air at a rated altitude of 25,000 ft, the compressor pressure ratio being 2.7 : 1. The gas temperature at entry to the turbine was to be 145 deg C. and the mean rotational speed of all stages just over 10,000 r.p.m.
3.1. Descriptio~.--The unit is shown in section in Fig. 4. I t consists of nine independently rotating wheels mounted on ball bearings fitted to a central shaft. Each wheel rotates in the opposite direction to its neighbours and carries two tiers of blading, one turbine blading and one compressor blading. The two blading annuli are separated by shrouds so that in effect two axial annular flow passages are formed through the unit. The air flows in one direction through the outer annulus of compressor blading and the gas flows in the opposite direction through the inner annulus of turbine blading. Each wheel is thus a separate and independent turbo-compressor.
The shaft on which these wheels rotate is held in end castings of austenetic steel. I t is locat'ed in the low pressure end casting and free to move axially in the high pressure end. The two ends are connected, by a light alloy-casing with axial strengthening ribs. Drilled bosses are provided over the first, fifth and eighth stage wheels into which capacity pick-up plugs are fitted for speed measuring purposes. An external photographic view of the casing and pick-up plugs assembled with the end castings and the faired gas entry and exit noses is shown in Fig. 5. The high pressure end-piece is formed from two castings with a small annular gap between them to permit differential expansion of the parts exposed to air and gas. The parts are located by six
'radial. pins screwed into the outer member and fitted in reamered holes in the inner member. Guide blades for the compressor and turbine entries are provided and fixed to the end casings.
The rotor blades are made of KE 965 steel. Each compressor blade is integral with a turbine blade and separated from it by the shroud. The turbine blade roots form segments of a ring with serrated extensions below, which key into axial grooves cut in the hub ring. When assembled the shrouds and roots form continuous rings. The blades are held in position axially by l ight centre-punch marks over the hub ring serrations. The blade angles are the same in all stages to simplify manufacture, but alternate stages are mirror images of the others in order to permit contra-rotation. This is clearly shown in Fig. 6 Which is a photograph of the rotor assembly. The pressure rise through each compressor stage is designed to be approximately equal to the pressure drop in tile corresponding turbine stage.
I t is thus anticipated that air or gas leakage through the gaps between the wheels should be small.
The construction of the individual wheels can be seen from Fig. 7 which is a photograph of the fifth-stage rotor. They incorporate tile features which Were found most satisfactory in the single-stage wheel tests described in section 2. A high-tensile steel hub is machined with a constricting section of S form between the bearing housing and the blade-root fixing ring. This limits the heat transfer from tile turbine blades to the bearing and permits different ial expansion of the ring and housing without setting up undue stresses.
High-speed ball bearings with specially treated races and balls to make them suitable for operation at temperatures up to 200 deg C. are used. They are held in their housings by screwed rings. The inner races are s ta t ionary and separated from each other by distance pieces. Small grooves in the distance pieces meter the lubricating oil to the bearings. Oil is fed through a hole in the entry end casting at low pressure and passes along two holes drilled axially in the central shaft. Radial holes below each distance piece permit the oil to reach the metering grooves and thence the' bearings. In addition two more axial holes in the central shaft (see section SS, Fig. 4) feed compressed air to other radial holes which are connected with the opposite faces of the distance pieces. The air can enter the space between two wheels and its pressure is regulated to maintain a slight flow towards the turbine blading. This seals the bearing from the hot gases and gives a small cooling effect. A labyrinth gland is fitted outside the bearing housing between adjacent wheels to control the flow of cooling air and an over- lapping form of gland is constructed at the shrouds to reduce leakage between compressor and turbine annuli.
5

The weight of the complete unit is 177 lb and further design details are summarised in Appendix I.
3.2. Co~pressor Desig~.--Detailed consideration of the design is given in Appendix II, but the general basis may be summarised as follows.
The object is to obtain maximum efficiency and a minimum weight for the performance required. This is attained by judicious selection of certain quantities, bearing in mind the limitations to which they are subject. The limitations involved are of aerodynamic, stability, stressing and other mechanical characters. The methods used are similar to those for a normal axial compressor, but with modifications due to the constructional features necessitated by the integral furbine drive.
The pressure rise in a stage depends upon the change in velocity of the air as it flows through the blading and is a function of the axial and peripheral velocities and the air angles. These quantities are indicated in Fig. 8 where typical velocity diagrams are given. The maximum pressure rise is obtained when the air velocity and deflection are the maximum permissible. Limitations are imposed on the velocities by the approach of the compressibility stall at the blade tip, by losses at the blade tips or by the centrifugal stress at the blade roots. The first is governed by the air velocity relative to the blade leading edge, the second by the axial velocity which controls the blade height, and the third by the peripheral velocity. The angles are determined by reference to wind-t, unnel tests on cascades of aerofoils. Here again limits are • found which give the optimum conditions for stable and efficient flow while not exceeding any of the velocity limitations. At the same time the difficulties of manufacture must be remembered and to ease them certain simplifications are made. The smallest number of stages f o r a given performance would be obtained by taking advantage of the increasing sonic velocity through the compressor and increasing the blade root diameters and altering the blade angles pro- gressively in each stage from the entry end to the delivery. I t eases production if the shrouds separating the compressor and turbine blading are maintained at a fixed radius in all stages and the same blade angles used throughout. Adjacent stages rotate, of course, in opposite directions, and the corresponding angles are measured in opposite senses from the axis.
At tile time of the design of the unit information upon the performance of compressor blading was very scanty and consisted only of a series of test results with blades of 45 d e s camber and
- - 22 deg stagger. Other results included in this reference were at + ½deg and + 23 deg stagger. From Fig. 8 it will be seen that a combination of high camber and large negative stagger should produce the large air deflection and high relative velocity which are desirable. With this in mind, an estimate of blade performance at large negative staggers (-- 40 deg and over) was made by extrapolating the results of Ref. 1 and the actual design based upon it. Later experiments and other unpublished results showed tha t the stalling angle incidence became much less and the deviation greater than the figures obtained by extrapolation. These two effects resulted in the compressor blading having an incidence which gave a high loss ~and a reduced deflection with consequent poor performance. This was particularly the case at the low-pressure end. Towards the high-pressure end the effect of the reduced pressure rise from the inefficient low-pressure blades resulted in lower air density and higher axial velocity reducing the incidence. Also the boundary layer thickening which axial compressor tests have indicated as occurring towards the high-pressure end reduced the effective flow area and so increased the axial velocity for a given mass flow. The increased deviation further tended to reduce the incidence in the later stages. Thus the blading performance was apparently worst at the entry end with a gradual improvement in incidence towards the delivery end.
The most satisfactory way to improve the unit would have been to reblade it with blades designed in the light of the later wind-tunnel results, but in order to avoid delay in the tests a more simple expedient was adopted. By decreasing the blade incidence in the earlier stages, their tendency to stall would be reduced and more efficient running obtained. As indicated above this could be done by increasing the axiM velocity of flow. The simplest way of achieving
6

this was to reduce gradually the existing flow areas from the high.pressure end towards the low-pressure end by reducing the blade heights and fitting a new casing. This was done at an early stage in the tests and is referred to later.
4. Object of Tests.--The un i t was constructed as a first step in contra-flow turbo-compressor development and tests were required to determine the aerodynamic, thermodynamic and mechanical performance. I t was hoped to establish whether the advantages claimed in theory
were upheld in practice and to provide data for future development. Measurements of the mass flows, pressure ratios, efficiencies and temperatures of the compressor, turbine and complete unit were required and at the same time it was desired to investigate further the effect of thermal and rotative stresses upon the wheels and bearings, to note any tendency, towards distortion, to check that the designed clearances were sufficient to cope with all expansions and to observe the functioning of the oiling and cooling arrangements.
5. Test Rig and Measuremerats.--To achieve the above objects, the tests were made in a progressive manner. Initially the turbine was supplied with air from an independent source and after satisfactory cold tests this air was heated in a combustion chamber before the turbine and the entry temperature raised in steps. Finally, the compressor air was delivered to the turbine and the unit Was operated as a complete'turbo-blower and the temperature again raised progressively. This arrangement is shown in Fig. 9. Air from plant compressors was delivered through a pipe (1) into the compressor entry annulus (2). From there it passed through the u n i t (3) and was delivered at increased pressure to the delivery volute (4). The air then passed along a pipe and round two 90 deg bends fitted with guide vanes through an expansion joint (5) to the combustion chamber (6). Hot gases were generated and led directly to the turbine entry annulus. The temperature was regulated by the fuel-injection pressure from a hand-controlled needle valve. After passing through the turbine the gas discharged to atmosphere through a short lengtl:l of pipe (7). °
Pressure and temperature measurements were made at the compressor and turbine entries and deliveries. Mercury U gauges were used for all pressures, mercury4n-glass thermometers for compressor temperatures and iron-constantan thermocouples for the turbine temperatures. The pressure rise in each compressor stage was measured on a number of runs by drilling the casing and forming static points behind the blades. A combined pitot-yaw meter was inserted in the delivery annulus and temperature readings taken with a thermocouple in addition to the static readings in the delivery volute.
The air flow was obtained on some runs by annular orifice meter inserted in the compressor delivery line, but in most tests it was obtained from calibrated pitot-static tubes in the entry line. Fuel flow was measured by the consumption time for a known volume.
Other measurements included the lubricating oil delivery pressure and temperature, the cooling air pressure, the temperature of the inner race of the ninth stage bearing and the speeds o5 the first, fifth and eighth stage wheels. The recording of the rotor speeds could not be carried o u t b y a simple mechanical means and an electrical method was devised. The basis of this was the change in capacity occurring when a rotor blade moved past an insulated plug. The capacity change was made to induce an electrical impulse in a counting circuit. This circuit produced, a mean current proportional to the impulse frequency. The current was measured b y the deflection of a galvanometer and the impulse rate could be read from a graph relating frequency with deflection. Considerable trouble was experienced with this indicator in the early stages but it was finally overcome and the readings were consistent and accurate within 2 per cent. A technical description of the circuit is given in Appendix n I .
6. Aerodynamic Tests.--The compressor was tested as a normal axial compressor by supplying the turbine blading with gas independently of the compressor air flow. The latter was drawn from the atmosphere, either direct or after throttling, and was discharged through a measuring orifice and throttle. Tests were made in the original designed state and later after modifications to the blade heights and the casing. Characteristic curves covering a range of mass flows and speeds were obtained, but they were limited by the air supply and pressure drop available from the shop plant for driving the turbine.
7

After the uncoupled tests, the compressor was connected to the turbine. Th~s restricted the points tha t could be obtained on the characteristics, but permitted the speed to be raised to higher values.
6.1. Compressor as Desig~ced. T h e tests were not ent i relysat isfactory because of the number of variables which could not be controlled independently of the mass flow. The chief difficulty Was the changes that occurred in the rotor speeds, but a second was the air leakage from the compressor to the turbine past the separating shrouds (see Appendix IV). During each run, the turbine entry conditions were maintained constant and it was observed tha t the exhaust conditions also remained fairly steady.
The results are similar to those of a normal axial compressor and typical readings are given in Table I and drawn out graphically in Fig. 10. The pressure ratio and mass flow dropped suddenly beyond the surge point and the recovery showed the hysteresis effect characteristic of axial compressors. , The efficiencies peaked before the surge point but were much lower than the designed figure of 83 per cent at 10,000 r.p.m. No adjustment has been made for air leakage and the mass flows are as measured at the compressor delivery, but corrected in the usual manner to normal temperature and pressure conditions a t entry. The speeds of the first, fifth and eighth stages have been plotted and their mean just before the surge point marked on the pressure curves. I t was not possible to obtain a higher speed than 6,500 r.p.m, with the low turbine mass flows and temperatures used in the early tests.
6.2. Compressor as Modified.--The reasons for altering the compressor have been stated in Section 3.2 and the results of the initial compressor tests confirmed tha t the characteristics would not match those of the turbine. Modifications were, therefore, put in h a n d . These consisted of fitting a new compressor casing with the diameter reduced by 0 . 5 8 in. opposite the leading edge" of the first stage blades, but with zero reduction opposite the trailing edge of the finalstage. Between these points the casing had a straight taper. To mate with the new casing the blade heights were reduced by a progressively decreasing amount from the first stage to the !ast so that the tip clearance remained the same as before the change.
The effect of the change was not very marked upon the pressure ratio, but produced a noticeable improvement in the efficiency, as can be observed in Fig. 10. Unfortunately, no test was made which would permit a direct comparison of the characteristics before and after modifications.
6.3. Compressor Coupled Directly tO Turbi~e.--As already stated, when the compressor was feeding the turbine it was not possible to vary the compressor mass flow or pressure ratio without affecting the turbine condition. Also artificial conditions were produced b y the necessity for boosting the compressor intake pressure in order to obtain sufficient pressure to drive the turbine. These conditions are discussed more fully in a later section. The compressor was only connected to the turbine after the modification described in section 6.2 and tile results, which are detailed in Table, 2 should be read in conjunction with those of that section.
The compressor pressure ratios and efficiencies at various speeds are plotted on Fig. 11 for constant mass flows. Pressure ratio and efficiency increased with speed, but the latter flattened off at the highest speeds. The mass flows were maintained by feeding air to the compressor intake from the factory compressors and varying the boost as the speed altered. The speed was controlled by varying the turbine entry temperature. By drawing an ordinate at constant speed to intersect the constant mass-flow lines it is possible to construct a pressure-ratio mass-flow curve. This has been done for a mean speed of 5,330 r.p.m, and the result plotted on Fig. 10, In comparing it with the characteristic obtained in the normal manner it will be observed tha t the pressure ratio is similar but tha t the mass flow is much greater. This is explained by the air leakage and the position of the measuring orifice. In the normal tests the air flow was measured at the compressor delivery after the leakage points, but in the turbo-compressor running, it was measured at the intake before the leakage occurred. I t will be seen that in the latter ,ease the flow is approximately double at the same pressure ratio,
8

An examination of the stage pressure characteristics was made by the use of static measuring points after each stage and by the insertion of a combined pitot tube and yawmeter in the delivery annulus. The pressure distribution was generally as would be anticipated except at the delivery, where the loss due to the poor diffuser conditions was even greater than the full velocity head. A typical example of the pressure rise through the unit for a mean speed of 5,570 r.p.m, is given in Fig. 12, together with the stage pressure ratios and estimated rotor speeds. The entry pressure is above atmospheric because of the necessary boosting of the compressor. The yawmeter indicated that the absolute angle of the air leaving the last stage was 25 deg to 30 deg from the axis, which was in accordance with what would be expected from the blading angles.
During these tests slight grooves were cut near the leading edge on both the convex and concave feces of all the compressor blades in the first and second stages. The grooves extended for the full height of the blades and can be clearly seen in Fig. 6. The object was to produce a local turbulence near the faces of the blades and so postpone any tendency to stall. There was no noticeable improvement in the performance following the modification.
7. Thermody~amic Tests.--The foregoing has described tests from the compressor aspect only and it is now intended to detail the behaviour of the turbine and of the complete unit operating as a gas turbine plant. Typical test figures and results are contained in Tables 1 and 2.
7.1. Turbi=e.--It is always possible to accelerate a gas more easily than to diffuse it and thus the design of turbine blading is not so critical as tha t of a compressor. There is also considerable design data and much experience available and it was not Considered that any serious departure from the designed performance need be anticipated. The chief interest was, therefore, con- centrated upon the compressor and the turbine was subjected to less detailed measurements:
Measurements of pressure and temperature were made in the entry annulus and the exhaust pipe. The turbine pressure ratio was based upoI1 the pitot pressure at entry and the static at exhaust, on the assumption that the carry-over velocity was wasted. This resulted in a low value of the calculated turbine efficiency, especial ly as the diffuser efficiency of the discharge annulus was very poor, but it was desirable to use this pressure ratio from the viewpoint of estimating the self-driving conditions. The values obtained are plotted against speed in Fig. 13.
During the early tests when the turbine was fed with cold air, independent of the compressor conditions, measurements of exhaust temperature were not taken and consequently no calcula- tions of efficiency were made. As a matter of interest it may be noted that the temperature drop was sufficient to cause deposition of snow on the exhaust pipe, indicating that the turbine could be used as a refrigerator.
With hot gases, the measured temperature drop was found to be four or five times as great as the adiabatic temperature drop corresponding with the pressure ratio. Investigations revealed a considerable variation in temperature across the discharge annulus, but still giving an impossible temperature drop. I t was conclnded tha t the excessive drop was brought about by the cooling effect of air leaking into the turbine gas stream. Definite 'evidence of this has been collected in Appendix IV, and there it is shown that the actual amount of leakage was approximately 50 per cent. of the compressor entry mass flow. At least 30 per cent. leaked across the separating shrouds and the remainder through a poorly-fitting expansion joint on the delivery volute. Under the designed conditions the shroud leakage would have been much less because the air density and pressure drop would have been less. The calculations in Appendix IV suggest that it would have been of the order of 4 per cent.
In order to obtain some idea of the turbine efficiency a figure for the true turbine temperature drop was calculated by equating the work done on the compressor and the work done by the turbine. An allowance was made for the difference in specific heats and average values to cover the whole test range were used. For the compressor the ratio of specific heats at constant pressure and constant volume was taken as 1. 398 and for the turbine as 1-389 throughout. On this basis .the turbine efficiency fell away with increasing speed as indicated in Fig. 13 but the figures are fictitious because of the air leakage. I t is probable that under conditions of no leakage the efficiency would be reasonably close to the designed figure of 92 per cent.
9

7.2. Turbo-compressor.--When the unit was coupled as a complete turbo-compressor plant the compressor should have been able to achieve a pressure ratio sufficiently in excess of the turbine pressure ratio to overcome the combustion chamber losses a t a l l speeds above a comparative137 low figure. In fact it was not able to do so and air under pressure had to be supplied to the intake in order to boost the delivery pressure to that required to overcome the losses and operate the turbine. This limited the range of tests, but sufficient information was obtained to form an idea of the behaviour of the combination of turbine and compressor. The chief results are illustrated graphically in Fig. 14. Gas temperature at entry to the turbine has been plotted against the mean speed of the three measured rotors for a series of mass flows. The mass flows are measured before entry to the compressor and therefore take no account of the internal leakages. Increasing the mass flow, which corresponds to a n increased intake boost, or increasing temperature raised the speed and the limit to the tests was set by the mass flow at 220 lb/min and by the temperature at 5~0 deg C. The former was fixed by the capacity of the external compressors to supply boosted air to the intake and the latter by the onset of surging. A test at 575 deg C. (reading number
25 , Table 2) was attempted, but the speed immediately dropped and was accompanied by con- siderable noise. Steady conditions were attained and measurements of pressure ratio and efficiency showed a catastrophic fall. On ~reducing the temperature to 538 deg C. (reading number 26) the speed increased and the noise was reduced . The pressures and efficiency still seemed to be lower than the previous readings would suggest, and it is possible that some stages were stalled even at this temperature.
There was a marked variation between the measured stage speeds and these have been p lo t ted in Fig. 15 for various mean speeds. The unmeasured stage speeds have been interpolated and it appears tha t the ninth stage reached a figure of 10,500 r.p.m, in reading number 26, while the means of the measured speeds was only 9,280 r.p.m.
8. Discussion of Results.--The performance fell much below the expected figures, but this can be ascribed largely to the inefficient compressor blading which was designed in ignorance of the true effects of large negative stagger angles when combined with large cambers. A detailed analysis of the results was not possible because of the uncertain test conditions, produced par- ticularly by the excessive air leakage. Attempts to deduce the actual operating conditions required so many assumptions that it was felt that the calculations might prove completely mis- leading and they have not been included. Some general comments upon the observed charac- teristics and their relation to the design are given below.
8.1. Efficiency.--As already remarked the measured compressor efficiency was low. Some loss was caused by the poor design of the test delivery volute which failed to recover any of the velocity head of the air after the final stage. The effect of this was to reduce the efficiency by 6 per cent. or 7 per cent. near the Operating point as can be seen by comparing the pitot and static head efficiencies in Table 1. The temperature in the volute was greater than tha t in the delivery annulus, and this also would reduce the efficiency. The increased temperature was probably due to heat picked up from the walls of the volute which were ill contact with the hot turbine gases.
Apart from these causes, an estimate of the stage efficiency revealed tha t the maximum efficiency could only be of the order of 77 per cent. compared with the designed figure of 85 per cent. The efficiency depends upon the losses, which can be listed as blade-profile losses, blade tip and other losses. The latter depend upon the ratio of tip clearances to blade heights, aspect ratio and skin friction and are usually small. In normal designs they amount to some 10 per cent. or 15 per cent. of the total losses and are sensibly constant with varying incidence. The blade-profile losses are obtained from cascade tests and reach a minimum value at an angle of incidence below tile stalling angle. From these.losses it is possible to plot stage efficiency against incidence. At a large negative incidence there will be no deflection of the air and the efficiency will be zero. As the incidence becomes less negative the efficiency increases to a maximum and then fails away as the stalling incidence is approached.
10

The incidence angle can be seen from Fig. 8 to depend, apart from the actual blade angles, upon the ratio of peripheral to axial velocity. This increases as the air flow is reduced. Each stage did not have the same incidence because of the effect of density on axial velocity and the leakage from the compressor. Consequently all stages were imt working at the optimum efficiency at the same time and the overall efficiency was low. After the modification to the blading, the axial velocities in the low pressure stages were increased and this reduced the mass flow giving optimum efficiency in these stages to a value nearer that obtaining in the high-pressure stages and there was a resultant improvement in the overall efficiency. The increase in efficiency with increasing rotor speedsis also due to the more uniform incidence prevailing ill the various stages, but a limit to the increase would be set when all stages were working at the optimum efficiency at the same time. This Condition, or a near approach to it, appeared to be near at hand at the highest speeds at tained by the unit.
8.2. Pressure Ratio.--The pressure rise through a compressor stage is given by
~ P
where ~,
P
P,T
R
= ~sp Co U (tan ~-1 -- tan ~.~) .. g
efficiency of stage
air density in stage = P/RT
air pressure, temperature in stage
gas constant
. . . . . . . . . . . . (1)
and the other symbols are defined i~ Fig. 8.
This may be re-written as
~P -- constant × ~s'. US [1 _ C~ tan 1 (2) P T _ U ~J . . . . . . . . . .
: : .
which indicates tha t the pressure ratio depends upon the stage efficiency, temperature, rotor speed and axial air velocity. As explained above, the efficiency was low and consequently the pressure ratio was low. After the modification to the blading, the increased C~ would tend to reduce the pressure ratio, but as it also held the incidence nearer to the point of optimum efficiency the two effects neutralised each other and there was very little net t Change.
The influence of peripheral velocity is important and its variation through the stages is dis- cussed in the next paragraph. An example of the pressure rise and peripheral speed in the stages is given in Fig. 12. The speed is almost constant through the first five stages, but there is an increasing .pressure ratio due to the improving efficiency as the axial velocity decreases. Beyond this stage the speed increases rapidly while it is probable tha t the efficiency has passed the optimum value and is tending to reduce the pressure ratio. The nett result is a continued increase, but not as rapid as the increase in speed alone would suggest.
8.3. Rotor Speeds.--.The peripheral velocities of the stages did not follow the designed figures as can be seen by reference to Fig. 15 where the designed rotor speeds have been plotted for comparison with the actual.. Another interesting feature is the variation of stage speeds with independent compressor and turbine mass flow shown in Fig. 10.
The running speed of any wheel is dependent upon a balance being attained between the turbine and compressor work and an examination of the factors governing these will enable an explanation to be offered for the observed changes in speed. By equating the work done we may write
We.U} 1 - - _ - : _ t a n e 2 = Wy? C~ 7 U, U, tan ~2~--1A . . . . . . . . (3)
11

where W mass flow
U pelipheral velocity
C , axial velocity
c~ discharge angle
and suffixes c and t refer to compressor and turbine respectively. For the purposes of a pre- liminary investigation it may be assumed tha t the discharge angle e2 is constant and that the work done depends only upon the mass flow, axial and peripheral velocities.
Consider first the compressor characteristic tests with constant turbine flow and varying compressor flow. A change in the latter by throttl ing will result in a change of axial velocity, and the compressor work with a steady peripheral speed will depend upon the relative importance of Wc and Co. There will be one value of Wc producing maximum work and a decrease or increase will reduce it. In the turbine the mass flow is constant and at constant peripheral speed the only change in the work done occurs when C, alters due to changes in density. At a high compressor mass flow it has been calculated that the ninth stage will be operating beyond the point of maximum work, and any reduction in mass flow will increase the work done. As the turbine entry conditions are constant, the work done by the turbine at the initial rotational speed will be constant. The throttl ing on the compressor side means tha t the compressor will demand a greater input than is available from the turbine, and the rotational speed will fall. At some lower speed equilibrium will be restored and the new work done in the stage will be less than the initial. In the eighth stage the compressor ,mass flow is always greater than in the ninth because of air leakage, but the work done is close to the maximum for the fixed peripheral speed, and changes in mass flow due to throttl ing have little effect upon the work. On the turbine side the reduction in work in the ninth stage after throttl ing leads to a higher density before the eighth stage and hence a lowel axial velocity and less work. The reduction in work is small, and there is little change in peripheral velocity to maintain the balance of turbine and compressor work. In the following stage a reduction in the compressor mass flow reduces the work done. This more than counterbalances the reduction in turbine work following the increased density, and there will be a sligh t increase in speed before the equilibrium point is reached. Theprocess is continued in succeeding stages, but in the lower pressure stages reduction in the compressor mass flow reduces the work done at constant peripheral speed rapidly while the turbine work is reduced only slightly. There ~il l be a large increase in speed which may increase the turbine work to a figure slightly in excess of the original. The overall work done by the turbine remains constant, but there is a re-distribution among the stages due to the altered speeds and variations in speed plotted in Fig. 10 fall into line with this explanation.
Considering now the variations in speed which occur when the unit is connected as designed, it.will be observed that the mass flow through any stage will be the same through compressor and turbine blading irrespective of the amount of leakage. The mean blade peripheral speeds will bear a fixed ratio to each other, and so the equilibrium speed depends only upon the axial velocities. An increase in velocity of either or both sides will produce an increase in rotor speed. The axial velocities depend upon the cross-section areas and densities and as designed should give a slight fall in speed towards the centre stages and a rise again towards the high pressure end. The observed speeds differ because the actual densities depart from the designed values owing to the inefficient compressor blading and because the air leakage modifies the axial velocity. Thus in the ninth stage the axial velocity varies as W T/A P, but in the eighth stage as (W + ~ W ) ( T - ~T)/(A + OA) ( P - ~ P) where A is the cross-section area and the other symbols are as before, d representing increments. In the turbine, if no leakage occured #W would be zero and the change in the value of C~ through the stages would be small. With leakage, the cooling effect of leakage air produces a large 0 T and C~ falls. This is offset in part by the increase in W, but the nett effect is a considerable fall in rotational speed. On the com- pressor side the same expressions give the changes in axial velocity, but here it is probable that the increase in W is not balanced by the reduction in T and there is an increase in C0. This
12

tends to increase the rotor speed, but not sufficiently to become effective against the reduced value of G. In the lower stages Cc becomes more important, and C~ fails less due to the temperature change being less and the mass flow change more. There is thus a point where rotational speed ceases to fall and may even rise again. From Fig. 15 it appears that at low mean rotor speeds the low turbine axial velocity still predominates and the speed in the first stage is the lowest.
8.4. Self-m~¢~i~ Characteristics.--It was evident at an early stage in the tests that the unit would not be able to drive itself without attaining abnormal conditions, and during the whole course of the tests it was not possible to reach a self-running state. From the test figures an estimate of conditions under which self-running would have been attained has been made.
The compressor and turbine pressure ratios plotted in Figs. 11 and 13 have been combined in Fig. 16, and it will be seen that at any speed the turbine pressure ratio is greater than that of the compressor. At a constant mass flow the two curves converge as tile speed increases and would eventually intersect. At this point, the pressure ratios are equal, and if it is assumed tha t there is no pressure loss in the combustion chamber or connecting pipes between the com- pressor delivery and turbine entry, there will be a balance of air intake and gas discharge pressures. The unit will then be capable of running without external assistance.
By extrapolation of the test curves in Fig. 16 the points of intersection at various mass flows have been obtained and plotted in Fig. 17 against the coriesponding speed in r.p.m. In the same way, the mass flow is plotted against the speed in r.p.m. Then, by referring to Fig. 14 and extrapolating the curves, the gas temperatures corresponding to the self-running mass flows, and the speeds in r.p.m, already plotted are obtained. From this temperature curve the impossi- bility of obtaining a self-driving state is evident. If an allowance were made for the combustion chamber and pipe losses, the limiting temperature with no flow would be in the neighbourhood of 600 deg. C., but the maximum at which running has been maintained is 540 deg. C.
The high gas temperatures required are again due to the inefficient compressor blading and the large air leakage, but also in some degree to the compressor intake temperature. The significance of the latter is brought out by a consideration of the balance of turbine and compressor work from the thermodynamic aspect. This may be written as
1 . . . . . . . . st
where suffices c and t refer to compressor and turbine respectively, and
W mass flow T1 entry temperature
adiabatic efficiency s pressure ratio y ratio of specific heats.
For self-running conditions, the compressor and turbine mass flows are equal and also the pressure ratios. Assuming equal specific heats in the compressor and turbine, equation (4) may be re-written as
T i c . s c, _ 1)/y . . . . . . ( 5 ) ~?c ~ = ~ .- . . . . .
From this it can be seen that, other things being equal, a rise in compressor-intake temperature necessitates a proportional rise in turbine-entry temperature to maintain self-running conditions. The compressor air temperatures at entry in the tests were between 45 deg. C. and 75 deg. C., which would mean absolute gas temperatures between 10 per cent. and 20 per cent. higher than if the entry air had been at 15 deg. C. This, in turn, requires a higher figure than under the
13

designed entry temperature of --50 deg. C. The gas temperature is also inversely prt~portional to the efficiency product which is shown in Table 2 to lie between 0.43 and 0-47 as compared with the designed figure of 0 .77 .
The compressor mass flow under self-running conditions would apparently be much lower than the designed figure. At 10,000 r.p.m, it would be only 190 lb/min, compared with the N.T.P. equivalent of the designed flow of 490 lb/min. The low flow is due to the need for a low axial air velocity in order to increase the blading incidence and improve the pressure rise. I t is probable, however, that before the self-running pressure ratio is reached that the blades will stall and the unit will surge. The surge points of t h e compressor pressure characteristics occur at larger mass flows as the speed increases, so that for a constant mass flow the operating point will approach the surge point as the speed increases. Eventually, a speed will be reached at which the compressor just stalls and the operating point will fall down the mass flow line unti l it reaches a stable point in the stalled part of a characteristic. This will be at a speed and pressure less than .those reached iust before the stall, and if the latter are less than those indicated by the intersection points of the turbine and compressor ratios in Fig. 16, it is obvious that the intersection pressure ratio cannot be reached in any circumstances. Such stalling occurred during the tests as described in section 7.2.
9. Mechanical Testing.--The chief obiect of this pa r t of the programme was to obtain the maximum information about the constructional features of the unit. The runs had been arranged so that the effects of mechanical and thermal stresses could be separated and observed in a progressive manner. A total running time of 75 hours was completed, made up of 30 hours with cold air only and 45 hours with hot gases. The results of the running and modifications made are detailed and discussed under the following headings : - -
1. Wheel temperatures. 2. Cooling air. 3. Bearings. 4. Lubrication. 5. Other constructional features.
9.1. Wheel Tem~bemtures.--The temperature distzibution in the high-pressure wheel was investigated by the use of thermal indicating paints. These paints change colour at fixed temperatures independent of the atmosphere to which they are exposed and have been previously reported to give reliable results. 3 A series of paints with colour changes occurring at various temperatures between 140 deg. C. and 500 deg. C., were applied in radial strips to both sides of fhe wheel from the bearing housing to the compressor blade tips.
The unit was run under carefully controlled conditions at a measured gas entry temperature of 400 deg. C. and all estimated rotor speed on the high pressure wheel of 5,600 r.p.m, for a period of 15 mill. The speed and temperature were increased slowly at the beginning of the run in a period of 10 rain. and reduced again at the same rate after the steady s ta te .
The results deduced from examination of the paints after the run are shown in Fig. 18. They must be regarded with a certain amount of caution because the precise position of the colour change was sometimes difficult to determine and small variations of temperature were not shown up. The compressor blade temperature was higher at the shrouds than the delivery air tempera- ture, but there was no indication of the temperature over the rest of the blade. Just below the shrouds the turbine blades were comparatively cool and the blade temperature did not reach the measured gas temperature until about midway between the shrouds and the roots.- This temperature distribution is ascribed to the effects of air leakage from the compressor annulus into the turbine entry. The full gas temperature was maintained in the rotor disc below the blade roots down to the narrow constricting section where a drop of approximately 150 deg. C. occurred. I t is probable thdt the bearing outer race temperature did not differ much from that of the housing and can be assumed to be 250 deg. C. The inner race temperature was measured by a thermocouple and reached 160 deg. C. The low-pressure side of the wheel had much the
14

same temperature distribution over the blading, but fell away more rapidly in the disc towards the bearing, where it was approximately 50 deg. C. cooler than on the high-pressure side. These figures suggest that the original design would be suitable for gas temperatures of the order of 300 deg. C., which would keep the bearing temperature below 200 deg. C.
The use of paints was helpful and at a later stage in the testing they were again used. Their object was to give information upon the temperature gradients in all wheels, upon the effects of modifications in the bearing cooling arrangements and upon whether air was leaking across the shrouds. The gr~tdients were all similar in form to that shown in Fig. 18 but with lower values in succeeding stages towards the low-pressure end and with correspondingly lower bearing temperatures. The effect of the cooling modification on the high-pressure stage is shown in Fig. 18. The inner race temperature was reduced to 65 deg. C. and the outer race from 250 deg. C. to 150 deg. C. The drop in temperature across the restricting section was increased by 100 deg. C. Details of the modifications producing this improvement are given in section 9.2. The air leakage was difficult to assess, but the approximate temperature distribution across the turbine blades in each stage is given in Fig. 19. The curves give definite evidence of air leakage from the compressor and are discussed further in Appendix IV.
9.2. Cooling Air.--To prevent hot gases leaking towards the central shaft and damaging the bearings a labyrinth gland was fitted outside each bearing housing and the pressure inside maintained above the gas pressure by feeding compressed air through holes in the shaft. The air was bled from the compressor delivery and the estimated leakage past the gland was approxi- mately 0.1 per cent. of the compressor throughout. At altitude the compressor delivery temperature would be 65 deg. C. to 70 deg. C. so that a slight amount of cooling would be provided for the bearings. The main object of the air was, however, to seal the bearings against the detrimental effects of hot-gas leakage.
The air seal was not effective in maintaining the pressure because the gland leakage area as designed was too great. Two holes 1/16-in. diameter were provided ill the central shaft for each bearing while the nominal gland tip clearance at a radius of 1.2 in. was 0.003 in. After a short period of operation the effect of this was aggravated by wearing of the tips and an increase in the clearance to 0.006 in.
The first modification to the unit was introduced because of this and the fact that during the early tests the compressor delivery air pressure was often less than the turbine gas entry pressure. The modification consisted in coupling an external compressed air supply to the sealing air pipe. This enabled the pressure to be maintained around the bearing housing by the use of a higher supply pressure and the mass flow to be varied to give increased cooling. The throttl ing effect of the 1/16-in. diameter feed holes imposed a limit to the flow and above a gas temperature of 300 deg. C. overheating of the bearings in the high pressure stages commenced. The air was fed along the central shaft from the low pressure end and picked up considerable heat before reaching the bearings. To avoid this the direction of feed was reversed and the air entered the shaft from the space in the centre of the high-pressure end casing. I t was led in by holes drilled through the centralising pins. This gave all improvement but heat was now picked up from the end casing and the air temperature before reaching the bearings was still over 100 deg. C.
The next modification was to lead the air directly from the centralisers to the shaft through 5/16-in. diameter pipes to reduce contact with hot surfaces. F u r t h e r cooling was introduced for the ninth stage wheel by splining the bush holding the centre and permitting air to blow through on to the face of the wheel. From the sixth to the ninth stages the feed holes of 1/16-in. diameter were opened to 3/32-in. diameter. This permitted the cooling air flow to be doubled and it was possible to run with a gas temperature of 500 deg. C. for brief intervals. Further opening of the holes to 1/8-in. diameter resulted in an improvement in bearing conditions, but the gas temperature was limited to 540 deg. C. through compressor surging.
Some measurements were made of the cooling-air mass flow at various pressures and these are recorded graphically in Fig. 20. The effect upon the bearings is discussed in the following
15
section, but it should be borne in mind tha t the air was employed in a manner different f rom that designed owing to the failure of the sealing glands to restrict the flow and the excessive temperatures to which the bearings were subjected.
9.3. Bearings.--The bearings are a vital point in the construction of the unit. I t was realised tha t they would be subjected to abnormal temperatures and high speeds, but the journal and thrust loads were light. The makers were consulted and a deep-groove ball bearing was recommended. The bails and races were specially tempered to permit of running temperatures up to 200 deg. C. The fit of the balls in the races was made the second standard to provide a certain degree of slackness so that differential expansion of the races would not cause tightening up: Below the high pressure (ninth-stage) bearing a thermocouple was fitted to give an indication of bearing temperature. I t was originally arranged through a hole m the central shaft and only gave the temperature of the shaft below the bearing. This might differ materially from the inner race temperature and at a later stage in the tests the couple position was altered so that it was nipped between the race and the retaining shoulder of the shaft.
I t was found that with inner-race temperatures below 150 deg. C. satisfactory running could always be relied upon. From the wheel temperature tests it was observed that ttiere was a drop of approximately 100 deg. C. across the balls when the inner race was at 150 deg. C. and running at 5,600 r.p.m. In this condition the outer race was above the manufacturer 's recommended permissible operating temperature, but there were no signs of failure. Inner race temperatures UP to 200 deg. C. were recorded without any sudden failure. On examination after subjection to these temperatures a slight degree of roughness could be felt when the bearing was rotated, but owing to shortage of replacement bearings, they were not discarded and gave a namber of hours further service without trouble. These results were obtained after improving the air cooling by introducing grooves in the high-pressure end bush and opening out some of the air-feed holes from 1/16-in. diameter to 3/32-in. diameter. This was the condition when the first test with the temperature-indicating paints was made. The second paint test was made after opening the holes still more to 1/8 in. diameter.
In the original arrangement the limiting bearing temperatures were reached with comparatively low gas temperatures and many of the modifications already described were to enable higher gas temperatures to be tried. The bearing temperature appeared to be dependent upon the speed of rotation, the gas temperature and the quant i ty of cooling air. No attempts were made to reduce the temperature by such methods as improved lubrication or heat insulation of the bearing races, and all improvements were due to more effective use of cooling air. A complete s tudy of bearing temperatures was not made, but the effect of the variables is indicated in Fig. 21 for the two improved cooling conditions mentioned above.
A number of failures were recorded but in most cases these followed the application of excessive temperature to the turbine and were confined to the higher pressure stages. On only one occasion did a bearing collapse completely. This occurred to the eighth stage bearing after approximately 1/2 hour running at speeds varying between 7,000 and 8,000 r.p.m, and gas temperatures which did not exceed 865 deg. C. There were no noticeable symptoms before tile bearing cage burst, but afterwards there was considerable noise and the indicator recorded zero speed. The displace- ment of the balls allowed the wheel to drop until it was supported by the labyrinth gland and housing of the ninth-stage bearing. This radial movement resulted in scoring of the compressor casing by the blades and the wearing away of the air sealing glands. The heat generated increased the temperature of the ninth-stage bearing which also seized up solid. No other damage resulted, but it was evident tha t the whole unit had at some time been subjected to a high temperatare as lubricating oil had carbonised on all the wheels. The bearings in the lower-pressure stages all bore signs of heating, but after cleaning and examination they were considered suitable for further running. This was the only occasion when the lower stages showed signs of overheating and their appearance would suggest that hot gas had not been excluded from them. The ninth- stage bearing temperature had been reading quite low and on this account the cooling air pressure was reduced. I t was afterwards found that there had been a breakdown in the bearing thermocouple insulation, and probably the low air pressure wasresponsible for the failure.
16

On a number of occasions rapid shut downs from high temperature were necessary and this resulted in some overheating of the bearings while stationary. After none of these did a bearing fail, but it is believed tha t deterioration occurred.
The designed slackness of the bearings seemed to be an error caused by following previous exhaust turbo-blower practice. In t h e present application the heat is t ransmitted to the bearing from the wheel and not through the central shaft. Consequently the inner race is always at a lower temperature than the outer race and the clearance tends to increase. No trouble in the bearings themselves could be ascribed to this, but the danger of wheels touching through tilt or end movement was increased.
In general it appe/~red that the bearings performed satisfactorily up to outer race temperatures of 250 deg. C., and .'quite severe temperature overloading did not produce an immediate failure.
- . A failure was not catastrophic as only a smaU amount of damage resulted and the remaining stages continued to rotate freely. An improved arrangement of mounting the bearing in order to reduce heat transmission would be beneficial.
9.4. L~bricatio~c.--The designed lubricating-oil pressure for the be£rings was 8 lb/sq, in. above the corr, pressor delivery pressure, but it was soon found tha t with this figure, consumption was excessive. Most Of the oil leaked past the bearings and labyrinth glands outside the bearing housings into the spaces between the turbine blades. There it was cracked and part ly burned by the hot gases, producing an asphaltic gum on the blades and blue smoke in the exhaust The pressure was reduced to 2 to 3 lb/sq, in. above the gas pressure at entry to the turbine, but the consumption still reached a figure of 2 pints/hr for each beating.
The oil is fed through orifices formed from slots in the distance pieces which are mounted on tl~e central shaft and fitted between bearings. The space above the distance pieces is fed with air from the compressor delivery and maintained at pressure by the labyrinth sealing glands.
T h e oil metering pressure drop should be fairly constant at all stages, but owing to the sealing glands being ineffective the pressure above the orifices depends upon the turbine stage pressure. In practice, this means tha t the oil metering pressure at the low-pressure end may be 10 lb/sq, in. or more greater than at the high-pressure end. A further difficulty is that the flow varies inversely with the oil viscosity and the viscosity changes rapidly in the region of normaI operating temperatures. Thus a small change in oil temperature may produce a large change in the metering characteristics.
Tests were carried out with the shaft and bearings mounted on the bench so that the oil flow from individual bearings could be measured. The oil used was a mixture of equal parts of standard engine oil (D.T.D. 109) and a thin anti-freeze oil (D.T.D. 44B) which had proved satisfactory for ball bearing lubrication in supercharger tests. The results of the tests are summarised in Table 3. I t was found that the original metering slots of shailow rectangular section passed too great a flow, but were liable to blockage as their depth was only 0.003 in. ' V ' grooves were tried and one with a depth of 0.005 in. gave an adequate flow, but choking by foreign matter could not be prevented even with the use of a 0.005-in. mesh gauze filter in the line. Finally a groove of 0.010-in. depth was used in order to prevent lubrication failure and the increased oil flow accepted for the duration of the tests.
I t was concluded that the existing oiling system was unsatisfactory because the size of the metering orifices was impracticably small, the pressure drop was not adequately controlled and small temperature variations resulted in large changes of oil flow. Finally the amount of oil reaching the balls and races was a mat ter of chance as there was nothing to prevent all the oil leaking straight past the side of the bearing. Probably some form of pre-mixed oil mist fed to the bearings with the cooling air would be a more satisfactory arrangement, r
9.5. Other Constructional Features.--Most of the troubles which occurred during developments were connected with the use of temperatures above the designed figure.
17 (98514) B

Trouble was experienced through reduction of the clearance between the high-pressure wheel and the end casing. The initial axial clearance when cold between the ninth-stage wheel and the adjacent casing was 0-025 in. and at a gas temperature of 280 deg C. this was completely taken up and rubbing occurred. The rub was quite flniform around the whole rotor periphery just below the turbine blade roots and also close to the sealing gland outside the bearing housing. No serious damage was done and the trouble was overcome by inserting a shim 0-019 in. thick between the compressor casing and the end casing. This was quite effective until gas temperatures of the order of 500 deg. C. were used, when the trouble re-appeared. A second shim 0.018 in. wide was then added. The reason for the large cold clearance was not at first apparent, but it was probably due to the form of construction which permitted considerable relative expansion of the parts. These expansions are discussed in more detail in Appendix V.
At 500 deg C. touching between the higher-pressure rotors occurred. ° The cold clearance between adjacent rotors was 0-019 in. and the maximum expansion of the wheels would absorb 0.012 in. On examination it was found that rubbing was only apparent at some of the blade roots, suggesting that the blades were slightly proud at these points. 0.004 in. was ground off the rotor faces to increase the clearance and ensure that no blades were protruding. A successful run was then made without rubbing, but after a further 12 hours running under varying conditions, rubbing again occurred at 500 deg. C. It was then apparent that some movement of the blade roots in the rotors of the seventh, eighth and ninth stages had occurred. The evidence suggested that there had been sufficient movement of at least one blade to take up the clearance and cause a slight rub. This would tilt the wheel and set up an oscillation which would produce heavy rubbing and t i r ing of the adjacent wheels. These would, in turn, rub against their neighbours.
The movement of the blades was out of the hub on the high-pressure side and may have been caused by some racking action produced by differential expansion of the austenitic steel of the blades and the carbon steel of the hub. There was no evident loosening of the root fixing at room temperature.
TiRing of the wheels did not cause any trouble apart from the rubbing mentioned above as there were no disturbing forces present. In flight, gyroscopic forces would tend to tilt the wheels and it is considered that some improvement is necessary to restrain the wheels and avoid the possibility of heavy rubbing. Measurements of tilt indicated an average movement of 10" 010 in. from the normal position of the wheels at a radius of 4 in. when the bearings were cold and new. After a few hours running the movement was found to be as great as ~z0"020 in. In addition the bearing slackness increased as the temperature was raised and under operating conditions the possible tilt would be still greater.
Some permanent tilt of the wheels was discovered to be due to a minor fault in construction. The bearings could not be pulled down square with the fades of the wheels in which they were housed because the radius joining the end face and the bore of the housing was too great. This threw the wheel out of truth, but was easily rectified by machining down the faulty radius. While referring to the workmanship it should be pointed out that the manufacture of the blades and their assembly on the wheels entailed very difficult machining operations and careful fitting. These had been done very thoroughly, but for quanti ty production more simple construction or manufacturing processes would be deskable. The blade profiles were examined by projection and enlargement equipment and in general the blade angles agreed with the designed values. There were one or two cases of bad reflex curvature at the leading edges, but these were due to the hand finish employed.
No trouble was experienced with radial expansion, the bladetip clearance being 0. 030 in. at all stages, and no distortion due to the severe heating conditions was observed. Some stress may have been set up in the entry-end casing as the outer sections were comparatively cool and the inner sections were subjected to high gas temperatures. A form of construction similar to that employed at the high-pressure end would be more satisfactory.
18
Some wear of the sealing glands occurred and measurements made upon a new labyririth gland fitted between the eighth and ninth-stage wheels after a bearing failure showed a clearance increasing from 0.003 to 0.006 in.-after running for 10 hours." Wear of the glands between the blading shrouds also occurred, but no reliable measurements 0f this were obtained.
10. Condusions.lThe unit has largely fulfilled its purposes of providing information and data for future designs, particularly from the mechanical aspect, and it may be concluded that despite the poor aerodynamic results, the type is well worth further development.
The aerodynamic performance was very disappointing, but can be accounted for in the light of more recent knowledge and should not recur in future designs. The compressor blading had a low efficiency due to the large camber and negative stagger angles employed and could not, unb0osted, produce sufficient pressure before stalling to drive the turbine. The performance of the latter was masked by the large air leakage from the compressor which assisted in raising the gas temperature required to extremely high figures.
From the mechanical view-point there does not appear to be any radical cause why good running should not be obtained and maintained. The unit is compact and the independently rotating wheels permit the failure of one or more rotors without endangering the whole unit.
An important feature is the complicated machining and fitting processes involved in the 'con- struction. Precautions are necessary to prevent any movement of the blades out of the hubs, and provision must be made to prevent the wheels touching each other due to thermaI expansion or tilting.
As designed the unit was suitable for running at temperatures up to 300 deg. C. Above this, t h e major trouble was in maintaining the bearings at reasonable temperatures. Improvements are desirable in the bearing lubrication, cooling and heat-insulation systems. Attention must also be paid to the prevention of air leakage between the compressor and turbine blading and to adequate allowance for thermal expansion. These features will become more important as the operating temperatures are raised.
A P P E N D I X I
Details of Contra-flow Turbo-compressor Design
1. Designed Operating Conditions.
Condition Entry pressure . . . . Delivery pressure .. En t ry temperature Delivery temperature Number of rotors . . Mean rotor speed Mass flow .. Pressure ratio ..
Overall efficiency ..
Stage efficiency ..
Power . . . .
lb/sq in. abs. lb/sq in. abs.
deg C. abs. deg C. abs.
r . p . m . . .
lb/min.
, . o ,
° • , ,
• * . .
h.p. . .
19
Co?nprgssor . . 5.45
14.70 238 334
. •
. . 10100
. . 200
.. 2.7:1
0.83
0.85
213
Turbine 14.30 5.47
416 325
9
10100 200
2.62:1
0.92
0.90 213
(965~4) B 2

Blading*. Inlet angle
Exit angle . .
Camber angle
Stagger angle
Radius . .
Chord . .
Number of blades/rotor
Pitch/chold ratio ..
Entry-guide Blades.
Inlet angle . .
Exit angle . . . .
2. Dimensions and Weights. Overall length of unit
8 P
0
degrees
degrees
degrees
degrees
i n . . .
i n . . .
degrees
degrees
in.
60.9 19.3
18.9 52.3
42.0 33.0
- -39 .9 35.6
4.372 4.302
0-90 1.10 32 32
0.953 0.768
Overall diameter of unit . . in. Total weight of unit . . lb. Rotor width . . . . in. Rotor Weight (average) .. lb. Bearing size . . . . in.
Bearing weight .. . . oz.
g 0
0 •
Q •
0 P
0 I
0-0 0.0
36.2 23.2
3. Materials. • Low pressure end, cas ing . .
High pressure end, casing Compressor ca/sing .. Blades . . . . . .
Rotor hubs . . . .
Bearings distance pieces . .
Central shaft . . .
175/16
159/16 177 1.20
7 1/4
Between low and high-pressure flanges.
At entry flange. "
Completely assembMd, a s inF ig . 4.
With blades assembled. 1 3/8 × 3 × 11/16 Hoffman Type N.3275,
15 10 ba l l s - -deep-groove track tempered for operation at 200 deg. C.
Firth-Vickers "Crown Max" stainless steel. Firth-Vickers "Crown M a x " stainless steel.
R.R. 50 alloy (D.T.D. 133).
K.E. 965 (D.T.D. 49). High tensile steel (S. 11).
High tensile steel (S. 11).
Case hardening steel (S. 14).
A P P E N D I X II
Compressor Design Considerations
The desired performance is first settled and some preliminary calculations made to determine the approximate dimensions of the unit. After this the design hinges largely upon the angles and speed at which the air flows through the compressor. The conditions in two adjacent stages rotating in opposite directions are indicated in Fig. 8, together with the nomenclature adopted in the following analysis.
* All figures .refer to compressor roots a n d t u r b i n e tips.
20

Equations connecting the flow are derived from the triangles of velocities, assuming that tile corresponding air angles and the axial velocities are the same in each stage.
C a = W l c o s ~ i . . . . . . . . . . . . . . . . . . (1)
U = Ca (tan ~ -- tan t)
--= Ca (tan ~ + tan /~)
_ W~ cos ~1 (tan c~ + tan c~) . . . . . . . . . . . . . . (2) 2
The blading is designed upon the free vortex-flow principle. The basis of this is that the air flowing between stages shall move in a free vortex, thus avoiding radial-flow components. To produce the free vortex the directions of air flow at different radii are given by E('I' ) ( ) ]
tan~1,----½ ~d-r~re t a n ~ + ~r~ cr~ tan~.~ . . . . . . . . . (3)
tan c~2~ ~ ½[ r(~ r~ ) t an cq~ + (r~ d - r ~ ) t a n ~2~] . . . . . . . . . . (4)
where r is the radius to a point on the blades and suffixes t and r refer to blade tip and root con- ditions respectively.
Finally the pressure rise in a stage is given by
~i b _ ~ p C a U Itan c ~ _ tan c<~:l
2g
where ~7, is the stage efficiency and p the density. The conditions at the roots are used as a convenient datum.
' An examination of equation (5) shows that the maximum pressure rise is obtained with the maximum permissible values of I/VI~ and cq~ and the minimum value of ~ . . I t is assumed• that Ca is constant at all radii and so. W~,. cos ~ = W~ cos ~ , but from equation (3) cos c~1~ is always greater than cos ~, . Thus it follows that W~ is greater than .W~. A maximum limit to W~ is set by acoustic considerations and is most likely to be reached in t he low pressure stage. The Mach number should not exceed 0.75 and under N.T.P. conditions this limits the relative air velocity to approximately 800 ft/sec, but the actual designed limit may be set by limitation to the axial Or peripheral velocities which are dependent and are found from equations (1) and (2). The lat ter is limited by the safe working stress of the material used for the blades and the former by the blade height. A low axial velocity requires a large blade for a given flow and consequently a large compressor diameter. An increase in velocity results in a corresponding reduction in the blade and compressor dimensions but leaves the blade-tip clearance necessary to ensure mechanical safety almost unaltered.
Thus the ratio tip clearance to blade height will increase and a figure may be reached where serious tip leakage occurs with a resultant falling off in efficiency. This applies particularly to the high-pressure end of the unit. "
The values of s<~ and s<2~ are bound up with the pitch/chord ratio, camber and stagger of. the Mades, and .the final selection of their values must be made by reference to wind-tunnel experi- mental results. An examination of their effects upon the pressure rise and the limiting velocity features can, however, be made by examination of equations (1), (2), (4). With constant W~ and c~, increasing c~1, will increase ~p and U, and decrease Ca. Apart from the possibility o f reaching the maximum peripheral speed, a high value of cq~ results in a considerable reduction
21

of the passage area between the leading edges of the blades due to their thickness and tends to produce local velocities exceeding the acoustic velocity. T h e highest reasonable value of cq to avoid this can be set at approximately 60 deg.
With constant WI~ and cqr, decreasing a2r will increase @~ and decrease U,. Ca will be slightly increased, but the value of r/r~ has only a small effect upon oat, and so upon the velocities and pressure rise. The lower limit of ~r is set by the maximum deflection cq~ -- ~ which is possible without breakaway or stalling of the air flow. This deflection is of the order of 30 deg., but for any particular case is determined from experimental results. Another factor which assists in fixing the limit is provided by the blade pitch/chord ratio, sic. The deflection can be increased as sic is reduced, but the minimum Value of sic depends Upon how closely the turbine blades, which are mounted nearer the hub, can be spaced. I t is probable that the compressor blade root sic will not be much less than 1,0.
Referring now to the data available from cascade tests i, 2, and bearing in mind the foregoing limitations, the maximum deflection and the air incidence and deviation can be fixed, and hence the blade angles set. Once the first stage has been fixed it is possible to deduce the pressure and density after the stage for an assumed stage efficiency, and so proceed to the second and following stages in turn.
The blading is easier to manufacture if the shrouds are maintained at a fixed radius and t h e angies kept constant i n all stages. Under these conditions the limiting conditions of velocity or stress will occur in tile first stage and the values of U~ and Ca will be constant throughout the compressor. Ca can be maintained constant in all stages b y simply cropping the blades to the requisite height and adjusting the Casing diameter accordingly. It is more convenient, however, to give the casing a uniform taper from entry to delivery , and this resMts in slight departures from the constant axial flow.
APPENDIX I I I 1repulse Rate I~dicator
1. Gemral.--The indicator was primarily designed to measure the speed Of a bladed rotor, the chief requirement being that no mechanical connection be made to the rotor. It operates on the variable capacity method, a suitable insulated electrode being mounted within 0. 025 in of the blading in such a manner as to produce a small capacity change of the order of 1 micro- microfarad or less. I t comprises the necessary high-frequency oscillator circuit, detector, signal amplifier and frequency-indicating circmt. A reflecting galvanometer is incorporated with an illuminated scale, its reading, on an appropriate range, being proportional to the frequency. There are three ranges covering frequencies from 50 to 6,000 cycles per second. Calibration is carried out by injecting a sinusoidal signal of known frequency from an oscillator.
2. C#cu~t.'-A circuit diagram is given in Fig. 22. The operation of the instrument may be divided into two p a r t s -
1. The conversion of the capacity change produced each time a rotor blade passes tile insulated electrode into a voltage signal of suitable magnitude.
2. A frequency-measuring circuit for indicating the mlmber of voltage signals received per second.
2.i. Co~vel, sio~ Circuit.--Referring to Fig. 22, the first valve V1 is arranged to oscillate at a constant frequency of about 1 megacycle/sec. The output from this valve, the carrier wave, is applied to the grid of a separator valve, in the anode circuit of which is the primary of a high- frequency transformer. The purpose of this separator valve is two-fold. First, it prevents any change in capacity across the transformer secondary from varying the carrier wave frequency, and, secondly, it avoids the necessity of having a carrier wave of steady amplitude, as it is overloaded and any further change in the amplitude of the grid swing will not affect the output amplitude.
22

The insulated pick-up electrode is connected, through a 0.005 microfarad condenser, to the grid of the detector V3. The capacity change produced when a rotor blade passes this electrode thus takes place across the secondary of the high-frequency transformer which .is also shunted by coarse and fine tuning condensers. These form an acceptor circuit which may be tuned to the carrier-wave frequency by variation of the condensers. The operating point is chosen on the linear portion of the resonance curve Of this tuned circuit. This is indicated b y a predetermined reading on the galvanometer which is connected across a 2-ohm resistance in the cathode circuit of the detector when the range switch is in position ' 0 '
The carrier wave picked up by the acceptor circuit is modulated by the capacity change product each time a blade passes the insulated electrode. This modulated wave is detected by V3, the output of which then consists of voltage signals, the interval between two successive signals being equal to that between the passing of the insulated electrode by the two rotor blades producing these signals. These signals are amplified by the pentode V4 and then applied to the frequency indicating circuit.
9..2 Frequemy I~dicati~g Circuit.--The frequency indicating circuit consists of two gas triodes, V5 and V6. V5 acts as a square-wave generator, the output across its anode load being of the same frequency as the input pulses but of a square-wave form. This output is passed
• through a high-pass filter consisting of a 15 micro-microfarads condenser and a 100,000-ohrn resistance. The filtered signal consists of a number of sharp peaks alternatively positive and negative, the frequency of either the positive or negative peaks being equal to that of the input pulses.
These sharply peaked pulses are applied to the grid of a second gas triode V.6, which is biased just beyond its striking point. Thus, as each positivepulse is applied to the grid, V.6 strikes and a condenser discharges through the valve, a 500-ohmanode ~esistance and a 10-ohm resistance in the cathode circuit. The discharge continues until the plate voltage can no longer maintain it, when it ceases and the condenser charges up once more through the 200,000-ohm resistance. This sequence takes place for each positive pulse applied to the grid of V.6, so that the mean discharge current is proportional to the frequency of these pulses if the condenser has sufficient time to charge to the full high-tension voltage after each discharge. Suitable condensers have been chosen for the various frequency ranges required. The mean discharge current is indicated on the galvanometer.
3. CaZibration.--The instrument is calibrated by injecting on to the grid of V.5 a sinusoidal voltage signal of known frequency. For this purpose the gain potentiometer is connected through a switch marked ' USE-CAL.', to a terminal marked ' CAL.' on the front panel of the instrument. In its present form the range of the indicator is from 50 to 6,000 c.p.s. The upper limit may be increased by choice of a suitable discharging condenser.
23

A P P E N D I X IV
Air Leakage
Evidence that air was leaking from the compressor to the turbine and estimates of the quant i ty have been based upon a s tudy of the following : - -
1. Turbine-blade temperature.
2. Gas-entry temperature and fuel supplied.
• 3 . Gas-exhaust temperature and turbine temperature drop. 4. Pressure loss in combustion system.
1. Turbine Blade Temperature.---Consider the curves in Fig. 18. It may be assumed that the gas temperature is slightly higher than the temperatures shown, and it is known that the temperature before the turbine is reasonably uniform, so tha t the rapid fall away in temperature towards the shrouds and the excessive drop can only be explained by air leakage. Leakage may occur either between stages or at the compressor delivery annulus where the inner wall of the Volute slides inside the end-casing expansion sleeve. The latter would permit air to flow.parallel with the gas stream and it would be expected that near the shrouds this would produce a big drop in temperature, but would not have much effect further down the blades. This appears to be the condition before the ninth stage. If all the leakage was from this source the cool air would diffuse in th e following stages, lowering the gas temperature towards the blade roots a n d increasing it nearer the shrouds. In fact, it continues to fall right across the section, and this suggests that any tendency to evening up is counteracted by air leaking across the shrouds. This air will enter the gas stream at right angles to the flow and its influence will be felt nearer to the blade roots.
Using the curves of Fig. 19, a calculation of the air leakage before the ninth stage and between each pair of rotors has been made by equating the temperature rise of the leakage air with the temperature drop of the gas. The total estimated leakage was 52 per cent, made up of 10 per cent before the ninth stage and 42 per cent between the rotors. This may not be the true ratio, but it seems reasonable to assume that at least 30 per cent of the compressor air is leaking into the turbine between stages.
2. Gas Entry Temperature.--The gas temperature at entry to the turbine is dependent upon the fuel supplied to the combustion chamberl upon the air flow through it, the efficiency of the combustion system and the initial air temperature. From the measured temperature rise the theoretical air/fuel ratio is obtained and from the measured fuel flow the actual air flow is obtained.
T3 = 405 deg C. T, =
Temperature rise in combustion system =
Assume heat loss, etc. = 334 Then theoretical temperature rise = 0.85 =
Air/fuel ratio to produce this rise =
Measured fuel supply =
Therefore air flow through combustion chamber ----
Air entering compressor
Therefore leakage ---- 47.7 107.5
71 deg C.
T3 -- T2 = 334 deg C.
15 per cent
393 deg C.
101 : 1
35" 5 lb/hr.
101 × 35.5 60 lb/min.
59" 8 1b/rain.
107- 5 lb/min.
44.4 per cent.
24

3. Gas Exhaust Temperature.--The temperature drop due to the turbine pressure ratio depends upon the initial gas temperature and the efficiency. If it is assumed tha t the remainder of the drop to the exhaust temperature is due to cooling from air leakage it is possible to equate the heat lost by the gas with the heat gained by the air, and so calculate the degree of leakage.
Assume turbine efficiency = 0.85
Turbine pressure ratio = 1. 217 1
Therefore turbine temperature drop = 0.85 × 678 × 1 -- (1 .217) °~s
= 30.6 dog. C.
Mean exhaust temperature (from Fig. 7) = 195 dog. C.
_~{ean compressor air temperature = 50 dog. C.
Let air leakage = Q lb/min.
Then ga s entering turbine = (107.5 -- Q) lb/min.
Assume constant specific heat over full range of temperatures and equate : - -
(107.5 - -Q) × (405 - 3 0 . 6 - 195) --- Q (195 - 50)
Q = 59.5 lb/min. ~
59.5 --= 55.3 per cent. i.e., leakage -- 107.5
4. Combustion System Loss.--Tests of combustion chambers have shown that the loss in pressure they create can be expressed as a percentage of the velocity head of the air at entry to the chamber. Thus, if the mass flow and density of the air are kr/ownl it is possible to calculate the actual pressure drop or conversely, knowing the pressure drop to calculate the mass flow. The drop between the compressor delivery and "turbine entry is known and by allowmg an additional percentage of the velocity head for the losses in the pipes and bends, the actual flow through the chamber can be estimated. From this the leakage is at once apparent.
Pressure drop in combustion sys'tem = 400 per cent. of velocity head in 4-m. diameter entry pipe.
i.e., h -- 4 × ½pv ~
_ lg ~× T2 × 4.37 × 10 .5 P2
/ ( P o . × h) Where W air fl0w lb/min. Therefore W = 151 .5~/ \ - T~
. . . . . . . = 151"5~/(36"8×3441"04)
= 50.6 lb/min.
Leakage 56.9 107.5
- 53 per cent.
P2 compressor de!ivery pressure, in. Hg abs.
T2 compressor delivery temperature deg. C. abs.
h pressure drop, in. Hg.
The calculations are straightforward and require little explanation, but cannot be regarded as extremely accurate because of the simplifying assumptions made. Nevertheless they do check reasonably well between themselves. The leakage is approximately 50 per cent. of the initiM mass flow, and this appears to hold good over the whole range of mass flows.
25
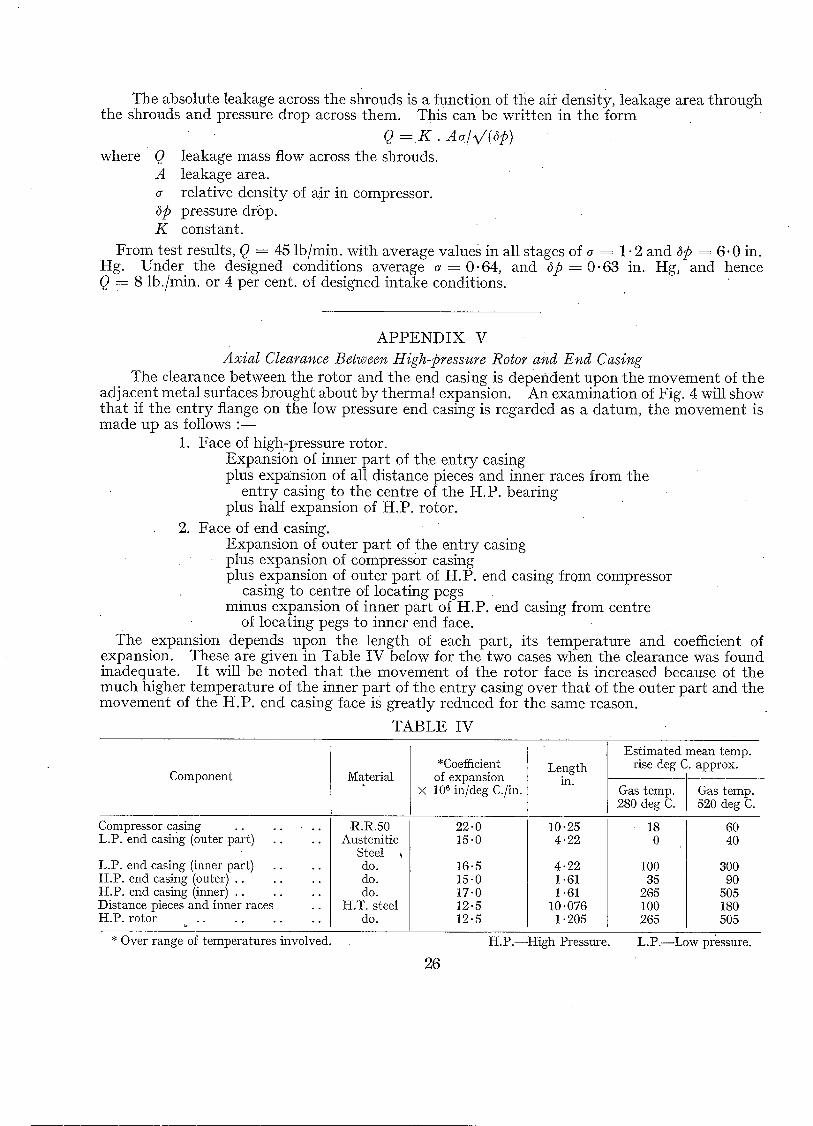
The absolute leakage across the shrouds is a function of the air density, leakage area through the shrouds and pressure drop across them. This can be written in the form
(2 = K . A@V' (@) where Q leakage mass flow across the shrouds.
A leakage area. relative density of air in compressor.
@ pressure drop. K constant.
From test results, Q = 45 lb/min, with average values in all stages of ~ = 1- 2 and @ = 6.0 in. Hg. Under the designed conditions average ~ = 0-64, and @ = 0.63 in. Hg, and hence Q = 8 lb./min, or 4 per cent. of designed intake conditions.
A P P E N D I X V Axial Clearance Between High-pressure Rotor and End Casing
The clearance between the rotor and the end casing is dependent upon the movement of tile adjacent metal surfaces brought about by thermal expansion. An examination of Fig. 4 will show that if the entry flange on tile low pressure end easing is regarded as a datum, the movement is made up as follows : - -
1. Face of high-pressure rotor. Expansion of inner part of the entry casing plus expansion of all distance pieces and inner races from the
entry casing to the centre of the H.P. bearing plus half expansion of H.P. rotor.
2. Face of end casing. Expansion of outer part of the entry casing plus expansion of compressor casing plus expansion of outer part of H.P. end casing from compressor
casing to centre of locating pegs minus expansion of inner part of H.P. end casing from centre
of locating pegs to inner end face. The expansion depends upon the length of each part, its temperature and coefficient of
expansion. These are given in Table IV below for the two cases when the clearance was found inadequate. I t will be noted that the movement of the rotor face is increased because of the much higher temperature of the inner part of the entry casing over that of the outer part and the movement of the H.P. end casing face is greatly reduced for the same reason.
TABLE IV
Component
Compressor casing . . . . L.P. end casing (outer part) . . . .
L.P. end casing (inner part) . . . . H.P. end casing (outer) . . . . . . . H.P. end casing (inner) . . . . . . Distance pieces and inner races . . H.P. rotor . . . . . . . .
Material *Coefficient
of expansion l0 G in/deg C./in.
22.0 15.0
.R.R.50 Austenitic
Steel , do. do. do.
H.T. steel do.
Length in.
10.25 4.22
X
16.5 15"0 17.0 12.5 12.5
4"22 1.61 1"61
10.076 1.205
Est imated mean temp. rise deg C. approx.
Gas temp. Gas temp. 280 deg C. 520 deg C.
18 60 0 40
100 300 35 90
265 505 100 180 265 505
* Over range of temperatures involved.
26
H . P . - - K i g h Pressure. L . P . - - L o w pressure.
From these figures it is easily deduced tha t at 280 deg C. the axial clearance is reduced by 0-026 in. and at 520 deg C: by 0.043 in. At the former temperature the cold clearance was 0.025 in. and at the latter 0.044 in. I t will be seen that at 280 deg C. rubbing would occur over the whole face of the rotor, but at 520 deg C. there should be a slight clearance, but due to the higher expansion coefficient of the blades over the rotor hub, they would project nearly 0.0015 in. beyond the hub, and so take up the clearance. This deduction is borne out by the signs of rubbing which were confined to the blade roots at 520 deg C., but extended over a large area at 280 deg C.
NO.
1
2
3
Author
R. G. Harris and R. A. Fairthome
H. Constant . . . . . .
Bristol Aeroplane Co., Ltd. ..
R E F E R E N C E S
Title, etc.
.. Wind-Tunnel Experiments with Infinite Cascades of Aerofoils. R. & IV[. 1206, Sept., 1928.
.. Notes on Performance of Cascades of Aerofoils. A.R.C. 4155, June, 1939.
•. The Measurement of Piston Temperatures by Temperature-Sensitive Paints. Bristol Report No. T.A. 4957, Feb., 1941. A.R.C. 4976.
27
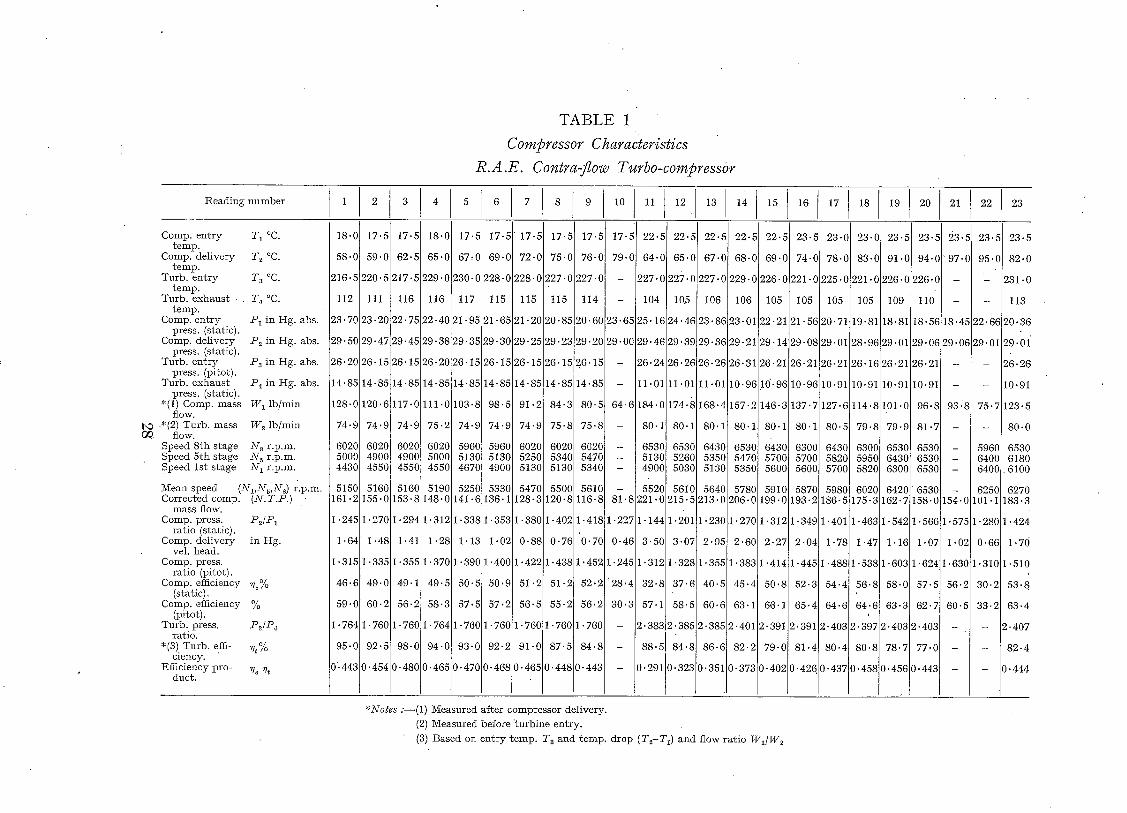
T A B L E 1
Compressor Characteristics R.A.E. Contra-flow Turbo-compressor
Reading number 1 2 3 4 5 6 7 8 9 10 11 12 13 14 15 19 20 21
17.5 22.5 22 .5 22.5 22-5 22.5 Comp. entry T 1 °C. temp.
Comp. delivery T e °C. temp.
Turb. en t ry T a °C. temp.
Turb. exhaust T 4 °C. temp.
Comp. ent ry /~1 in Hg• abs. press. (static).
Comp. delivery -Pe in t tg. abs. press. (static).
Turb. entry Pa in t tg. abs. press. (pitot).
Turb. exhaust -Pa in Hg. abs. press. (static).
*(1) Comp. mass W 1 lb/min flow.
b~.-*(2) Turb. mass We 1b/rain 0V flow.
Speed 8th stage N s r.p.m. Speed 5th stage N 5 r.p.m. Speed 1st stage N~ r.p.m.
~ e a n speed (N1,Ns,N8) r.p.m. Corrected comp. (N.T.P.)
mass flow. Comp. press. .Pc/_P:t
ratio (static). Comp. delivery in tIg.
vel. head. Comp. press.
ratio (pitot). Comp. efficiency %%
(static). Comp. efficiency %
(pitot). Turb. press, .P3]2%
ratio. *(3). Turb. effi- Vt%
clency. Efficiency pro- vc ~h
duct.
18.0 17.51 17.5
58.0 59.01 62.5
216.51220,51217.5 i
112 [ 111 I 116
23.70 23.20[22.75
29.47120.45
26. 15128.15
29.50
26.20
14"85
128.0
74.9
6020 5000 4430
5150 161.2
1-245
1-64
1.315
46.6
59.0
1.764
95.0
0-443
18.0 17.5
65.0 67,0
229.0 230- 0
116 117 115 115
22.40 21-95 21-65 21'-20
29.38 29-35 29-30129-25
26.20 26- 15 26- 15 26.15
1 7 - 5 17.5 17-5 17.51
69-0 72.0 75-0 76-01
228-0 228-0 227-0 227-01
115 114
20- 85 20- 60
29-23129-20
26.15126 • 15
79.0:
3-65
9-00
64.0 65.01
227.0 227. O I
104 105
25- 16 24.46
29.46 29.39
26.24 26. 261
67.0i
227.01
106
23. 861
29.361
26.261
68"0
229- C
106
23-01
29-21
26.31
69"0
226"0
105
22-21
29-14
26"21
221-01
21-56
29-08
26.21
16 17 18
23-5 23.0] 23.01 23., C
74-@ 78.0] 8 3 . 0 91.(
225.01221 .O 226.(
105 I 105 105 109
20.71 19.81 18.81
29.01 28.96 29.0]
26-21 26-16 26.2]
10-91 10.91 10.9]
127-6 114.8 101-(
80-5 79-8 79-~
6430 6300 653( 5820 5950 643( 5700 5820 630(
5980] 6020 642( 186-5 [75"3 162"~
l '401 t '463 1"54~
1-78 1"47 1"1(
[ ' 4881 t- 538 1- 60~
54.4 56.8 58.(
64.6 64:6 63.2
~.403 b397 2.402
80.4 80.8 78.7
).4371 ).458 0.45E
14.85114.85 14.85
120.61117.0 111.0
74.91 74.9 75.2
60201 5020] 6020 49001 49001 5000 45501 4550 4550
51601 51601 5190 155.01153.8 148.0
1.27011.294 1.312
1.481 1.41 1.28
1.33511.355 1.370
49-0 49.1 49.5
60-2 56.2 58.3
• 769 - 7 6 0 1 . 7 6 4
92.5 98-0 94.0
~.454 ~.4800.465
14.85 14.85
103,8 98.5
74.9 74.9
5960 5960 5130 5130 4670 4900
5250 5330 141.61136-1
1.338 1.353
1.13 1.02
1.390 1.400
50.5 50.9
57.5 57.2
1.760 1 • 760 1 • 760
93.0 92.2 91.0
0-470 0.468 0.4?5
14-85114.85 14.85
91-2 84-3 80-5
74-9 75-8 75-8
6020 6020 6020 5250 5340 5470 5130 5130 5340
5470 5500 5610 128.3 120.8 116.8
1.380 1-402 1.418
0.88 0.76 0.70
1.422 1.438 1.452
51.2 51.2 52.2
56.5 55.2 56.2
1 • 760 1. 760
87.5 84.8
O. 448 O. 443
54-6
S1.8
• 227
0.46
• 245
28.4
30.3
11-01 11.011
184-0 174.8
80-1 80.1
6530 6530 5130 5260 4900 5030
5520 5610 221.0 215-5
1-144 1-2011
3.50 3-07
1.312 1-328
32-8 37.6
57.1 58.5
2.383 2- 385
88.5 84-8
O. 291 O. 323
11.011
168.41
80.11
64301 5350[ 51301
56401 213.01
1-2301
2.95t
1.355[
40.51
60-61
2.3851
86.61
)-3511
10.96
157.2
80.1
6530 5470 5350
5780 Z06.0
I • 270
2.60
I. 383
45.4
63.1
~..401
82.2
)- 373
10-96
1 4 6 . 3
80.1
6430 5700 5600
5910 199.0
1 . 3 1 2
2.27
1 . 4 1 4
50.8
66" 1
Z.391
79.0
). 402
10,96
137-7
80" 1
6300 5700 5600
5870 I 193.2
1.349
2.04
1.445
52.3
65.4
.~. 391
81.4
).426
23., t
94.(
226. (
110
18.5(
29.0(
26.2]
10.9]
96-~
81.5
653( 653( 653(
• 653( 158-(
1.56(
1 - 0 7
1- 624
57.5
62- 7
2. 403
77.0
0.443
23.5
97.0
8.45
9.06
93:8
54-0
-575
1.02
• 630
56.2
60-5
22 23
23.5 23.5
95.0 82.O
- 2 3 1 . 0
- 113
2.66 20.36
9.01 29.01"
- 26.26
- 10.91
75.7 123"5
- 80.0
59601 6530 64001 6180 64001 6100
6250 6270 01.1 183.3
-280 1.424
0-66 1.76
• 310 1-510
30-2 53.8
33.2 63-4
- 2- 407
- 82.4
- 0-444
*Notes .'--(1) Measured after compressor delivery.
(2) Measured before "turbine entry•
(3) Based on entry ~emp. T 8 and temp. drop (Te-Ta) and flow ratio WI/W a

TABLE 2
Turbo/compressor Characteristics R.A.E. Co~tra-flow Turbo-compressor
Read ing n u m b e r 1 2 3 4 5 6 7 8 9 10 11 12 13 14 15 16 17 18 19 20 21 22 23 24 25 26
Comp. e n t r y Tx °C. t emp .
Comp. de l ivery T~ °C. t emp .
Turb . e n t r y T~ °C. t emp .
Turb . e x h a u s t T~ °C. t emp .
Comp. e n t r y p ress (static).
Comp. de l ivery press. (static).
Turb . en t ry press. (pitot).
b.~ Turb . e x h a u s t ¢D press. (static).
*(1) Air mas s W l b / m i n flow.
Fue l m a s s flow w lb/hr . Speed 8 th s tage N s r .p .m. *(2) Speed 5 th Ns r .p .m.
s tage. Speed I s t s t age N~ r .p .m.
39 .0 42 .0 45 .0 43 .0 49-5 44.51 43 .0 48-0 46.01 49 .5 52 .0 '532D 53-5 62.G 6 8 .0 6 3 .5 71 70 .5 61 .5 71 .0 64 .5 69 .0 70-5 7 0 ' 8 68 .0 7 0 .0
4 4 ' 0 49 .0 52 .5 55 .0 64-0 6 2 ' 0 6 2 . 0 73 .0 64-0 71"0 78"0 85-0 87-5 88'03 9 6 .5 94-5 106 '5 112.5 107-5 121 '0 118.5 11-1.5 126-5 136.0 131.5 149 '5
267 369 440 207 262 320 360 449 208 250 319 371 417 208 230 249 312 372 410 470 486 218 308 372 575 538
179 247 302 152 193 220 248 300 148 178 218 245 269 151 164 175 215 248 250 289 302 1 4 6 206 240 270 246
P l i n H g . abs. 3 0 . 5 6 3 0 . 4 9 3 0 . 5 1 3 1 . 2 0 3 1 . 1 0 3 0 - 9 5 3 0 . 8 5 3 1 " 1 1 3 2 - 6 5 3 2 " 5 0 3 2 " 2 0 3 2 " 0 5 3 1 " 9 0 3 5 . 0 3 4 . 6 5 3 4 . 5 0 3 4 . 4 0 : 3 4 . 1 5 3 3 . 8 3 3 3 . 4 8 3 2 ' 5 6 3 9 " 4 5 3 8 " 4 0 3 7 " 6 5 3 9 " 4 8 3 4 " 4 3
_P2 in t Ig . abs. 3 1 . 0 6 3 1 . 1 6 3 1 . 2 9 3 2 . 9 0 3 3 . 2 0 3 3 - 6 5 3 3 . 9 5 3 5 . 9 6 3 6 - 1 0 3 6 " 7 0 3 7 " 5 0 3 8 " 0 5 3 8 " 6 5 4 0 . 7 4 1 . 0 0 4 1 . 6 0 42.85 43.913 44.48 4 5 - 7 8 4 5 . 7 3 5 3 . 0 0 57-05 59.403 53.83 57.58
2 ~ z i n I t g . abs. 3 0 . 8 9 3 0 . 9 7 3 1 . 0 8 i 3 2 . 1 0 3 2 . 3 5 3 2 - 8 0 3 3 . 1 0 3 5 . 0 6 3 4 . 7 0 3 5 ' 2 5 3 6 " 0 5 3 6 ' 5 5 3 7 " 1 0 3 8 . 3 3 8 . 6 0 3 9 . 2 5 4 0 . 4 0 4 1 . 4 5 4 2 . 0 3 43-13 43.7~ 49.8(3 5 3 . 5 0 5 5 - 8 0 5 1 . 1 3 5 4 - 5 8
- P 4 i n t t g . abs." 30"11 30' 1130 .11 29.45 29-45 29.45 2 9 . 4 5 3 0 . 1 1 2 9 - 4 5 2 9 " 4 5 2 9 ' 4 5 2 9 " 4 5 2 9 " 4 5 2 9 " 8 0 2 9 " 4 5 2 9 " 4 5 29.80 29.80 29.63 29-63 30 .11:30 .20 30-20 30.20 29 .78 29 ,78
37 .6 36 .9 36 .8 78.3 78.2 79 .3 80 .0 86-4 113.1 114.1 114.2 114.1 114:9 150.9 150.1 149-3 153.1 152.1 [54.7 155 '0 1 4 7 . 7 2 1 3 . 7 2 1 5 - 5 2 1 9 . 3 2 1 2 . 3 2 0 8 " 3
12-4 14.8 17 .8 12.2 18-3 23.5 2 8 . 5 4 1 . 9 0 17.0 21 .4 29 .8 34-5 ~ 39-3 19 .5 2 1 .3 25-4 3 3 .6 41 .1 48-5 51-3 62 .0 27 .4 50 .0 62-5 - - 1880 2025 2010 3280 3470 37013 40303 4690 4400 4780 5060 5390 5625 5625 5390 5660 5625 6560 6370 6940 7125 7320 7880 8350 8250 10000
"1225 "1365 "1460 2440 2765 2905 30913 *3650 3370 3610 4170 4400 4680 4240 4450 4780 4870 5250 5250 .5810"5800 " 6 1 8 0 " 6 6 2 0 " 7 2 5 0 7750 8760
1125 1265 1360 2060 2345 2530 26713 33813 29413 31913 36113 3840 4210 3750 4030 4310 4680 4870 4960 5625 5810 6180 6940 7680 7830 9120
NIean speed
Comp. press, ra t io P~/P1 Turb . press, ra t io P3/P4 Comp adia. effi- %%
ciency. *(3) Turb . adia. Vt Yo
efficiency. Efficiency pro- ~c ~
duct .
(NvNs,Ns) r .p .m. 1410 1550 1610 2590 2860 3040 326C 3910 35713 38613 4300 4540 4840 4540 4620 4920 5060 5560 5530 6125 6240 6560 7150 7760 7940 9280
1 .016 1-022 1.026 1.054 1-068 1.086 1.100 1.155 1.106 1.129 1.164 1 .188 1 .212 ~i162!1 .183 1 .206 ~.246 1.285 1.315 1-368 1-405 1.344 1.486 1.578 1.362 1.672 1 . 0 2 6 1 . 0 2 9 1 " 0 3 2 1 " 0 9 0 1 " 0 9 8 1 " 1 1 4 1 " 1 2 4 1 ' 1 6 5 1 " 1 7 9 1.197 1 . 2 2 5 1 . 2 4 8 1 - 2 6 0 2 8 5 1 . 3 1 1 1 .333 .356 1 . 3 9 1 1 . 4 1 9 1 " 4 5 5 1 " 4 5 3 1 " 6 4 9 1 " 7 7 2 1.848 1 . 7 1 8 d . 8 3 2 31 .2 31 .4 29 .6 39-5 41 .0 42-6 46-6 54 .0 51 .4 52-5 52-5 51 .8 53-7 55 .0 5 8 .5 58 .8 61 .8 60 .5 59 .0 64 .0 64-8 69 .8 73 .0 73 .3 49.13 68 .5
133.0 136-5 117-0 106.5 1 0 3 . 0 1 0 1 - 0 93-8 83 .8 83 .4 83 .0 8C.2 83 .7 78-4 79 .3 7 8 .5 76 .5 74-03 73-5 72.1 67 .2 67 .5 66 .3 65.3 6 4 . 2 53 .2 62 .8
0 .415 0 .428 0 .347 0.421 0.423 0 .430 0 - 4 3 7 0 . 4 5 2 0 . 4 2 8 0 ' 4 3 2 0 " 4 2 2 0 " 4 3 4 0 " 4 2 2 0-434 0 .458 0 .447 0 .457 0.445 0.425! ).431 9-432 )-462 1.477 ) . 4 7 0 0 - 2 6 1 0 " 4 3 0
*Notes : --(1) Measured before compressor en t ry . (2) Speeds m a r k e d wi th as te r i sk (*) were e s t im a t ed .
(3) ]Based on en t ry t emp . Ta a n d t e m p . d rop (T2-T1).
. . . . . ~ . . . . . . . . . . . . . . . . . . . . . . . . . . . . . . . . . . . . . . . . . . . . . . . . . . . . . . . . . . . . . . . . . . . . . . . . . . . , . . . . . . . . . . . . . . . . . . . . , , , , , , , , , , ,4,, , , - = . , . , . , , . ~ . ~ , , . , 7 ¸.' , , , i , , - , . , i , . . , . . . , - , . , - , , , , , , , ,v , , , ' r , , " ' , , " , " ' , r , , , ' "D'p , I :~ , ' ~ " , ,",~, " ' , '1 ¸ , ,w,l.~, ~ , ~ , , ~ i , i , ~ , ' l , , ~ p - , , i,,, ,, ,,,,,i,, ~ ¸, ,, , , , , i , i ,q ,~, ,~, , , , , , , , ,, , , , ~, , ,,, , i , * ~ : l , l , I , , ¸ ,

T A B L E 3
LubricationTests
Shape
Rectangular
V ..
Metering Orifice
Width Depth in. in.
0-050
0-0015 0-003 0.005 0.010
0-003
Area sq. in. × 10 6
I
150 f \
Pressure lb/sq, in.
14-5 9"0
Oil
Temperature Viscosity deg C. Centi-poise
10 94.4 62 37.5
o-ooi5 0.003 0.005 0.010
2"25 9-0
25.0 100
9.0 5"0
9-0 9.0 9.0 9.0
74 55
46 60 60 60
23.0 52.0
82.0 41.0 41-0 41.0
~i'lO W
PTS/HR/ i Bearin~
0'05 1 "41 2-69 O" 70
0.005 0.05 0.35 1.50
Oil used :--50 per cent. D.T.D. 109
50 per cent. D.T.D. 44 B
30

~z ~ o ~
¢ah,~o T H ~
~,| P. ).
\
B,F--A,~I htC~ T HF-.RH~C(~UPL,~.
t.
\ \ \ \ \ \1
Cb) E'&PA, N~ION ~ING
(~) SHRUNK R,~G
FIG. 1. Contra-itow Wheels.
I
C) I N ~ R T E ~ ~ L A O ~
E~HAUST C.,A~
CO~PR~.SS/0~t
J
f
LAMP ~ PHOTO CELl-
I S'F:' E'E.I~ RE.GO RE3E~:~
COH PI~tE~5 OR' L )
WHEE 1 MOUNTING RIG
. ~ ~ C O M e, IJ~'TION CHAM~,ER
A~R "Or"--
FIG. 2. Test Rig.
31

• C
4-oo
~0,~
. I
3
200
.IX
h
X
I 0 0
/
/
-FURI~N~ RJ~4G
SHRUNK RiNG
S E A R t N ~ - *
co 27::oR
O . ;OO 8 0 0 o C GA.S T E M P ~ . R A T U R E
FIG. 3. Shrunk-Ring Wheel Temperature Distribution.
39.

/ ,
( ' 9(~®@@@@
®
@
@
®
®
@-
@-@ @ ®
@ -@ @
®
-(9
.$"
'S'
SECTION "S.S'. ~¢~ECTION 'B.B:
_HALF SECTION XK.
FIG. 4--ARRANGEMENT OF CONTRA-FLOW TURBO COMPRESSOR

t~ r
4 ,J
/ ,
FIG. 5.
33
(96.;14) C
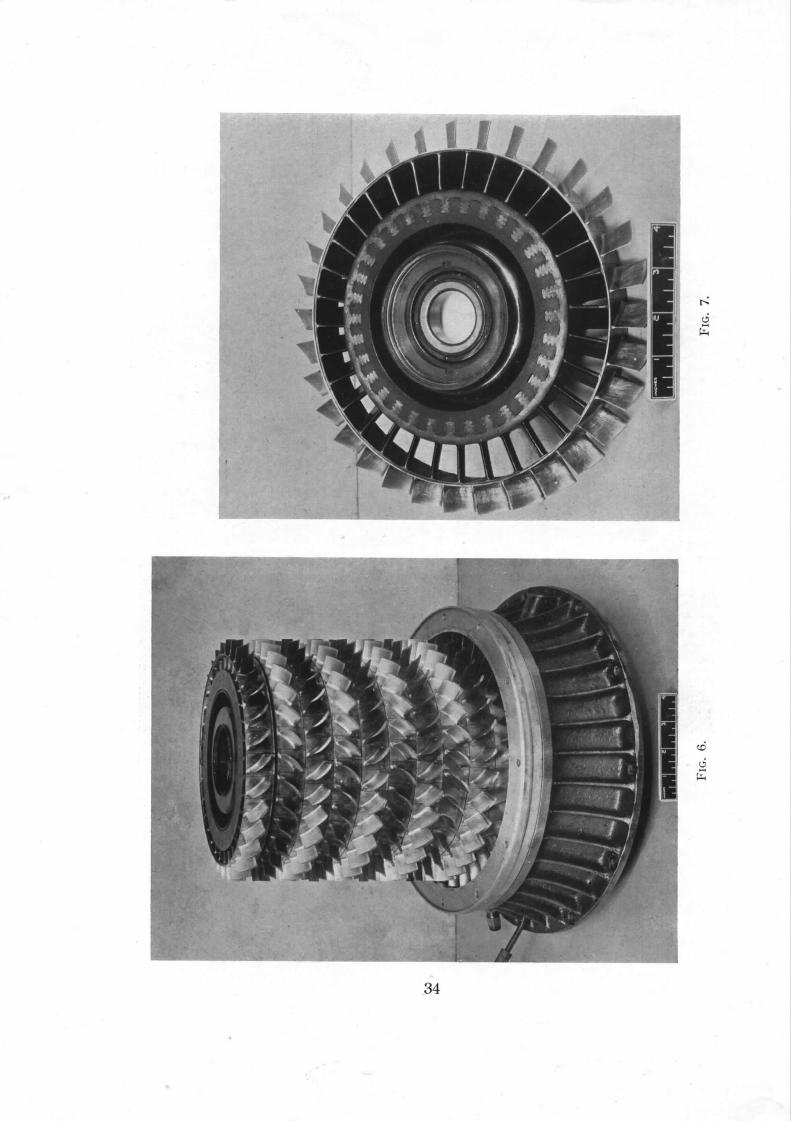
1
I
~6
34

,$
I"
o l - - J o t J e /
~,,=, ~ t ~ t.7 tot t - t - 0~tt0
1
Z O
Z
o= 5
b. td
~ ~ - ~ .
ut" I-- ' >" ~[:
= e,.-,., g ~ °~
I I i I a
J
:z:
O
x c~
O 0J " ~
O
5 b
x
@ AIR ~ktl-~.Y l:~Oivl P L A N T C.OM~I~"$SOR
(~) C O M I ~ . $ S O ~ A IR E N T I T Y ANNULUS (~) CONTRA- I~,.OW 'TURBO- COMI=RE,C~OR UNl't"
coM~Sso~ n E L t V E R Y VO~UTB" E X P A N S I O N ~3"OINT
(~) COWIB~6TION CHAM~,ER
"FLJRBINE. E X H A U S T
j tl
I~.'- tO~ OVERALL .
®
®
t / ]
L - - .
®
®
F G. 3. General Arrangement Sketch Of Plant Lay-0ut,
35 ( 9 6 5 1 4 ) D

td ~ == p-
bJ n
)- r~
~J
Z
500
f0(~ ,. ,
/VtFU55 FLOW:- ,3GL~, /WIIN
I I
8 0 LB JMaH
/
I
I i I I
I / I
/ 114 L,B I~JN /
/ /
/. /
/ /
/
/150 L.B JMtN
/
zeoL6 JMm /
/
~oo *~o 4-#o0 ~floo 6p~ Z0~ M~A. ~OTOR SP~O (IF5T" B.~sr~G~)
~IC. 14. Turbo-compressor Characteristics.
8x~oo 9~oo R.RM to,00O
ffl
o I- o
s p~. "---.. ]
A5 DF-SI~NKD 10.000 ~ .
MEPtN 5PE~.D (i s*, ~ T t " B T M ~TP, C~ES):- s.ooo I /
9 0 0 0 R.P- M. ~ . ~ ~ l T M
~ooo . . /
6000 R PM / ~I------_. _-~-/~--~ 7.000
7000 , R ~ '
6.O0C / - 6 0 0 0 '
5.0oo 5 0 0 0 R.P.M / • / /
/ . . . - - - - -
/
/
/
/ /
/ /
/ /
l /
4.(]00 ,,~. . ! 2 3 + 5 6 7
5TRGE N ~
FIG. 15. Est imated Rotor Speeds.
38

2-0
1"8
o
P rr"
Ld m D LO o~
I'0
36Lt~ /MIN
j f
TURP, tNF- PRE5.5. RPtTIO
CQ MPRF.~5OR -
F_.Xl"RP~POt./ATEO ,, INTER:SECT~OH OR 5I~LF- RUNHIHGi
><'S-.;
xpoo
150 LB ] ~ N
N1FI,5.5 FLOW5 : -
?.Zo I.~ JMeH
apoo . ~ ,¢~<m 5.000 ~ooo 7,oo0 M ~ N ~ r o R ~PE,~
/ f ~
f J " / / / /
/ /
/ d /
0oo
FIC. 16. Pressure Ratios at Varying Speeds and Constant Yass Flows.
9.0oo RP.~ I~.ooo
° C
gO0
?u• OI
GO0 _ _
500
13"
400
L.~ /MlN
r~00
,!
) O
tO Z ~
"-100
1000
j J
J
,J
J J
J
Z0Q0 s0oo ~ooo sooo sooo Tooo
-HE~,N ROTOR SP~EO-~s* , 5 T". S ~. ST~C, CS')
• FIG. 17.~ Est imated Self-running Characteristics. o
39
8000 9000
2"0~
o 1"6.
t/I
1.4. ~
1.0
R.RH.

FLOW
o F H.P.
TE M F~EI~'ATU Iq E rbC JOO ~.OC, 300
7
FACE OF ~,VHEEL.
/
• ~IE.A RINCT T E H P [
IMF~ROVED BEARINr~ COOL|NCT U P S T R E A M FACE I
FIG. 18. Results of Temperature Indicating Paint Test on High-pressure Stage Wheel.
,ROUD5 ' RooTs OF" :-
o c ~TN
, T r l ~
• I G TM
loo o ~ ~ 8 g
FIG. 19.
MEASURED ENTRY TEHPER~TUR~
3"~K I
pN~,
I Is, r ]
MEA.St.J ~ED EXHAUST Tr-HPERATURE
~STtMATEO EXHAUST T.~HPtRATU~E (M£A~
I Turbine-blade Temperature Distribution.
IN.
40

L6 tHIN
05
@ ® ®
®
i FEE r~ TO 18 • " ~-6 IN, [3]A HOLES
_- ~ IN C~IA HOLES " /
{ ; 8 - ~ iN. D,A: ~OLE~ , / FEED TO 6 - 0 . o 6 6 IN ~{:~l~S IN,GrRQQ~EE,
r io - T~ ~N~ DIA. H{~LES / 8 - ~-~. IN: DIA+ HOLES / FEED "rD 6 ~ 0"0,i~6 IN "X(~l~.5 IN+~RODVF--S /
J f
/ /
/
/
. ®
/ i @ /
J
- @
5D 100 150 GAUCHE PRESSURE
FIe. 20. Cooling Air Flow.
7.0.0 LS ]$0.1N.
I-
tP
S ~J V-
Z ~e
5 m
o C VIA ~ ' ~ --0'066 IN.XO-I~5 iN.~R00VES
Z~, COoLINC~ RIR J r 0 - ~ IN. DI/~. HOLES 160 - - ~. 6 - ~ IN ', " * , .
{ ~ 0 - 0.1066 IN XO.IZ5 IN. GffOOVE5 O 'v - ~'g IN. ZgIR. HOt.£~
- - ~ IN , - e,
4-00 °C. ~'~, 5"7~O R.P. IM.
p
3 g 0 "C
~ ° ' M ~ 260"C
3g0 "C
G R.RMe
- . . . . k 2 G O °C
6O
4 ~ I0
Fl~ufl~5 oN Cuw~E5 AnE INLET GP, fi TEMP ~, H:.~ WHEEL 5PEF-,D
I 315 °C
~ , ~ 0 0 0 R.RI
--=...
15 20 7.5 30 COOLING PdR PRESSU RE.
FIG. 21. Variation of Bearing Temperature with Cooling Air Pressure.
370°0
41

.... + ~ : > o v
I + , ~ o v i
~. ~ . ~ _ . ~ = ~ - ~ t ° ° " ~ .~o~ _ ~ . . ~ . ~
v l V C v ~ . . . . . # ~ 1 u s ~ ~ . . . . _ I ~ , ~ . "T ~ . . ~ ~ MW..~ MN~ , ~ , = , , , , = , , , 4 _ i v y _ r ' ' I , ,_._J; 1 ~1~
I ~ i l l~. = ~ o v .
L,~. CHOK,~ I C~A~ .s~ "TuJNLNg
c a . B . ~-
A.~. mA~n~ p~.~
FIG. 22.
6 ON - Q~'~ S W r l " ~
R. & M. No. 2807 • (600~)
A.R.C. Technical Report
Publications of Aeronautical Research
the: Council
ANNUAL TECHNICAL REPORTS OF THE AERONAUTICAL RESEARCH COUNCIL (BOUND V O L U M E S ) - -
1934.-35 Vol. I. Aerodynamics. Out ofprint. Vol. II. Seaplanes, Structures, Engines, Materials, etc. 4os. (4os. 8d.)
1935-36 Vol. I. Aerodynamics. 3os. (3os. yd.) Vol. II. Structures, Flutter, Engines, Seaplanes, etc. 3osl (3os. 7d.)
1936 Vol. I. Aerodynamics General, Performance, Airscrews, Flutter and Spinning. 4os. (4os. 9d.)
Vol. II. Stability and Control, Structures, Seaplanes, Engines, etc. 5os. (5os. lod.)
1937 Voi. Io Aerodynamics General, Performance, Airscrews, Flutter and Spinning. 4os. (4os. Iod.)
Vol. II. Stability and Control, Structures, Seaplanes, Engines, etc. 6os. (6Is.)
1938 Vol. 'I. Aerodynamics Genersl, Performance, Airscrews. 5os. (5IS.) Vol. II. Stability and Control, Flutter, Structures, Seaplanes, Wind Tunnels,
Materials. 3os. (3os. 9d.)
1939 Vol. I. Aerodynamics General, Performance, Airscrews,: Engines 5o~. (5os. lid.) Vol. II. Stability and Control, Flutter and Vibrat,_'on, Instruments, Structures,
Seaplanes, etc. 63s. (64s. 2d.)
194o Aero and Hydrodynamics, Aerofoils, Airscrews, Engine's, Flutter, Icing, Stability and Control, Structures, and a miscellaneous section. 5os. (5 is.)
Certain ot/eer reports proper to t~e 194o volume wi l l subsefuently be included in a separate volume.
ANNUAL REPORTS OF T H E AERONAUTICAL RESEARCH COUNCIL- -
1933-34 1934-35
April I, 1935 to 1937 1938
1939-48
INDEX T O ALL REPORTS AND TECHNICAL REPORTS, AND
April, 195o
INDEXES T O T H E TECHNICAL COUNCIL---
IS. 6d. (IS. 8d.) IS. 6d. (is. 8d.)
December 3i, 1936. 4 s. (4 s. 4d.) 2s. (2s. 2d.) IS. 6d. (IS. 8d.) 3s. (3s. 2d.)
MEMORANDA PUBLISHED IN T H E ANNUAL SEPARATELY--
R. & M. No. 2600: 2s. 6d. (zs. 7½d.)
REPORTS OF T H E AERONAUTICAL RESEARCH
December I, I 9 3 6 - - J u n e 3 o, 1939. R. & M. No. 185o. July 1, 1939- - June 30, 1945. R. & M. No. 195o. July 1, 1945 - - J u n e 3 o, 1946. R. & M. No. 2050. July I, I946 - - December 3 I, 1946- R. & M. No. 215°- January I, 1947 - - June 30, 1947. R. & M. No. 2250.
Prices in ~rackets include postage.
Obtainable i?om
HIS MAJESTY'S S T A T I O N E R Y
xs. 3d. (zs. 4½d.) IS. (is. 1½d.) is. (zs. i½d.) is. 3d. (is. 4½d.) IS. 3d. (is. 4~-d.jl
OFFICE York House, Kingsway, LONDON, W.C.2 429 Oxford Street, LONDON, W.1
P.O. Box 569, LONDON, S.E.1 13a Castle Street, EDINBURGH, 2 I St. Andrew's Crescent, CARDIFF 39 King Street, MANCHESTER, 2 Tower Lane, BRISTOL, 1
2 Edmund Street, BIRMINGHAM, 3 80 Chichester Street, BELFAST
or t h r o u g h a n y booksel ler .
S.O. Code ~o. 23-26o 7