controlled drug release from hydrogels for contact lenses
TRANSCRIPT
1
Controlled drug release from hydrogels for contact lenses: drug partitioning and
diffusion
A.F.R. Pimenta1,2, J. Ascenso1, J.C.S. Fernandes1, R. Colaço2, A. P. Serro1,3, B.
Saramago1*
1 Centro de Química Estrutural, Instituto Superior Técnico, University of Lisbon, Av.
Rovisco Pais, 1049-001 Lisbon, Portugal
2 IDMEC, Departmento de Engenharia Mecânica, Instituto Superior Técnico, University
of Lisbon, Av. Rovisco Pais, 1049-001 Lisbon, Portugal
3 Centro de Investigação Interdisciplinar Egas Moniz, Instituto Superior de Ciências da
Saúde Egas Moniz, Quinta da Granja, Monte de Caparica, 2829-511 Caparica, Portugal
* Corresponding author
Email:[email protected]
2
Abstract
Optimization of drug delivery from drug loaded contact lenses assumes understanding
the drug transport mechanisms through hydrogels which relies on the knowledge of
drug partition and diffusion coefficients. We chose, as model systems, two materials
used in contact lens, a poly-hydroxyethylmethacrylate (pHEMA) based hydrogel and a
silicone based hydrogel, and three drugs with different sizes and charges: chlorhexidine,
levofloxacin and diclofenac. Equilibrium partition coefficients were determined at
different ionic strength and pH, using water (pH 5.6) and PBS (pH 7.4). The measured
partition coefficients were related with the polymer volume fraction in the hydrogel,
through the introduction of an enhancement factor following the approach developed by
the group of C. J. Radke (Kotsmar et al., 2012; Liu et al., 2013). This factor may be
decomposed in the product of three other factors ���, ��� and��which account for,
respectively, hard-sphere size exclusion, electrostatic interactions, and specific solute
adsorption. While ��� and ��� are close to 1, ��>>1 in all cases suggesting strong
specific interactions between the drugs and the hydrogels. Adsorption was maximal for
chlorhexidine on the silicone based hydrogel, in water, due to strong hydrogen bonding.
The effective diffusion coefficients, �, were determined from the drug release profiles.
Estimations of diffusion coefficients of the non-adsorbed solutes = � × �� allowed
comparison with theories for solute diffusion in the absence of specific interaction with
the polymeric membrane.
Keywords: Drug release; Contact lens; Hydrogel membrane; Partition coefficient;
Diffusion coefficient.
3
1. Introduction
The controlled drug release from hydrogels is an important issue for medical
applications that has been under intensive investigation in the last decades, both
experimentally (Hoare and Kohane, 2008; Ratner and Hoffman, 1976) or through
mathematical modelling (Peppas and Khare, 1993; Siepmann and Siepmann, 2008),
including empirical/semi-empirical models, as well as mechanistic realistic ones
(Caccavo et al., 2015a, 2015b; Kaunisto et al., 2010; Lamberti et al., 2011).
Understanding the mechanisms of drug release for each particular pair drug/ hydrogel
membrane is very important for the optimization of the release kinetics from the
delivery devices and also for the construction of good mathematical models which
allow correct predictions of the release profiles. The simplest mechanistic model is
based on the assumption of a mass transfer process controlled by drug diffusion.
However, in many cases, the drug transport through polymeric membranes depends on
polymer swelling and drug-polymer interactions, and it should be considered as a
diffusional transport process and as a partition phenomenon. Thus, an important feature
of the delivery system is the equilibrium partition coefficient, , of the drug which
depends on the relative strength of the interactions of the drug with both the hydrogel
and the solvent. It is defined as the ratio between ���� and ���� which are, respectively,
the equilibrium drug concentrations in the hydrogel and in the aqueous solution at the
end of the drug loading step. The partition coefficient may be related to the polymer
volume fraction in the hydrogel, �, through the introduction of an enhancement factor,
�, as follows (Kotsmar et al., 2012):
= �(1 − �) (1).
Following the reasoning of Dursch et al. (Dursch et al., 2014), this enhancement factor
for a solute in a dilute solution may be decomposed as the product of three individual
4
enhancement factors ���, ���and��. ��� accounts for the hard-sphere size
exclusion,��� refers to electrostatic interaction and �� considers specific solute
adsorption on polymer fibers. The hard-sphere solute enhancement factor was
calculated by Kotsmar et al. (Kotsmar et al., 2012), based on the theoretical mesh size
distribution of Ogston for a random assembly of infinitely long fibers, to be:
��� = exp �−4� ���� �� ! �1 + �� �� !#$ (2)
where �� is the hydrodynamic radius of the solute and �� is the radius of the polymer
fiber. ��� < 1 reflects partial rejection due to size exclusion, while � = 0 indicates
that the solute is too large to penetrate the hydrogel network. The electrostatic
enhancement factor was introduced by Dursch et al. (Dursch et al., 2014), based on the
Donnan theory (Overbeek JTh G, 1969), as:
��� = exp�− '()*+ ! (3)
where Z is the charge number of the solute, F is the Faraday constant, , is the Donnan
electric potential difference between the hydrogel and the bulk aqueous solution, R is
the gas constant and T is the temperature. For nonionic solutes ��� = 1, while ��� > 1
indicates electrostatic attractions between the solute and the polymer and ��� < 1
reflects electrostatic repulsions.
The specific solute adsorption enhancement factor, ��, may be calculated, assuming
that the solutes are dilute, by:
�� = .1 + ��/(1 − �)0 (4)
where KH is Henry’s constant for solute adsorption on the polymer chains (Kotsmar et
al., 2012).
At dilute concentration, solute diffusion in a nonadsorbing gel follows Fick’s second
law with a constant diffusion coefficient, . This law may be extended to account for
5
the solute specifically adsorbed to the polymer which is different from that diffusing in
the liquid-filled spaces (Liu et al., 2013). The resulting equation involves the number of
moles of non-adsorbed solute in the liquid-filled voids per liquid volume,�, and the
number of moles of specifically adsorbed solute per unit polymer volume in the gel,1:
23(4,5)24 + � 6
786! �29(4,5)24 ! = �2:3(4,5)25: ! (5).
This equation is valid under the following assumptions: 1) hydrogel swelling is not
affected by the presence of the solute in dilute conditions; 2) diffusion occurs within the
liquid phase of the hydrogel; 3) surface diffusion along the polymer chains is negligible.
If 1 is given by Henry’s law 1 = �� ( � is Henry’s adsorption constant), an effective
diffusion coefficient, �, describing solute transport in the gel may be defined (Liu et
al., 2013):
� = .1 + �� (1 − �)0⁄⁄ (6).
Eq. 6 together with Eq. 4 yields:
= ��� (7).
As �� > 1, > �, which means that the drug diffusion inside the hydrogel is retarded
by drug adsorption on the polymer chains.
In the present work, an investigation of the loading and release process of ophthalmic
drugs in hydrogels used as contact lens materials was presented. The partition and
diffusion coefficients were measured and the interpretation of the obtained results at the
light of the existing theories was attempted. Three drugs, namely chlorhexidine (CHX),
levofloxacin (LVF) and diclofenac (DIC), and two hydrogels which were recently
investigated by our group (Paradiso et al., 2014): a poly-hydroxyethylmethacrylate
(pHEMA) based hydrogel and a silicone based hydrogel, were considered for this study.
Chlorhexidine is used as antibacterial agent and topical disinfectant (Mathers, 2006),
levofloxacin is an antibiotic that is widely used both in the prophylaxis and treatment of
6
ocular infections (Dajcs et al., 2004), and diclofenac is a nonsteroidal, anti-
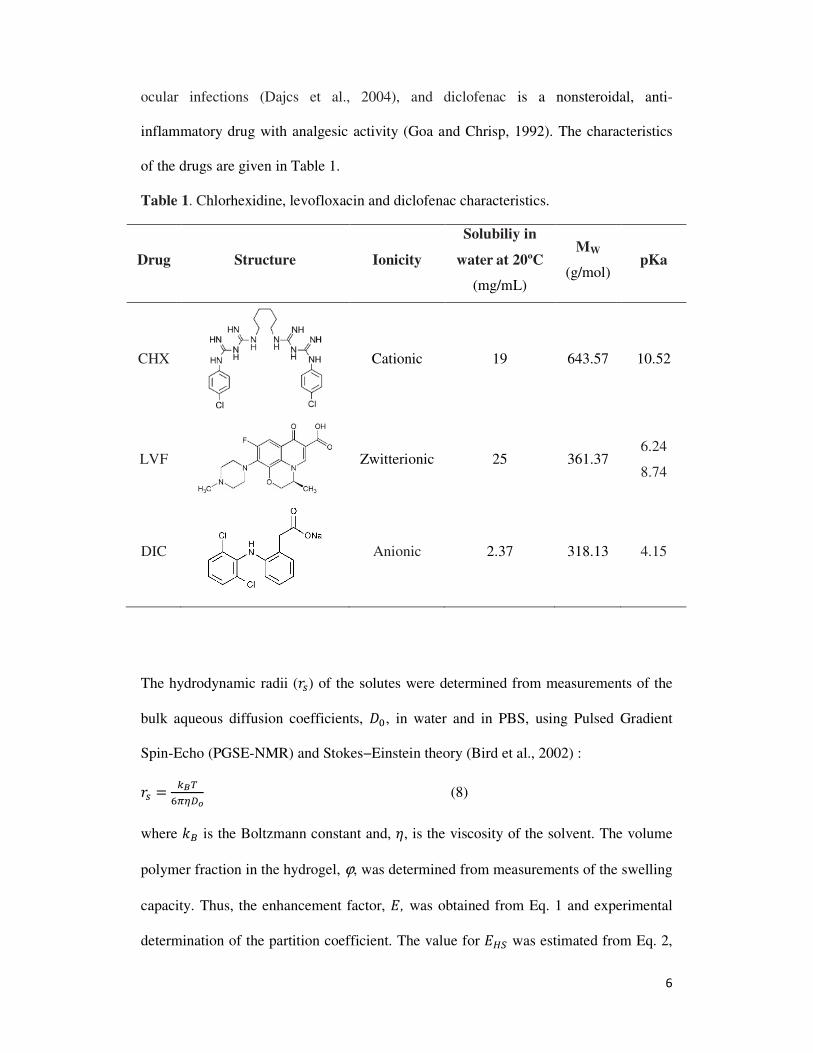
inflammatory drug with analgesic activity (Goa and Chrisp, 1992). The characteristics
of the drugs are given in Table 1.
Table 1. Chlorhexidine, levofloxacin and diclofenac characteristics.
Drug Structure Ionicity
Solubiliy in
water at 20ºC
(mg/mL)
MW
(g/mol) pKa
CHX
Cationic 19 643.57 10.52
LVF
Zwitterionic 25 361.37 6.24
8.74
DIC
Anionic 2.37 318.13 4.15
The hydrodynamic radii (��) of the solutes were determined from measurements of the
bulk aqueous diffusion coefficients, <, in water and in PBS, using Pulsed Gradient
Spin-Echo (PGSE-NMR) and Stokes−Einstein theory (Bird et al., 2002) :
�� = =>+?@ABC (8)
where DE is the Boltzmann constant and, F, is the viscosity of the solvent. The volume
polymer fraction in the hydrogel, ϕ, was determined from measurements of the swelling
capacity. Thus, the enhancement factor, �, was obtained from Eq. 1 and experimental
determination of the partition coefficient. The value for ��� was estimated from Eq. 2,
7
assuming a tentative value for the fiber radius. The value of ���was calculated using Eq.
3 and experimentally determined values of ,. The measurement of , was based on the
method described by Higa et al (Higa et al., 1998) which is briefly described in the
Supplementary Material. Finally, �� = � (������)⁄ may be obtained.
The effective diffusion coefficient, �, was obtained from fitting the experimental drug
release profiles to an appropriate mathematical solution for the diffusion problem. Then,
Eq. 7 allows the calculation of , the Fick’s second law diffusion coefficient of the drug
if no interactions would occur between the solute and polymer. The diffusion
coefficients of the non-adsorbed solutes, , were correlated with the size of the solutes
using two theories for hindered solute diffusion in hydrogels: the simplified steric
model of Ogston et al. (Ogston et al., 1973) and the model of Phillips et al. (Phillips,
2000) which takes into account hydrodynamic and steric effects.
2. Experimental
2.1 Materials
2-Hydroxyethyl methacrylate, ≥99%, (HEMA), ethylene glycol dimethacrylate, 98%
(EGDMA), 2,20-azobis(2-methylpropionitrile), 98% (AIBN), 3-
tris(trimethylsilyloxy)silylpropyl 2-methylprop-2-enoate, 98% (TRIS), diclofenac
sodium (DIC) and 0.01 M phosphate buffered saline (PBS) (NaCl 0.138 M; KCl -
0.0027 M; pH 7.4) were all purchased from Sigma-Aldrich. Poly(vinylpyrrolidone)
(PVP K30, Kollidon30) was kindly provided by BASF. N-Vinyl pyrrolidone, 98%
(NVP), potassium chloride and sodium chloride were obtained from Merck,
chlorhexidine diacetate monohydrate, 98% (CHX) from AppliChem, carbon
tetrachloride from Riedel-de Haën, and dimethyldichlorosilane from Fluka. Distilled
and deionized (DD) water was prepared in a Millipore Milli-Q system and had pH 5.6.
8
2.2 Hydrogels preparation and characterization
Two types of HEMA based hydrogels were prepared: HEMA/PVP (98/2, w/w) and
TRIS/NVP/HEMA (40/40/20, w/w/w). The hydrogel preparation was described in
previous works (Paradiso et al., 2014; Paradiso et al., 2014). In short, in the first case,
an appropriate amount of the crosslinker EGDMA was dissolved in HEMA (80 mM)
and the mixture was degassed before the addition of AIBN (initiator) and PVP. In the
case of TRIS/NVP/HEMA hydrogel, TRIS (silicone monomer), NVP, HEMA and
EGDMA were added to prepare a mixture (34mM in EDGMA) which was degassed
before the final addition of AIBN. Both mixtures were injected into a mold consisting of
two silanized glass plates separated by a spacer of polyurethane or Teflon. Thermo-
polymerization was done at 60° for 1 h. For HEMA/PVP the free radical polymerization
of HEMA in the presence of PVP K30 is known to lead to semi-interpenetrating
networks of pHEMA with PVP (Yañez et al., 2008). From 13C solid-state NMR
spectra, the molar ratio of the three monomers in the TRIS/NVP/HEMA hydrogel was
determined to be 1.0/3.8±0.7/2.5±0.2. The presence of the crosslinker agent EGDMA
was not taken into account.
The obtained hydrogel sheets were washed over 5 days, with DD water renewed three
times a day, to remove unreacted monomers and to facilitate the cutting of the samples.
The hydrated samples (10 mm in diameter and 0.25 mm and 0.30 mm in thickness for
TRIS/NVP/HEMA and HEMA/PVP, respectively) were then dried, overnight, in an
oven at 40 °C and stored dried.
The polymer volume fraction, ϕ, of the hydrogels was determined, as follows. Dry
samples of each composition (three replicates each) were placed in DD water at 37ºC
after determination of their dry weight, G<. The samples were weighed at different
9
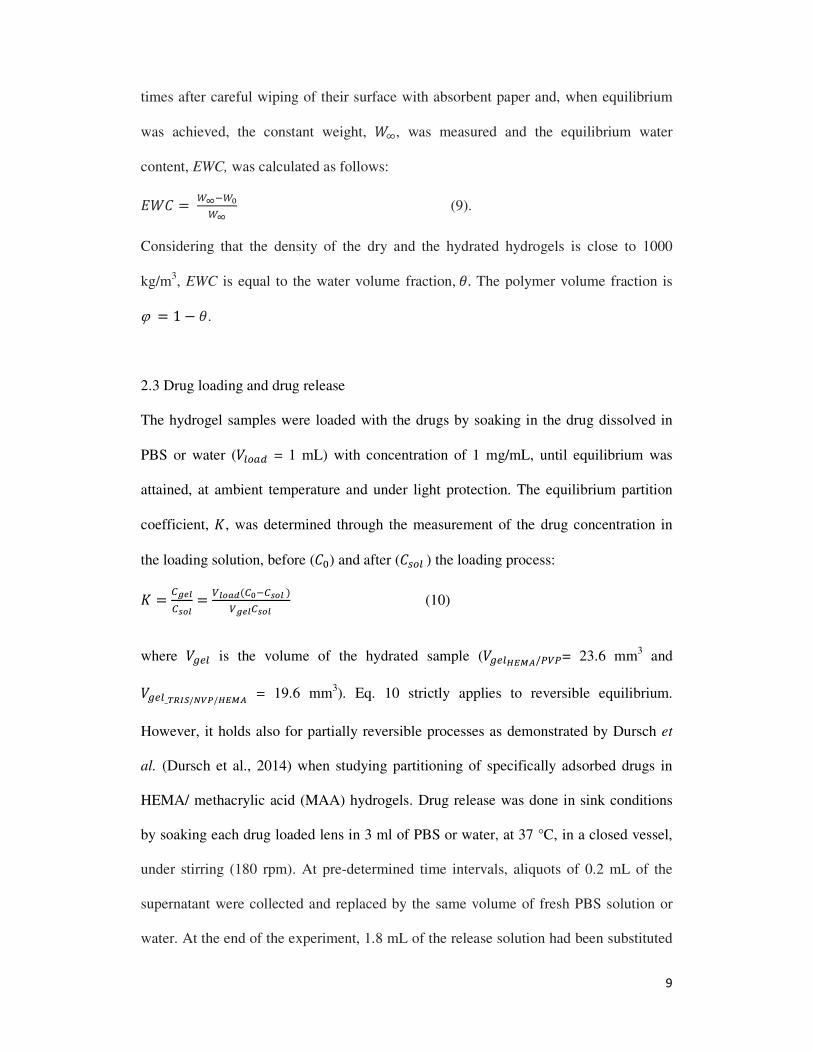
times after careful wiping of their surface with absorbent paper and, when equilibrium
was achieved, the constant weight, GH, was measured and the equilibrium water
content, EWC, was calculated as follows:
�G� =IJ8IKIJ (9).
Considering that the density of the dry and the hydrated hydrogels is close to 1000
kg/m3, EWC is equal to the water volume fraction,L. The polymer volume fraction is
ϕ = 1 − L.
2.3 Drug loading and drug release
The hydrogel samples were loaded with the drugs by soaking in the drug dissolved in
PBS or water (N��� = 1 mL) with concentration of 1 mg/mL, until equilibrium was
attained, at ambient temperature and under light protection. The equilibrium partition
coefficient, , was determined through the measurement of the drug concentration in
the loading solution, before (�<) and after (����) the loading process:
= 3OPQ3RCQ =
SQCTU(3K83RCQ)SOPQ3RCQ (10)
where N��� is the volume of the hydrated sample (N���VWXY/ZSZ= 23.6 mm3 and
N���_\]^_/`ab/VWXY = 19.6 mm3). Eq. 10 strictly applies to reversible equilibrium.
However, it holds also for partially reversible processes as demonstrated by Dursch et
al. (Dursch et al., 2014) when studying partitioning of specifically adsorbed drugs in
HEMA/ methacrylic acid (MAA) hydrogels. Drug release was done in sink conditions
by soaking each drug loaded lens in 3 ml of PBS or water, at 37 °C, in a closed vessel,
under stirring (180 rpm). At pre-determined time intervals, aliquots of 0.2 mL of the
supernatant were collected and replaced by the same volume of fresh PBS solution or
water. At the end of the experiment, 1.8 mL of the release solution had been substituted
10
by fresh medium. The drug concentration values were quantified using a
spectrophotometer UV–VIS MultiscanGO from ThermoScientific® at wavelengths of
255 nm for CHX, 275 nm for DIC, and 290 nm for LVF. All measurements were done,
at least, in triplicate.
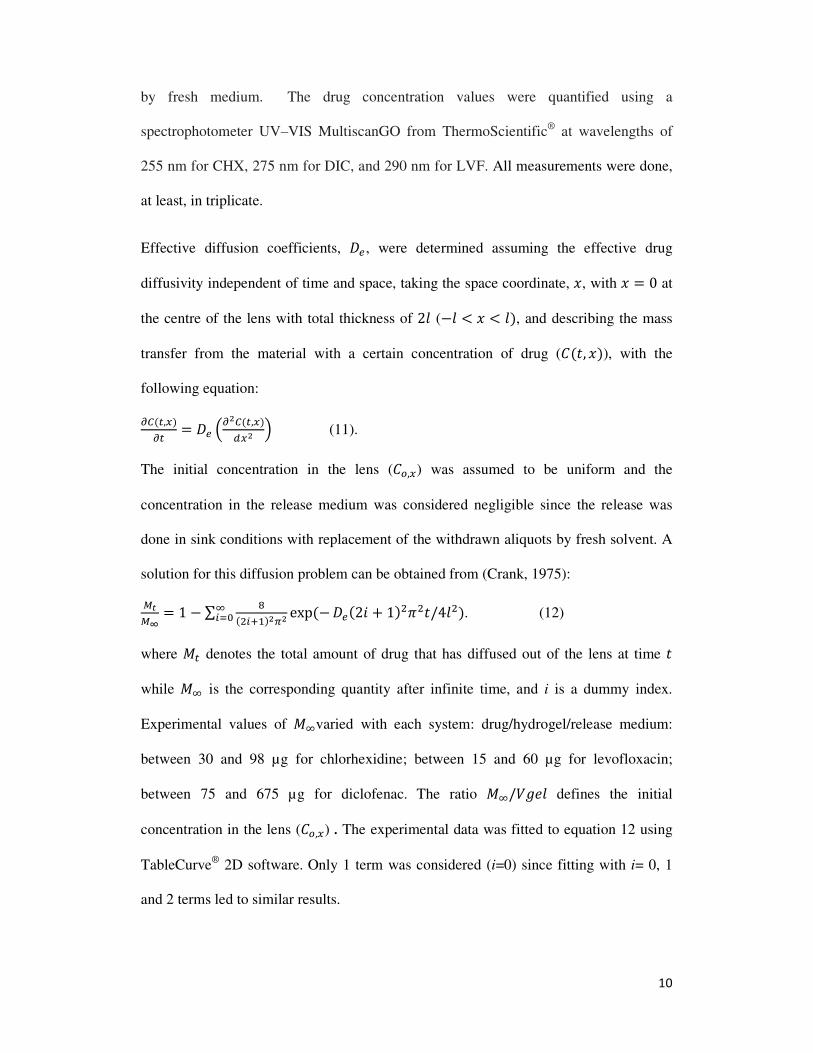
Effective diffusion coefficients, �, were determined assuming the effective drug
diffusivity independent of time and space, taking the space coordinate, c, with c = 0 at
the centre of the lens with total thickness of 2e (−e < c < e), and describing the mass
transfer from the material with a certain concentration of drug (�(f, c)), with the
following equation:
23(4,5)24 = � �2:3(4,5)5: ! (11).
The initial concentration in the lens (��,5) was assumed to be uniform and the
concentration in the release medium was considered negligible since the release was
done in sink conditions with replacement of the withdrawn aliquots by fresh solvent. A
solution for this diffusion problem can be obtained from (Crank, 1975):
ghgJ = 1 − ∑ j
(klm7):@: exp(−Hln< �(2o + 1)kpkf/4ek). (12)
where q4 denotes the total amount of drug that has diffused out of the lens at time f while qH is the corresponding quantity after infinite time, and i is a dummy index.
Experimental values of qHvaried with each system: drug/hydrogel/release medium:
between 30 and 98 µg for chlorhexidine; between 15 and 60 µg for levofloxacin;
between 75 and 675 µg for diclofenac. The ratio qH/Nrse defines the initial
concentration in the lens (��,5) . The experimental data was fitted to equation 12 using
TableCurve® 2D software. Only 1 term was considered (i=0) since fitting with i= 0, 1
and 2 terms led to similar results.
11
2.4 Determination of bulk diffusion coefficients using PGSE-NMR
Diffusion coefficients of the studied drugs in water and PBS were determined by the
PGSE method in a NMR Bruker Avance III 500 MHz spectrometer with a 5 mm BBO
probe with a z-gradient shielded coil. This combination gives a maximum possible
gradient of 0.55 Tm-1. A bipolar stimulated echo sequence (STE) with smoothed square
gradients and WATERGATE solvent suppression was used (Price et al., 2002). The
signal intensity (I) was monitored as a function of the square of the gradient amplitude
(g) and the resulting self-diffusion coefficients (D0) were calculated according to the
echo attenuation equation for STE sequence:
t = t<scu �−<(vwr)k �∆ − yz!# (13)
where I0 is the intensity in the absence of gradient pulses, δ is the duration of the applied
gradient, γ is the gyromagnetic ratio of the nucleus and ∆ is the diffusion time.
The duration of the gradient pulses (δ) and the diffusion time (∆) were optimized in
order to obtain a residual signal of 2-5 % at the maximum gradient strength. The values
used were 2.2 ms for the duration of the gradient pulses and 80 ms for the diffusion
time. The gradient strength was incremented from 2% to 98% in a linear ramp with 16
steps. A delay of 15 s between echoes was used. The gradients were previously
calibrated using 99.9 % pure D2O as a standard. Each diffusion experiment produces a
pseudo array of 16 spin echoes that were first FT processed in the t2 dimension using a
LB of 0.2 Hz to generate a series of 1 D spectra that were phased and baseline corrected
prior to extraction of the diffusion coefficient by Gaussian fittings using the T1/T2
relaxation module of Topspin 3.1. For each drug the areas of three or four single proton
peaks were used in the fittings and the average D0 value was taken.
Solutions of the drugs in water and PBS (~ 1 mg/ml) with 10% of D2O for locking were
poured in 5 mm NMR tubes to a total volume of 0.4 ml. To guarantee reproducibility of
12
the results this geometry was kept in all the samples. Temperature was controlled at 37
°C by a BCU05 Bruker unit with an air flow of 521 Lh-1 and measured to within 0.1 K.
2.5 Measurement of Donnan potential of the hydrogels
The Donnan potential at the interface between the hydrogels and water or PBS was
measured using the method proposed by Higa et al (Higa et al., 1998) and described in
the Supplementary Material.
Prior to measurement, the hydrogels were immersed in water or PBS and the potential
was continuously measured since the salt bridge contacted with the hydrogel surface.
The value obtained after 1 min of contact was considered in order to avoid long time
interference of the highly concentrated KCl, which diffuses between the salt bridge and
the hydrogel, on the measured potential. The measurements were done, in duplicate, at
room temperature (25ºC).
2.6 Determination of the mesh size of the hydrogels
The average mesh size ⟨|⟩ may be estimated from the zero-frequency shear storage
modulus G´(0), using the rubber elastic theory, through the following equation (Eq. 3 in
(Kotsmar et al., 2012)):
⟨|⟩ = e~ k3�*+g��´(<) �87 ? (14)
where l is the length of the carbon-carbon bond in the backbone (0.154 nm), C is the
Flory characteristic ratio (6.9 for pHEMA), � is the density of the dry polymer and Mr is
the molecular weight of a repeating unit. This equation applies only to uncharged gels
which may be achieved by soaking the samples in PBS solution.
13
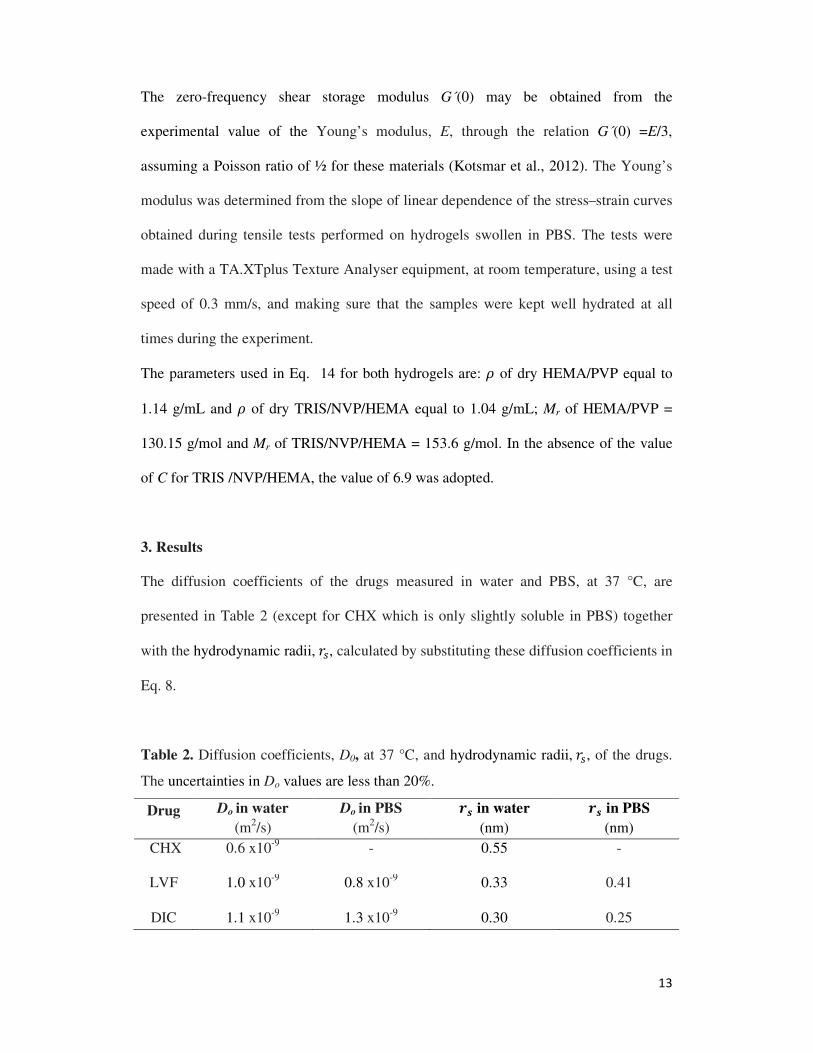
The zero-frequency shear storage modulus G´(0) may be obtained from the
experimental value of the Young’s modulus, E, through the relation G´(0) =E/3,
assuming a Poisson ratio of ½ for these materials (Kotsmar et al., 2012). The Young’s
modulus was determined from the slope of linear dependence of the stress–strain curves
obtained during tensile tests performed on hydrogels swollen in PBS. The tests were
made with a TA.XTplus Texture Analyser equipment, at room temperature, using a test
speed of 0.3 mm/s, and making sure that the samples were kept well hydrated at all
times during the experiment.
The parameters used in Eq. 14 for both hydrogels are: � of dry HEMA/PVP equal to
1.14 g/mL and � of dry TRIS/NVP/HEMA equal to 1.04 g/mL; Mr of HEMA/PVP =
130.15 g/mol and Mr of TRIS/NVP/HEMA = 153.6 g/mol. In the absence of the value
of C for TRIS /NVP/HEMA, the value of 6.9 was adopted.
3. Results
The diffusion coefficients of the drugs measured in water and PBS, at 37 °C, are
presented in Table 2 (except for CHX which is only slightly soluble in PBS) together
with the hydrodynamic radii,��, calculated by substituting these diffusion coefficients in
Eq. 8.
Table 2. Diffusion coefficients, D0, at 37 °C, and hydrodynamic radii,��, of the drugs.
The uncertainties in Do values are less than 20%.
Drug Do in water (m2/s)
Do in PBS
(m2/s) �� in water
(nm) �� in PBS
(nm) CHX 0.6 x10⁻⁹ - 0.55 -
LVF 1.0 x10⁻⁹ 0.8 x10⁻⁹ 0.33 0.41
DIC 1.1 x10⁻⁹ 1.3 x10⁻⁹ 0.30 0.25
14
As expected, the diffusion coefficients decrease and the hydrodynamic radii,��, increase
with increasing molecular weight (qI) of the drugs. For charged molecules, the
increase in ionic strength may lead to a decrease of electrostatic repulsions which is
responsible for a higher tendency for aggregation with the consequent reduction of
diffusivity; however, several authors found no effect of the ionic strength on the
diffusion coefficients (Gendron et al., 2008). This is the case of anionic diclofenac
where the difference between the values of the diffusion coefficients in water and in
PBS lies within the analytical precision of the technique. The composition, the polymer
volume fraction, the zero-frequency shear storage modulus G´(0) and the Donnan
potential (in water and in PBS) of both materials are shown in Table 3. The negative
potential of HEMA/PVP is unexpected but it can be attributed to the presence of MAA
as an impurity (Eckstein et al., 1984). The Donnan potential is slightly lower in PBS
due to the increased charge screening. Other measurements in PBS acidified to pH 2
with HCl led to,= -2.64 mV for HEMA/PVP, thus confirming that the MAA impurity
became not ionized. Calculation of the amount of MAA which should be present in
HEMA immersed in PBS to ensure , = -12.5 mV, led to a mass percentage of 0.425%
(See Supplementary Material) which is compatible with the reported purity of 99% for
HEMA. For TRIS/NVP/HEMA in PBS, the potential changed from slightly positive to
slightly negative at pH 2 (-0.54 mV) which is difficult to explain, but, in any case, these
values are close to zero and not meaningful.
15
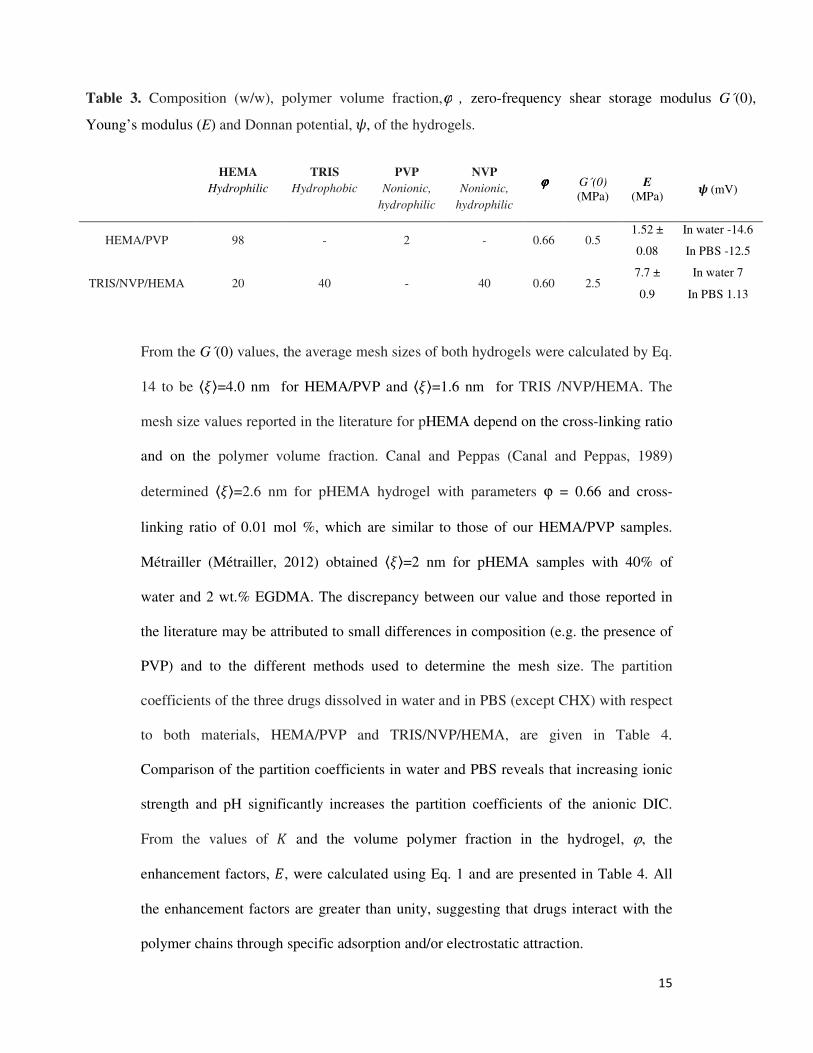
Table 3. Composition (w/w), polymer volume fraction,ϕ , zero-frequency shear storage modulus G´(0),
Young’s modulus (E) and Donnan potential,,, of the hydrogels.
HEMA
Hydrophilic
TRIS
Hydrophobic
PVP
Nonionic,
hydrophilic
NVP
Nonionic,
hydrophilic
ϕϕϕϕ
G´(0) (MPa)
E
(MPa) �(mV)
HEMA/PVP 98 - 2 - 0.66 0.5 1.52 ±
0.08
In water -14.6
In PBS -12.5
TRIS/NVP/HEMA 20 40 - 40 0.60 2.5 7.7 ±
0.9
In water 7
In PBS 1.13
From the G´(0) values, the average mesh sizes of both hydrogels were calculated by Eq.
14 to be ⟨|⟩=4.0 nm for HEMA/PVP and ⟨|⟩=1.6 nm for TRIS /NVP/HEMA. The
mesh size values reported in the literature for pHEMA depend on the cross-linking ratio
and on the polymer volume fraction. Canal and Peppas (Canal and Peppas, 1989)
determined ⟨|⟩=2.6 nm for pHEMA hydrogel with parameters ϕ = 0.66 and cross-
linking ratio of 0.01 mol %, which are similar to those of our HEMA/PVP samples.
Métrailler (Métrailler, 2012) obtained ⟨|⟩=2 nm for pHEMA samples with 40% of
water and 2 wt.% EGDMA. The discrepancy between our value and those reported in
the literature may be attributed to small differences in composition (e.g. the presence of
PVP) and to the different methods used to determine the mesh size. The partition
coefficients of the three drugs dissolved in water and in PBS (except CHX) with respect
to both materials, HEMA/PVP and TRIS/NVP/HEMA, are given in Table 4.
Comparison of the partition coefficients in water and PBS reveals that increasing ionic
strength and pH significantly increases the partition coefficients of the anionic DIC.
From the values of and the volume polymer fraction in the hydrogel, ϕ, the
enhancement factors, �, were calculated using Eq. 1 and are presented in Table 4. All
the enhancement factors are greater than unity, suggesting that drugs interact with the
polymer chains through specific adsorption and/or electrostatic attraction.
16
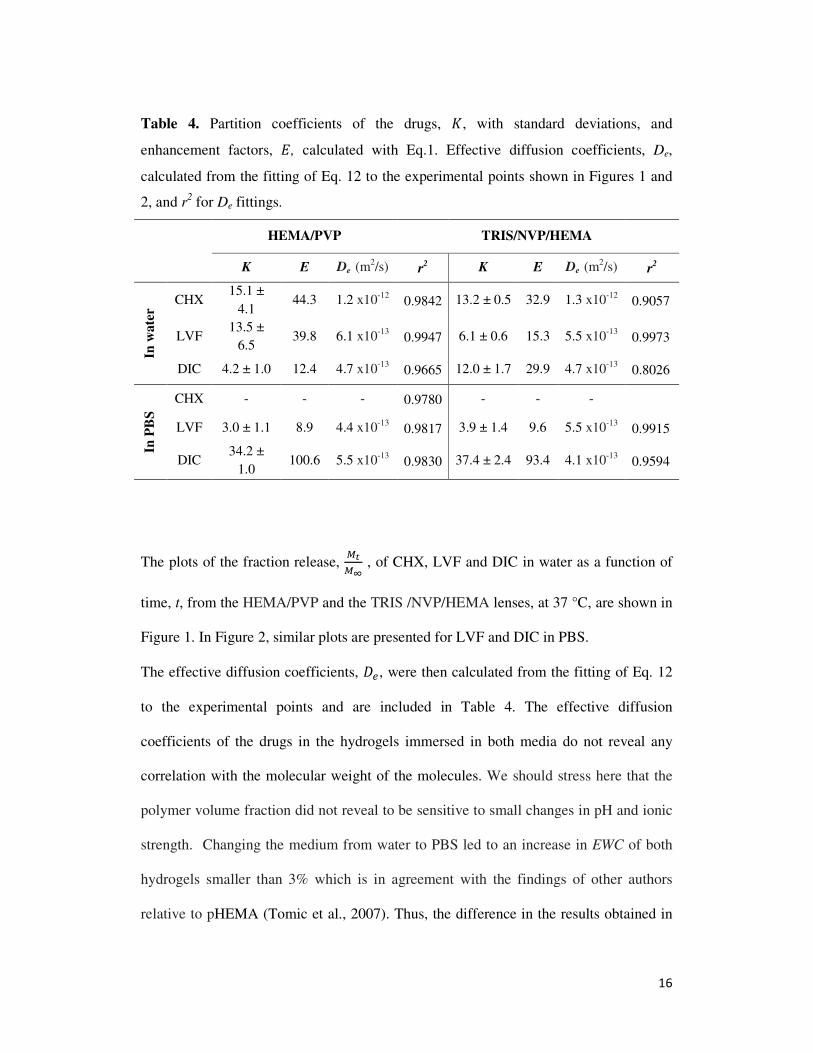
The plots of the fraction release, ghgJ , of CHX, LVF and DIC in water as a function of
time, t, from the HEMA/PVP and the TRIS /NVP/HEMA lenses, at 37 °C, are shown in
Figure 1. In Figure 2, similar plots are presented for LVF and DIC in PBS.
The effective diffusion coefficients, �, were then calculated from the fitting of Eq. 12
to the experimental points and are included in Table 4. The effective diffusion
coefficients of the drugs in the hydrogels immersed in both media do not reveal any
correlation with the molecular weight of the molecules. We should stress here that the
polymer volume fraction did not reveal to be sensitive to small changes in pH and ionic
strength. Changing the medium from water to PBS led to an increase in EWC of both
hydrogels smaller than 3% which is in agreement with the findings of other authors
relative to pHEMA (Tomic et al., 2007). Thus, the difference in the results obtained in
Table 4. Partition coefficients of the drugs, , with standard deviations, and
enhancement factors, �, calculated with Eq.1. Effective diffusion coefficients, De,
calculated from the fitting of Eq. 12 to the experimental points shown in Figures 1 and
2, and r2 for De fittings.
HEMA/PVP
TRIS/NVP/HEMA
K E De (m2/s) r
2 K E De (m
2/s) r2
In w
ate
r
CHX 15.1 ±
4.1 44.3 1.2 x10⁻¹² 0.9842 13.2 ± 0.5 32.9 1.3 x10⁻¹² 0.9057
LVF 13.5 ±
6.5 39.8 6.1 x10⁻¹³ 0.9947 6.1 ± 0.6 15.3 5.5 x10⁻¹³ 0.9973
DIC 4.2 ± 1.0 12.4 4.7 x10⁻¹³ 0.9665 12.0 ± 1.7 29.9 4.7 x10⁻¹³ 0.8026
In P
BS
CHX - - - 0.9780 - - -
LVF 3.0 ± 1.1 8.9 4.4 x10⁻¹³ 0.9817 3.9 ± 1.4 9.6 5.5 x10⁻¹³ 0.9915
DIC 34.2 ±
1.0 100.6 5.5 x10⁻¹³ 0.9830 37.4 ± 2.4 93.4 4.1 x10⁻¹³ 0.9594
17
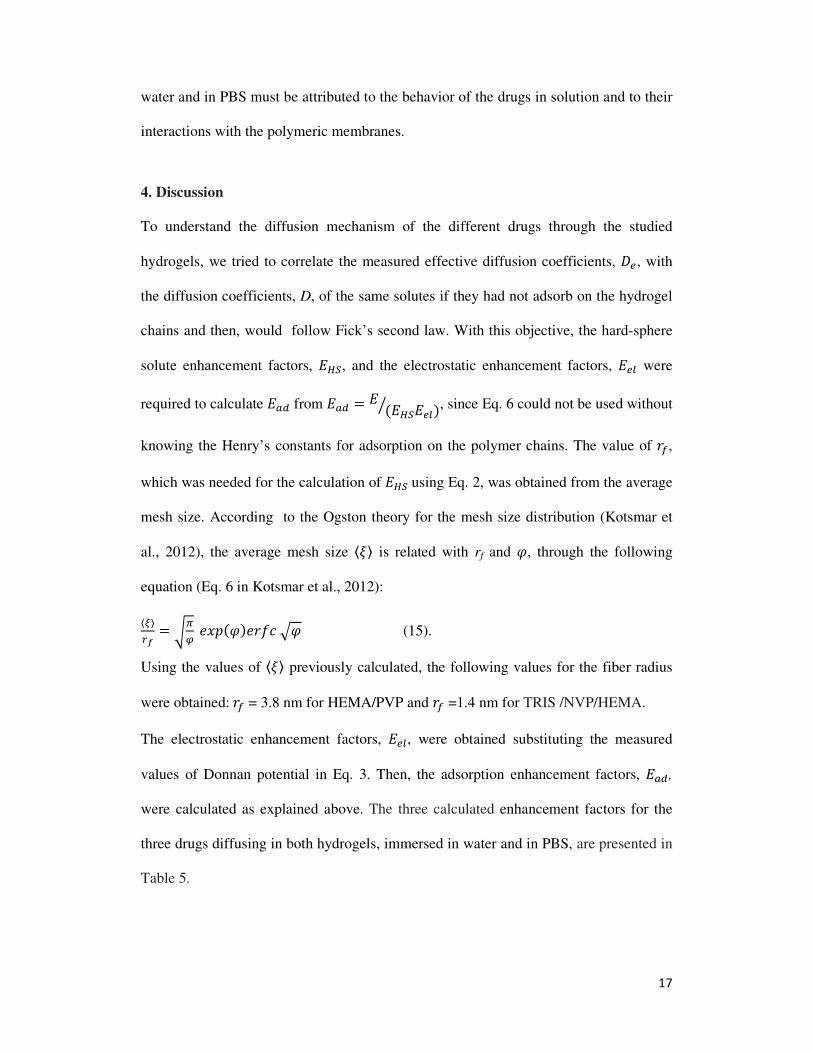
water and in PBS must be attributed to the behavior of the drugs in solution and to their
interactions with the polymeric membranes.
4. Discussion
To understand the diffusion mechanism of the different drugs through the studied
hydrogels, we tried to correlate the measured effective diffusion coefficients, �, with
the diffusion coefficients, D, of the same solutes if they had not adsorb on the hydrogel
chains and then, would follow Fick’s second law. With this objective, the hard-sphere
solute enhancement factors, ���, and the electrostatic enhancement factors, ��� were
required to calculate �� from �� = � (������) , since Eq. 6 could not be used without
knowing the Henry’s constants for adsorption on the polymer chains. The value of ��,
which was needed for the calculation of ���using Eq. 2, was obtained from the average
mesh size. According to the Ogston theory for the mesh size distribution (Kotsmar et
al., 2012), the average mesh size ⟨|⟩ is related with rf and �, through the following
equation (Eq. 6 in Kotsmar et al., 2012):
⟨�⟩�� = ~@
6 scu(�)s����� (15).
Using the values of ⟨|⟩ previously calculated, the following values for the fiber radius
were obtained:�� = 3.8 nm for HEMA/PVP and �� =1.4 nm for TRIS /NVP/HEMA.
The electrostatic enhancement factors, ���, were obtained substituting the measured
values of Donnan potential in Eq. 3. Then, the adsorption enhancement factors, ��,
were calculated as explained above. The three calculated enhancement factors for the
three drugs diffusing in both hydrogels, immersed in water and in PBS, are presented in
Table 5.
18
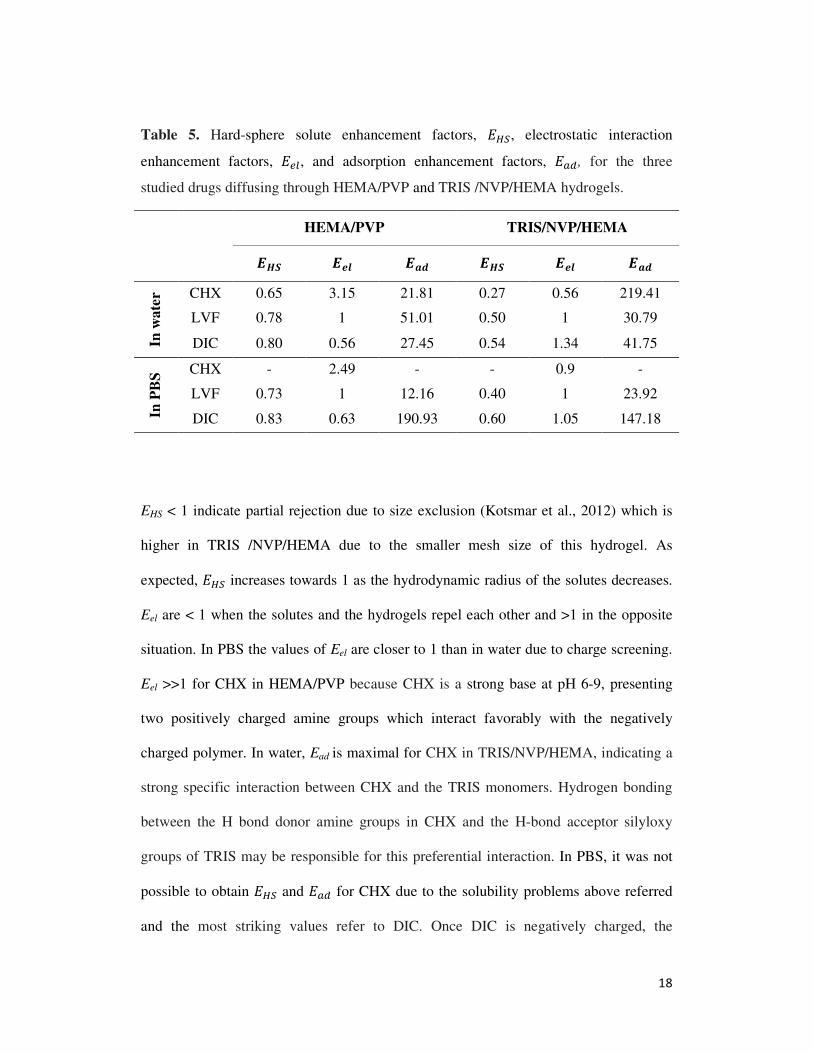
EHS < 1 indicate partial rejection due to size exclusion (Kotsmar et al., 2012) which is
higher in TRIS /NVP/HEMA due to the smaller mesh size of this hydrogel. As
expected, ��� increases towards 1 as the hydrodynamic radius of the solutes decreases.
Eel are < 1 when the solutes and the hydrogels repel each other and >1 in the opposite
situation. In PBS the values of Eel are closer to 1 than in water due to charge screening.
Eel >>1 for CHX in HEMA/PVP because CHX is a strong base at pH 6-9, presenting
two positively charged amine groups which interact favorably with the negatively
charged polymer. In water, Ead is maximal for CHX in TRIS/NVP/HEMA, indicating a
strong specific interaction between CHX and the TRIS monomers. Hydrogen bonding
between the H bond donor amine groups in CHX and the H-bond acceptor silyloxy
groups of TRIS may be responsible for this preferential interaction. In PBS, it was not
possible to obtain ��� and �� for CHX due to the solubility problems above referred
and the most striking values refer to DIC. Once DIC is negatively charged, the
Table 5. Hard-sphere solute enhancement factors, ���, electrostatic interaction
enhancement factors, ���, and adsorption enhancement factors, ��, for the three
studied drugs diffusing through HEMA/PVP and TRIS /NVP/HEMA hydrogels.
HEMA/PVP TRIS/NVP/HEMA
��� ��� ��� ��� ��� ���
In w
ate
r CHX 0.65 3.15 21.81 0.27 0.56 219.41
LVF 0.78 1 51.01 0.50 1 30.79
DIC 0.80 0.56 27.45 0.54 1.34 41.75
In P
BS
CHX - 2.49 - - 0.9 -
LVF 0.73 1 12.16 0.40 1 23.92
DIC 0.83 0.63 190.93 0.60 1.05 147.18
19
reduction of the electrostatic repulsion between the adsorbed molecules, in the presence
of PBS, should favor an increase in the adsorbed amount. The strong adsorption of DIC
on HEMA monomers may be attributed, not only to hydrogen bonding between the
three H bond acceptors in DIC and the hydroxyl groups in HEMA, but also to
interactions between PVP chains and the aromatic rings in the DIC molecules. In fact,
Molyneux and Frank (Molyneux and Frank, 1961) reported significant interactions of
PVP and aromatic compounds in aqueous solution through hydrophobic bonding and
interactions between PVP and the aromatic π electrons of the solutes.
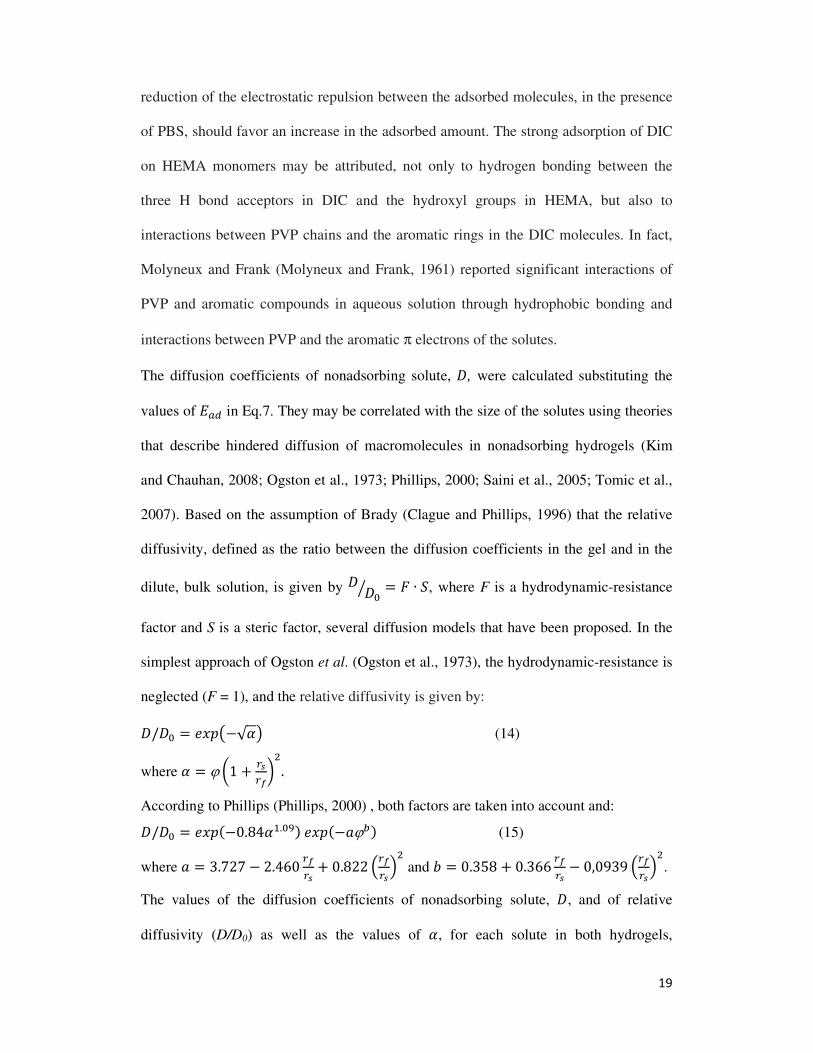
The diffusion coefficients of nonadsorbing solute, , were calculated substituting the
values of �� in Eq.7. They may be correlated with the size of the solutes using theories
that describe hindered diffusion of macromolecules in nonadsorbing hydrogels (Kim
and Chauhan, 2008; Ogston et al., 1973; Phillips, 2000; Saini et al., 2005; Tomic et al.,
2007). Based on the assumption of Brady (Clague and Phillips, 1996) that the relative
diffusivity, defined as the ratio between the diffusion coefficients in the gel and in the
dilute, bulk solution, is given by < = � ∙ �, where F is a hydrodynamic-resistance
factor and S is a steric factor, several diffusion models that have been proposed. In the
simplest approach of Ogston et al. (Ogston et al., 1973), the hydrodynamic-resistance is
neglected (F = 1), and the relative diffusivity is given by:
/< = scu�−√�� (14)
where � = ϕ �1 + �R���
k. According to Phillips (Phillips, 2000) , both factors are taken into account and:
/< = scu(−0.84�7.<�)scu(−�ϕ ) (15)
where � = 3.727 − 2.460 ���R + 0.822 ����R!
k and ¤ = 0.358 + 0.366 ��
�R − 0,0939 ����R!k.
The values of the diffusion coefficients of nonadsorbing solute, , and of relative
diffusivity (D/D0) as well as the values of �, for each solute in both hydrogels,
20
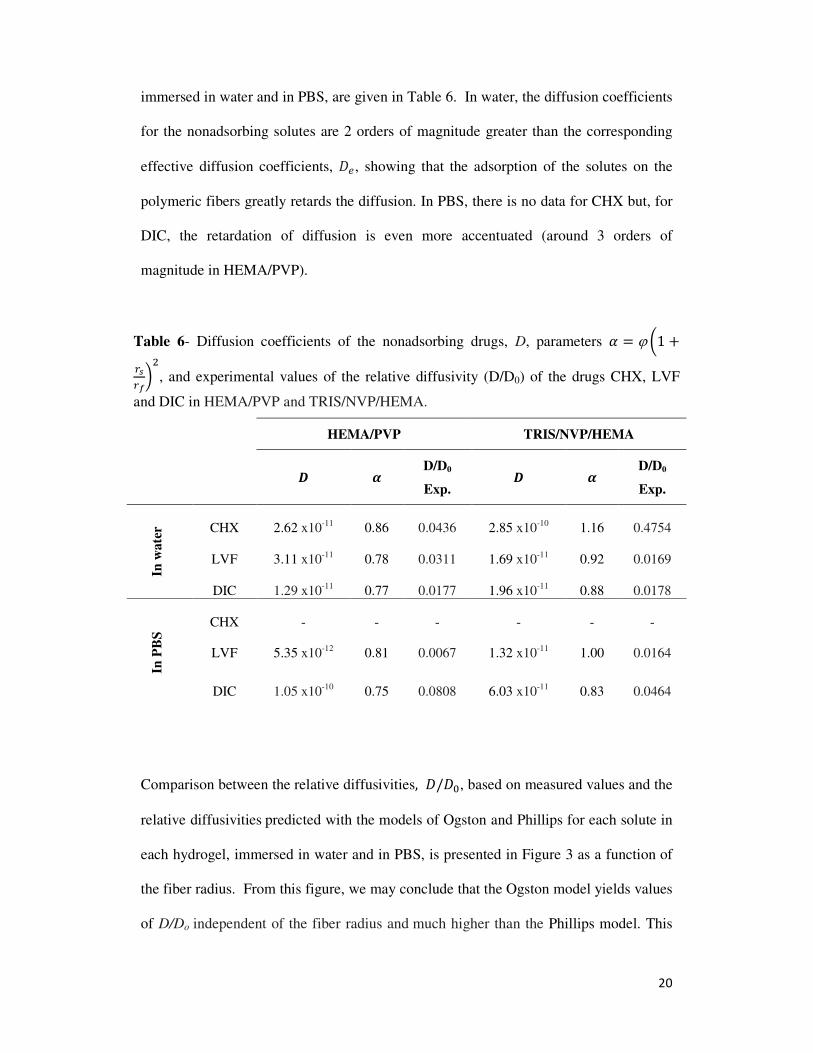
immersed in water and in PBS, are given in Table 6. In water, the diffusion coefficients
for the nonadsorbing solutes are 2 orders of magnitude greater than the corresponding
effective diffusion coefficients, �, showing that the adsorption of the solutes on the
polymeric fibers greatly retards the diffusion. In PBS, there is no data for CHX but, for
DIC, the retardation of diffusion is even more accentuated (around 3 orders of
magnitude in HEMA/PVP).
Comparison between the relative diffusivities, /<, based on measured values and the
relative diffusivitiespredicted with the models of Ogston and Phillips for each solute in
each hydrogel, immersed in water and in PBS, is presented in Figure 3 as a function of
the fiber radius. From this figure, we may conclude that the Ogston model yields values
of D/Do independent of the fiber radius and much higher than the Phillips model. This
Table 6- Diffusion coefficients of the nonadsorbing drugs, D, parameters � = ϕ �1 +�R���
k, and experimental values of the relative diffusivity (D/D0) of the drugs CHX, LVF
and DIC in HEMA/PVP and TRIS/NVP/HEMA.
HEMA/PVP TRIS/NVP/HEMA
§ ¨
D/D0
Exp. § ¨
D/D0
Exp.
In w
ate
r CHX 2.62 x10⁻¹¹ 0.86 0.0436 2.85 x10⁻¹⁰ 1.16 0.4754
LVF 3.11 x10⁻¹¹ 0.78 0.0311 1.69 x10⁻¹¹ 0.92 0.0169
DIC 1.29 x10⁻¹¹ 0.77 0.0177 1.96 x10⁻¹¹ 0.88 0.0178
In P
BS
CHX - - - - - -
LVF 5.35 x10⁻¹² 0.81 0.0067 1.32 x10⁻¹¹ 1.00 0.0164
DIC 1.05 x10⁻¹⁰ 0.75 0.0808 6.03 x10⁻¹¹ 0.83 0.0464
21
latter model predicts null values for D when the radius of the fiber is considerably larger
than the radius of the solute, which means that, in this case, the Phillips model is no
longer applicable. Thus, in HEMA/PVP hydrogel characterized by a large fiber radius
(3.8 nm), the experimental D/Do values are smaller than those predicted with the Ogston
model, and cannot be described by the Phillips model.
For TRIS/NVP/HEMA with a small fiber radius (1.4 nm), the experimental D/Do of our
larger solute (CHX) is in good agreement with the value predicted by the Ogston model.
For the smaller molecules (DIC and LVF), the experimental D/Do values lie between
those predicted by the Ogston and the Phillips models, meaning that some contribution
of the effect of hydrodynamic drag must be considered. From this analysis, it is possible
to conclude that the relative diffusivity of CHX in TRIS/NVP/HEMA is mostly
controlled by the steric factor which is the only factor taken into account by the Ogston
model. In all other cases, the Ogston model underestimates the hindering in the
diffusion inside the hydrogel while the Phillips model largely overestimates this
hindering. This tendency in the Phillips model was recognized by the author who
considered that it is not surprising that “a physical model that consists of a monomodal,
homogeneous distribution of immobile, rigid fibers tends to yield a lower bound for
D/D0” (Phillips, 2000). Furthermore, the model of Phillips was found to give better
agreement with experimental values for large solutes (�� > ��) which are not the
conditions of our systems (Amsden, 1998).
Even more sophisticated models did not reproduce the experimental values of
diffusivity of other solutes through similar hydrogels. Liu et al. (Liu et al., 2013)
studied the diffusion of dextrans with molecular masses of 4, 10, and 20 kDa and the
cationic avidin protein in a HEMA/MAA (70/30,w/w) anionic hydrogel. They found
that for dextrans, although being size excluded, the measured diffusivities were in good
22
agreement with those predicted from a new effective-medium model which considered
solute transport only in the accessible liquid-filled voids. In contrast, the protein
strongly adsorbs to the polymer leading to quantitative disagreement between the
calculated and measured effective diffusion coefficients. In our case, this effective-
medium model was not applied because its application relies on the values of the
hydraulic permeability of the aqueous solvent in the hydrogels which we do not know.
Besides, the effective-medium theory underestimates the dynamic drag and obstruction
of small solutes, (Liu et al., 2013) i.e. solutes smaller than the average mesh size, which
is the case of the studied drugs.
We must refer at this point that, as the results are strongly dependent on the value of the
fiber radius, different methods should be applied to measure this parameter, in order to
achieve a reliable value. It would also be important to have experimental values for �
in order to calculate �� independently, and to be able to further check the consistency
of the applied models. The important conclusion from our experimental values of
diffusion coefficients and partition coefficients is that the three studied drugs CHX,
LVF and DIC adsorb on the polymeric strands of both hydrogels, independently of its
charge or hydrophilicity.
5. Conclusions
Solute partitioning and diffusion in soft contact lens materials provide valuable
information on the drug release mechanism of therapeutic contact lenses. In this work,
we measured equilibrium partitioning and diffusion coefficients of several ophthalmic
drugs, namely, chlorhexidine, levofloxacin and diclofenac in two contact lens materials:
a pHEMA based hydrogel (HEMA/PVP) and a silicone based hydrogel
(TRIS/NVP/HEMA). The diffusion coefficients, �, were experimentally determined
23
from the drug release profiles from samples loaded in sink conditions. The
hydrodynamic radii of the solutes were determined from measurements of diffusion
coefficients in solution, <, with PGSE-NMR. From the values of the partitioning
coefficients and the volume polymer fraction in the hydrogel, ϕ, the enhancement
factors, E, were calculated following the approach developed by the group of C.J.
Radke. As E > 1 in all cases, specific adsorption and/or attractive electrostatic
interactions between the drugs and the polymeric chains are expected. In order to
understand the causes for hindered diffusion of the solutes in the hydrogels, the hard-
sphere solute, the electrostatic and the adsorption enhancement factors were calculated.
���< 1 indicated partial rejection of the solutes. ��� > 1 when the charges of the solutes
and the hydrogels had opposite signs and ��� <1 in the opposite case. �� ≫ 1
suggested that the three studied drugs specifically adsorb on both hydrogels,
independently of their hydrophilicity. Adsorption was maximal for CHX on
TRIS/NVP/HEMA due to strong hydrogen bonding. The relative diffusivity, D/Do,
where D represents the diffusion coefficient of the nonadsorbing solutes, was compared
with the predictions of the theoretical approaches of Ogston and Phillips for hindered
diffusion of solutes in hydrogels. Good agreement was only found for the largest
molecule (CHX) when using the Ogston model which considers exclusively the
obstruction effect. The Phillips model whose applicability seems to be limited to large
solute diffusion greatly underestimates the relative diffusivities of our small solutes.
24
Acknowledgments
This work was funded by Fundação para a Ciência e a Tecnologia through the projects
PEst-OE/QUI/UI0100/2013, M-ERA.NET/0005/2012 and RECI/QEQ-QIN/0189/2012.
A.F.R. Pimenta acknowledges Fundação para a Ciência e a Tecnologia for the PhD
Grant SFRH/BD/52334/2013. Acknowledgements are due to Dr Maria Teresa Nunes
for having done the characterization of TRIS/NVP/HEMA with solid-state NMR, Prof.
Víctor Alves for helping with the Young modulus measurements and Prof. José Luís
Mata for advice.
The authors declare that there are no conflicts of interest.
References
Amsden, B., 1998. Solute Diffusion within Hydrogels. Mechanisms and Models.
Macromolecules 31, 8382–8395.
Bird, R., Stewart, W., Lightfoot, E., 2002. Transport phenomena, 2nd ed. Wiley.
Caccavo, D., Cascone, S., Lamberti, G., Barba, A.A., 2015a. Controlled drug release
from hydrogel-based matrices: Experiments and modeling. Int. J. Pharm. 486, 144–
152.
Caccavo, D., Cascone, S., Lamberti, G., Barba, A.A., 2015b. Modeling the drug release
from hydrogel-based matrices. Mol. Pharm. 12, 474–483. doi:10.1021/mp500563n
Canal, T., Peppas, N., 1989. Correlation between mesh size and equilibrium. J. Biomed.
Mater. Res. 23, 1183–1193.
Clague, D.S., Phillips, R.J., 1996. Hindered diffusion of spherical macromolecules
through dilute fibrous media. Phys. Fluids 8, 1720–1731.
Crank, J., 1975. The Mathematics of Difussion, 2nd Editio. ed. Oxford University Press.
Dajcs, J.J., Thibodeaux, B.A., Marquart, M.E., Girgis, D.O., Traidej, M., O’Callaghan,
R.J., 2004. Effectiveness of ciprofloxacin, levofloxacin, or moxifloxacin for
treatment of experimental Staphylococcus aureus keratitis. Antimicrob. Agents
Chemother. 48, 1948–1952.
Dursch, T.J., Taylor, N.O., Liu, D.E., Wu, R.Y., Prausnitz, J.M., Radke, C.J., 2014.
25
Water-soluble drug partitioning and adsorption in HEMA/MAA hydrogels.
Biomaterials 35, 620–9.
Eckstein, E., Pinchuk, L., Van de Mark, M., 1984. A responsible hydrogel as a means of
preventing classification in urological prostheses, in: Polymers as Biomaterials.
Plenun Press.
Gendron, P.O., Avaltroni, F., Wilkinson, K.J., 2008. Diffusion coefficients of several
rhodamine derivatives as determined by pulsed field gradient-nuclear magnetic
resonance and fluorescence correlation spectroscopy. J. Fluoresc. 18, 1093–1101.
Goa, K.L., Chrisp, P., 1992. Ocular Diclofenac: A Review of its Pharmacology and
Clinical Use in Cataract Surgery, and Potential in Other Inflammatory Ocular
Conditions. Drugs Aging 2, 473–486.
Higa, M., Tanioka, A., Kira, A., 1998. A novel measurement method of Donnan
potential at an interface between a charged membrane and mixed salt solution. J.
Memb. Sci. 140, 213–220.
Hoare, T.R., Kohane, D.S., 2008. Hydrogels in drug delivery: Progress and challenges.
Polymer. 49, 1993–2007.
Kaunisto, E., Abrahmsen-Alami, S., Borgquist, P., Larsson, A., Nilsson, B., Axelsson,
A., 2010. A mechanistic modelling approach to polymer dissolution using
magnetic resonance microimaging. J. Control. Release 147, 232–241.
Kim, J., Chauhan, A., 2008. Dexamethasone transport and ocular delivery from
poly(hydroxyethyl methacrylate) gels. Int. J. Pharm. 353, 205–22.
Kotsmar, C., Sells, T., Taylor, N., Liu, D.E., Prausnitz, J.M., Radke, C.J., 2012.
Aqueous Solute Partitioning and Mesh Size in HEMA/MAA Hydrogels.
Macromolecules 45, 9177–9187.
Lamberti, G., Galdi, I., Barba, A.A., 2011. Controlled release from hydrogel-based solid
matrices. A model accounting for water up-take, swelling and erosion. Int. J.
Pharm. 407, 78–86.
Liu, D.E., Kotsmar, C., Nguyen, F., Sells, T., Taylor, N.O., Prausnitz, J.M., Radke, C.J.,
2013. Macromolecule Sorption and Diffusion in HEMA / MAA Hydrogels. Ind.
Eng. Chem. Res. 18109−18120.
Mathers, W., 2006. Use of Higher Medication Concentrations in the Treatment of
Acanthamoeba Keratitis. Arch Ophthalmol 124, 923.
Métrailler, S., 2012. Measuring the mesh size of hydrogels. Semester Proj. École
Polytech. Fédérale Lausanne.
26
Molyneux, Frank, 1961. The Interaction of Polyvinylpyrrolidone with Aromatic
Compounds in Aqueous Solution. Part I. Thermodynamics of the Binding
Equilibria and Interaction Forces. J. Am. Chem. Soc. 83, 3169.
Ogston, A.G., Preston, B.N., Wells, J.D., 1973. On the Transport of Compact Particles
Through Solutions of Chain-Polymers. Proc. R. Soc. A Math. Phys. Eng. Sci. 333,
297–316.
Overbeek JTh G, 1969. Colloid Science I. Elsevier Pub Co, New York.
Paradiso, P., Chu, V., Santos, L., Serro, A.P., Colaço, R., Saramago, B., 2014. Effect of
plasma treatment on the performance of two drug-loaded hydrogel formulations for
therapeutic contact lenses. J. Biomed. Mater. Res. B. Appl. Biomater. 2010, 1–10.
Paradiso, P., Galante, R., Santos, L., Alves de Matos, A P., Colaço, R., Serro, A P.,
Saramago, B., 2014. Comparison of two hydrogel formulations for drug release in
ophthalmic lenses. J. Biomed. Mater. Res. B. Appl. Biomater. 102, 1170–80.
Peppas, N.A., Khare, A.R., 1993. Preparation, structure and diffusional behavior of
hydrogels in controlled release. Adv. Drug Deliv. Rev. 11, 1–35.
Phillips, R.J., 2000. A hydrodynamic model for hindered diffusion of proteins and
micelles in hydrogels. Biophys. J. 79, 3350–3.
Price, W.S., Elwinger, F., Vigouroux, C., Stilbs, P., 2002. PGSE-WATERGATE, a new
tool for NMR diffusion-based studies of ligand-macromolecule binding. Magn.
Reson. Chem. 40, 391–395.
Ratner, B., Hoffman, A., 1976. Synthetic hydrogels for biomedical applications,
Hydrogels for Medical and Related Applications. Society, American Chemical.
Saini, G.S.S., Kaur, S., Tripathi, S.K., Mahajan, C.G., Thanga, H.H., Verma, A.L.,
2005. Spectroscopic studies of rhodamine 6G dispersed in
polymethylcyanoacrylate. Spectrochim. Acta - Part A Mol. Biomol. Spectrosc. 61,
653–658.
Siepmann, J., Siepmann, F., 2008. Mathematical modeling of drug delivery. Int. J.
Pharm. 364, 328–343.
Tomic, S.L., Micic, M.M., Filipovic, J.M., H., S.E., 2007. Swelling and drug release
behavior of poly(2-hydroxyethyl methacrylate/itaconic acid) copolymeric
hydrogels obtained by gamma irradiation. Radiat. Phys. Chem. 76, 801–810.
Yañez, F., Concheiro, A., Alvarez-Lorenzo, C., 2008. Macromolecule release and
smoothness of semi-interpenetrating PVP-pHEMA networks for comfortable soft
contact lenses. Eur. J. Pharm. Biopharm. 69, 1094–103.
27
Figure captions
Figure 1. CHX (red ), LVF (green ) and DIC (blue ) fractional mass
cumulative profiles for a) HEMA/PVP and b) TRIS/NVP/HEMA in water. Symbols
represent the experimental results (□ DIC; ◊ LVF; ○ CHX) and lines, the fittings to
Eq.12. The error bars represent ± standard deviations.
Figure 2. LVF (green ) and DIC (blue ) fractional mass cumulative profiles
for a) HEMA/PVP and b) TRIS/NVP/HEMA in PBS. Symbols represent the
experimental results (□ DIC; ◊ LVF) and lines, the fittings to of Eq.12. The error bars
represent ± standard deviations.
Figure 3. Experimental relative diffusivity (symbols),/<, and theoretical values
obtained with the Ogston model - Eq.14 – (full lines) and the Phillips model - Eq.15 –
(dashed lines) for CHX, LVF and DIC in HEMA/PVP and TRIS/NVP/HEMA,
immersed in water and in PBS, as a function of the fiber radius.