biodegradable ph-responsive hydrogels for … ph-responsive hydrogels for controlled dual-drug ......
TRANSCRIPT

Electronic Supplementary Information (ESI)
Biodegradable pH-Responsive Hydrogels for Controlled Dual-Drug
Release
Liang Xu,a Linzi Qiu,a Yang Sheng,a Yixin Sun,a Linhong Deng,c Xinqing Li,d Mark Bradleyb and Rong
Zhanga*
aJiangsu Key Laboratory of Environmentally Friendly Polymeric Materials, School of Materials Science and
Engineering, Changzhou University, Changzhou 213164, China. [email protected]. bSchool of Chemistry, EaStCHEM, University of Edinburgh, Joseph Black Building, West Mains Road, Edinburgh,
EH93JJ, UK cInstitute of Biomedical Engineering and Health Sciences, Changzhou University, Changzhou 213164, Jiangsu,
China. dDepartment of Plastic and Aesthetic Surgery, the Affiliated Second People's Hospital of Changzhou, Nanjing
Medical University, Changzhou 213003, Jangsu, China.
Methods
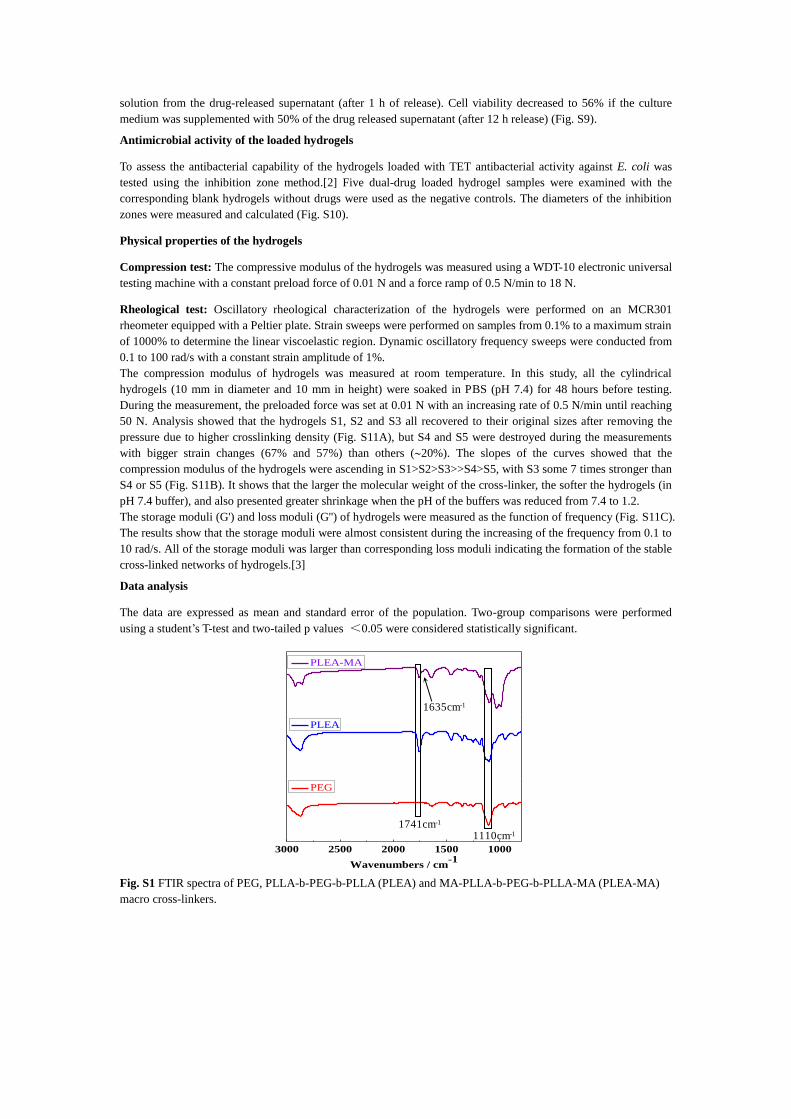
FTIR analysis of Polymers:
FTIR of PLLA-PEG-PLLA and MA-PLLA-PEG-PLLA-MA (Fig. S1). Specific peaks: 1741 cm-1 (C=O of ester),
1110 cm-1 (ether group, C-O-C), 1635 cm-1 (C=C of methacrylates).
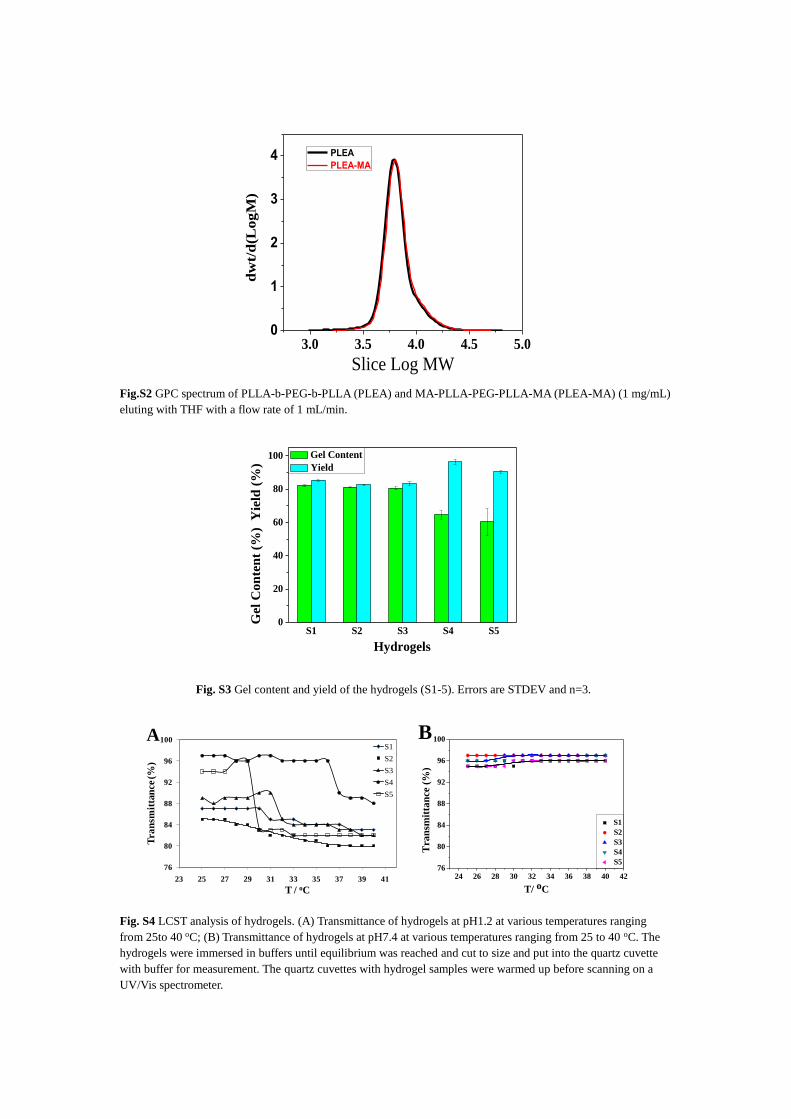
The gel content and yield of hydrogels
The gel content and yield were analyzed gravimetrically (Fig. S3). The dried hydrogel at constant weight (Wc) was
immersed in deionized water for 48 hours in order to removal of the unreacted monomers. The hydrogel was then
dried in a vacuum oven at 50 oC until constant weight (Wf). The gel content yield of the hydrogels was calculated
by using following equations:
% 100f
c
WGel
W
% 100c
i
WYield
W
Where Wi is the total mass of the monomers of the MA-PLLA-PEG-PLLA-MA, AA, NIPAM and photo-initiator
I2959.
Drug loading and encapsulation efficiency of hydrogels
The concentration of the drug solution was obtained by using the standard drug concentration curves (Fig. S5A-D).
Therefore the drug loading efficiencies of DOX and TET were calculated. Each polymer was analyzed with three
repeats. Drug loading was determined by calculating the difference of the drug weight dissolved in the drug
solutions before and after immersing the hydrogels over the weight of dried hydrogels. The experiments were
repeated three times and the average values were obtained.
Encapsulation efficiency was calculated according to the following equation:
Encapsulation efficiency (%) =Drug weight loaded in a hydrogel sample
Drug weight in the solution before drug loading
The equation for the calculation of the swelling ratios of hydrogels:
SR =Qt
Q0× 100%
Where Qt is the weight of the swelling hydrogels at time point t in a buffer, Q0 is the weight of the dry hydrogel
before the swelling experiment.
Electronic Supplementary Material (ESI) for Journal of Materials Chemistry B.This journal is © The Royal Society of Chemistry 2018

Hydrogel degradation calculation:
Weight Loss (%) =W0 − Wt
W0× 100%
Where Wt was the weight of a hydrogel at the time t during the degradation and W0 was the initial weight of the
dry hydrogel.
Calculation of in vitro dual drug release:
Q = CnVn+∑ Cii=1n−1 Vi
Where Q was cumulative molar amount of the released drug, Cn was the concentration of TET or DOX in the
buffer at time t, Vn was the volume of the buffer in the drug release experiment (8 mL/vial), and Vi was the volume
of the collected buffer from each vial (4 mL/time point/vial).
Cell culture
Human adipose-derived stem cells (hADSCs) were isolated and purified in the lab following a literature
proeedure.[1] In detail, hADSCs were isolated from the armpit fat of an 18 year old female patient after plastic
surgery in the Affiliated Second People's Hospital of Changzhou. The fat tissue (about 30 g) was cut into small
pieces and washed for three times with PBS (50 mL) to remove blood (1500 rpm, 5 min). The cleaned fat tissue
was then suspended in collagenase I solution in PBS (0.1 wt%) and incubated in 37 oC for 60 min. The fat
suspension was then filtered through 100 and 200 mesh cloths respectively before centrifugation (1500 rpm, 5
min). The pellet was re-suspended in erythrocyte lysis buffer (20 mL) for 10 min. After centrifugation (1500 rpm,
5 min), the pellet was re-suspended and cultured in a tissue culture flask (25 mL) in Dulbecco's Modified Eagle's
medium (DMEM) supplemented with fetal bovine serum (10%), antibiotics (penicillin and streptomycin, 100 units
per mL), bFGF (1 ng/100 mL), NaHCO3 (0.044 M) and tetracycline (0.3 wt%) in an incubator with 5% CO2 at 37 oC. Three days later the medium was refreshed. The medium was refreshed every 2 to 3 days depending on the
growth of cells. The cells were passaged until 90% confluence and then re-seeded into fresh tissue culture plates in
a 1 to 3 split, with the cells passaged 3 times before use.
HeLa cells were cultured in low glucose DMEM supplemented with fetal bovine serum (10%), antibiotics
(penicillin and streptomycin, 100 units per mL) in an incubator with 5% CO2 at 37 oC. The medium was refreshed
every 2 to 3 days depending on the growth of cells. The cells were harvested for experiments when 90% confluent.
Cytotoxicity of polymers
The cell culture medium was complemented with DMEM containing 0, 10, 20, 50 and 100% of the degradation
supernatant of the hydrogels (soaked in DMEM for 24 h). It was found that the media was poorly toxic when used
for hADSCs cell culture (Fig. S8).
In vitro HeLa cell killing and antibacterial activity
DOX and TET were used as drug models for testing the controlled drug release from the hydrogels. Dual-drug
loaded hydrogels were sterilized under UV illumination for 30 min. 100 mg of hydrogel was socked in 4 mL of
Dulbecco’s Eagle Medium (DMEM, ThermoFisher Scientific) supplemented with 10 % FBS (NQBB) and 1 %
penicillin/streptavidin (Sigma-Aldrich) in a 48-well plate before incubation at 37 oC. The supernatant from each
well was collected at 1 h and 12 h and mixed with freshly complemented DMEM containing 0, 10, 20 and 50% v/v
of the collected supernatant and subsequent culturing of cells in a 48-well plate for 24 h (2104 cells per well).
Then the medium were removed from the plate and replaced with 200 μL DMEM containing 20 μL CCK-8
(TJBiolite). The well plates were placed into an incubator for 2 h at 37 oC before analysis with a microplate reader
(Epoch) at 450 nm. Cell viability was calculated using the following equation:
Cell Viability % =Asample − Ablank
A0 − Ablank× 100%
Where the Asample was the UV absorption of the wells with cells cultured in DMEM containing the supernatant of
the degraded hydrogel, Ablank was the absorption of the corresponding DMEM without cells, A0 was the absorption
of the wells with cells cultured in pure DMEM.
Doxorubicin activity was evaluated by measuring the viability of HeLa cells incubated in DMEM containing the
released drugs from the hydrogels after incubation with the dual-drug loaded hydrogels for 1 or 12 hours
respectively at 37 oC. HeLa cell viability was lowered to 80% when the media was supplemented with 10% of the
solution from the drug-released supernatant (after 1 h of release). Cell viability decreased to 56% if the culture
medium was supplemented with 50% of the drug released supernatant (after 12 h release) (Fig. S9).
Antimicrobial activity of the loaded hydrogels
To assess the antibacterial capability of the hydrogels loaded with TET antibacterial activity against E. coli was
tested using the inhibition zone method.[2] Five dual-drug loaded hydrogel samples were examined with the
corresponding blank hydrogels without drugs were used as the negative controls. The diameters of the inhibition
zones were measured and calculated (Fig. S10).
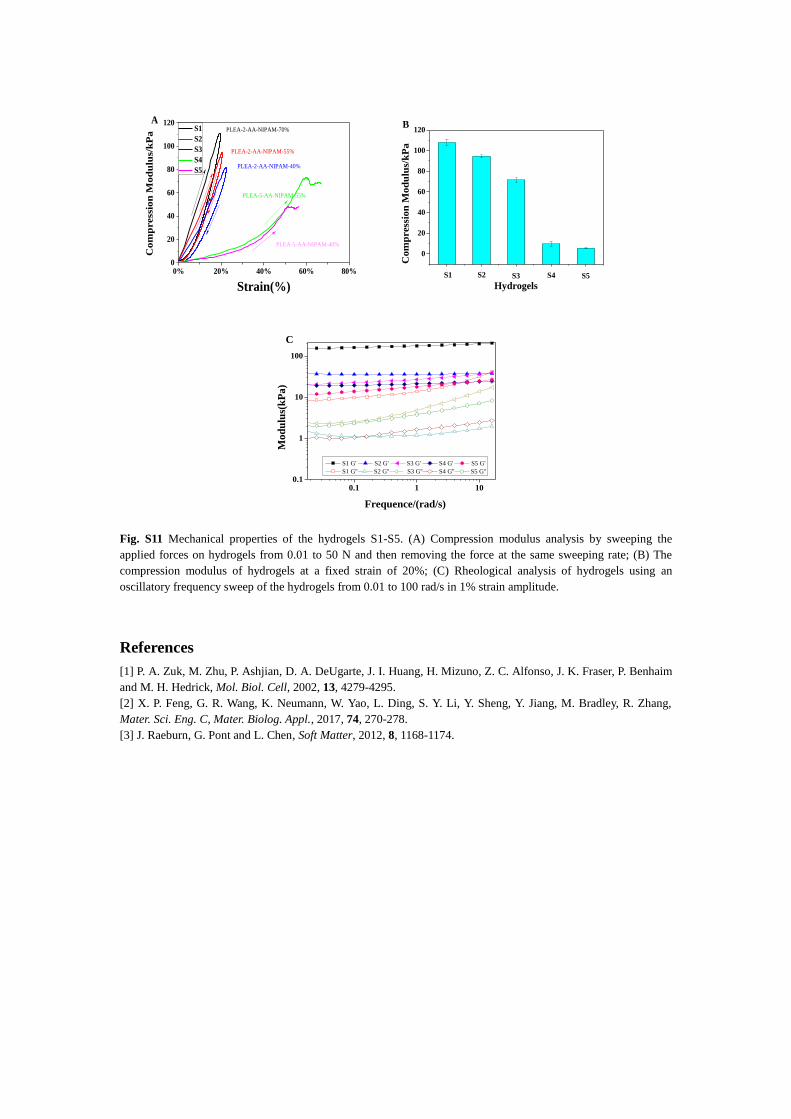
Physical properties of the hydrogels
Compression test: The compressive modulus of the hydrogels was measured using a WDT-10 electronic universal
testing machine with a constant preload force of 0.01 N and a force ramp of 0.5 N/min to 18 N.
Rheological test: Oscillatory rheological characterization of the hydrogels were performed on an MCR301
rheometer equipped with a Peltier plate. Strain sweeps were performed on samples from 0.1% to a maximum strain
of 1000% to determine the linear viscoelastic region. Dynamic oscillatory frequency sweeps were conducted from
0.1 to 100 rad/s with a constant strain amplitude of 1%.
The compression modulus of hydrogels was measured at room temperature. In this study, all the cylindrical
hydrogels (10 mm in diameter and 10 mm in height) were soaked in PBS (pH 7.4) for 48 hours before testing.
During the measurement, the preloaded force was set at 0.01 N with an increasing rate of 0.5 N/min until reaching
50 N. Analysis showed that the hydrogels S1, S2 and S3 all recovered to their original sizes after removing the
pressure due to higher crosslinking density (Fig. S11A), but S4 and S5 were destroyed during the measurements
with bigger strain changes (67% and 57%) than others (20%). The slopes of the curves showed that the
compression modulus of the hydrogels were ascending in S1>S2>S3>>S4>S5, with S3 some 7 times stronger than
S4 or S5 (Fig. S11B). It shows that the larger the molecular weight of the cross-linker, the softer the hydrogels (in
pH 7.4 buffer), and also presented greater shrinkage when the pH of the buffers was reduced from 7.4 to 1.2.
The storage moduli (G') and loss moduli (G'') of hydrogels were measured as the function of frequency (Fig. S11C).
The results show that the storage moduli were almost consistent during the increasing of the frequency from 0.1 to
10 rad/s. All of the storage moduli was larger than corresponding loss moduli indicating the formation of the stable
cross-linked networks of hydrogels.[3]
Data analysis
The data are expressed as mean and standard error of the population. Two-group comparisons were performed
using a student’s T-test and two-tailed p values <0.05 were considered statistically significant.
Fig. S1 FTIR spectra of PEG, PLLA-b-PEG-b-PLLA (PLEA) and MA-PLLA-b-PEG-b-PLLA-MA (PLEA-MA)
macro cross-linkers.
3000 2500 2000 1500 1000
Wavenumbers / cm-1
PEG
PLEA
PLEA-MA
1741cm-1
1635cm-1
1110cm-1
3.0 3.5 4.0 4.5 5.00
1
2
3
4
dw
t/d
(Lo
gM
)
Slice Log MW
PLEA
PLEA-MA
Fig.S2 GPC spectrum of PLLA-b-PEG-b-PLLA (PLEA) and MA-PLLA-PEG-PLLA-MA (PLEA-MA) (1 mg/mL)
eluting with THF with a flow rate of 1 mL/min.
S1 S2 S3 S4 S50
20
40
60
80
100
Gel
Co
nte
nt
(%)
Yie
ld (
%)
Gel Content
Yield
Hydrogels
Fig. S3 Gel content and yield of the hydrogels (S1-5). Errors are STDEV and n=3.
24 26 28 30 32 34 36 38 40 4276
80
84
88
92
96
100
S1
S2
S3
S4
S5
Tra
nsm
itta
nce
(%
)
T/ oC
B
Fig. S4 LCST analysis of hydrogels. (A) Transmittance of hydrogels at pH1.2 at various temperatures ranging
from 25to 40 oC; (B) Transmittance of hydrogels at pH7.4 at various temperatures ranging from 25 to 40 oC. The
hydrogels were immersed in buffers until equilibrium was reached and cut to size and put into the quartz cuvette
with buffer for measurement. The quartz cuvettes with hydrogel samples were warmed up before scanning on a
UV/Vis spectrometer.
76
80
84
88
92
96
100
23 25 27 29 31 33 35 37 39 41
Tra
nsm
itta
nce
(%
)
T / oC
AS1
S2
S3
S4
S5

0.00 0.02 0.04 0.06 0.08 0.100.0
0.5
1.0
1.5
2.0
2.5
Ab
sorb
an
ce
C (mg/ml)
Equation y = a + b
Adj. R-Squa 0.99987
Value Standard Err
B Intercept 0.03158 0.00657
B Slope 22.6791 0.12724
A
0.00 0.01 0.02 0.03 0.04 0.050.0
0.4
0.8
1.2
1.6
2.0
Ab
sorb
an
ce
C (mg/ml)
Equation y = a + b*x
Adj. R-Square 0.99954
Value Standard Error
B Intercept 0.02 0.01102
B Slope 30.944 0.38237
B
0.000 0.002 0.004 0.006 0.008 0.0100.00
0.05
0.10
0.15
0.20
0.25
0.30
Ab
sorb
ran
ce
C (mg/ml)
Equation y = a + b
Adj. R-Squ 0.99986
Value Standard Er
B Intercep 0.0036 6.91854E-4
B Slope 23.064 0.13404
C
0.000 0.002 0.004 0.006 0.008 0.010 0.0120.00
0.05
0.10
0.15
0.20
0.25
0.30
Ab
sorb
ran
ce
C (mg/ml)
Equation y = a + b*
Adj. R-Squar 0.9993
Value Standard Err
B Intercept 0.00329 0.00163
B Slope 23.8215 0.31542
D
Fig. S5 The standard drug concentration curves in PBS (pH 7.4) and acidified PBS (pH1.2). A: TET at pH1.2; B:
TET at pH7.4; C: DOX at pH1.2 and D: DOX at pH7.4.
300 400 500 600 700
0.0
0.2
0.4
0.6
0.8
1.0
1.2
Ab
sorb
an
ce
Wavelength/nm
TET UV absorption curve
DOX UV absorption curve
Dual drugs UV absorption curve
Fig. S6 The UV absorption curves of the drug tetracycline hydrochloride (black line), doxorubicin (red line), and
the hydrogel loaded with both drugs (blue line).

Fig. S7 Optical images of hydrogel S4 under different conditions: (1) Dried hydrogel; (2) The hydrogel after drug
release at pH1.2 (most of the Dox is retained in the hydrogel); (3) The hydrogel after drug release at pH7.4; (4)
The dried hydrogel with the loaded drug (Dox). The insert numbers are the diameter of the hydrogel showing
swelling at different pH’s.
10% 20% 50% 100%0%
20%
40%
60%
80%
100%
120%
Cell
su
rvia
l p
ercen
tage %
Concentrations %
Fig. S8 Cytotoxicity analyses of hADSCs cultured in DMEM containing 0, 10, 20, 50 and 100% hydrogel (S4) of
supernatant (this stock supernatant solution was prepared by incubating for 24 h 100 mg of the hydrogel in 4 mL of
DMEM). hADSCs were cultured in DMEM media (the desired volume of hydrogel stock DMEM) on PS tissue
culture well plates for 24 hours before the CCK8 test (Student’s T-test, all concentrations were compared to 10%,
p>0.2).
(A)
40
50
60
70
80
90
100
S5S4S3S2S1S5S4S3S2
Cell
Via
bil
ity
(%
)
Hydrogels
10% release liquid
20% release liquid
50% release liquid
S1
1h
12h

(B)
Drug concentration in the supernatant of DMEM incubated with drug-loaded hydrogels
(mg/mL (M)). The concentrations of Doxorubicin used in the cell cultures (above) were 10%,
20% and 50% of these values
Incubation time
(h)
DOX TET
1 12 1 12
S1 0.0064 (12M) 0.032 (58M) 0.026(58M) 0.051 (115M)
S2 0.0087 (15M) 0.037 (67M) 0.039(88M) 0.068(153M)
S3 0.013 (23M) 0.038 (69M) 0.041(92M) 0.056 (126M)
S4 0.016 (29M) 0.051 (93M) 0.057(128M) 0.081 (182M)
S5 0.023 (42M) 0.062 (113M) 0.05 (113M) 0.081 (182M)
(C)
Fig. S9 The released drug supernatants were collected following incubation of the drug-loaded hydrogels (100 mg)
in DMEM (4 mL) for 1 and 12 h. In cell culture this supernatant was used at 10%, 20% and 50% v/v.
(A) HeLa cell viability when cultured in DMEM with the hydrogel-drug-supernatants.
(B) The levels of released drug (Dox) in the table were calculated by analysis of the drug release profiles. If 100%
of the drug were released this would equate to 0.4 mg of drug in 4 mL (0.1 mg/mL or 184M Dox). This is then
diluted into the cell culture media (1 in 10; 1 in 5 and 1 in 1).
(C) HeLa cell viability when cultured in DMEM with varying concentrations of DOX. The control (0%) is cells
cultured in DMEM without any drug. The culture time was 24 hours after the addition of DMEM+Drug. The error
is STDEV and n=3.
0
20
40
60
80
100
120
Ce
ll V
iab
ilit
y /%
Concentration of DOX (M)

(A)
(B)
Sample No. Diameters of inhibition zones
(mm)
S1 23±0.4
S2 22±0.3
S3 25±0.5
S4 33±0.8
S5 35±0.7
(C)
Fig. S10
(A) Images of inhibition zones of various hydrogels loaded with DOX and TET placed on agar gels with E. coli
cultured in an incubator at 37oC at 75% humidity for 24 h. S1-5 are hydrogel samples with loaded drugs and S1'-5'
the equivalent hydrogel without drug loading.
(B) Table of the diameters of the E. coli inhibition zones on agar plates with dual-drug loaded hydrogels. Note: The
diameter of the inhibition zones of the controls were all zero.
(C) HeLa cell viability when cultured in DMEM with various percentages of Tetracycline. The controls (0%) were
cells cultured in DMEM without any drug. The culture time was 24 hours after the addition of DMEM+Drug (n=3).
As expected HeLa cells were viable in the presence of tetracycline.
0
20
40
60
80
100
120
140
Ce
ll V
iab
ilit
y /%
Concentration of TET (M)
0% 20% 40% 60% 80%0
20
40
60
80
100
120
PLEA-5-AA-NIPAM-40%
PLEA-5-AA-NIPAM-55%
PLEA-2-AA-NIPAM-40%
PLEA-2-AA-NIPAM-55%C
om
press
ion
Mo
du
lus/
kP
a
Strain(%)
S1
S2
S3
S4
S5
PLEA-2-AA-NIPAM-70%
A
0
20
40
60
80
100
120
S4 S5S3S2
Co
mp
ress
ion
Mo
du
lus/
kP
a
S1
B
Hydrogels
0.1 1 100.1
1
10
100
Mo
du
lus(
kP
a)
Frequence/(rad/s)
S1 G' S2 G' S3 G' S4 G' S5 G'
S1 G'' S2 G'' S3 G'' S4 G'' S5 G''
C
Fig. S11 Mechanical properties of the hydrogels S1-S5. (A) Compression modulus analysis by sweeping the
applied forces on hydrogels from 0.01 to 50 N and then removing the force at the same sweeping rate; (B) The
compression modulus of hydrogels at a fixed strain of 20%; (C) Rheological analysis of hydrogels using an
oscillatory frequency sweep of the hydrogels from 0.01 to 100 rad/s in 1% strain amplitude.
References
[1] P. A. Zuk, M. Zhu, P. Ashjian, D. A. DeUgarte, J. I. Huang, H. Mizuno, Z. C. Alfonso, J. K. Fraser, P. Benhaim
and M. H. Hedrick, Mol. Biol. Cell, 2002, 13, 4279-4295.
[2] X. P. Feng, G. R. Wang, K. Neumann, W. Yao, L. Ding, S. Y. Li, Y. Sheng, Y. Jiang, M. Bradley, R. Zhang,
Mater. Sci. Eng. C, Mater. Biolog. Appl., 2017, 74, 270-278.
[3] J. Raeburn, G. Pont and L. Chen, Soft Matter, 2012, 8, 1168-1174.