control of mercury emissions by injecting powdered activated carbon (pac) michael d. durham, ph.d.,...
TRANSCRIPT
Control of Mercury Emissions
by Injecting Powdered Activated Carbon (PAC)
Michael D. Durham, Ph.D., MBA
ADA Environmental Solutions
8100 SouthPark Way B-2
Littleton, CO 80120
303 734-1727
Presentation to
Utility MACT Working Group
May 13, 2002
EPA, RTP, NC
Outline
ADA-ES DOE/NETL Hg Control Program
Background on PAC Injection Technology
Results from PAC with an ESP
Results from PAC with a FF
Conclusions and Future Plans
ADA-ES Hg Control Program
Full-scale field testing of sorbent-based mercury control on non-scrubbed coal-fired boilers
Primary funding from DOE National Energy Technology Laboratory (NETL)
Cofunding provided by:– Southern Company – Wisconsin Electric– PG&E NEG– EPRI– Ontario Power Generation– TVA– First Energy– Kennecott Energy– Arch Coal
Project Overview
Perform first full-scale evaluations of mercury control on
coal-fired boilers (up to 150 MW equivalent).
Evaluate effectiveness of sorbent-based Hg control
(activated carbon).
Test several different power plant configurations.
Document all costs associated with Hg control.
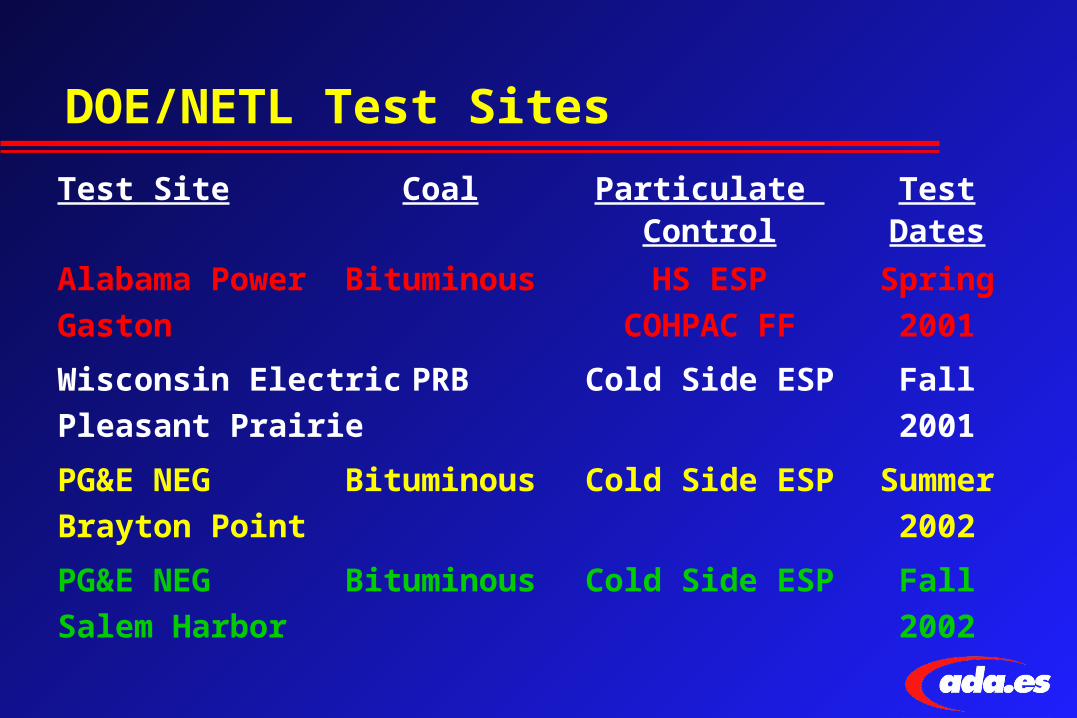
DOE/NETL Test Sites
Test Site Coal Particulate TestControl Dates
Alabama Power Bituminous HS ESP Spring
Gaston COHPAC FF 2001
Wisconsin Electric PRB Cold Side ESP Fall
Pleasant Prairie 2001
PG&E NEG Bituminous Cold Side ESP Summer
Brayton Point 2002
PG&E NEG Bituminous Cold Side ESP Fall
Salem Harbor 2002
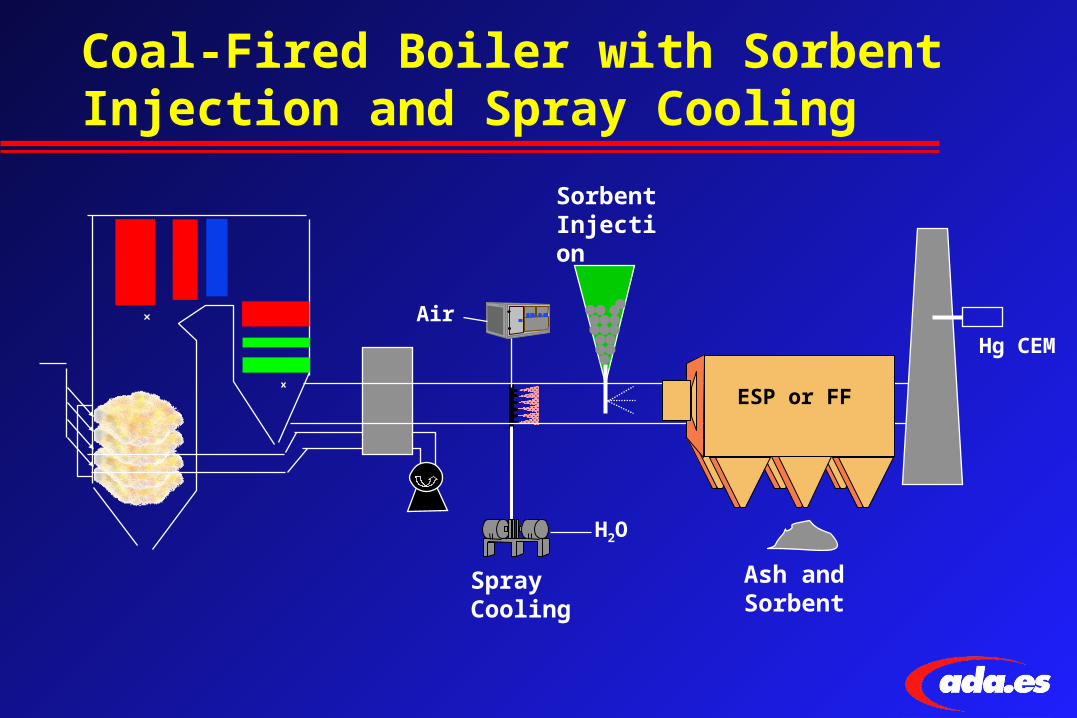
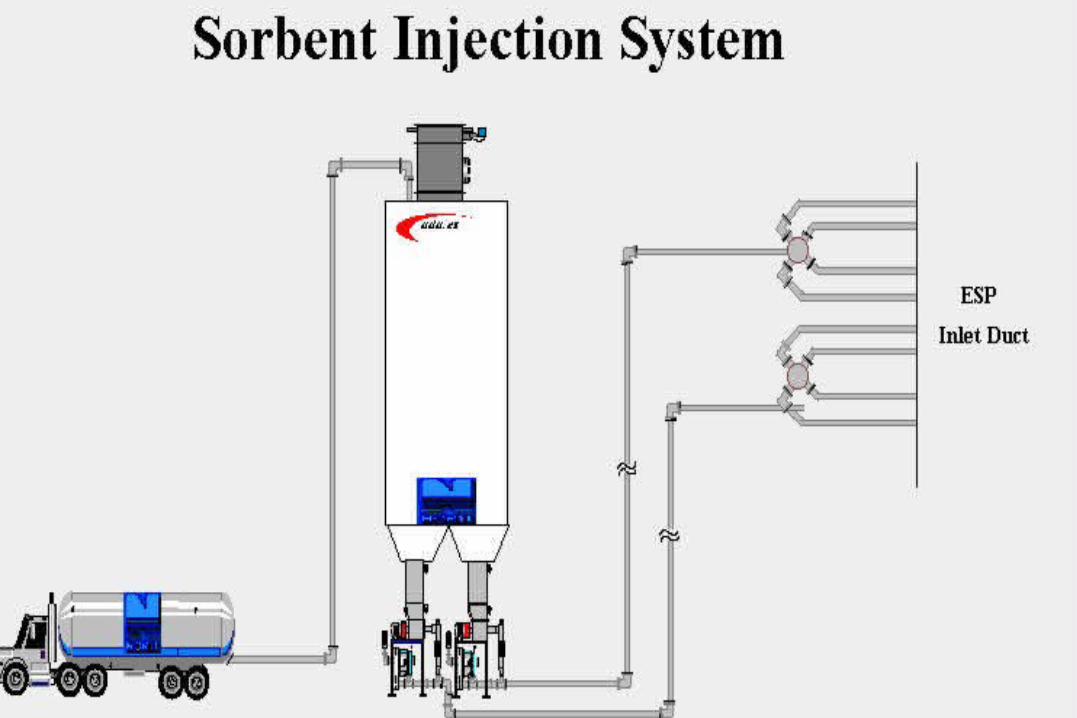
Coal-Fired Boiler with Sorbent Injection and Spray Cooling
Sorbent Injection
Spray Cooling
H2O
Air
Ash and Sorbent
ESP or FF
Hg CEM
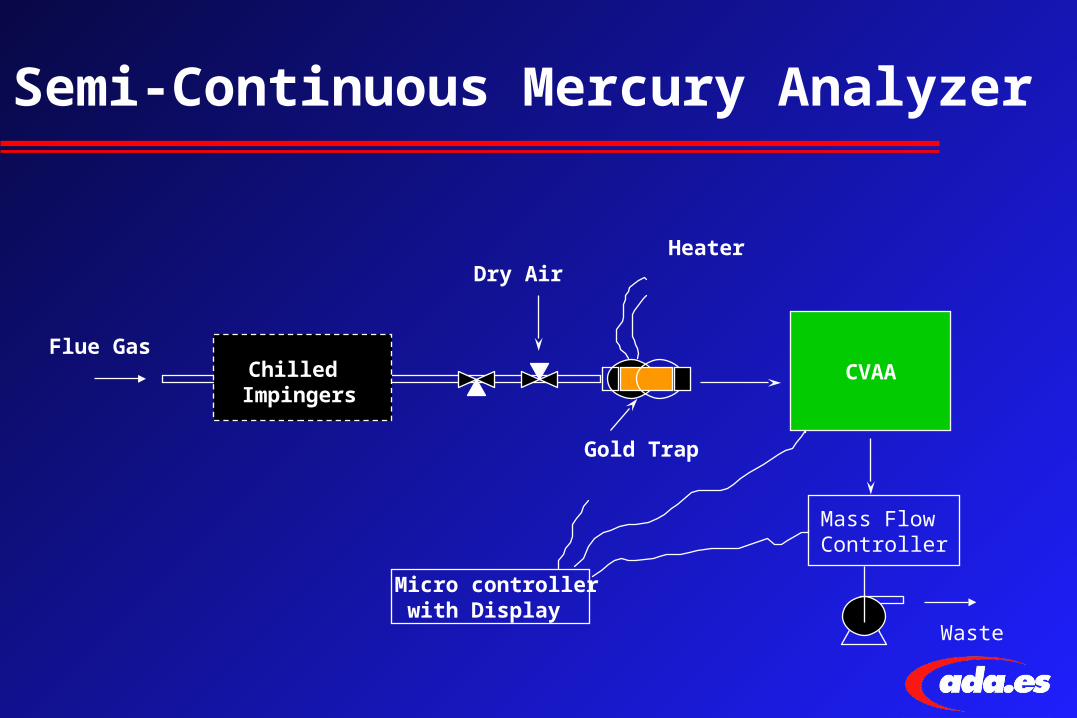
Semi-Continuous Mercury Analyzer
Chilled Impingers
Flue GasCVAA
Mass Flow Controller
Gold Trap
Waste
Heater
Micro controller with Display
Dry Air
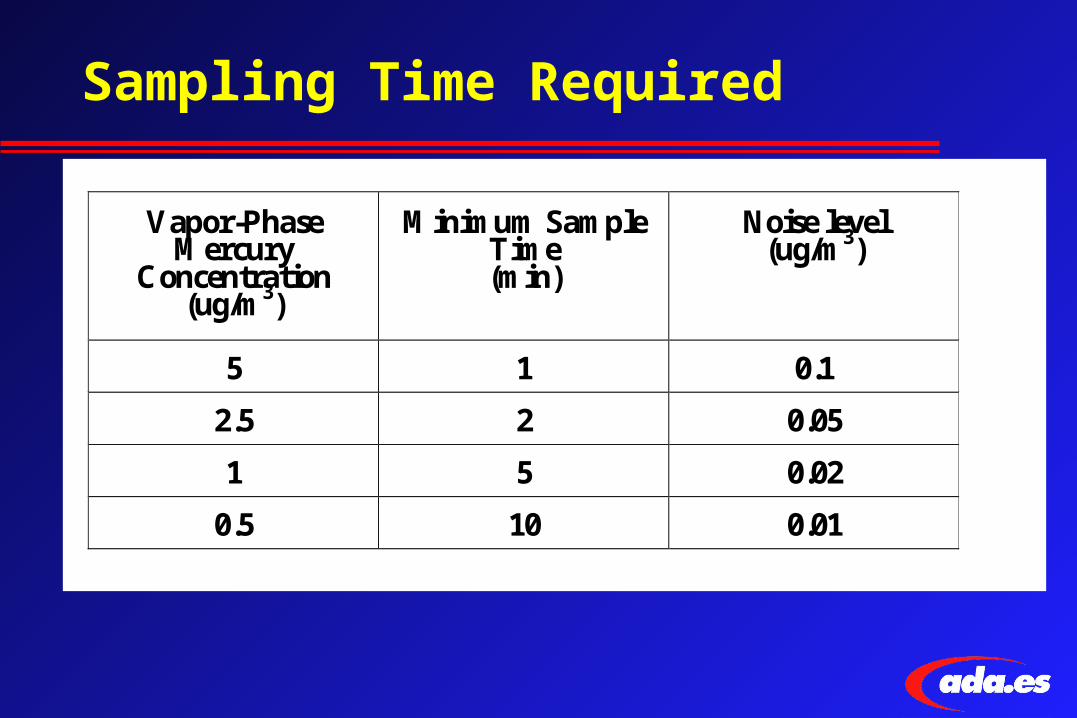
Sampling Time Required
Vapor-Phase Mercury
Concentration (ug/m3)
Minimum Sample Time (min)
Noise level (ug/m3)
5 1 0.1
2.5 2 0.05
1 5 0.02
0.5 10 0.01
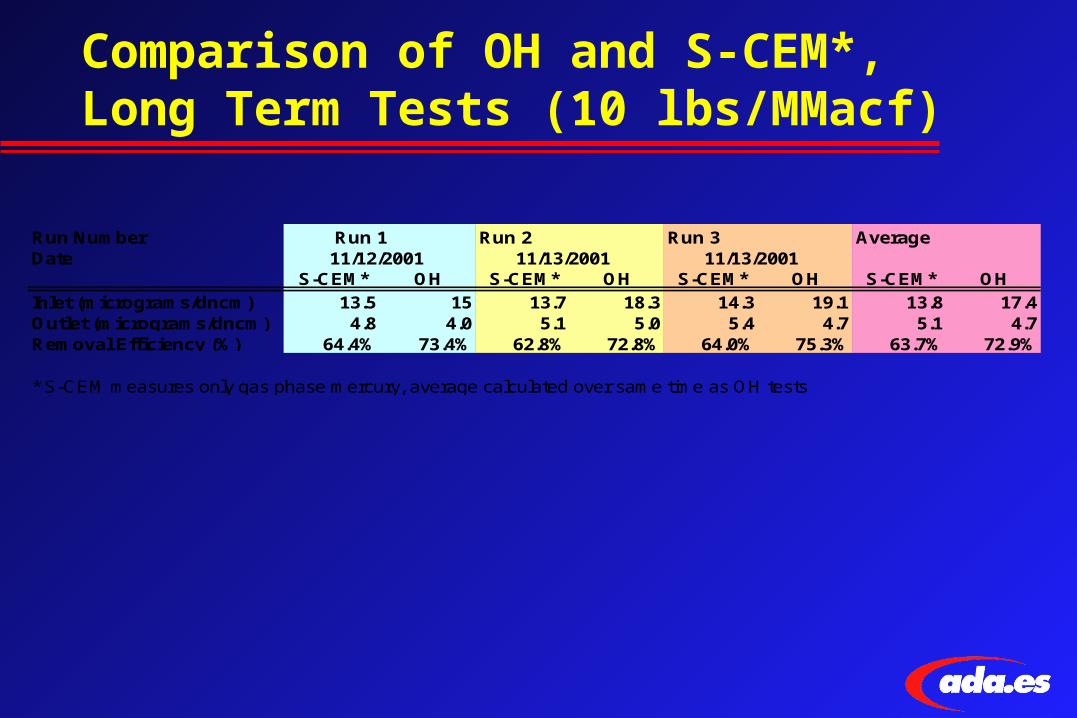
Comparison of OH and S-CEM*, Long Term Tests (10 lbs/MMacf)
Run Number Run 1 Run 2 Run 3 AverageDate 11/12/2001 11/13/2001 11/13/2001
S-CEM* OH S-CEM* OH S-CEM* OH S-CEM* OH
Inlet (micrograms/dncm) 13.5 15 13.7 18.3 14.3 19.1 13.8 17.4Outlet (micrograms/dncm) 4.8 4.0 5.1 5.0 5.4 4.7 5.1 4.7Removal Efficiency (%) 64.4% 73.4% 62.8% 72.8% 64.0% 75.3% 63.7% 72.9%
* S-CEM measures only gas phase mercury, average calculated over same time as OH tests
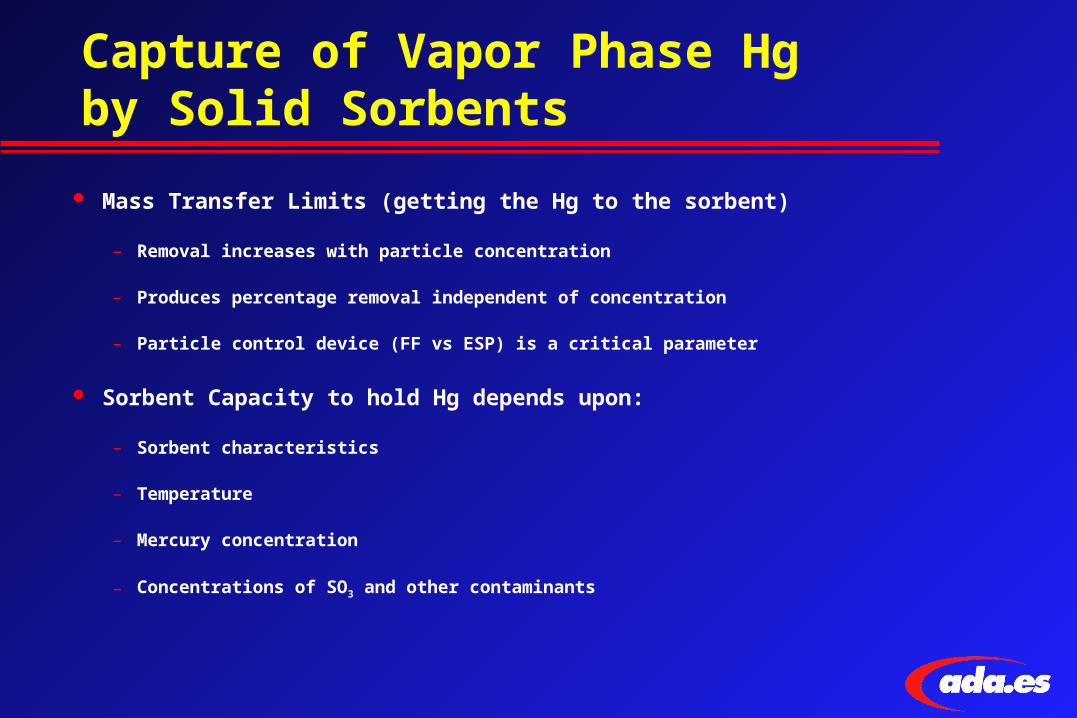
Capture of Vapor Phase Hg by Solid Sorbents
Mass Transfer Limits (getting the Hg to the sorbent)
– Removal increases with particle concentration
– Produces percentage removal independent of concentration
– Particle control device (FF vs ESP) is a critical parameter
Sorbent Capacity to hold Hg depends upon:
– Sorbent characteristics
– Temperature
– Mercury concentration
– Concentrations of SO3 and other contaminants
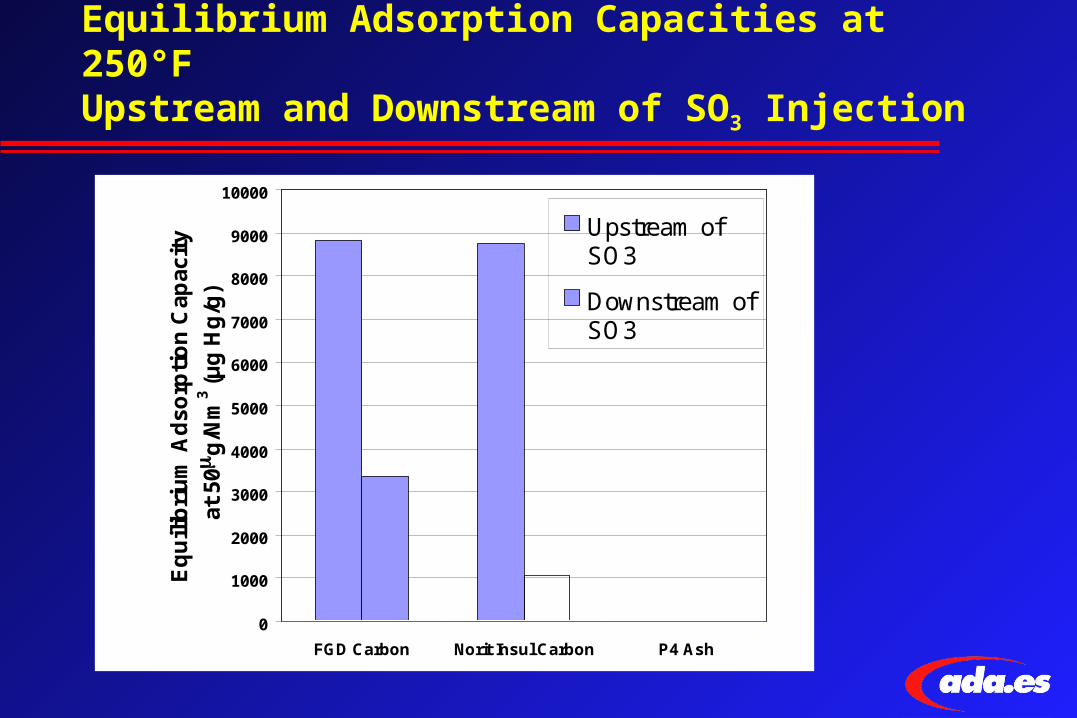
Equilibrium Adsorption Capacities at 250°FUpstream and Downstream of SO3 Injection
0
1000
2000
3000
4000
5000
6000
7000
8000
9000
10000
FGD Carbon Norit Insul Carbon P4 Ash
Eq
uili
bri
um
Ad
sorp
tio
n C
apac
ity
at
50m g
/Nm
3 (µ
g H
g/g
)Upstream ofSO3
Downstream ofSO3
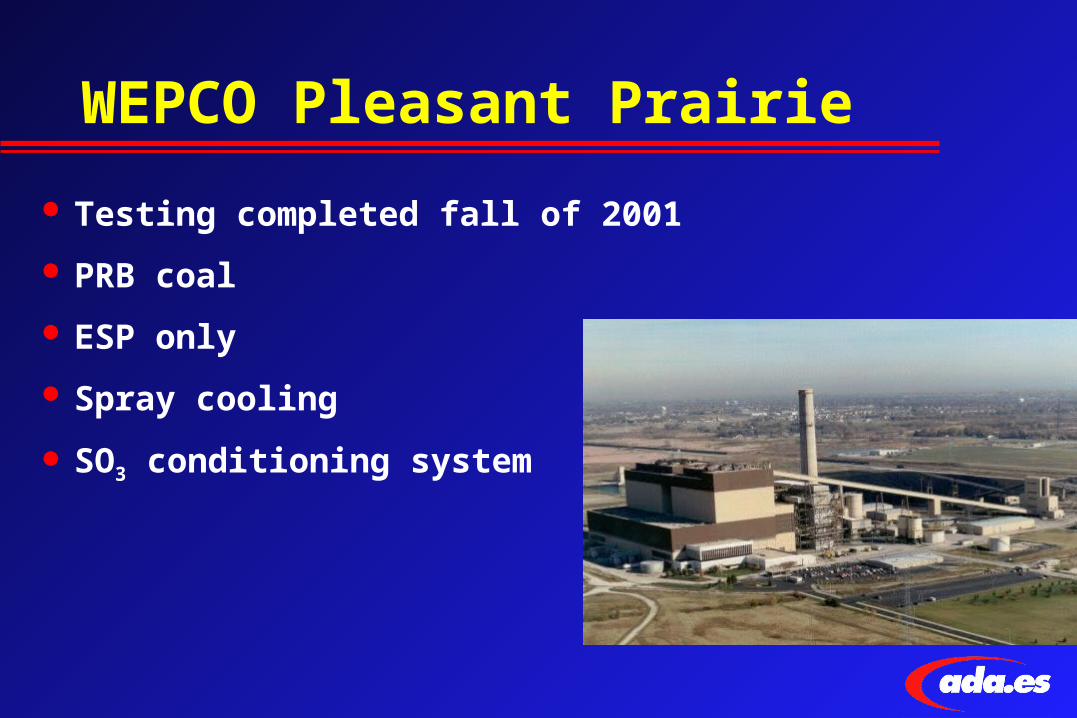
WEPCO Pleasant Prairie
Testing completed fall of 2001
PRB coal
ESP only
Spray cooling
SO3 conditioning system
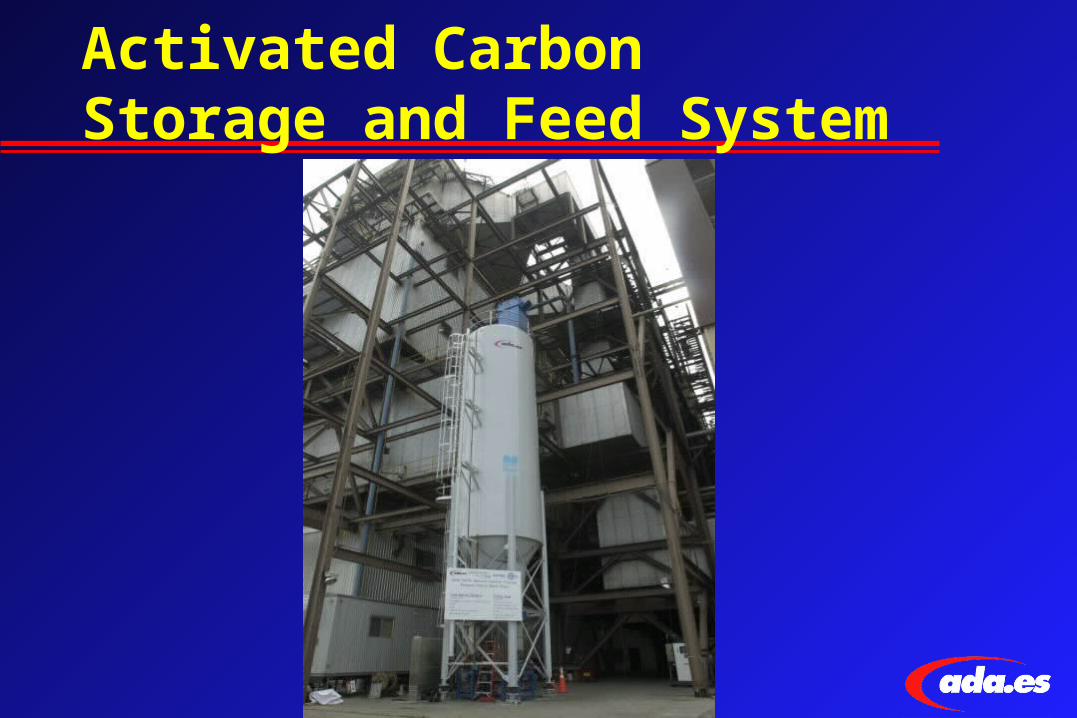
Activated Carbon Storage and Feed System
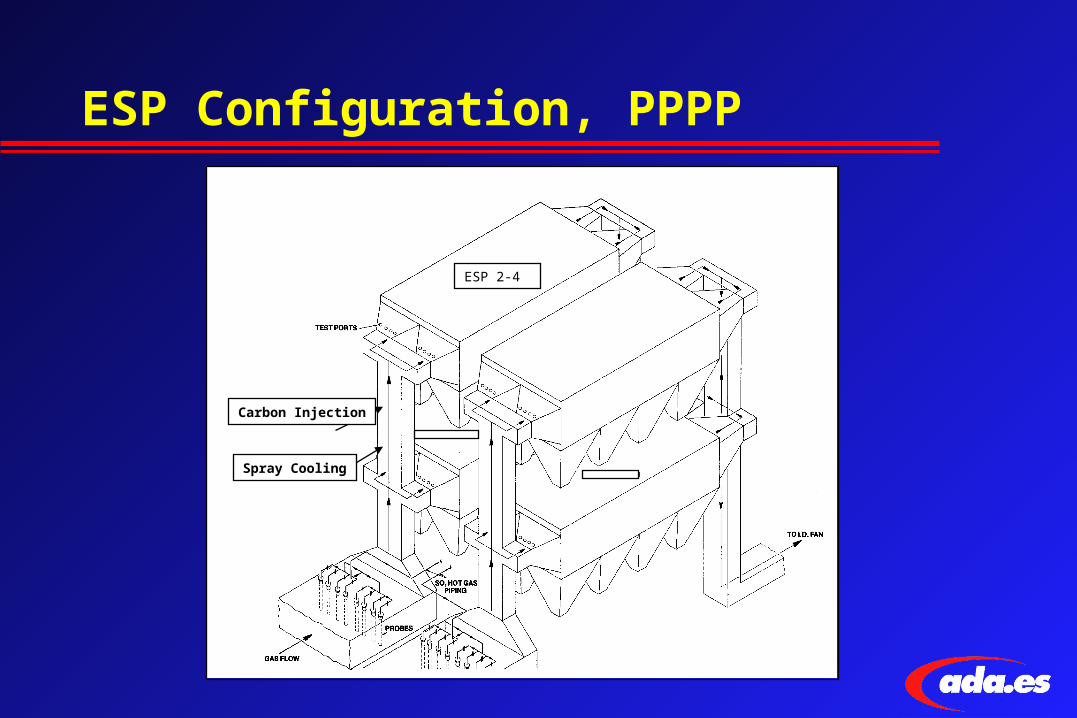
ESP Configuration, PPPP
ESP 2-4
Spray Cooling
Carbon Injection
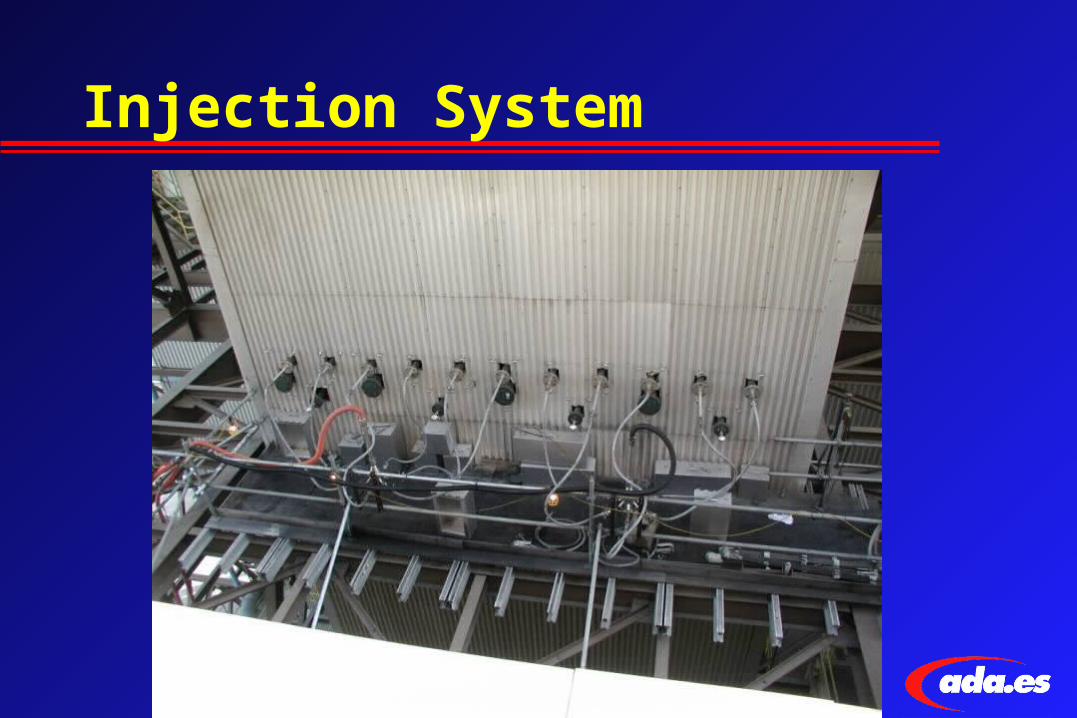
Powdered Activated Carbon Injection System
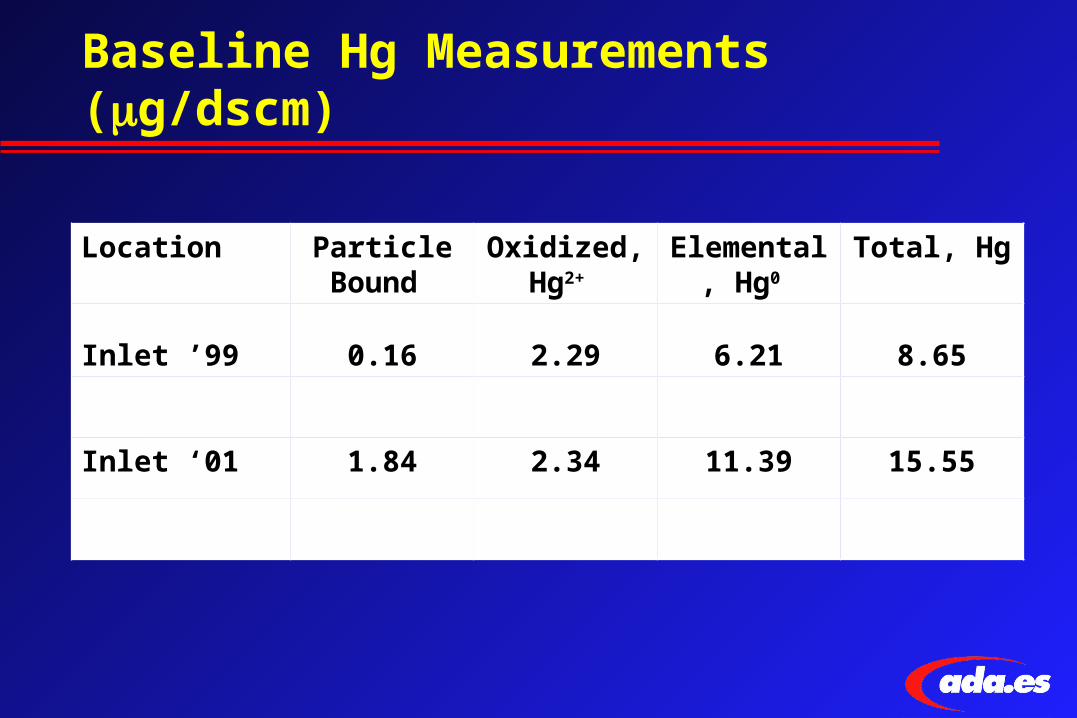
Baseline Hg Measurements (mg/dscm)
Location Particle Bound
Oxidized, Hg2+
Elemental, Hg0
Total, Hg
Inlet ’99 0.16 2.29 6.21 8.65
Inlet ‘01 1.84 2.34 11.39 15.55
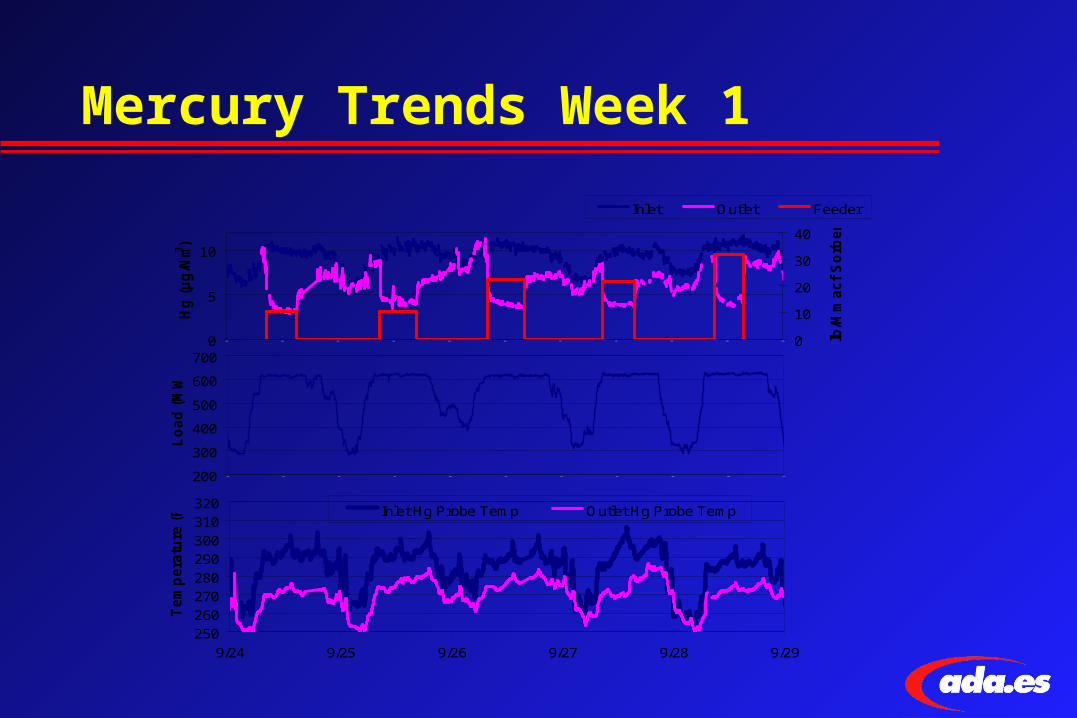
Mercury Trends Week 1
0
5
10
9/24 9/24 9/25 9/25 9/26 9/26 9/27 9/27 9/28 9/28 9/29
Hg
(µ
g/N
m3)
0
10
20
30
40
lb/M
macf
So
rbe
nt
Inlet Outlet Feeder
200
300
400
500
600
700
9/24 9/24 9/25 9/25 9/26 9/26 9/27 9/27 9/28 9/28 9/29
Lo
ad
(M
W)
250260
270280
290300
310320
9/24 9/25 9/26 9/27 9/28 9/29
Tem
pera
ture
(F
) Inlet Hg Probe Temp Outlet Hg Probe Temp
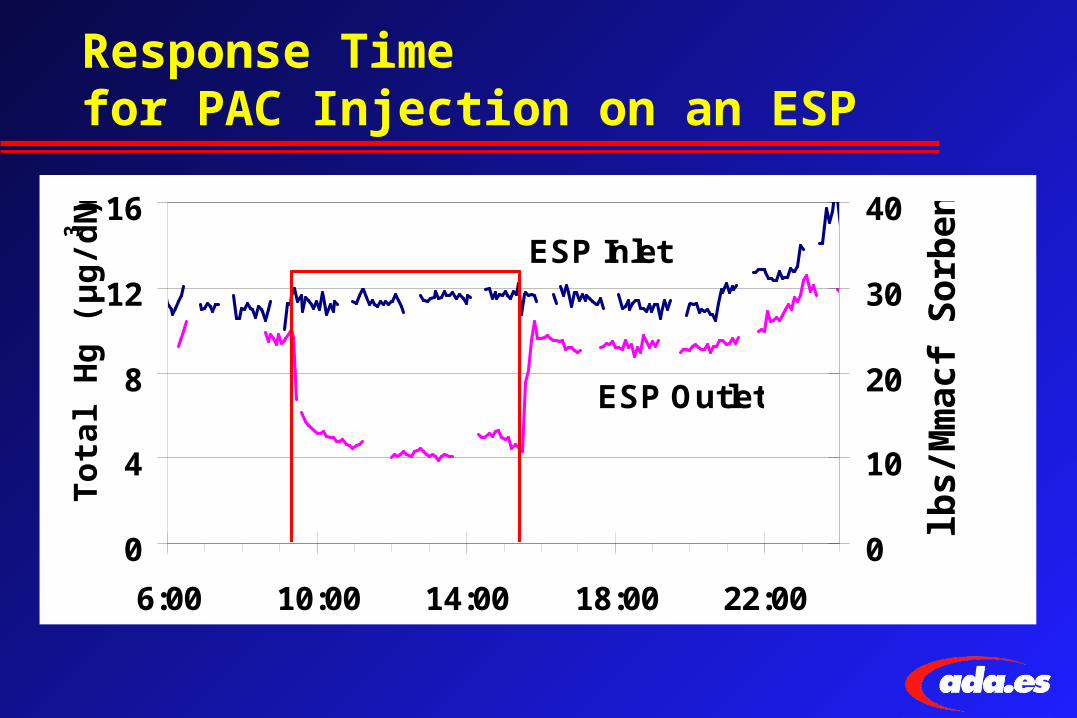
Response Time for PAC Injection on an ESP
0
4
8
12
16
6:00 10:00 14:00 18:00 22:00
Tota
l H
g (
µg
/dN
m3 )
0
10
20
30
40
lbs/
Mm
acf
So
rben
t
ESP Inlet
ESP Outlet
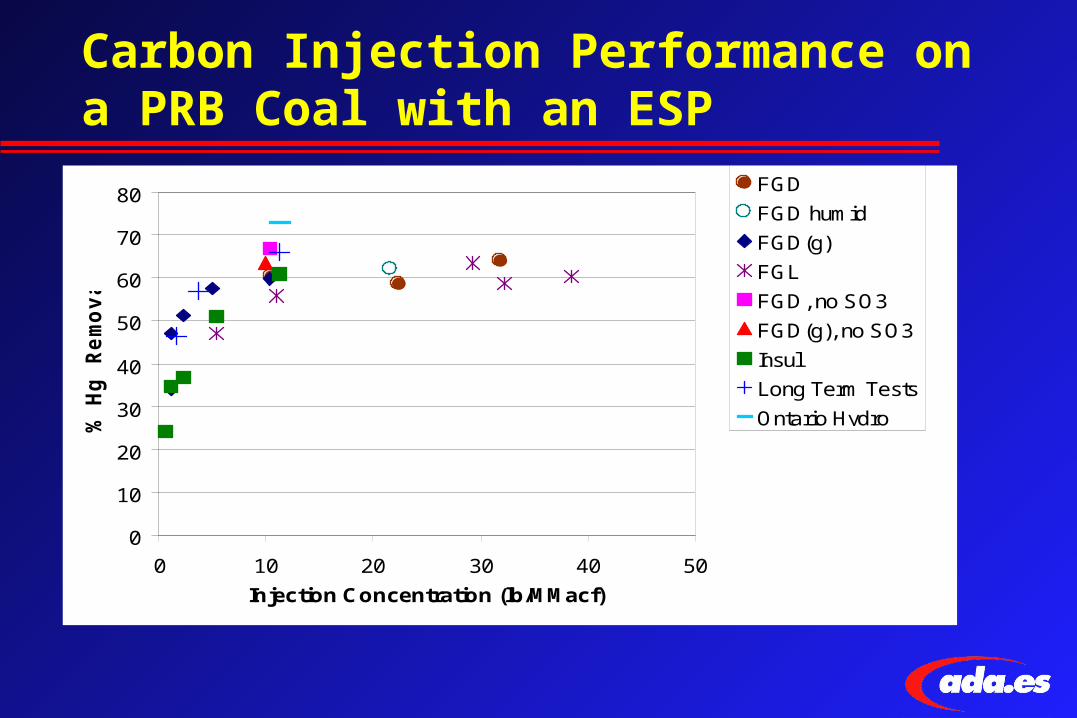
Carbon Injection Performance on a PRB Coal with an ESP
0
10
20
30
40
50
60
70
80
0 10 20 30 40 50
Injection Concentration (lb/MMacf)
% H
g R
em
ov
al
FGD
FGD humid
FGD(g)
FGL
FGD, no SO3
FGD(g), no SO3
Insul
Long Term Tests
Ontario Hydro
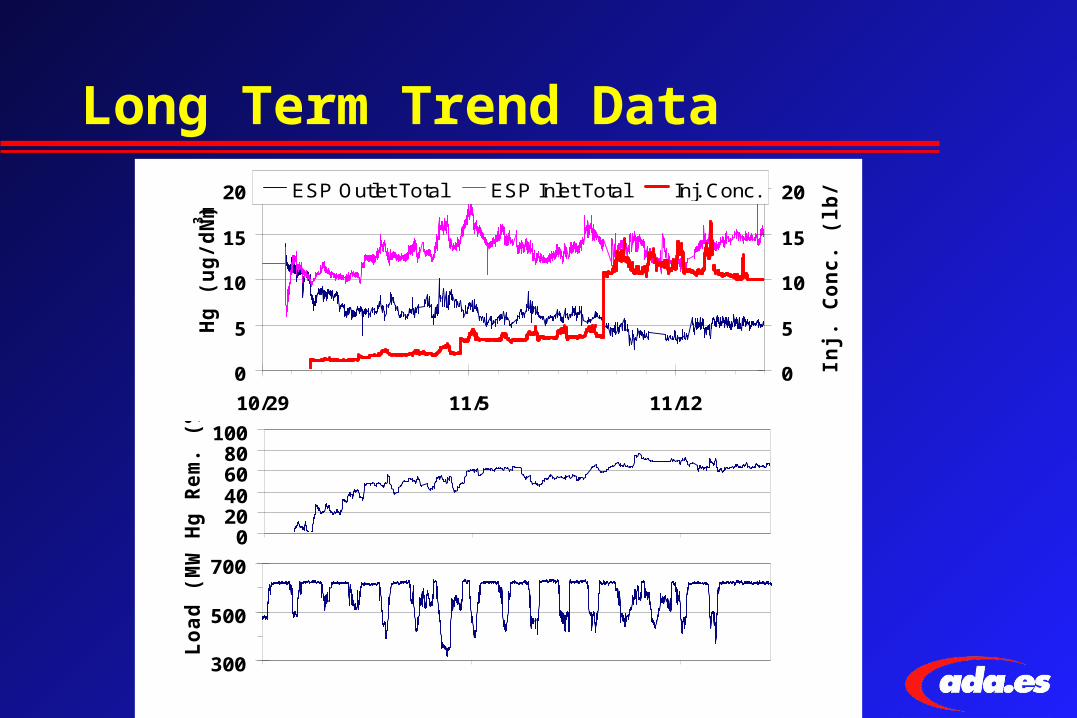
Long Term Trend Data
0
5
10
15
20
10/29 11/5 11/12
Hg
(u
g/d
Nm3
)
0
5
10
15
20
Inj.
Co
nc
. (l
b/M
Ma
cf)ESP Outlet Total ESP Inlet Total Inj. Conc.
020406080
100
10/29/01 11/5/01 11/12/01
Hg
Re
m.
(%)
300
500
700
10/29/01 11/5/01 11/12/01
Lo
ad
(M
W)
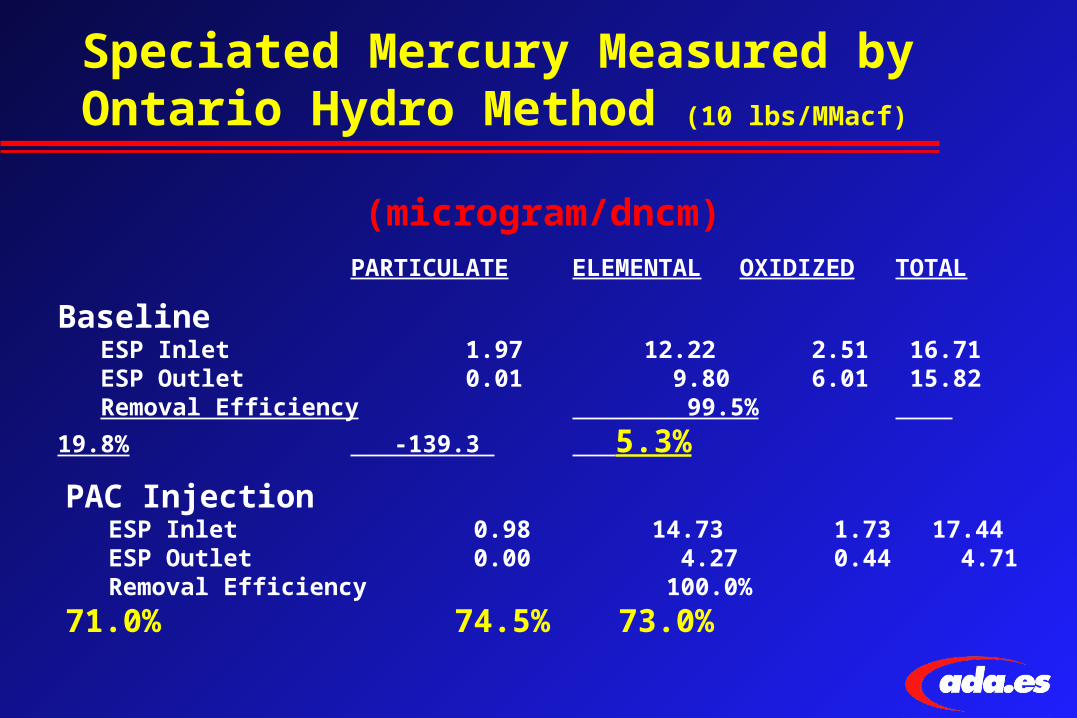
Speciated Mercury Measured by Ontario Hydro Method (10 lbs/MMacf)
PARTICULATE ELEMENTAL OXIDIZED TOTAL
Baseline ESP Inlet 1.97 12.22 2.51 16.71 ESP Outlet 0.01 9.80 6.01 15.82
Removal Efficiency 99.5% 19.8% -139.3 5.3%
(microgram/dncm)
PAC Injection ESP Inlet 0.98 14.73 1.73 17.44 ESP Outlet 0.00 4.27 0.44 4.71
Removal Efficiency 100.0% 71.0% 74.5% 73.0%
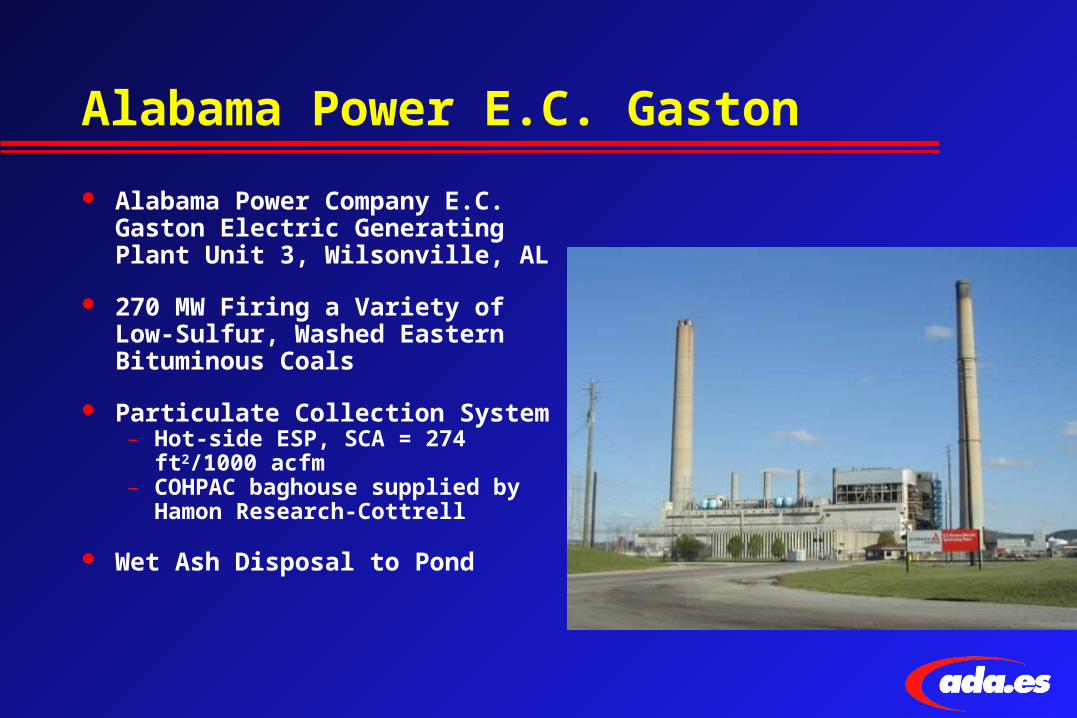
Alabama Power E.C. Gaston
Alabama Power Company E.C. Gaston Electric Generating Plant Unit 3, Wilsonville, AL
270 MW Firing a Variety of Low-Sulfur, Washed Eastern Bituminous Coals
Particulate Collection System– Hot-side ESP, SCA = 274 ft2/1000
acfm– COHPAC baghouse supplied by
Hamon Research-Cottrell
Wet Ash Disposal to Pond
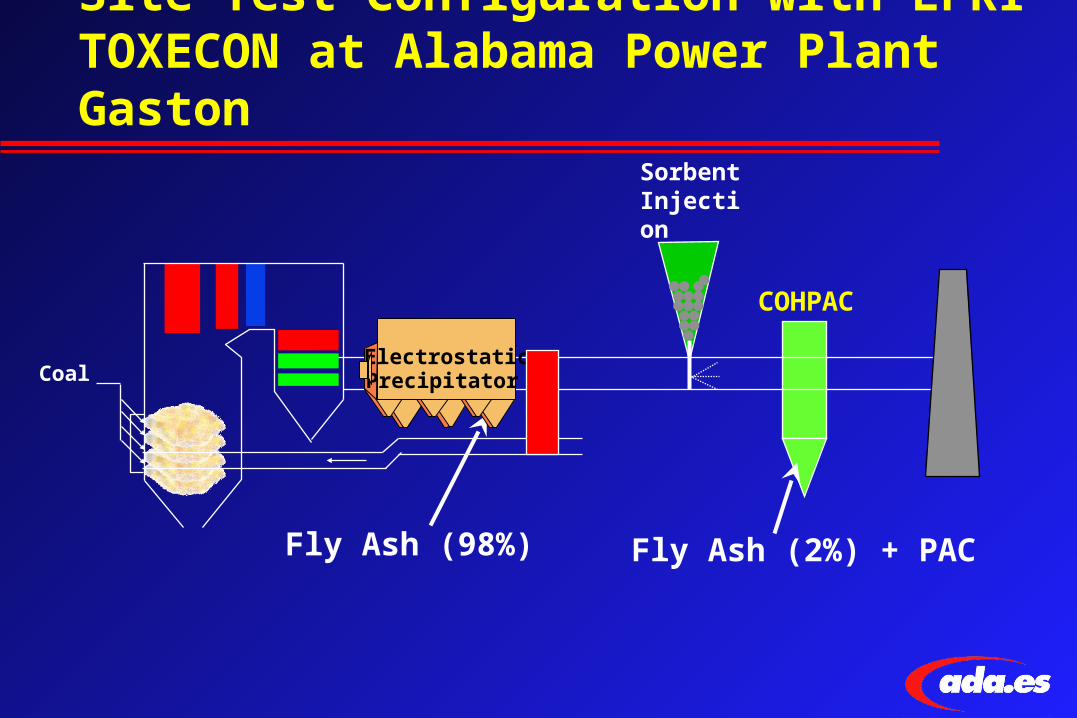
Site Test Configuration with EPRI TOXECON at Alabama Power Plant Gaston
Sorbent Injection
COHPAC
Fly Ash (2%) + PAC
Coal
Fly Ash (98%)
ElectrostaticPrecipitator
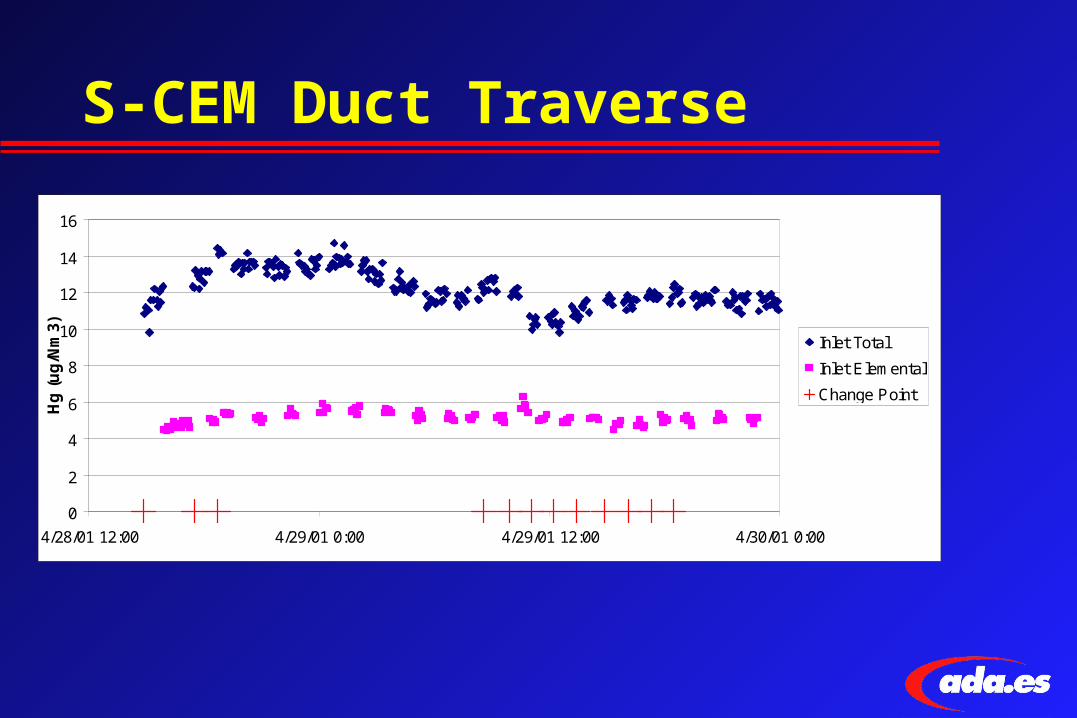
S-CEM Duct Traverse
0
2
4
6
8
10
12
14
16
4/28/01 12:00 4/29/01 0:00 4/29/01 12:00 4/30/01 0:00
Hg
(u
g/N
m3)
Inlet Total
Inlet Elemental
Change Point
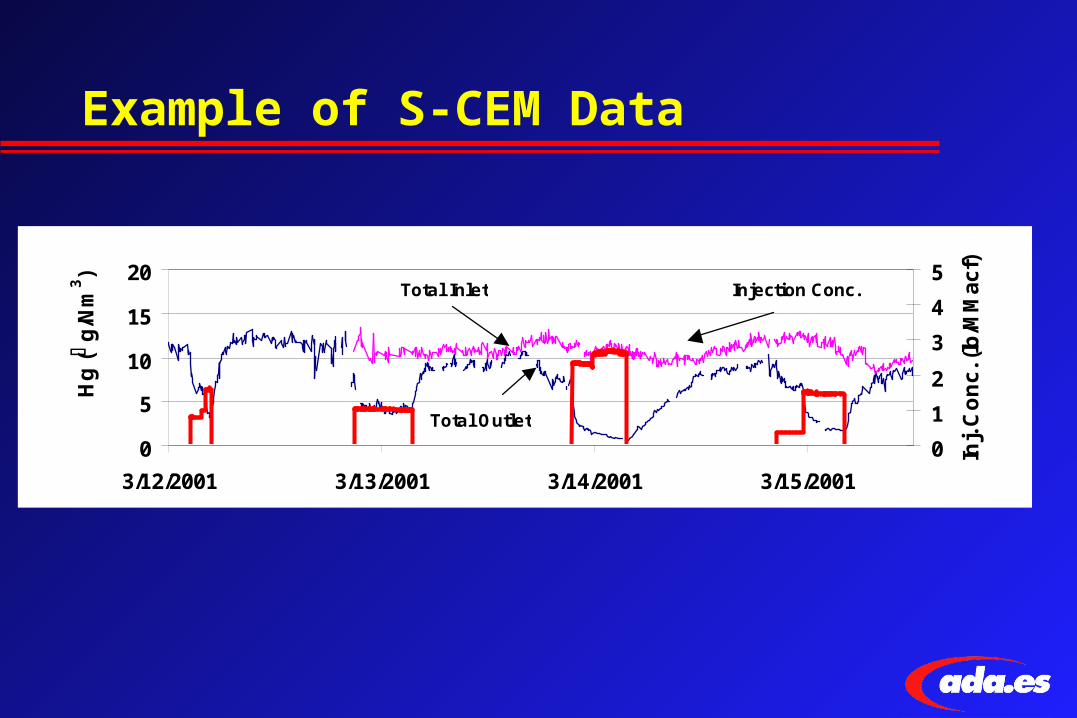
Example of S-CEM Data
0
5
10
15
20
3/12/2001 3/13/2001 3/14/2001 3/15/2001
Hg
(g
/Nm
3 )
0
1
2
3
4
5
Inj.
Co
nc
. (lb
/MM
ac
f)
Total Inlet
Total Outlet
Injection Conc.
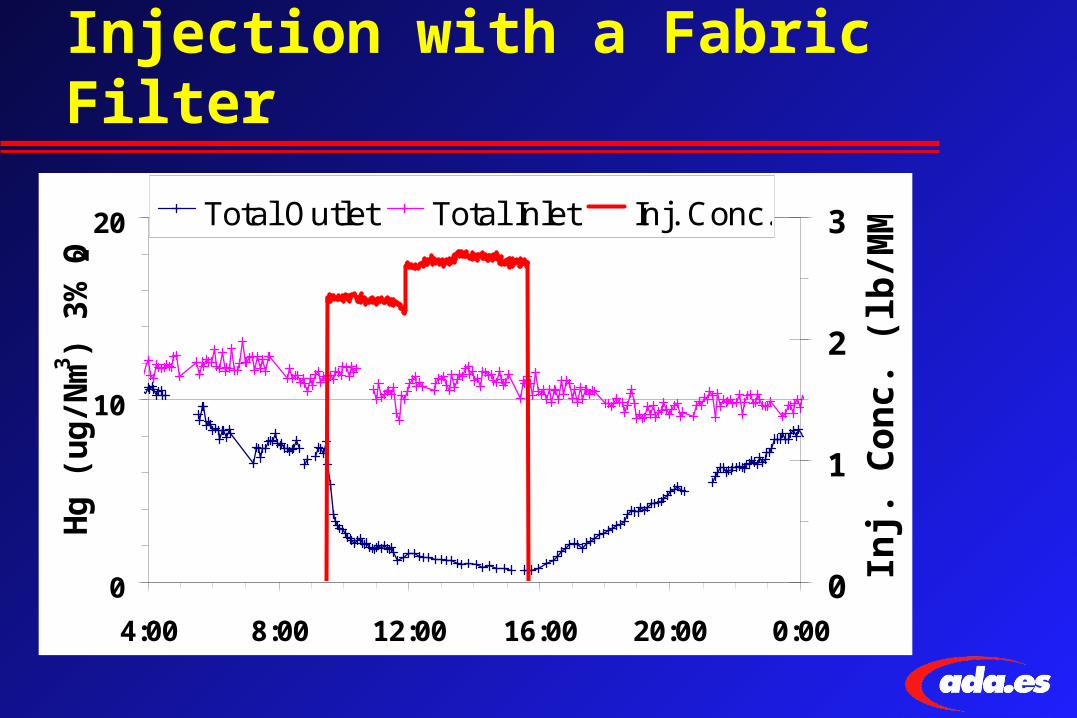
Response Time of PAC Injection with a Fabric Filter
0
10
20
4:00 8:00 12:00 16:00 20:00 0:00
Hg
(u
g/N
m3)
3% O
2
0
1
2
3
Inj.
Co
nc.
(lb
/MM
acf)
Total Outlet Total Inlet Inj. Conc.
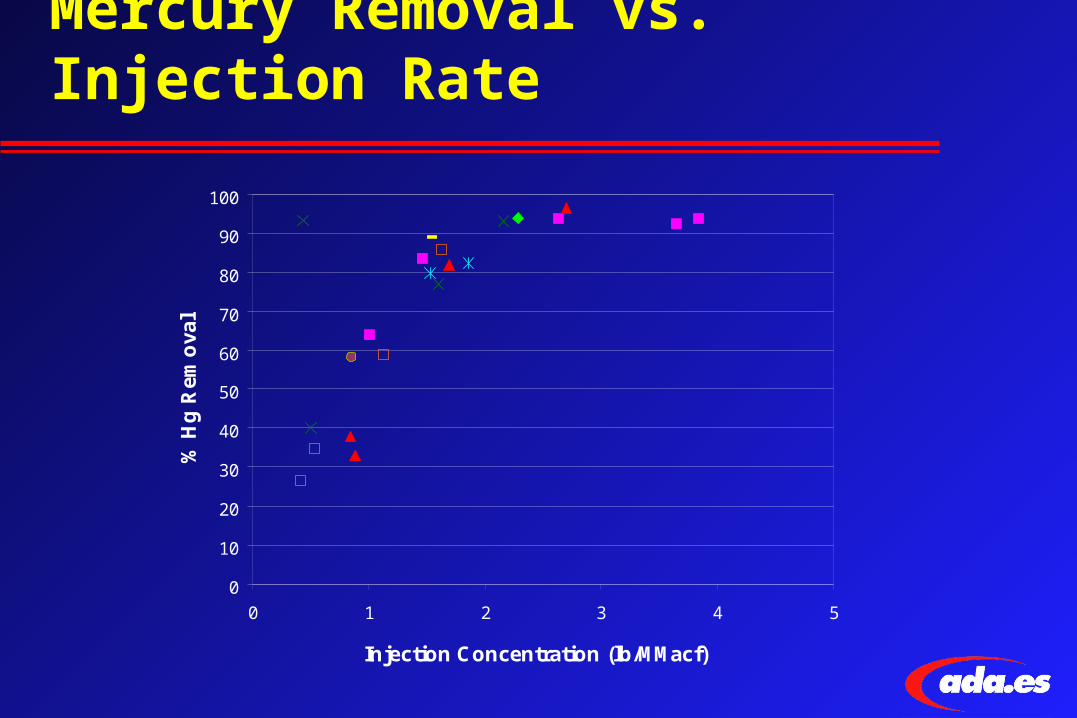
Mercury Removal vs. Injection Rate
0
10
20
30
40
50
60
70
80
90
100
0 1 2 3 4 5
Injection Concentration (lb/MMacf)
% H
g R
emo
val
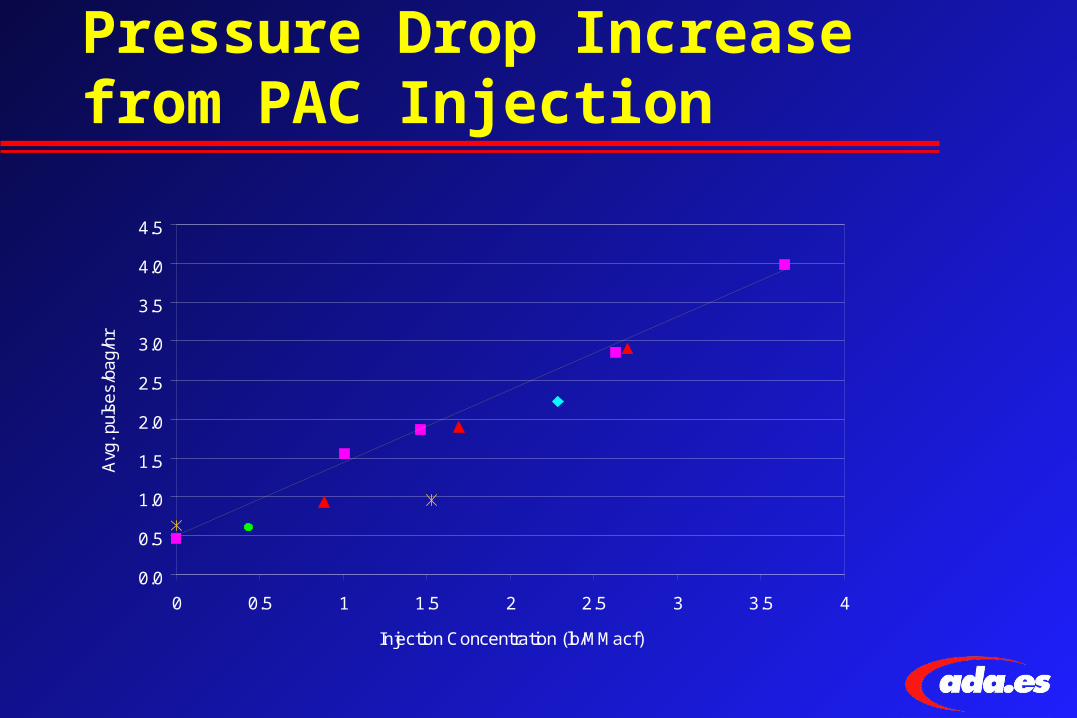
Pressure Drop Increase from PAC Injection
0.0
0.5
1.0
1.5
2.0
2.5
3.0
3.5
4.0
4.5
0 0.5 1 1.5 2 2.5 3 3.5 4
Injection Concentration (lb/MMacf)
Avg
. pul
ses/
bag/
hr
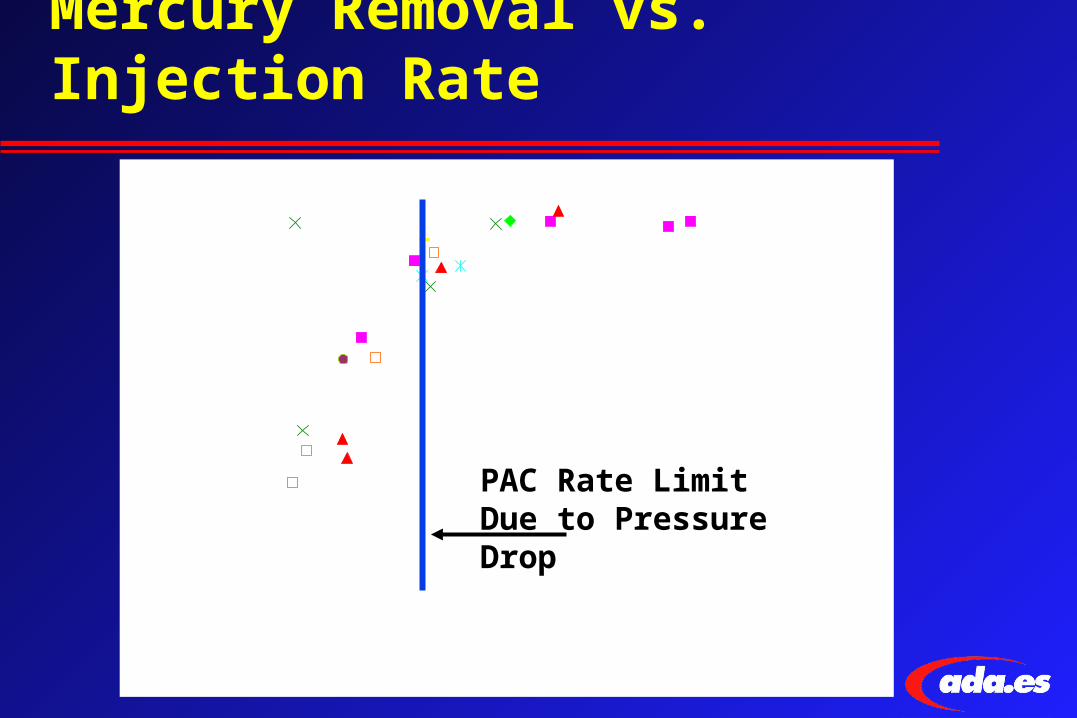
Mercury Removal vs. Injection Rate
0
10
20
30
40
50
60
70
80
90
100
0 1 2 3 4 5
Injection Concentration (lb/MMacf)
% H
g R
emo
val
PAC Rate Limit Due to Pressure Drop
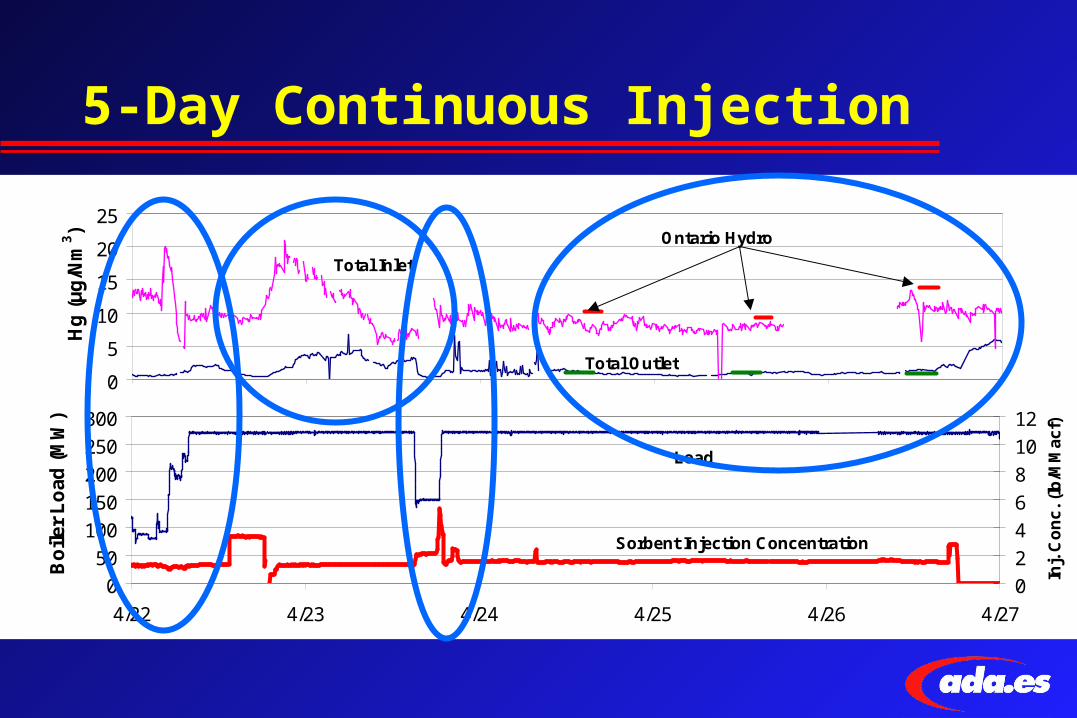
5-Day Continuous Injection
0
5
10
15
20
25
4/22 4/23 4/24 4/25 4/26 4/27
Hg
(µ
g/N
m3 )
Total Inlet
Total Outlet
Ontario Hydro
0
50
100
150
200
250
300
4/22 4/23 4/24 4/25 4/26 4/27
Bo
iler
Lo
ad (
MW
)
0
2
4
6
8
10
12
Inj.
Co
nc
. (l
b/M
Mac
f)
Load
Sorbent Injection Concentration
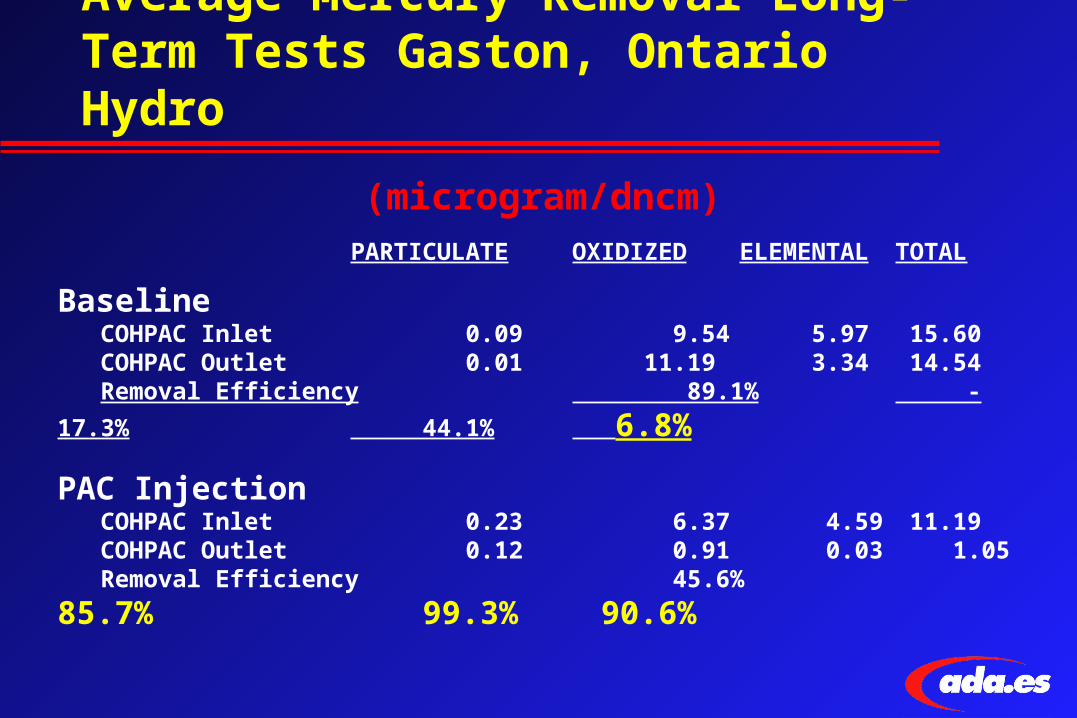
Average Mercury Removal Long-Term Tests Gaston, Ontario Hydro
(microgram/dncm)PARTICULATE OXIDIZED ELEMENTAL TOTAL
Baseline COHPAC Inlet 0.09 9.54 5.97 15.60 COHPAC Outlet 0.01 11.19 3.34 14.54
Removal Efficiency 89.1% -17.3% 44.1% 6.8%
PAC Injection COHPAC Inlet 0.23 6.37 4.59 11.19 COHPAC Outlet 0.12 0.91 0.03 1.05
Removal Efficiency 45.6% 85.7% 99.3% 90.6%
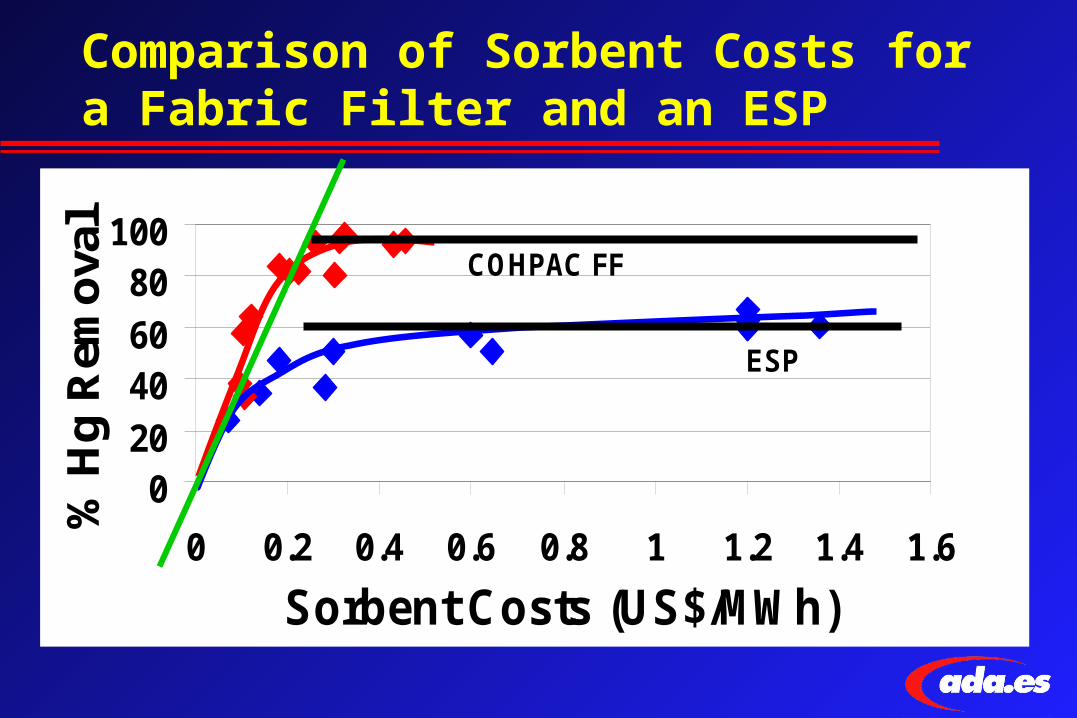
Comparison of Sorbent Costs for a Fabric Filter and an ESP
020406080
100
0 0.2 0.4 0.6 0.8 1 1.2 1.4 1.6
Sorbent Costs (US$/MWh)
% H
g R
emo
val
ESP
COHPAC FF
Conclusions (PAC General) PAC injection can effectively capture elemental and oxidized
mercury from both bituminous and subbituminous coals
Additional field tests and long-term demonstrations are necessary to continue to mature the technology
Fabric filters provide better contact between the sorbent and mercury than ESPs resulting in higher removal levels at lower sorbent costs
New COHPAC FF’s will have to be designed to handle higher loadings of PAC to insure high (>90%) mercury removal
Conventional FF’s should not require any modifications for PAC
Conclusions (Response to Concentration Variations)
Response times to changes in inlet concentrations:– Feedback data from outlet CEMs—tens of minutes
– Impact of changes in injection rate: tens of minutes to hours
Long averaging times will be required to recover from upsets
Injection at somewhat higher rates will make the technology more capable to handle inlet fluctuations
PAC injection lends itself to the use of feed rate parameters as a definition of Maximum Achievable Control Technology
Future Plans
Short-term testing at additional sites–PG&E Brayton Point (Bituminous coal, large ESP) 6/ 2002
–PG&E Salem Harbor (Bituminous coal, SNCR, large ESP) 9/2002
–* TBD (PRB coal, small ESP) 3/2003
–* Southern Company (Bituminous coal, small ESP) 8/ 2003
Long-term testing–*Alabama Power (Bituminous coal, COHPAC FF) 2002-2003
–*CCPI Program (PRB Coal, COHPAC FF) 2004-2006
–*CCPI Program (Bituminous Coal, COHPAC FF) 2004-2006
* Proposed
For More Information www.adaes.com
www.adaes.com/mercury.htm
– Link to other mercury related web sites
– Publications/reports
www.adaes.com/MercuryPublic.htm
– Public information on DOE/NETL Mercury Control Program
www.netl.doe.gov/products/environment/index.html DOE/NETL Website