contractor report
TRANSCRIPT

N A S A C O N T R A C T O R
R E P O R T M N co - I
= U
e r/)
4 3
'0 AFKL ' W L O L )
KIRTLAND AFB, N M E X
FACTORS AFFECTING THE PERFORMANCE OF POROUS STRUCTURES USED AS OXYGEN FUEL CELL ELECTRODES
PrePared by LOCKHEED MISSILES & SPACE COMPANY
Palo Alto, Calif. 94304
for Lewis Research Center
N A T I O N A L A E R O N A U T I C S A N D S P A C E A D M I N I S T R A T I O N W A S H I N G T O N , D . C. J U N E 1970
'. ._

u
TECH LIBRARY KAFB, NM
006'0732 1. Report No. 3. Recipient's Catalog No. 2. Government Accession No.
NASA CR-1623 4. T i t l e and Subtitle FACTORS AFFECTING THE 5. Report Date
PERFORMANCE OF POROUS STRUCTURES USED AS OXYGEN FUEL CELL ELECTRODES
June 1970 6. Performing Organization Code
7. Author(s1 8. Performing Organization Report No. J. Katan N-3E-70-1
9. Performing Organization Name and Address 10. Work Unit No.
Lockheed Palo Alto Research Laboratory
2. Sponsoring Agency Name and Address
National Aeronautics and Space Administration Washington, D. C. 20546
Contractor Report
I 14. Sponsoring Agency Code
5. Supplementary Notes
16. Abstract
Design methods are detailed for improving structures of oxygen electrodes. Prime emphasis is given to control of liquid distribution and configuration, best accomplished by using electrode structures which are well characterized. The critical role of a pendular-funicular transition state for correct internal liquid configuration is shown, together with its relation to design and performance. Experimental studies included a determination of synergistic effects with double-porosity structures and the necessib of catalyst placement toward the electrolyte side of the electrode. Gold was found to
, act suitably as an oxygen catalyst, and Teflon in the gas electrode acted as though imparting differential pressure to the system. Theoretical studies involved design recommendations for evaporating electrodes and the relation of structural parameters of porous systems. "
17. Key Words (Suggested by Author(s1) 118. Distribution Statement Fie1 celi; oxygen electroae;-porous electrode; Electrode structure; Liquid I Unclassified - unlimited distribution: Liquid configuration; Toughness; Wettability; Differential pressure: Catalyst placement .
19. Security Classif. (of this report) 22. Price* 21. No. of Pages 20. Security Classif. (of this page)
Unclassified $3.00 167 Unclassified
*For sale by the Clearinghouse for Federal Scientific and Technical Information Springfield, Virginia 22151


FOREWORD
The work described in this report was conducted under NASA contract NAS 3-11833 at the Lockheed Palo Alto Research Laboratory. Dr. R. E. Post, of'the Direct Energy Conversion Division, NASA Lewis Research Center, was the project manager.
tigator. Valuable laboratory assistance was provided by Mr. G. J. Kersels and discussions with Mr . H. F. Bauman led directly to the results in Section 7 and to important improvements in the apparatus. Useful suggestions and dis- cussions were also contributed by Dr. G. B. Adams, Dr. A. Wheeler, Mr . G. W. Allen, and Mr. G. J. Kersels. Consultants were Dr. E. A. Greens, Associate Professor of Chemical Engineering, University of California, Berkeley, and Dr. A. J. Shaler, formerly Chairman of the De- partment of Metallurgy, Pennsylvania State University.
Dr. T. Katan was the Lockheed program manager and principal inves-
The report was originally issued as Lockheed report N-3E-70-1.


CONTENTS
Section Page
4
1 SUMMARY
2 INTRODUCTION
2 . 1 Purpose and Background
2 . 2 Scope
3 EXPERIMENTAL APPARATUS AND PROCEDURE 3 . 1 Introduction
3 . 2 Apparatus
3 . 2 . 1 General Arrangement
3 . 2 . 2 Electrolytic Cell and Thermostating Bath
3 . 2 . 3 Working Electrode and Electrode Housing
3 . 2 . 4 Properties of Working Electrode Materials
3 . 2 . 5 The Reference Electrode
3 . 2 . 6 Pressure and Flow Regulation
3 . 2 . 7 Counter Electrode
3 . 2 . 8 Monitoring the Electrode Response
3 . 2 . 9 Solutions
3 . 3 Procedure
3 . 3 . 1 Performing an Experiment
3 . 3 . 2 Catalysis Treatments
EXPERIMENTAL RESULTS AND DISCUSSION
4 . 1 Preliminary Experiments
4 . 1 . 1 Comparison With Pas t Work
4 . 1 . 2 Pressure Variation With Electroformed Meshes
4 . 1 . 3 Flow-by Variation
4 . 2 Effect of Differential Pressure
4 . 3 Effect of Electrode Thickness 4.4 Effect of Sphere Size and Pore Diameter
1
4
4
5
7
7
9
9
9
13
21
33
33
34
34
35
35
35
36
39
40
40
40
47
47
55
58
V

Section
4 . 5
4 . 6
4 . 7
4 . 8
4 . 9
4 . 1 0
4 . 1 1
4 . 1 2
4 . 1 3
4.14
Double-Porosity Structures
Triple-Porosity Structures
Effect of Platinum Loading on Silver Spheres
Catalyst Placement in the Electrode
Gold a s an Oxygen Catalyst
Nickel a s a Substrate Material for Platinum
The Effect of Teflon Loading
Bonding of Silver in the Electrode
Electrode Response With Time
Summary and Conclusions
5 PENDULAR-FUNICULAR TRANSITION STATE THEORY
5 . 1 Introduction
5 . 2 Theory
5 . 3 Correlation With Experiment
5 . 4 Summary
6 EFFECTS O F STRUCTURE DURING EVAPORATION
6 . 1 The Phenomena of Bubbling and Displaced Regions, and
6 . 2 Design Methods for Evaporating Electrodes
6 . 3 Experimental Evidence for Evaporation Effects
6 . 4 Summary
Electrode Design
7 RELATING STRUCTURAL PARAMETERS O F POROUS MEDIA
7 . 1 The Idealized Model
7 . 2 Analyses of Specific Systems
7 . 3 Discussion
7 . 4 Conclusions
7 . 5 Nomenclature
8 SOME ELECTRODE RECOMMENDATIONS
Appendix
A CALCULATION O F PERIMETER AND CROSS-SECTIONAL AREA O F CLOSE-PACKED ARRAYS O F SPHERES
REFERENCES
Page
67
73
77
85
88
94
94
100
102
103
104
104
107
111
114
115
116
124
129
131
132
133
135
136
140
140 141
145
153
vi

ILLUSTRATIONS
Figure Page
1
7
8
9
10
11
12
13
14
15
16
17
1 8
19
20
21
Schematic Representation of Arrangement and Operating Principle of the Working Electrode 8
Arrangement of the Experimental Apparatus and Equipment
Schematic Diagram of Apparatus for Oxygen Electrode Study
Diagram of Electrical Circuit
Electrolytic Cell in Operation in Thermostated Bath
Sketch of Working Electrode With Electrode Housing and Reference Electrode in Electrolytic Cell
Parts of the Working Electrode
Reference Electrode and Working Electrode With Housing Before Assembly
Assembled Working Electrode and Reference Cell Ready for Insertion in Electrolytic Cell
Silver Electroformed Mesh, 1000 LPI, Smooth Side
Silver Electroformed Mesh, 2000 LPI, Smooth Side
Silver Electroformed Mesh, 2000 LPI, Rough Side
10
11
12 14
15
16
1 7
18
23 24
24 Silver Spheres, 48-1.1 Average Diameter 25
Silver Spheres, 38-1.1 Average Diameter 25
Silver Spheres, 86-p Average Diameter 26
Silver Spheres, 54-1.1 Average Diameter 26
Cross Section of Silver Sphere on Electroformed Mesh 28
Cross Section of Double-Porosity Electrode 31
Cross Section of Silver Spheres, 156-p Average Diameter 32
2000 LPI Silver Electroformed Mesh as an Oxygen Electrode 41
Comparison of Past and Present Results With Silver Sphere Bed Oxygen Electroue 42
v i i

Figure
22
23
24
25
26
27
28
29
30
3 1
32
33
34
35
36
37
38
39
40
4 1
T-ypical Behavior of Silver Electroformed Meshes as Oxygen Electrodes Under Cathodic Load
Effect of Reducing Applied Oxygen Pressure on Oxygen Electrode Performance
Appearance of an Overshoot After Flooding 1000 LPI Silver Mesh
Typical Current-Potential Relation Obtained for One Set of Conditions
Effect of Differential Pressure Variation on Silver Sphere Bed Electrode
Hysteresis When Differential Pressure Is Changed
Improvement in Electrode Performance as Electrode Thickness Is Increased
Effect of Thickness Increase of 156-p Silver Sphere Bed
Effect of Electrode Thickness on Current Density for Various Sphere Sizes
Effect of Electrode Thickness of Electrode Potential for Various Sphere Sizes
Page
43
46
48
51
52
53
56
56
60
60
Isopotential and Constant Current Curves for Different Thicknesses of 86-p Sphere Bed
Isopotential and Constant Current Curves for Different Thicknesses of 54-p Sphere Bed
Isopotential and Constant Current Curves for Different Thicknesses of 37-1.1 Sphere Bed
Constant Current Curve for Different Thicknesses of 14-p Silver Sphere Bed
Comparison of Single- and Double-Porosity Electrodes a s Differ- ential Pressure Is Changed
Effect of Pressure Variation for Double-Porosity Electrode With Two Fine Layers
Performance of Built-up Inverted Double-Porosity Electrodes
Performance of Triple-Porosity Electrode Structures
Change in Electrode Potential After Layers Have Been Added for Triple-Porosity Structure
Silver Sphere Bed With No Platinum in Coarse Layer
61
62
63
64
68
70
72
75
75
79
viii

Figure Page
42 Silver Sphere Bed With 10 mg of Platinum in Coarse Layer 80
43 Silver Sphere Bed With 3 mg of Platinum in Coarse Layer 81 44 Silver Sphere Bed With 1 mg of Platinum in Coarse Layer 82
45 Comparison of Performances With Three Types of Catalyst Distribution at 500 mV Versus Hydrogen Reference in Same Solution 87
46 Performance of a Silver Oxygen Electrode With Platinum Catalyst at the Electrolyte Side 89
Distributed at the Gas Side 90
48 Silver Sphere Bed With 3 mg of Platinum in Coarse Layer 91
Catalyst 92
Principal Catalysts 93
47 Performance of a Silver Oxygen Electrode With Platinum Catalyst
49 Performance of Oxygen Electrode With Gold as the Principal
50 Performance of Oxygen Electrode With Gold and Silver as the
51 Performance of Silver Oxygen Electrode With Only a Fine Layer Present 95
52 Performance of an Oxygen Electrode With a Platinum Catalyzed Nickel Coarse Layer 96
53 Performance of Platinum Catalyzed Silver Electrode With 17 mg Teflon Powder 98
54 Performance of Platinum Catalyzed Silver Electrode With 4 x l oe3 mg Teflon Powder 99
55 Evidence for Interconnection of Silver Spheres After Electrode Operation 1 0 1
56 Drawing of Pendular and Funicular Saturation Regime in the Case of an Idealized Porous Medium Consisting of Packed Spheres 105
57 Distribution of Liquid at First Stage of Coalescence 106
58 Distribution of Liquid After Final Stage of Coalescence 1 0 6
59 Perspective Drawing Showing Shape of Continuous Gas Space at First Stage of Coalescence, With Development of Final Stage Shown at One Neck 109
60 Diagram Showing Annular Liquid Body Between Two Spheres 109
61 Dependence of Internal Bulk Liquid Configuration on Differential Pressure for Ideal Sphere Bed 110
ix

Figure Page
62
63
64
65
66
67
68
69
70
71
7 2
73
74
75
76
7 7
‘78
79
Surface Coverage by Internal Bulk Liquid in Ideal Sphere Bed 112
Schematic Representation of a Double-Porosity Electrode With a Microporous Teflon Film 117
Bubbling Caused by Evaporation 119
Regions Displaced by Evaporation 121
Schematic Reprecentation of Teflon-Impregnated Electrode Having Fibers of Teflon in the Porous Mass 122
Evaporation Effect With Porous Teflon Fiber Structure 123
Circulation of Feed Gas With Evaporation 125
Comparison of the Effective Poiseuille Diffusion Coefficient and the Pore Diffusion Coefficient Considering Onset of Knudsen Flow 127
Estimations of Developed Head for Various Pore Diameters Using Generated-Convective-Flow Approach 128
Effect of Applied Head on Pumping Rate 130
Unit Section of Electrode Matrix With Four Fibers Showing Location and Size of Pore 134
Variation of Ratio of Pore Radius to Sphere Radius With Changes in Tortuosity Factor and Fractional Void Volume 138
Relation of Tortuosity to Porosity at Fixed Pore Radius and Sphere Radius Ratios 138
Change of Pore Size With Changes in Tortuosity Factor for Fixed Fiber Size and Porosity 139
Change in Specific Surface Area With Fiber Radius at Three Fractional Void Volumes 139
Close-Packed Arrays of Spheres 146
Perimeter per Unit Area of Array of Spheres Lying on a Screen 150
Cross-Sectional Area of Metal per Unit Area of Array of Spheres Lying on a Screen 152
X

TABLES
Table Page
1 Results of Microscopic Measurements of Sphere Diameters 22
2 Some Properties of the Tested Powder Consisting of Silver
3 Estimated Properties of the Three Silver Electroformed Meshes 44 4 Behavior of Inverted Double-Porosity Electrode for Different
Spheres 30
Coarse Layer Thicknesses 71
xi

Section 1
SUMMARY
This report presents design methods for improving structures of oxygen electrodes
operating in 13.5 M KOH a t 95°C. Experimental and theoretical studies are described
which are concerned with structural parameters and operating conditions required for
maximum performance. Tests on catalyst loading and distribution and on Teflon
loading a r e included.
High performance of film-type oxygen cathodes was found to depend on the formation
of continuous networks of gas and liquid in the porous medium. Disruption of either
network, by excessive flooding o r by rupture of liquid filaments at high differential
pressures, causes deterioration in electrode performance. Prime emphasis is given
to the control of liquid distribution and configuration, best accomplished by using
electrode structures which a re well characterized (Section 4).
The existence of a pendular-funicular transition state is demonstrated, and the critical
role of this transition state for correct internal liquid configuration is shown,together
with its relation to design and performance of oxygen gas electrodes (Section 5). The
pendular-funicular transition state is defined as that state in which bulk electrolyte
inside a porous electrode just forms continuous interconnected liquid paths on the
pore walls without flooding the pores, leaving some wall areas still unflooded by
electrolyte which a r e exposed to the continuous network of gas channels through the
electrode. Before these continuous electrolyte paths are formed, a pendular state exists, and afterward a funicular state exists. With a balanced configuration near this transition state, the unflooded areas (where the important electrochemical
processes occur) are adjacent to good ionically conducting paths of electrolyte, have
short transport distances to these electrolyte paths, and retain a maximum of such
area accessible to the gas channels.
1
I

Experimental studies utilized the well-known properties of sphere beds which were
built up as oxygen electrodes in a unique apparatus (Section 3). In these studies,
current densities for single-porosity electrodes having 156-1.1 diameter silver spheres
were 27 mA cm at 500 mV versus the H reference electrode in the same solution 2 when the differential pressure across the built-up electrode was 25 cm of water (2450 N/m ). When the differential pressure was varied and increased to 42 cm of
water (4100 N/m ), a maximum in current density was obtained, 50 mA cm-2 at 500 mV. It was found that the effect of sphere diameter (effective pore diameter)
and electrode thickness depended on the differential pressure used and that an optimum
differential pressure exists at which performance is maximized (sections 4.2, 4.3,
and 4.4). Addition of a fine layer of si lver spheres, 14p in diameter, at the electrolyte
side of the 156-p-diameter silver sphere bed caused a general improvement in per-
formance in the differential pressure range studied, 5 to 100 cm of water (490 to
9800 N/m ), and an increase in the maximum current density was observed, 63 mA
cm at 500 mV. Double-porosity electrodes performed better than predicted because
of an unexpected synergistic effect (section 4.5). The best performance was obtained
with an all-silver double-porosity electrode having a coarse layer of 54-p spheres
and a fine layer of 14-p spheres at the electrolyte side. The optimum differential
pressure was not attained with this electrode at the maximum value tested, 90 cm of
water (8900 N/m ), when the observed current density was 125 mA cm-2 at 500 mV
(section 4.5).
-2
2
2
2
-2
2
Treatment of the coarse layer of the double-porosity electrode consisting of 156-p-
and 14-p-diameter silver spheres with platinum catalyst at 0 .8 mg/cm2 of facial
electrode area generally improved performance for this structure, and a maximum
of 66 mA cm at 500 mV was observed. However, treatment of the coarse layer
with more platinum, 8 mg/cm2, caused a deterioration in performance for differential
pressures less than 57 cm of water (5600 N/m ) because of uncontrolled flooding
induced by the capillarity of these excessive amounts of platinum for the pressure
range studied (section 4.7). The addition of powdered Teflon at only 3.5 x
mg/cm2 of facial electrode area to the coarse layer of this last electrode improved
its performance at a differential pressure of 42 cm of water (4100 N/m ) from 46 to
79 mA cm at 500 mV. Teflon effectively acts as though it imparts a differential
pressure to the electrode (section 4.11).
-2
2
2
-2
2

Generalizations could be made for triple-porosity structures to explain the experi-
mental results with these structures, and in catalyst distribution experiments it was
found that a catalyst is most effective when placed at the electrolyte side of the
electrode. In other experiments, it was determined that platinized nickel structures
were comparable in behavior to platinized silver structures , although slightly poorer,
and that gold could act as a suitable oxygen catalyst (Section 4).
In theoretical analyses, the influence of structure on performance w a s indicated during
gross evaporation from the electrode, when unusual internal pressures may develop
(Section 6), and the structural parameters were related for guidance in design
(Section 7).
Simple electrode structures are recommended as oxygen electrodes based on the results
of this study (Section 8).
The appendix provides a calculation of the cross-sectional area and perimeter of a
sphere bed in a closest packing array.
3

Section 2
INTRODUCTION
2 . 1 PURPOSE AND BACKGROUND
Goals accomplished under this contract were (1) experimental analyses for determining
structural parameters of practical importance in optimizing oxygen electrodes and
(2) theoretical evaluations of structural parameters in order to help formulate
principles of oxygen electrode design. The ultimate aim of this fuel-cell research
is to devise from these principles a systematic method for design of optimum fuel-
cell electrodes for specified applications. The immediate objective is to provide
information to improve the operating characteristics of the oxygen electrode.
The Lewis Research Center, National Aeronautics and Space Administration,
authorized the program which was proposed in LMSC-DO80258 and which was put
into effect in July 1968. At the time of authorization, little was known of the mode of
operation of porous oxygen gas electrode structures. For guidance in the design,
fabrication, and operation of oxygen electrodes, an understanding was required of
the complex processes occurring in porous oxygen electrode structures which often
even defy description. The research and development work was conducted in the
Electrochemistry Laboratory of the LMSC Materials Sciences Laboratory.
This final report presents the results of the complete program. Essentially, the
report consists of two parts: the f i rs t two sections in the body of the report are
concerned with detailed experimental analyses of the oxygen electrode, and the last
sections deal with the theoretical analyses of the mode of operation and structure of
oxygen electrodes.
4

” ” . . . . . . . . .. .. . . . .
2 .2 SCOPE
In the study of porous gas electrodes, the complexity of practical systems frequently
prevents simple interpretation of effects caused by changes in pore size, electrode
thickness, and pressure difference across the electrode. In this study, some of
these effects have been examined with electrodes made of beds of small si lver spheres
of uniform size resting on a fine silver mesh. The use of a sphere bed enables the
properties of a complex porous matrix to be approached while having the advantage
of a system that can be specified and characterized for both the partially or the
completely infiltrated conditions (Refs. 1 - 7 ) and the different packing configurations
(e. g. , see Refs. 8 - 11).
In this report, descriptions and interpretations are given of measurements taken of
the performance of oxygen electrodes consisting of such beds of silver spheres
operating in 1 3 . 5 M KOH at 95°C. Spheres in sizes from 14 to 156 ,u in diameter
and electrode thicknesses from about 200 to 2000 1-1 were used. In these electrodes,
the electrochemical reaction is believed to occur beneath a film coating the walls of
the gas-filled pores between the spheres.
Experimental studies were at f i rs t confined to all-silver electrodes to determine the
optimum electrode thickness and the effect of sphere diameter (effective pore diameter)
The finding that differential pressure had a strong influence on these two parameters
complicated the work but enabled a better understanding of the results. In accord with
the planned program, double- and triple-porosity structures were also examined with
all- silver electrodes. Experimental results and apparatus are described in some
detail in the hope that this w i l l prompt suggestions or encourage other work.
Assorted experiments were also conducted for evaluations of platinized nickel as a catalyst, of gold as an oxygen catalyst, of Teflon loading, and of platinum loading and
distribution on silver spheres. Although results were not always conclusive, these
probe experiments provided useful information which aided in the final analyses.
5

Theoretical treatments are given in the last parts of this report. They include a
presentation of the pendular-funicular transition state theory, some design suggestions
for electrodes from which electrolyte evaporation occurs, and the relation of struc-
tural parameters to assist in design and fabrication.
6

Section 3
EXPERIMENTAL APPARATUS AND PROCEDURE
3.1 INTRODUCTION
It is the purpose of this section to describe in some detail the apparatus and procedure
used in measurements of the performance of oxygen electrodes consisting of silver
sphere beds operating in 13.5 M KOH at 95°C. Spheres were used in sizes from 14 to
156 p in diameter, and electrode thicknesses were from about 200 to 2000 p . In these
electrodes, the electrochemical reaction is believed to occur beneath a film coating
the walls of the gas-filled pores between the spheres.
Experiments were conducted in which preweighed amounts of silver spheres were
deposited to form sphere beds resting on a fine silver mesh having uniform square
holes much smaller than the sphere diameter. The’electroformed mesh was sealed
to the bottom of a tube, 1 . 2 6 cm in inside diameter, and to a silver rim which supplied
external electrical contact, as shown conceptually in Fig. 1. The spheres, added
at room temperature, were actually held in a small retaining chamber in the working
electrode housing, below the electrolyte level, to be heated to the electrolyte tempera-
ture of 95°C before being dropped onto the working electrode. The bed thickness was
increased by known increments by dropping known amounts of spheres onto the elec-
trode. In some cases, nickel spheres and platinum- or gold-coated silver spheres
were used. The determined density of the loosely packed spheres and the cross-
sectional area were used to calculate bed thickness. The deposited sphere bed was
employed as an oxygen electrode, and the performance of the electrode was determined
at different thicknesses and applied oxygen pressure.
By using different sizes of spheres, the effective pore size was changed without
appreciably changing the porosity. tfDouble-porosityft as well as single-porosity
7

BED OF SPHERICAL CONDUCTING PARTICLES
PARTICLES DROPPED ON BED TO BUILD U P ELECTRODE
APPLIED OXYGEN PRESSURE
t ELECTROLYTE LEVEL
WORKING ELECTRODE
POSITION OF INTRINSIC MENISCUS VARIED BY BALANCE OF APPLIED PRESSURE AND CAPILLARY FORCES I N PORES
ELECTROLYTE
TOCOUNTERELECTRODE
Fig. 1 Schematic Representation of Arrangement and Operating Principle of the Working Electrode

electrode structures were built up in this way and studied. Although the double-
porosity electrodes had nearly uniform porosity, the fine layer had smaller effective pores. The pressure difference across the electrode, i. e. , the differential pressure,
w a s initially adjusted to 25 cm of water head so that the silver mesh remained unflooded
on the gas side and so that no bubbling occurred. After the beds were built up, changes
were made in the differential pressure so that the relative amount of electrolyte
infiltration was changed, and the effect on electrode performance w a s observed.
Bubbling did not occur with the built-up electrodes.
:3 3
3 . 2 APPARATUS
3.2.1 General Arrangement
The apparatus required to maintain and observe the oxygen electrode consisted of the
electrolytic cell, oxygen pressure and flow regulation equipment , and monitoring
instrumentation for measuring the electrode response. The general experimental
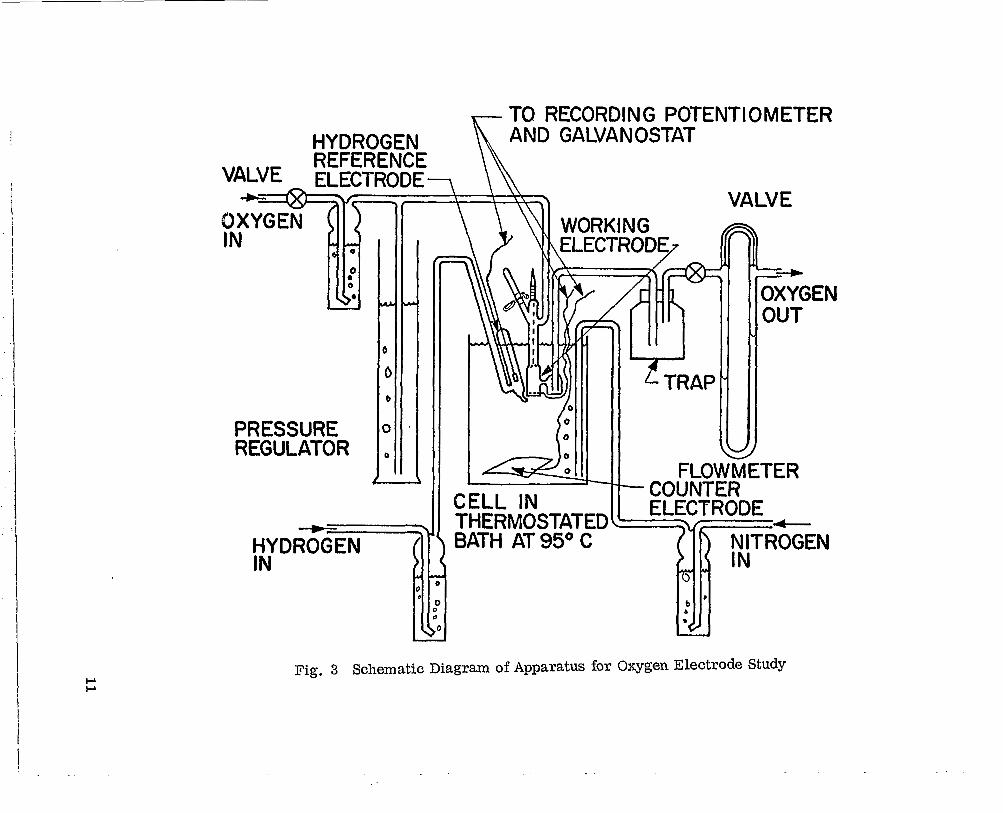
arrangement is shown in Figs. 2 , 3, and 4. In Fig. 2 is shown the arrangement of the apparatus and equipment in the laboratory, and Fig. 3 is a schematic diagram
of the apparatus with the gas flows and electrical connections. The electrical circuits
are shown in Fig. 4. It can be seen that no special or unusual equipment is required,
and the arrangement resembles the one which was reported previously for the experi- ments at room temperature and at lower KOH concentration (Refs. 12 , 13). Certain
changes were required, however , to accommodate the new set of operating conditions , 95°C and 13.5 M KOH.
3 . 2 . 2 Electrolytic Cell and Thermostating Bath
A 1-liter polypropylene bottle was used to hold the electrolyte which contained a hydrogen reference cell as well as the working and counter electrodes, as shown in Fig. 3. The wide-mouth bottle was 9 cm in diameter and 19 cm high with a 5-cm-
diameter mouth. This cylindrical bottle was placed in a thermostated water bath
maintained at 95 f 0 .2" C inside a 4-liter polypropylene beaker, shown in
9

I
Fig. 2 Arrangement of the Experimental Apparatus and Equipment
. ~. . .. . _ I
OXYGEN IN
r TO RECORDING POTENTIOMET 'ER
"' YRODE
1"
3 aTRoGEN
Fig. 3 Schematic Diagram of Apparatus for Oxygen Electrode Study

GALVANOSTAT 0
MODEL C612 ELECTRONICS MEASUREMENTO
ELECTRODE RECORDER SARGENT MODEL MR
HYDROGEN REFERENCE CELL AMMETER GREIBACH MODEL 500
COUNTER ELECTRODE
Fig. 4 Diagram of Electrical Circuit (Rubicon Potentiometer Model 2700 and Digitek DC Voltmeter Model 261-1 Used To Check Recorder)
12

Fig. 5. The bottle rested on a small aluminum table about 3 cm high which permitted
the hot water to circulate around the bottle by means of a magnetic stirring bar situated
' below the table. The electrolyte level in the bottle was 2 cm below the level of the
I external water bath, and the electrolyte was continually purged with a s t ream of i , nitrogen at about 3 cc min-l from a 1.5-mm-0. d. Teflon tube leading to and open
at the bottom of the polypropylene bottle next to the counter electrode. This nitrogen
stream furnished convective mixing and nitrogen saturation of the electrolyte and to
some extent masked the surface of the electrolyte, which was open to the air, against
carbon dioxide in the air. Evaporation loss of electrolyte during a typical experiment
was usually less than 20 cc from the 900-cc volume of the 13.5 m KOH and was found not to affect the results of the work during the data accumulation period.
Hollow polypropylene spheres, 2 cm in diameter, were floated on the water bath to
reduce evaporation losses. These Allplas floating spheres were purchased from Wire
Machinery, Inc. , Chicago, Illinois. Also, an inverted 1-liter volumetric flask, shown
in Fig. 5, was used to replace the small amount of water evaporated from the thermostated bath to accurately maintain the water level during an experiment. An immersion heater in the bath was actuated by a temperature regulator, a Precision
Scientific Co. , Chicago, Illinois, Micro-Set, connected to a Fisher Scientific Co. ,
Pittsburgh, Pennsylvania, Model 50 Unitized Bath Control. A thermometer was placed
in the hot water bath to check the setting of the temperature regulator, and data collec-
tion was never started until 1 to 2 hr after the thermostated bath attained 95°C to assure
temperature equilibration.
3.2.3 Working Electrode and Electrode Housing
The working electrode and the working electrode housing are shown in Figs. 6 through 9. The design of the working electrode can be seen in Fig. 6. The 'preweighed
silver powder is added from a Pyrex vial , 7 cm long and 7 mm 0 . d. , through a
7-mm-0. d. side arm, to the top of a conical, Pyrex trap door which is pressed
, tightly against the 10-mm-0.d. tube of the housing. The vial is attached to a
13
4

POLYPROPYLENE SPHERES TO REDUCE BATH EVAPOUTION I
'3 COUNTER LEAD
Fig. 5 Electrdiytic Cell in Operation in Thermostated Bath
14

TRAP DOOR RELEASE PLUNGER 7
VIAL FOR INTRODUCING SILVER SPHERES NICKEL BELLOWS 3"
OXYGEN FLOW IN (FROM PRESSURE REGULATOR AND WATER WASH BOTTLE)
WORKING ELECTRODE HOUSING
i 1 NSULATED CURRENT LEAD TO CATHODE
OXYGEN FLOW OUT (TO VALVE AND f FLOWMETER 1
LIQUID LEVEL
PREHEATING IN RETAINING CHAMBER
"SMALL SILVER SPHERES
'LTRAP DQBR
w . CONDENSATE TRAP
LUGGI N REFERENCE PROBE WORKING ELECTRODE
(BED OF SMALL SPHERES RESTING ON FINE MESH)
Fig. 6 Sketch of Working Electrode With Electrode Housing and Reference Electrode in Electrolytic Cell
15

i
A. E. C.
Fig. 7 Par t s of the Working Electrode. A: Die used to trim silver foil rings. B: Silver foil rings, 6 mils thick, and expanded silver metal mesh used in some reinforced electrodes. C: Pyrex glass cylinders, cut to size, for holding working electrode support, D: Work- ing electrode support ready for mounting to housing. Background: Silver spheres and capsules used to build up working electrode. Foreground: inch scale.

NICIWL HKLLOWS
1 .::
/ , ELECTRODE
Fig. 8 Reference Electrode and Working Electrode With Housing Before Assembly
17

Fig. 9 Assembled Working Electrode and Reference Cell Ready for Insertion in Electrolytic Cel l
18

neoprene tube connected to the side arm before the spheres are added. A pinchcock
is used to seal the neoprene tube and maintain the applied oxygen pressure inside the
housing when the Pyrex vials are exchanged during the buildup of the working electrode. A nickel bellows, P /N 1231 from Servometer Corp. , Clifton, New Jersey,
is sealed with Epon 828, Curing Agent Z , Shell Chemical Co. , New York, N. Y. , at
its bottom end to the top of the 10-mm-o. d. housing tube and at its top end to a hollow,
3-mm-0.d. Pyrex plunger tube which leads to and is connected to the conical trap
door below. The bellows supplies the tension needed to keep the trap door closed, and
the plunger is pushed down to compress the bellows and open the door below while
keeping the system sealed to maintain the internal oxygen pressure. After the added
silver powder is heated to the temperature of the system while the powder rests on the
trap door (i. e., after about 15 min), the trap door is opened, and the powder falls onto
the electrode below to build up a uniformly thick layer. With the downward flow of
oxygen into the housing, no powder hangup o r condensate was observed inside the housing, mainly because the entering oxygen is relatively dry. A hole in the plunger tube permits oxygen to flow through the housing by passing through the plunger tube.
The oxygen stream becomes more concentrated in water vapor from the saturated region above the electrode, and a trap collects condensate formed in the exit tube
(about 0 . 3 cc in a 4-hr period).
The silver mesh support for the working electrode is sealed to a 1.5-cm-0.d. Pyrex
tube which is attached to the 1.5-cm-0. d. Pyrex tube at the bottom of the housing
before an experiment. A carborundum glass-cutting saw is used to cut these tubes to
ensure a flush fit. The silver mesh supports with the attached Pyrex tubes were
prepared in the steps indicated in Fig. 7 as follows:
0 Silver foil, 6 mils thick, w a s cut into rectangles, stacked, and clamped. A guide hole was drilled, and this was followed by a high-speed drilling
to size.
0 The rectangles were cut roughly to size, clamped through their hole with the die shown in Fig. 7a, and the excess silver trimmed around the die to
form a ring as shown in Fig. 7b. The ring had a 1.5-cm-0. d. and a 1.25-
cm-i. d. to conform to the end of the Pyrex tube that acts as a holder.
19

0
0
0
8
0
0
Pyrex tubes, 1.5-cm-0. d . , were cut with a glass saw into 1.5-cm lengths, as shown in Fig. 7c.
Silver electroformed mesh, 2000 LPI, Ruling No. 2001, from Buckbee Mears
Co., St. Paul, Minnesota, was cut into 2- by 2-cm squares with a scissors
and with the aid of Teflon-tipped tweezers in a draught-free room.
The surface of the silver foil rings was abraded and coated with a thin layer
of freshly prepared silver epoxy, Eccobond 56C with Catalyst 11, Emerson
and Cuming, Inc. , Canton, Massachusetts.
The electroformed mesh was rested on the coated silver ring, rough side
toward the ring, and gently forced into the silver epoxy until epoxy came
through the holes in the mesh. These parts were oven cured at 66°C for
4 hr. In this way, flat electroformed mesh surfaces could be prepared.
Freshly mixed epoxy, Epon 828 with Curing Agent Z , Shell Chemical Co. , New York, N. Y . , w a s placed on the silver ring on the side opposite the mesh
and on the end of the Pyrex cylinder. The two parts were joined and left
overnight for a room-temperature cure. The seal was then oven cured at
66°C for 12 h r , and then at 110°C for 1 hr. This seal was thickened by
adding more epoxy and repeating the given curing cycle. During the sealing,
care was taken to prevent the applied epoxy from contacting and running into
the silver mesh. The finished support is shown in Fig. 7d. In a few cases , expanded silver mesh, 4/0, 5 mils thick, was sealed to the
external face of the finished support with silver epoxy around the edge to
strengthen the support.
In the background of Fig. 7 are shown the glass vials, each individually scribed with
coded marks, and silver powder (spheres) which were used in the experiments for
building up the working electrode on the electroformed support.
Before an experiment, the electrode support shown in Fig. 7 was attached to the
housing, and this assembly was attached to the hydrogen reference cell as shown in
Figs. 8 and 9 . Saunders S-22 Teflon Thread Sealant, Saunders Corporation,
20

Los Angeles, California, was used in this assembly. This 1/2-in. -wide TFE Teflon
tape, shown in Fig. 8 , is prepared according to U. S. Patent No. 3,002,770 and contains only unsintered TFE Teflon powder which has been extruded under pressure
and calendered. The tape can be tightly wrapped around surfaces with finger pressure
or by working with a spatula to seal to itself with enough strength for many laboratory
operations.
A silver str ip was spot welded to the end of the tab leading to the support, and this lead was coated with the Teflon tape as shown in Fig. 8. The cut surfaces of the housing
and the Pyrex tube of the support were mated while the housing was clamped with its
bottom end facing up. This joint was sealed with the Teflon tape, and the tab was
wrapped to the housing. The working electrode was then clamped to the stand with its
bottom end in a down position, and the reference cell was wrapped to the working
electrode housing in two places as shown in Fig. 9. The tip of the Luggin capillary was
placed about 0.7 mm from the electroformed mesh about 2 mm in from the rim. Care
was required to prevent rupture of the mesh by the tip during this assembly. In Fig. 8 ,
the neoprene rubber connections and the Teflon tape used in the assembly are shown
on the stand. Two rings of Teflon tape were placed around the ground glass joint as
shown in Figs. 8 and 9 to enable a good seal without the use of lubricant and to prevent the "freezing" of this joint. It was found necessary to construct the upper portion of
the 3-mm-0. d. Pyrex plunger tube in the bellows with a solid Pyrex rod to impart the
extra strength needed there.
3.2.4 Properties of Working Electrode Materials
The two important materials which constitute the electrode are the silver electroformed
mesh, 2000 LPI, Ruling No. 2001, Buclbee Mears Co. , St. Paul, Minnesota, and the
silver spheres, Valley Metallurgical Processing Co., Haskell, New Jersey. These
a r e the materials of (1) the bed support and the sphere bed which is a thin silver mem-
brane with square holes, all about the same size and uniformly distributed, and (2) the
sphere bed, composed of spheres which are all about the same size and which always
21

_.""-"_I___"- "_ " r"
fa l l into a loose packing of about the same density. The accuracy of the analyses of
the behavior of the electrode is largely contingent upon the accuracy of the character-
ization of these materials. In separate studies, characterizations of these materials
were made.
!
In Figs. 10 through 16 a r e shown typical Polaroid photographs taken with the micro-
scope used in measurements of the dimensions of the materials. The focal plane was
adjusted to accommodate the measurements of most of the diameters or the side of
the squares so thzt some portions of the photographs appear to be blurred. For
example,, the spheres shown in Figs. 13 through 16 are sharp only around most of the
perimeters, and some particles appear to be joined because of the lack of proper
focus for the perimeter of each particle and for the upper regions of every particle.
Adjustments of the focal plane could be made to show that this "joining" is an illusion
due to optical distortion or piling up of particles. The photographs serve to show the
typical regularity of patterns encountred with these materials and to indicate the
manner in which the microscope studies were made. Transmitted and reflected light
were used in preparing the photomicrographs, and with the same settings the photo-
micrographs were taken of a calibrated reticle containing 200 divisions in 2 mm (i. e. , l o p per division). Diffraction patterns, present at the highest magnifications, are
believed to cause negligible error. Approximately 240 random measurements were
made of the diameters for each sphere fraction used and of the squares in the electro-
formed mesh. The results for the measurements with spheres are given in Table 1. ,
Table 1 RESULTS O F MICROSCOPIC MEASUREMENTS O F SPHERE
DIAMETERS
Average Diameter Average Deviation Average Deviation OL) (%)
13.65 37.65 54.31 86.49 156.1
2.36 17.3 4.21 12.3 3.78 6.96 8.04 9.3 12.8 8.2

Fig. 10 Silver Electroformed Mesh, 1000 LPI, Smooth Side
23

Fig.11 Silver Electroformed Mesh, 2000 LPI, Smooth Side
Fig. 1 2 Silver Electroformed Mesh, 2000 LPI, Rough Side
24

Fig. 13 Silver Spheres, 48-p Average Diameter
Fig. 14 Silver Spheres, 38-1.1 Average Diameter
25

Fig. 15 Silver Spheres, 86-1.1 Average Diameter
Fig. 16 Silver Spheres, 54-1.1 Average Diameter
26
I

5 The electroformed mesh used in most of this work was 4.2 p thick, and a small amount
of this material used in the catalyst distribution studies (Section 4) was thinner, about
3.0 p. This difference w a s observed because of the variation in properties of the mesh
from one piece to the next, each 4.5 by 4 .5 in. , when this material is purchased.
Thickness was determined from photomicrographs of cross sections of the mesh, e. g. , Fig. 17. The electroformed meshes have a smooth and a rough side (e. g. , see
Figs. 11 and 12), and the smooth-side square is generally larger than the rough-
side square so that the hole may resemble a truncated pyramid. For most of the
present studies, the side of the square on the rough side was 4.4 p , the space between
the squares on the rough side was 8.0 p , and the side of the square on the smooth side
w a s 6.7 p . The average deviation from these average values is f 6 percent, and the
calculated transmission is 14.7 percent. The 2000 LPI electroformed mesh in
Figs. 11 and 12 did not photograph well, so a photograph of a 1000 LPI mesh, Fig. 10,
is included to show the typical uniformity of these electroformed structures. In these
Polaroid photographs, occasional deviations from the regular patterns and shapes
could be seen, but these were shown to account for less than a few percent of the total spheres or holes in the electrode. The observed regularity is remarkable in view of
the estimated 8.2 x 10 square holes and the more than lo6 spheres that are esti- mated to be present i n one typical working electrode.
5
The ohmic resistance of the 2000 LPI silver electroformed mesh and the mesh-to-
si lver r ing seal was determined with an impedance bridge, Type 1650-A, General
Radio Company, Concord, Massachusetts. Specimens of the electroformed mesh were
sealed with the silver epoxy on a circuit board to silver foil, and then the specimens
were subjected to typical curing temperature cycle. By using different lengths of the
same mesh between bonds, and from the known resistance of the leads, the resistance
of the epoxy bond and mesh could be found. The ohmic resistance from side to side of
a 1 by 1 cm piece of electroformed mesh is 0.013 ohms, and the contact resistance for
the silver epoxy bond between the 2000 LPI mesh and a silver foil 0.12 cm wide and
1.00 cm long is 1 .79 x 10 ohms. These resistances detract negligibly from the
performance of the working electrode. During the experiments in 13.5 M KOH at
-4
27

Fig. 17 Cross Section of Silver Sphere on Electroformed Mesh. lOOOx
28
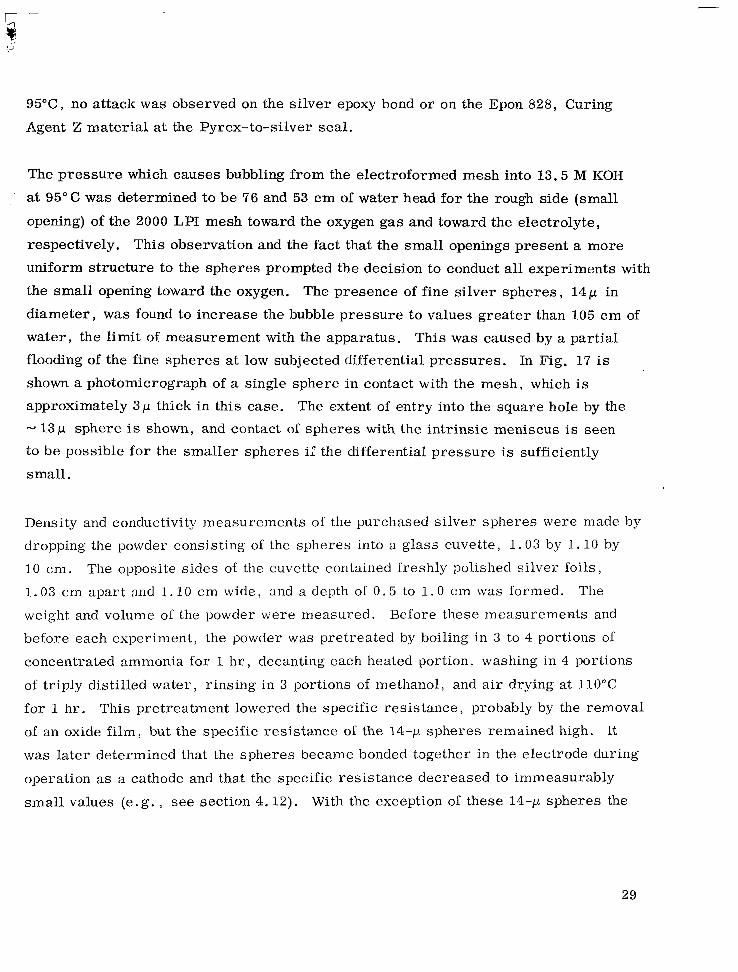
95"C, no attack was observed on the silver epoxy bond or on the Epon 828, Curing
Agent 2 material at the Pyrex-to-silver seal.
The pressure which causes bubbling from the electroformed mesh into 13.5 M KOH
at 95°C was determined to be 76 and 53 cm of water head for the rough side (small
opening) of the 2000 LPI mesh toward the oxygen gas and toward the electrolyte,
respectively. This observation and the fact that the small openings present a more
uniform structure to the spheres prompted the decision to conduct all experiments with
the small opening toward the oxygen. The presence of fine silver spheres, 14p in
diameter, was found to increase the bubble pressure to values greater than 105 cm of
water, the limit of measurement with the apparatus. This was caused by a partial
flooding of the fine spheres at low subjected differential pressures. In Fig. 17 is
shown a photomicrograph of a single sphere in contact with the mesh, which is
approximately 3 p thick in this case. The extent of entry into the square hole by the N 131.1 sphere is shown, and contact of spheres with the intrinsic meniscus is seen to be possible for the smaller spheres i,' the differential pressure is sufficiently
small.
Density and conductivity measurements of the purchased silver spheres were made by
dropping the powder consisting of the spheres into a glass cuvette, 1 . 0 3 by 1 .10 by
10 cm. The opposite sides of the cuvette contained freshly polished silver foils,
1.03 cm apart and 1.10 cm wide, and a depth of 0 . 5 to 1 . 0 cm was formed. The
weight and volume of the powder were measured. Before these measurements and
before each experiment, the powder was pretreated by boiling in 3 to 4 portions of
concentrated ammonia for 1 h r , decanting each heated portion. washing in 4 portions
of triply distilled water, rinsing in 3 portions of methanol, and air drying at 110°C
for 1 hr. This pretreatment lowered the specific resistance, probably by the removal
of an oxide film, but the specific resistance of the 14-1.1 spheres remained high. It
was later determined that the spheres became bonded tagether in the electrode during
operation as a cathode and that the specific resistance decreased to immeasurably
small values (e.g. , see section 4.12). With the exception of these 14-p spheres the
29

specific resistances were low enough to be negligible before the experiments were conducted. The results of the conductivity and density measurements are given in Table 2. Included is the diameter of the largest sphere that can fit three spheres of the considered average sphere size which are in mutual contact. Repeated measure-
ments of the loosely packed density of the spheres resulted in values deviating less
than f 5 percent from the average value in Table 2.
Table 2 SOME PROPERTIES O F THE TESTED POWDER CONSISTING OF
SILVER SPHERES
Average Fractional Specific Smallest Spheres Fitting Diameter Void Resistance Through Pore, 0.155 D Density
OL) (g’cm3) Volume (ohm-cm) ( P )
156 6.23 0.407 0.41 24.2 86 6.25 0.405 5.3 13.4 54 6.23 0.407 0.39 8.41 38 6.22 0.408 8.3 5.83 14 5.59 0.468 50 2.11
The uniformity of the built-up thickness of the working electrode was also examined.
After some experiments with the built-up electrode, the silver sphere bed was carefully
removed by rupturing the membrane and the thickness of the bed was examined for
uniformity. In another test of this uniformity, the entire electrode was encased in
epoxy, after an experiment, and a photomicrograph was made of a section through
the electrode. These examinations revealed that the overall thickness remained to
within f 2 percent of the average value and that the desired thiclmesses were obtained
to within about 10 percent with the assumption of the densities given in Table 2. In
Fig. 18 is shown a cross section of an electrode having 54- and 14-p spheres.
The desired thicknesses were 1700 (-1 for the overall thickness and 400 p for the fine
layer. The observed overall and fine layer thicknesses were 1750 and 450 p,
respectively. A photomicrograph of the 156-1.1 spheres is shown in Fig. 19. Here,
all the spheres were kept in the same plane by a special technique, and they appear
30

Fig. 18 Cross Section of Double-Porosity Electrode. 1OOx. Fine Layer, 14-,u Spheres;Coarse Layer, 54-,u Spheres
31

Fig. 19 Cross Section of Silver Spheres, 156-p Average Diameter. 250X
32

to have the same diameter. In Fig. 18, with a random distribution, the spheres are
sectioned at different locations through the spheres so that the spheres should not
appear to be the same size. In Fig. 18, the fine electroformed mesh can be seen below the porous structure, where it became separated during the epoxy impregnation required for the metallurgical mounting.
The smallest spheres, 14 p in diameter, could not be purchased in a narrow fraction,
and they were separated from a 10- to 20-,u range by elutriation with nitrogen.
3.2.5 The Reference Electrode
In Figs. 6, 8 , and 9, the arrangement of the utilized hydrogen reference electrode
and cel l are shown. A hydrogen stream of about 0.5 cc min-l was passed over an
immersed platinized platinum electrode which was in the same electrolyte as the
working electrode to assure concentration and temperature uniformity. After immer-
sion in the electrolyte, the reference cell was slowly filled with the bulk electrolyte
through the Luggin capillary at the bottom of the cell by the hydrostatic pressure of
the surrounding electrolyte. The cell was isolated from the bulk electrolyte with the exception of the capillary tube by the walls of the Pyrex reference cell which were
partly wrapped with Teflon tape to minimize electrolyte contact with the Pyrex. The
platinum foil of the electrode was platinized before each experiment (Ref. 14) , washed
in triply distilled water, and then introduced into the reference cell, as shown in
Fig. 6. The platinum foil of the electrode was spot welded to a platinum wire sealed
to the inside of a hollow Pyrex tube, and the wire led to the external electrical connec-
tion, as shown in Fig. 9.
3.2.6 Pressure and Flow Regulation
The oxygen pressure was kept constant at the gas side of the working electrode by employing a column of water with an inserted outlet tube as shown in Figs. 3 and 5.
Bubbling from the immersed outlet tube was maintained and the depth of this
33

tube in the water column could be varied from 0 to 105 cm of water. The depth of
immersion of the working electrode in the 13.5 M KOH was 7 .0 cm, and this correspo.nds
to approximately 10 cm of water head. This pressure must be subtracted from the
applied oxygen pressure to obtain the differential pressure across the electrode.
A needle valve at the oxygen tank and a throttling needle valve, Nuclear Products Co. , Cleveland, Ohio, at the outlet tube leading to the flowmeter were used to adjust the
oxygen pressure and flow. A calibrated displacement flowmeter was used at the oxygen
outlet to indicate the flow which was maintained at 15 cc mind' during the experiments.
The nitrogen and hydrogen flows were adjusted with needle valves at the tanks. Al l
gases were standard items of purchase by the laboratory and were used without further
purification. The gases were bubbled through water wash bottles before use to roughly
indicate flow rates.
3.2.7 Counter Electrode
The counter electrode consisted of a platinum sheet, 4 by 5 by 0 . 1 cm, which rested
on the bottom of the polypropylene bottle. Electrical connection to the counter-
electrode w a s made from the top of the bottle by a platinum w i r e inserted in a Teflon
sleeve. Oxygen gas which developed at the counter electrode did not appear to affect
the results, even at the highest current, 100 mA.
3.2.8 Monitoring the Electrode Response
Monitoring of the electrode response was according to the circuit shown in Fig. 4. The applied current, cathodic at the mesh, was held galvanostatically with an
Electronics Measurement, Inc. , Eatontown, N . J. , constant current power supply.
A Model NLR Sargent recorder, E. H. Sargent & Co. , Chicago, 111. , and a model 500
Greibach ammeter, Greibach Instruments Corp. , New Rochelle, N. Y. , were used
to monitor the potentials and currents. In addition, a Model 2700 Rubicon potentiometer,
Rubicon Instruments, Philadelphia, Pa. , served to check the values of the Sargent
recorder.
34

3.2.9 Solutions
The 13.5 M KOH solution used in these experiments w a s prepared in 7-liter quantities
with reagent-grade potassium hydroxide which contains 2.0 percent potassium carbonate.
Triply distilled water was used, the last two stages from quartz vessels. The solution
was stored in a polyethylene bottle before use, and titrations were made to assure a
KOH concentration of 13.5 f 0 . 1 M. The 13.5 M KOH solution in the electrolyte cell
was changed after three experiments or after a 1-week residence in the cell, depending
on which occurred first. In the cell, nitrogen was bubbled from a fine Teflon tube at the bottom for at least 12 hr prior to an experiment.
Ji ,,-L
3.3 PROCEDURE
The procedures for the general assembly of the apparatus, cell, working, and reference
electrodes are given in the preceding sections. The general conduct of an experiment
is given here, together with some catalysis treatments of the silver spheres used in a
few special experiments.
3.3.1 Performing an Experiment
A t the s ta r t of an experiment the oxygen valve at the tank was opened, the oxygen
throttling valve was closed, and the connections of the oxygen lines were made to the
electrode housing shown in Fig. 9. The electrode housing, together with the reference cell, was lowered a few centimeters into the electrolyte until 35 cm of water head of
applied oxygen pressure developed, usually within a few minutes. This procedure
kept the gas-side cavity of the working electrode free of bulk electrolyte, and the
intrinsic meniscus remained positioned at the mesh. The housing was then lowered
and clamped into position so that the housing tube w a s vertical and the mesh was
7.0 cm below the electrolyte level (e. g. , see Fig. 5). The oxygen flow past the electrode w a s adjusted to 15 cc min-l. The hydrogen was turned on, and the line
was purged and then connected to the reference cell. The reference electrode was
35

platinized and added to the reference cell. The thermostating bath was then filled with
water, the heating system and stirrer were turned on, the makeup water bottle was
. attached, and the polypropylene spheres were added to the water to reduce evaporation.
A period of 3 to 4 h r was then required before the rest potential was finally attained.
The operating temperature was attained in less than 1 hr, but the slow attainment of a
rest potential could not be hastened with applied cathodic or anodic current pulses.
The rest potential was usually 1035 mV versus the hydrogen reference electrode,
although values of 980 to 1055 were sometimes obtained. At room temperature in
6.9 M KOH, the rest potential is obtained more quickly, within 30 min. During this
waiting period, a weighing schedule wa’s usually followed to weigh out planned amounts
of spheres to be added.
At an applied oxygen pressure of 35 cm of water, the electrode was built up, and the
scheduled experiments were conducted with variations in applied oxygen pressure and
current. After each addition of spheres to the trap door, at least 15 min were allowed
for temperature attainment by the spheres. After each addition of the spheres to the
mesh and after each current or applied pressure change, the potential was observed
on the Sargent MR recorder until the potential reached a steady value. This attainment
of a steady potential took from 10 min to 1 to 2 h r , depending on the type of change
(e. g. , see section 4.13). A potential was considered to have a steady state value when
no detectable change occurred in a 6-min period. The limit of detection was i 1 mV.
3 . 3 . 2 Catalysis Treatments
Platinum metal was added to silver or nickel spheres by chemical displacement by
treating these metals with a chloroplatinic acid solution. A 100-rnl quantity of
this solution was prepared to a concentration equivalent to 9.66 mg of platinum metal
per milliliter. This concentration was determined gravimetrically by precipitating
platinum metal with hydrazine from a known volume of solution. The silver and
nickel spheres were treated with the platinum solution before they were added to

the electrode bed. The silver spheres were treated according to the following
procedure:
Wash spheres 4 times in concentrated aqueous ammonia.
Rinse spheres in triply distilled water 6 times.
Add 50 rnl of triply distilled water to a 2-g portion of spheres.
Dilute the required volume of the standardized chloroplatinic acid solution
with 50 m l of water, and add this solution gradually to the agitated slurry of
spheres.
Bring solution to a boil, decant, add triply distilled water, boil, and decant. Wash spheres with 2 portions of triply distilled water. Wash spheres with 4 portions of concentrated aqueous ammonia with heating.
Wash spheres in about 10 portions of triply distilled water. Dry spheres in air at 110°C for 2 hr .
The specific resistance of the 156-p silver spheres treated in this way was lowered -
from 0.41 ohm-cm for the untreated spheres to values less than 0.25 ohm-cm.
Nickel spheres having an average diameter of approximately 156p , corresponding to
a -80 + 100 sieve fraction, were obtained from Federal-Mogul Division of Federal-
Mogul-Bower Bearings, Inc. , Ann Arbor, Mich. The nickel spheres were treated in the following way:
0 Wash in 3 portions of acetone.
0 Wash in 4 portions of triply distilled water. 0 Add 30 ml of 1 part concentrated nitric acid diluted with 2 par ts of water to
2.4 g of nickel spheres. Stir for 3 min.
0 Decant acid wash with 4 portions of triply distilled water.
0 Add 50 ml of triply distilled water.
0 Dilute the required volume of the standardized chloroplatinic acid solution
with 50 ml of water, and add this solution gradually to the agitated slurry of
spheres.
0 Bring solution to a boil with constant agitation, decant, add triply distilled water , boil, and decant.
37

I
Wash spheres with 4 portions of triply distilled water. 0 Dry spheres in air at 110°C for 2 hr.
The specific resistance of nickel spheres, 156 p in diameter , which were treated with
nitric acid according to steps 1 through 4 above and which were dried was
1.3 x 10 ohm cm. After treatment with chloroplatinic acid, the specific resistance
was reduced, depending on the platinum loading for a 1300-p-thick layer in the 1.25 cm
electrode. For a 1 0 , 3 , 1, and 0 . 3 mg platinum loading, the specific resistances were
1.9, 7.0, 10.9, 'and 308 ohm-cm, respectively. It was decided to use the nickel
sphere bed having the lowest specific resistance in the experiment (Section 4). The
density and fractional void volumes of the nickel sphere bed were 4.66 g cm-3 and
0.476 , respectively.
5
2
Gold plating of the 156-1.1 silver spheres was accomplished by resting the spheres on
a horizontal gold cathode which was constantly vibrated with a tool normally used to
inscribe metals. A cyanide-free proprietary bath was used which advertises a dense,
pure gold deposit. From the coulombs passed and the a rea of the spheres, it is
estimated that a 1-p-thick layer of gold w a s deposited. The specific resistance of
the gold-plated silver spheres was 0.05 ohm-cm. The surface of the spheres appeared
to be continuous and unchanged after use in an oxygen cathode.
Teflon loading of platinized silver spheres was done by adding dry, fine Teflon TFE
powder to a 1-g quantity of the spheres and dispersing the Teflon powder throughout
the spheres by gently shaking the mixture in a small glass bottle. For further dilution
of the Teflon, a small quantity of this mixture was then added to a fresh quantity of
platinized silver spheres. The presence of Teflon in the sphere mixture was detected
by measuring the specific resistance. For a Teflon loading of 1 7 mg of Teflon for a
1300-p-thick bed in the 1.25 cm electrode, the specific resistance was in excess of
10 ohm-cm. For a Teflon loading of 4.4 x 10 mg in the same volume of platinized,
156-p silver spheres, the specific resistance was 1.14 ohm-cm, still greater than
for the un-Teflonized spheres, 0.25 ohm-cm. Teflon TFE powder with an advertised
1-p average particle size w a s used, TL-120 from Liquid Nitrogen Processing
Corporation, Malvern, Pa.
2
6 -3
38
Section 4 EXPERIMENTAL RESULTS AND DISCUSSION
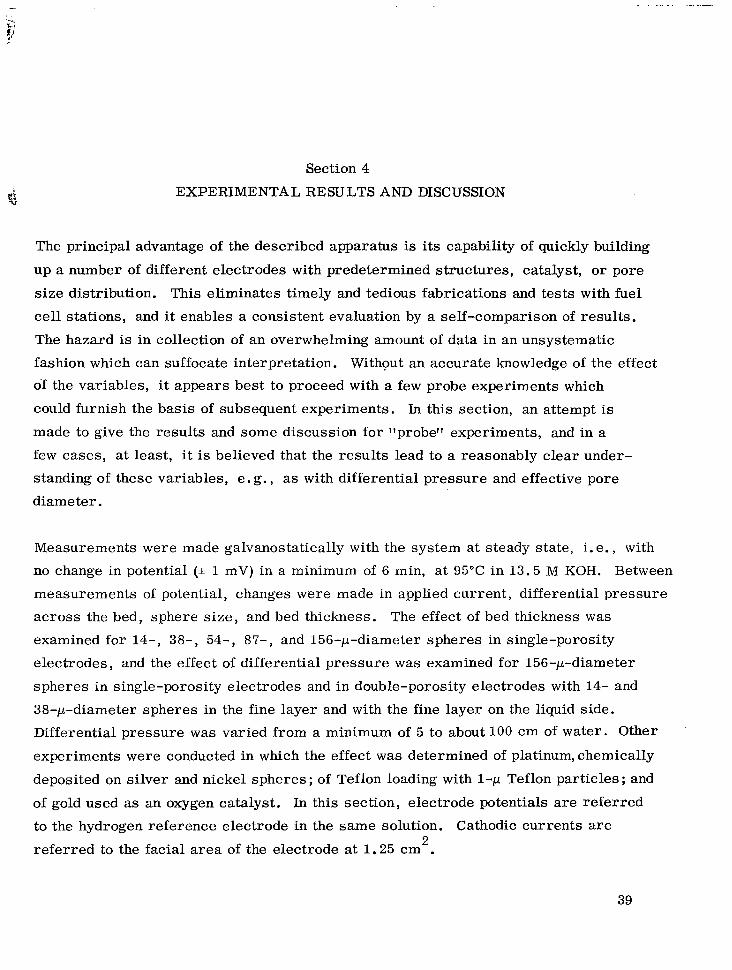
The principal advantage of the described apparatus is its capability of quickly building
up a number of different electrodes with predetermined structures, catalyst, or pore
size distribution. This eliminates timely and tedious fabrications and tests with fuel
cell stations, and it enables a consistent evaluation by a self-comparison of results.
The hazard is in collection of an overwhelming amount of data in an unsystematic
fashion which can suffocate interpretation. Without an accurate knowledge of the effect of the variables, it appears best to proceed with a few probe experiments which
could furnish the basis of subsequent experiments. In this section, an attempt is
made to give the results and some discussion for "probe" experiments, and in a few cases, at least, it is believed that the results lead to a reasonably clear under-
standing of these variables, e. g., as with differential pressure and effective pore
diameter.
Measurements were made galvanostatically with the system at steady state, i. e., with no change in potential (& 1 mV) in a minimum of 6 min, a t 95°C in 13.5 M KOH. Between
measurements of potential, changes were made in applied current, differential pressure
across the bed, sphere size, and bed thickness. The effect of bed thickness was
examined for 14-, 38-, 54-, 87-, and 156-p-diameter spheres in single-porosity
electrodes, and the effect of differential pressure was examined for 156-p-diameter
spheres in single-porosity electrodes and in double-porosity electrodes with 14- and
38-p-diameter spheres in the fine layer and with the fine layer on the liquid side.
Differential pressure was varied from a minimum of 5 to about 100 cm of water. Other
experiments were conducted in which the effect w a s determined of platinum,chemically
deposited on silver and nickel spheres; of Teflon loading with 1-p Teflon particles; and
of gold used as an oxygen catalyst. In this section, electrode potentials are referred
to the hydrogen reference electrode in the same solution. Cathodic currents are
referred to the facial area of the electrode at 1.25 cm . 2
39
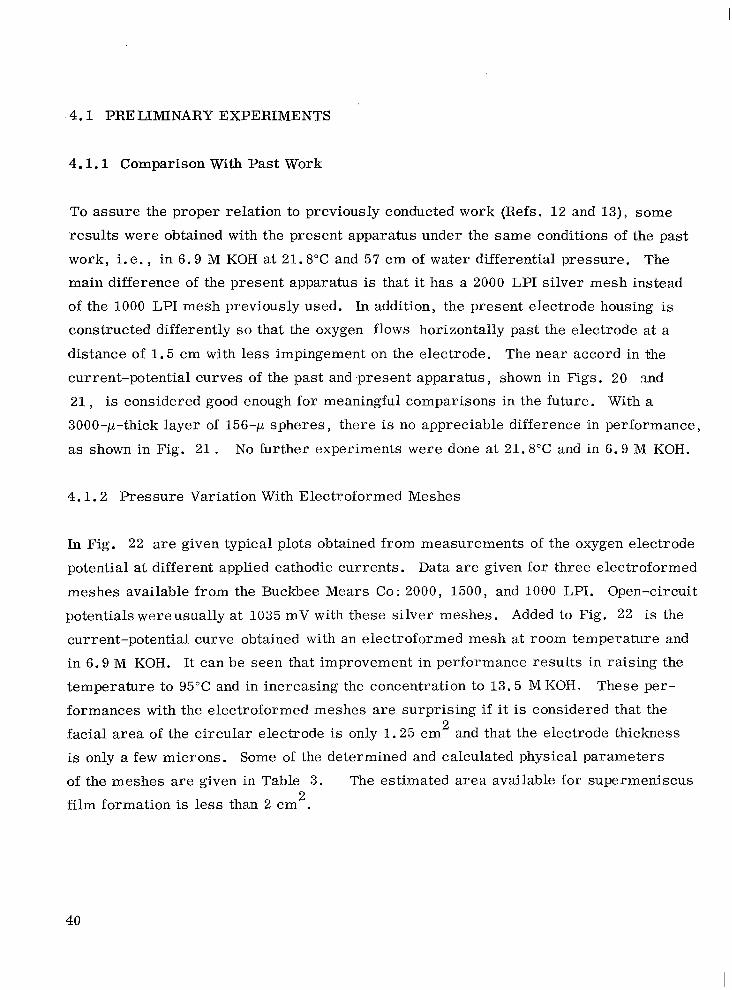
4.1 PRELIMINARY EXPERIMENTS
4.1.1 Comparison With Past Work
To assure the proper relation to previously conducted work (Refs. 12 and 131, some
results were obtained with the present apparatus under the same conditions of the past
work, i.e., in 6.9 M KOH at 21.8"C and 57 cm of water differential pressure. The
main difference of the present apparatus is that it has a 2000 LPI silver mesh instead
of the 1000 LPI mesh previously used. In addition, the present electrode housing is
constructed differently so that the oxygen flows horizontally past the electrode at a
distance of 1.5 cm with less impingement on the electrode. The near accord in the
current-potential curves of the past and .present apparatus, shown in Figs. 20 2nd
21, is considered good enough for meaningful comparisons in the future. With a 3000-p-thick layer of 156-p spheres, there is no appreciable difference in performance,
as shown in Fig. 21 . No further experiments were done at 21.8"C and in 6.9 M KOH.
4.1.2 Pressure Variation With Electroformed Meshes
In Fig. 22 a r e given typical plots obtained from measurements of the oxygen electrode
potential at different applied cathodic currents. Data are given for three electroformed
meshes available from the Buckbee Mears Co: 2000, 1500, and 1000 LPI. Open-circuit
potentials wereusually at 1035 mV with these silver meshes. Added to Fig. 22 is the
current-potential curve obtained with an electroformed mesh at room temperature and
in 6.9 M KOH. It can be seen that improvement in performance results in raising the
temperature to 95°C and in increasing the concentration to 13.5 M KOH. These per-
formances with the electroformed meshes are surprising if it is considered that the
facial area of the circular electrode is only 1.25 cm2 and that the electrode thickness
is only a few microns. Some of the determined and calculated physical parameters
of the meshes are given in Table 3. The estimated area available for supermeniscus
film formation is less than 2 cm . 2
40

R
I ELECTRODE: tias, uxygen at - 1 atm, 15 cc rnin-'
4 p Ag Mesh 2000 LPI
Liquid, 6.9 M KOH, 1.25 cm Contact, 21.8 "C 2
DIFFERENTIAL PRESSURE, 57 cm OF WATER HEAD
-
hl " I - I I I I
1000 900 800 7 00 600 500
POTENTIAL VERSUS HYDROGEN REFERENCE ELECTRODE (mV)
Fig. 20 2000 LPI Silver Electroformed Mesh as an Oxygen Electrode. Wide lines represent results under NOW-64-0597-f with 1000 silver mesh
41

T
P 25-
B ELECTRODE:
v Gas, Oxygen at - 1 a tm, 15 cc rnin-'
3000 p Ag 156 p dia. (Previously Thought To Be 172 ,u dia. )
4 p Ag Mesh 2000 LPI
Liquid, 6 .9 M KOH, 1 .25 cm Contact, 21.8"C
6 - D E 20 u
2
- 1000 900 8 00 ~~
700 600 500
POTENTIAL VERSUS HYDROGEN REFERENCE ELECTRODE (mV)
Fig. 21 Comparison of Past and Present Results With Silver Sphere Bed Oxygen Electrode
42

10 Y
E
w R
!J
0 2000 LPI, 95"c, 13.5 M KOH
A 1500 LPI, 95"c, 13.5 M KOH 3 8 5 u 0 1000 LPI, 95"c, 13.5 M KOH
0 2000 LPI, 21.8"C, 6.9 M KOH 0 x 4 b
0 Q El PI 2 : 0 4 POTENTIAL VERSUS HYDROGEN REFERENCE
ELECTRODE IN SAME SOLUTION (mv)
Fig, 22 Typical Behavior of Silver Electroformed Meshes as Oxygen Electrodes Under Cathodic Load. Oxygen Differential Pressure, 25 cm of Water for Results at 95"C, and 57 cm for Results at 21.8"C
43

Table 3
ESTIMATED PROPERTIES OF THE THREE SILVER ELECTROFORMED MESHES
Estimated or Determined Physical Parameter Identifying Silver Mesh Number
2000 LPI 1500 LPI 1000 LPI
Facial Area of Circle (cm2)
Side of Square Hole on Gas Side 0-1)
Mesh Thickness (p)
Area of Planar Surface of Gas Side Subtracting Square Hole Openings (cm2)
Area on Sides of Square Holes (cm2)
Total Area Available to Supermeniscus Film Assuming Intrinsic Meniscus at Liquid Side (cm2)
Number of Holes in Electrode
Perimeter Length at Liquid Side (cm)
Supermeniscus Film Length Assuming Positioning of Intrinsic Meniscus at Liquid Side (p)
Current Obtained at 0.4 V Polarization (mA)
Bubbling Pressure (cm of H2O)
1.246 1.246 1.246 4.36 7 .'14 14.5
4.15 4.83 5.75
1.092 1.018 0.859
0.750 0.794 0.733
1.84 1.81 1.59
8.2 x lo5 4.5 x 10⁵ 1.9 x 10⁵
2600 1700 840
8.15 9.60 11.30
5 6.5 4.5
76 60 57
The only physical parameter in Table 3 which is in direct accord with the observed
behavior is the area on the sides of the square hole in the electroformed mesh. The
1500 LPI electrode with the most hole area gives the best performance, and so forth.
It is possible that the 1500 LPI mesh, with approximately the same total area available
for film formation as the 2000 LPI mesh, actually has more film area available because
of partial capillary flooding of the holes in the 2000 LPI mesh; e. g. , compare the
experimentally determined bubble pressures given in Table 3. No definite conclusions
on this difference in performances for the three meshes a r e made at present, however,
and only the magnitude is noted of the possible contribution by the mesh to the perform-
ance of an unflooded, built-up electrode structure.
44
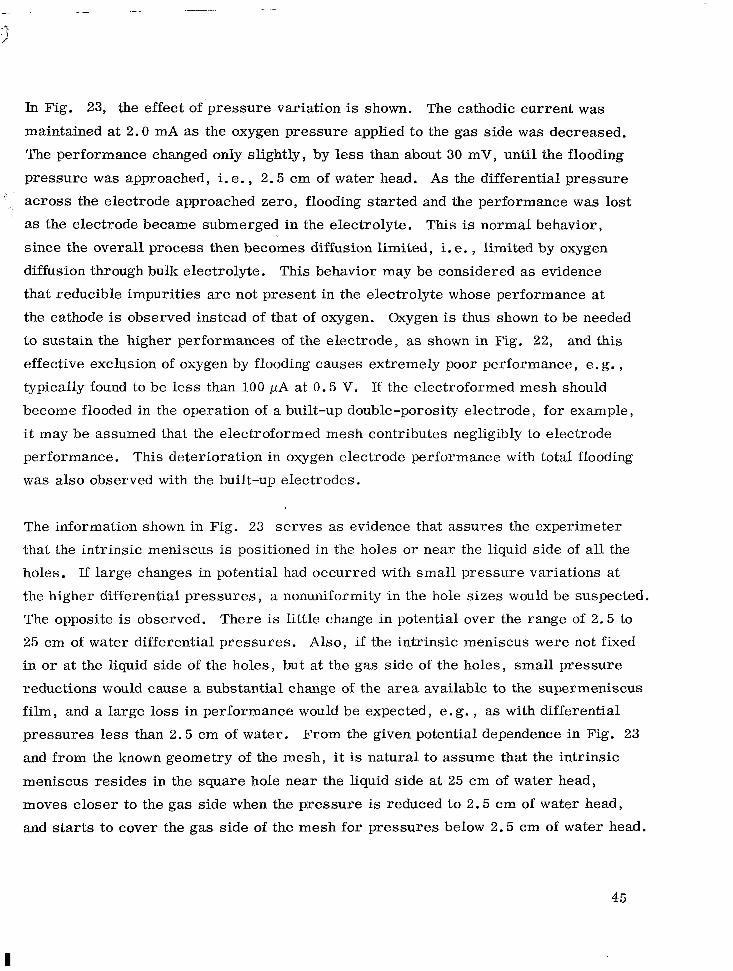
In Fig. 23, the effect of pressure variation is shown. The cathodic current was
maintained at 2 . 0 mA as the oxygen pressure applied to the gas side was decreased.
The performance changed only slightly, by less than about 30 mV, until the flooding
pressure was approached, i. e. , 2 . 5 cm of water head. A s the differential pressure
across the electrode approached zero, flooding started and the performance was lost
as the electrode became submerged in the electrolyte. This is normal behavior,
since the overall process then becomes diffusion limited, i. e. , limited by oxygen
diffusion through bulk electrolyte. This behavior may be considered as evidence
that reducible impurities are not present in the electrolyte whose performance at the cathode is observed instead of that of oxygen. Oxygen is thus shown to be needed
to sustain the higher performances of the electrode, as shown in Fig. 22, and this
effective exclusion of oxygen by flooding causes extremely poor performance, e. g. , typically found to be less than 100 pA at 0.5 V. If the electroformed mesh should
become flooded in the operation of a built-up double-porosity electrode, for example,
it may be assumed that the electroformed mesh contributes negligibly to electrode
performance. This deterioration in oxygen electrode performance with total flooding
was also observed with the built-up electrodes.
The information shown in Fig. 23 serves as evidence that assures the experimeter
that the intrinsic meniscus is positioned in the holes or near the liquid side of all the
holes. If large changes in potential had occurred with small pressure variations at
the higher differential pressures, a nonuniformity in the hole sizes would be suspected.
The opposite is observed. There is little change in potential over the range of 2.5 to
25 cm of water differential pressures. Also, if the intrinsic meniscus were not fixed
in or at the liquid side of the holes, but at the gas side of the holes, small pressure
reductions would cause a substantial change of the area available to the supermeniscus film, and a large loss in performance would be expected, e . g. , as with differential
pressures less than 2.5 cm of water. From the given potential dependence in Fig. 23
and from the known geometry of the mesh, it is natural to assume that the intrinsic
meniscus resides in the square hole near the liquid side at 25 cm of water head,
moves closer to the gas side when the pressure is reduced to 2.5 cm of water head,
and starts to cover the gas side of the mesh for pressures below 2 . 5 cm of water head.
45

I - - ”””””-” - “- FLOODING PRESSURE (PRESSURE EXERTED BY ELECTRODE IMMERSION)
POTENTIAL VERSUS HYDROGEN REFERENCE ELECTRODE I N SAME SOLUTION (mV)
Fig. 23 Effect of Reducing Applied Oxygen Pressure on Oxygen Electrode Performance. 2000 LPI Silver Mesh, 2 mA
46

When the pressure was increased to its highest value - about 24 Cm of water head - at any time from a lower pressure at which flooding did not occur, the original
potential versus the hydrogen reference cell was again obtained. This occurred by
a direct and monotonic approach to the original potential with the passage of time
'within 3 to 4 min, and no overshoot was observed. If, however, the electrode was permitted to flood for a few minutes before the pressure was again increased to
24 cm of water head, the potential quickly obtained a value closer to the oxygen open-
circuit potential, and then it approached the original value of the potential from the
opposite direction, as shown in Fig. 24 . This may be due to the formation of
intermediate species at the electrode during the severe polarization (Ref. 15), or it may be due to the improvement in performance caused by a very slight thickening of
the supermeniscus film. A small amount of film thickening, not large enough to cause
oxygen diffusion limitations, should lower the resistance to transport from the regions
in the film, where electrochemical reaction occurs, to the bulk electrolyte region (Ref, 16), alld assure effective film continuity around the edge of the square holes.
4.1.3 Flow-by Variation
With the given system, no effect w a s observed when oxygen flow was varied from 2 to
50 cc min through the electrode housing. The oxygen passes by the dead-end&
chamber containing the electroformed mesh and built-up electrode, about 1.5 cm above
the mesh, and does not appreciably disturb the gas in this chamber. Gas phase trans-
port of oxygen from the oxygen stream to the mesh in this chamber can be shown to be
rapid and not limiting for the overall transport and electrochemical processes during electrode operation by considerations of Fick's first law.
-1
4.2 EFFECT OF DIFFERENTIAL PRESSURE
In studies of gas electrode behavior at various differential pressures, recently reported
results have indicated that the value of the differential oxygen pressure across the
electrode and the history of subjection to this differential pressure are more important
47

900
8 00
7 oa
600
500
APPLIED PRESSURE AT 34 cm H 2 0 /OVERSHOOT
-
PRESSURE
FLOODLNG PRESSURE
- REDUCED TO
-
- APPLIED PRESSURE RAISED TO 34 cm H 2 0
-
L I I I I I 0 1 0 20 30 40 50
PASSAGE OF TIME (min)
Fig. 24 Appearance of an Overshoot After Flooding' 1000 LPI Silver Mesh. 1 mA Cathodic Current
48

in evaluations of electrode performance than indicated by first considerations of bubble
pressure tests alone (Refs. 17 through 22). It was observed that a hysteresis occurs
in the current-pressure curve and that an optimum differential pressures exists, i. e., a differential pressure at which the performance of the electrode is maximized.
Although these effects may not always be observed in "practical" electrodes, which
have a wide pore size distribution or roughened surfaces on the pore walls, they,
provide a key to understanding the operation of a gas electrode when simple systems
are used, for both wet -proofed and double-porosity structures, and they are intimately
connected with the role of structure in influencing electrode performance. The
variation of differential pressure and the interpretation of the effects of this variation
are thus included as a part of the tests on built-up electrodes.
A single-porosity electrode was built up to 1700-1.1 thickness with the 156-p-diameter
silver spheres at 25 cm of water differential pressure (subtracting 10 cm of water
from the applied oxygen pressure for the depth of electrode immersion). The differ-
ential pressure w a s first reduced in steps to 5 cm of water and then increased to
about 80 cm of water. A t 5 cm of water in the absence of spheres, flooding of the gas
side of the mesh would be minimal (Fig. 23). In the presence of spheres, however,
flooding could occur at the mesh and in the sphere bed, depending on the capillary
forces exerted by the sphere bed and the extent of flooding of the sphere bed, i . e . ,
via a supermeniscus film extending from the bulk electrolyte (Section 5). The intrinsic
meniscus may not have contacted the bottoms of the spheres which happened to res t on
a square hole of the mesh, at least at open circuit (Ref. 23). A simple formula can
be derived which relates sphere radius R and the side of the square L to the depth h
which the sphere extends into the square hole of the mesh:
For the 156-p spheres and 2000 LPI mesh, h is 0 . 0 3 p which may be compared with
the mesh thickness, 4.15 p. Nevertheless, spheres still may contact electrolyte
through a supermeniscus f i l m (Section 5).
49
At each differential pressure, a current-potential curve was obtained so that a ser ies
of such curves was available for analysis. In Fig. 25 is shown a typical current-
potential curve taken near the optimum pressure after the pressure was increased.
Isopotential plots were then made, from the series of current-potential plots, of
current versus pressure as shown in Figs. 26 and 27 to assist interpretations of the
effect of differential pressure. The hysteresis effect which occurs with decreasing
and increasing differential pressure can be clearly seen in Figs. 26 and 27. In
Fig. 27, this effect is shown for a working electrode potential of 500 mV for both
decreasing and increasing pressure. There is an optimum differential pressure
which does not change as the applied current (or potential) is changed, but which is
shifted together with the entire curve depending on whether the differential pressure
has previously been decreased or increased (i. e., depending on whether the electrolyte
has been infiltrating the sphere bed o r has been draining from the sphere bed). The
current peak at the optimum pressure was reproducible for increasing pressure,
about 50 k 2 mA cm-2 at 42 cm of water, but varied between 25 and 45 mA ~ r n - ~ for
the initially obtained decreasing pressure curve at 500 mV. The values of the optimum
pressures for both decreasing and increasing pressure were reproducible to within the
limits of the experiment, f 1 cm of water. Current densities were about 27 mA cm
at 500 mV when the electrodes were first built up at 25 cm of water differential pressure
with the 156-p spheres (Fig. 26).
-2
The behavior described appears to be related to the characteristic hysteresis of liquid
holdup in a porous medium as a function of differential pressure across the medium;
i. e. , porous beds require a higher differential pressure to attain a given saturation
during forced drainage than during liquid infiltration (Ref. 4). The shift in the
optimum differential pressure shown in Fig. 27 suggests that this optimum is connected
with a certain electrolyte content in the porous bed. If electrolyte films on the spheres
are present in the absence of penetration of electrolyte into the bed, the greatest f i l m
area and the most favorable gas transport condition through the film exists with
minimum liquid penetration. However, the resistance to ionic transport in these
50

- 60 cu
I
5 50 a Y E 40
30 > cn z E 20
E 10 F
U U
0 2 0
POTENTIAL VERSUS HYDROGEN REFERENCE ELECTRODE ( m V )
Fig. 25 Typical Current-Potential Relation Obtained for One Set of Conditions: Single-Porosity Bed of 156-p Silver Spheres, 1700 p Thick, at Differ- ential Oxygen Pressure of 40 cm of Water After Differential Oxygen Pressure Increased From 5 cm of Water
51

60
50
40 h
0
a 20 E
a 0 30
20
10
I I I I I I - DECREASING DIFFERENTIAL
PRESSURE
_______c INCREASING DIFFERENTIAL
PRESSURE
'0 ( CM OF WATER )
DIFFERENTIAL OXYGEN PRESSURE 70 10 20 30 40 50 60
Fig. 26 Effect of Differential Pressure Variation on Silver Sphere Bed Electrode. Single-Porosity Bed of 156-,u Silver Spheres, I700 ,u Thick, at Three Potentials Versus Hydrogen Reference Electrode: a. 500, b. 700, c . 900mV
52

I I I I I I
0 10 20 30 40 50 60 70 DIFFERENTIAL OXYGEN PRESSURE (CM OF WATER)
Fig. 27 Hysteresis When Differential Pressure Is Changed. Single-Porosity Bed of 156-1.1 Silver Spheres, 1700 p Thick, at 500 m V Versus Hydrogen Reference Electrode
53

thin films renders them ineffective at any significant distance from the bulk electrolyte.
If liquid that penetrates the bed forms continuous paths or filaments connecting regions
of film to the bulk electrolyte, the penetration of this liquid can be expected to enhance
electrode performance. However, i f liquid penetrates in an amount or in a configura-
tion to eliminate major fractions of the film surface, then this penetration degrades
performance.
The appearance of an optimum can then be explained as follows: A t pressures below
the optimum value, excessive flooding of the bed's film areas occurs. A t pressures
above the optimum value, the filaments of electrolyte facilitating ionic transport are
either ruptured or forced from the sphere bed (e. g., see Section 5 and the Appendix).
At the optimum pressure, small interconnected threads of bulk electrolyte, which
may be only thickened f i l m regions, supply good ionic conductivity to small areas of
supermeniscus film throughout the electrode. In this case, the first lengths of the
supermeniscus films throughout the electrode are considered to supply more current
than a film of longer length but of approximately the same area. Theoretical treat-
ments used to estimate current distribution in the supermeniscus film have shown
that the local current density is much higher in the first portions of the film next to
bulk electrolyte than in the later portions (e. g. , Ref. 16).
The above explanation appears to be the only one that fits the observations so well ,
and it wil l be elaborated in Section 5. Workers in Sweden (Refs. 21 and 24) observed
that the conductivity of the supermeniscus film or electrolyte conductivity in the
electrode started to increase at approximately the same pressure as the optimum
pressure as the pressure is decreased. This further corroborates the above
explanation. Furthermore, the observation of increases and decreases in perform-
ance with changes in pressure when the sphere bed is not flooded and when the electrode
is not bubbling supports the view expressed by Lindstrom that liquid flow through the
developed film can take place after a pressure change (Ref. 21).
It is concluded that the high performance of film-type oxygen cathodes depends on the
formation of continuous networks of gas and liquid in the porous medium. Disruption
54
of either network, by excessive flooding or by rupture of liquid filaments at low flooding
levels, generally will cause a deterioration in electrode performance. Moreover,
differential pressure history as well as the differential pressure measurement must
be considered in evaluation of electrode performance because of the hysteresis effhct
in internal liquid configurations. These concepts wil l be applied throughout Section 4
and will be treated theoretically in Section 5.
j ;
Finally, from Fig. 26 , it can be seen that the optimum differential pressure is more
critical in a uniform sphere bed at higher current drains and polarizations than at
smaller values. A t the higher values, given shifts in the applied oxygen pressure
cause severe changes in performance. At lower values of current and polarization,
performance also deteriorates with shifts from the optimum pressure, but deterioration
is relatively less. This observation is in keeping with the greater demands of mass
transport within the structure which are present at higher current drains.
4 . 3 EFFECT O F ELECTRODE THICKNESS
The effect of electrode thickness was determined for the 156-p-diameter silver spheres
at 25 cm of water head differential pressure for electrodes built up at this differential
pressure without previous pressure change. Results are presented in Figs. 28 and
29. The data for Fig. 28 were collected with the current maintained at 15.0 mA
after the first addition of spheres, and for Fig. 29, current-potential curves were
obtained after each addition of spheres to enable the given current-thickness plot of
isopotential curves. In both cases, the electrode thickness for which further increases
in thickness have little or no change (i. e. , the optimum electrode thickness) is approxi-
mately 1300 p. Increased electrode performance due to the increase in available film
area was noted until the optimum thickness was attained.
This behavior is similar to that of the prior work in 6.9 M KOH at 21.8"C and 57 cm
of water differential pressure except that the optimum electrode thickness for the
55

~ - ~ " . _ _ _ _ ~ - ""
- 0 U U
~ ~~ I I 0 1000 2000 3000 4000
THICKNESS OF SILVER SPHERE BED (p )
Fig. 28 Improvement in Electrode Performance as Electrode Thickness Is Increased. 156-1.1 Silver Spheres ; Oxygen Differential Pressure, 25 cm Water; Cathodic Current, 15.0 mA (Held Constant)
39
5
u n U 800
0 0- 900 I c 1000 I
500 1000 1500 THICKNESS OF SILVER SPHERE: BED (p)
2000
Fig. 29 Effect of Thickness Increase of 156-1.1 Silver Sphere Bed. Oxygen Differential Pressure, 25 cm of Water
56

I -
same spheres* was then determined to be about 400 1-1 (Ref. 12). In the comparison of the present apparatus with the past apparatus described in section 4.1, this optimum
thickness was again found to be approximately 400 to 500 p in the 6.9 M KOH. There
are three apparent differences between the two studies: temperature, concentration,
and differential pressure. However, the surface tensions of the two solutions are quite
close, about 90 and 89 dynes cm-' for 13.5 M KOH, 95"C, and 6.9M KOH, 20°C, respectively (see Ref. 25 and Section 5). If the predominating, acting difference in
the two experiments is the differential pressure, then the observed behaviors can be
explained. At high differential pressures in excess of the optimum differential
pressure, more of the bulk liquid filaments (or film thickened regions) are forced
from the porous structure than at lower differential pressures in excess of the optimum
differential pressure. This would result in a greater restriction of ionic transport so
that the portion of the film more removed from the bulk electrolyte is less effective.
The effective film length (optimum electrode thickness) should be shorter at the higher
differential pressure, as observed. In addition, the supermeniscus film should be
thinner at higher .applied pressures after liquid filament rupture if more of the isolated
liquid bodies retained at sphere-to-sphere contacts are forced from the porous mass.
The principal limitation of the supermeniscus film for the sphere beds again appears
to be its relatively poor ionic conductivity, as concluded in section 4 . 2 .
In reexaminations of the data in the previously reported work (Ref. 12), it can be
found that the optimum electrode thickness actually increased as the sphere size was made smaller, from about 400 to 700 p as the sphere size w a s reduced from 156 to
54 p. An explanation for this effect now appears at hand. For smaller spheres, the
infiltration pressures for liquids is higher and there should be more bulk liquid fila-
ments or film thickened regions in the porous structure. The effective film length
for the smaller spheres should thus be longer because of improved ionic transport as
observed. We may assume that the optimum differential pressure for the 156-p
*The more careful measurements of the average sphere diameter in the present work indicate that the average diameter is 156 p and not 172 1.1 as previously reported (Ref. 12).
57

, _. , , . . . . . . . . . .. . . . _. . . . . . . . . . . , - . . .-?I
spheres is the same at 21.8"C in 6.9 M KOH as at 95°C in 13.5 M KOH because of the similarity in surface tensions, i. e. , 16 cm of water pressure for the initial
buildup (Fig. 26). The optimum differential pressure for 54-p spheres should be
(156/54) 16 or 46 cm of water pressure (see Section 5), which is still less than the
utilized 57 cm of water pressure of the past work. The past results at room tempera-
ture were thus collected at differential pressures higher than the optimum pressure,
and this reexamination tends to confirm the conclusions of the previous paragraph.
The data of Fig. 29 a r e of interest because the influence of operating current density
or polarization on practical considerations of the optimum electrode thickness can be
surmised. While the optimum electrode thickness is not changed with the electrode
potential, the effect of making the electrode thinner than optimum is less as the
electrode potential is increased (or as polarization is decreased). Thus, for very
small current densities, the electrode may be as thin as 400 p without appreciably
affecting performance. For high current densities, the electrode should be at least
1200 p thick for the 156-p spheres to obtain maximum possible performance.
4.4 EFFECT OF SPHERE SIZE AND PORE DIAMETER
The effect of sphere size and pore diameter on optimum electrode thickness was
included in the previous section for differential pressures greater than the optimum
differential pressure. It was concluded that an increase in differential pressure would
then cause a decrease in the optimum electrode thickness, possibly with some loss in
performance. In this section, the results are given for electrodes built up and main-
tained at 25 cm of water differential pressure for silver spheres with average diameters
of 86, 54, 38 and 14 p. For a sphere 86 p in diameter, the optimum differential
pressure should be, by comparison with the 156-p spheres, (156/86) 16 o r 29 cm of
water. The effect is thus determined of decreasing sphere size o r effective pore
diameter for structures subjected to a differential pressure which is less than the
optimum differential pressure. The effective pore diameter in this study is proportional
to the average sphere diameter, and the two terms are used interchangeably.
58

The more important results are shown in Figs. 30 through 3 5 . Several features
are outstanding in this differential pressure region which is lower than the optimum
differential pressure. Performances now decrease, with few exceptions, as the
sphere size is decreased and as electrode thickness is increased beyond a certain
thickness while pressure is held constant. This behavior is in contrast to that for
differential pressures above the optimum differential pressure previously determined
and described (Ref. 12) (sections 4.2 and 4.3). The performances, while poor, afford
interesting conclusions on the influence of sphere diameter.
The current-thickness curves of Fig. 29 for the 156-p spheres may be compared
with those of Fig. 30 for the 8 6 - , 54-, and 37-p spheres at 500 mV. Performances
a r e found to decrease as sphere diameter is decreased, evidently owing to the onset
of infiltration of bulk electrolyte which becomes more pronounced as sphere diameter
is decreased. The increase in specific surface area with decreasing particle size no
longer causes a general improvement in performance because relatively more area
is lost by partial flooding and film thickening.
In Figs. 30 and 31, another effect is shown for the 54- and 38-p spheres. A s electrode
thickness is increased, increased performance is noted until a certain thickness is
attained. Thereafter, increases in electrode thickness cause a decrease in perform-
ance until little or no effect is observed with further thickness increase. In general,
the described behavior can be explained by the flooding of some pores and isolated
regions in the electrode, with the consequent blockage of reaction sites to gaseous
oxygen, and by the excessive thickening of the film. A s the pores are made smaller,
the fraction of the surface flooded should increase, and if the electrode is made
thicker while it is in a partially flooded condition, the probability ,of an overall blockage
of reaction sites is increased (Ref. 26). The shape of the pores in the sphere bed is actually irregular, and the pores are wide at some locations and narrow at others.
For very thin electrodes having only a few layers of spheres, if the electrode is
partially flooded, the parts of the pores that are wide can retain relatively good access
to oxygen from the gas side of the electrode even though the parts of the pores that
59

I- z W (r
3 0
a
r
5 -
OO 500
SILVER SPHERES IN ELECTRODE BED
1 THICKNESS
1000 1500 2000 2500- OF SILVER SPHERE BED (MICRONS)
Fig. 30 Effect of Electrode Thickness on Current Density for Various Sphere Sizes. Oxygen Differential Pressure , 25 cm of Water; 500 mV Versus Hydrogen Reference Electrode
THICKNESS OF SILVER SPHERE BED (MICRONS)
Fig. 31 Effect of Electrode Thickness on Electrode Potential for Various Sphere Sizes. Oxygen Differential Pressure, -2 25 cm of Water; Cathodic Current Density, 4.2 mA cm
60
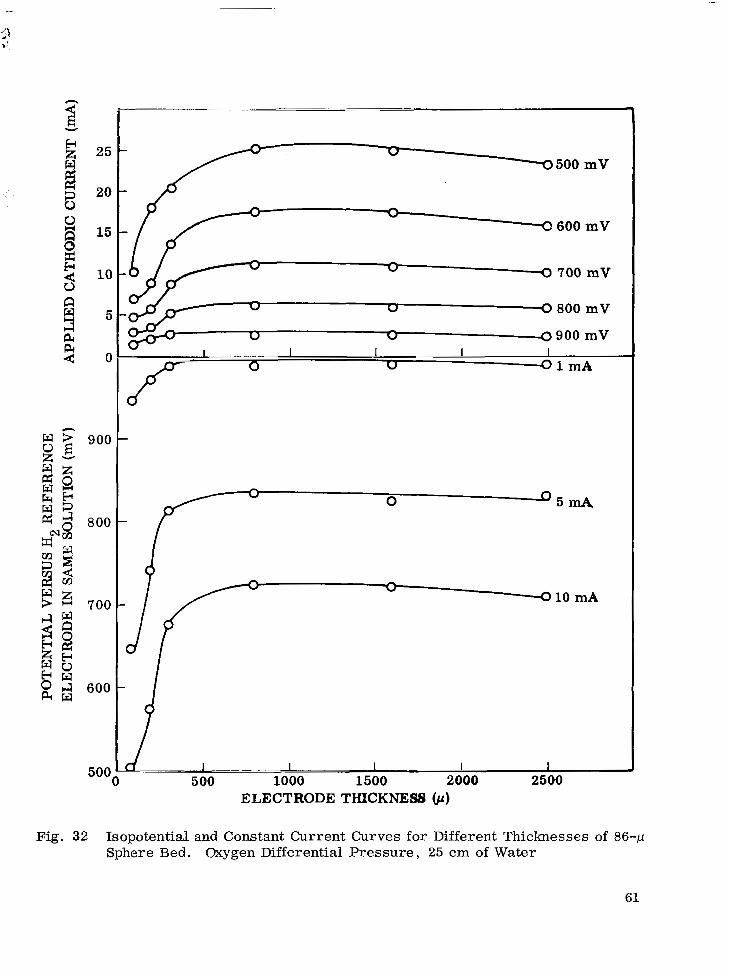
25
20
15
10
5
0
900
8 00
700
600
500, 0
B
d
I I 1 "~ I 1 500 1000 1500 2000 2500
ELECTRODE THICKNESS (p)
Fig. 32 Isopotential and Constant Current Curves for Different Thicknesses of 86-,u Sphere Bed. Oxygen Differential Pressure, 25 cm of Water
61

15
10
5
0
900
800
7 00
6 00
500
-n n v 0 600 mV
0 500 1000 1500 2000 2500
ELECTRODE THICKNESS (p )
Fig. 33 Iso9otential and Constant Current Curves for Different Thicknesses of 54-p Sphere Bed. Oxygen Differential Pressure, 25 cm of Water
62

15
10
5
0
900
8 00
7 00
600
500
500 m V - - 3 600 m V
I I - c 0 700 m V
2 10 mA n
I I I 500 1000 1500 2000
ELECTRODE THICKNESS ( P )
2500
Fig. 34 Isopotential and Constant Current Curves for Different Thicknesses of 3 7 - p Sphere Bed. Oxygen Differential Pressure, 25 cm of Water
63
I

SPHERE DIAMETER 14 ,u
0 1000 2000 3000 THICKNESS OF SILVER SPHERE BED (P)
Fig. 35 Constant Current Curve for Different Thicknesses of 14-p Silver Sphere Bed. Oxygen Differential Pressure, 25 cm of Water; Cathodic Current, 6 . 0 mA
64
I

are narrow are flooded. As electrode thickness is increased by some small amount,
performance improves as long as the oxygen gas has relatively good access to the
reaction sites on the unflooded portions of the spheres. As electrode thickness is
further increased, diffusion of oxygen gas through the pores becomes increasingly
difficult because the gaseous diffusion path is increased and because this path becomes more tortuous around the flooded parts of the pores.
This situation is compounded by the probability of pore blockage. For example, if
some fraction of the pore volume is flooded in each layer, it can be seen that the
probability of blockage of the unflooded pores in each layer by flooded pores is greatly
increased by the addition of another layer after only a few layers are built up. This
blockage is particularly insidious because after a small amount of the oxygen gas is
consumed from the blocked pore, the electrolyte film becomes too thick for further
active removal of oxygen and consequent participation in electrode performance, and
the remaining gas acts to further decrease ionic conductivity.
Under these conditions, the reaction can be expected to be concentrated in a region
toward the gas side of the electrode, and increases in thickness beyond some length
serve only to increase transport distance along electrolyte paths through the partially
flooded electrode and thus to decrease performance. Ultimately, a situation arises in
which the reaction zone is located somewhere between the gas and liquid side of the
electrode where ionic and gas-phase diffusive Ifresistances" are balanced. This
effect is similar to the one reported by Maget and Roethlein (Ref. 27). A s electrode
thickness is increased still further, leveling off in performance is finally noted, and
this may occur because the increased ionic resistance then has less influence on
performance after the performance has declined and when the attainable current
densities have become small.
In Figs. 32 through 34, more detailed information is given for the analyses of the
effect of sphere size on electrode performance in this differential pressure regime.
It can be seen from these data that electrode performance actually does improve as the sphere size is made smaller, provided that the electrode is very thin. Under
these conditions, the electrode is not thick enough for the overall blockage of sites
to be important, and the transport paths along the electrolyte have not yet become 65

very long and tortuous. Thus, the 500-mV curve for the 86-1.1 spheres in Fig. 32
shows better performance than the same curve for 156-1.1 spheres in Fig. 29 for
thicknesses up to 800 1.1. The 10-mA curve for 54-1.1 spheres in Fig. 33 shows better
performance than the same curve for 86-p spheres in Fig. 32 for thicknesses up to
250 p, and this same 10-mA curve is better for 38-p spheres, Fig. 34, up to a thick-
ness of 120 p compared with the 54-1.1 spheres. In Fig. 31, these effects for very thin
electrodes at 4 . 2 mA cm are given for direct comparison of the three sphere. sizes:
86, 54, and 38 p . At 1 mA (0.8 mA cm ) these effects occur in regions of electrode
thickness too small to be detected (Figs. 32, 33, and 34); i.e., maximum performance
is approached more quickly when electrode thickness is increased if the current
density is low (section 4 .3 ) .
-2
-2
Some general comments may be made for this pressure regime. For very thin
electrodes at high polarizations, an electrode should have very fine particles to give
the best performance. For thick electrodes, the particles should be larger at all
polarizations. For low current densities, once a certain unknown minimum electrode
thickness is established, performance is insensitive to changes in electrode thickness
and is improved by using larger spheres. For high current densities, the largest
sphere in this pressure regime should be used, i. e., that which corresponds to the
optimum differential pressure for the considered differential pressure.
The general change in the given curves as sphere size is made smaller in this pressure
regime may be expected to correspond approximately to the change for a given sphere
size as the differential pressure is decreased below the optimum differential pressure,
with the exception of the effects described above for thin electrodes. Thus, increases
in differential pressure for a given sphere size should cause a gradual disappearance
of the observed performance peak in the given plots with electrode thickness,
Figs, 30 through 35, and a gradual increase in the optimum electrode thickness
should be observed until the optimum differential pressure is attained. This would correspond to the freeing of surface area from a flooded condition. Increases in
differential pressure beyond the optimum differential pressure should then cause a decrease in optimum electrode thickness without the appearance of a performance maximum.
66

I -
4.5 DOUBLE-POROSITY STRUCTURES
Double-porosity electrodes were built up at 25 cm of differential pressure with 400-1.1
fine layers having either 14-.or 38-p silver spheres. The coarse layers were 1300 p
thick and consisted of 156-p silver spheres at the gas side. The total electrode thick-
ness was 1700 p. The differential pressure was reduced to 5 cm of water and then
increased to 2 60 cm of water, and current-potential plots were determined after each pressure change.
The more important results of these experiments are given in Fig. 36, where the
results of a single-porosity electrode, 1700 p thick with 156-1.1 spheres, are included
for comparison. A peak is observed as differential pressure is decreased and as
better contact with bulk electrolyte is established throughout the sphere bed. A s
differential pressure is increased, another peak is observed at the onset of expulsion of the continuous electrolyte network from the sphere bed. The differential pressures
at the peaks after the pressure decrease and after the pressure increase are approxi-
mately equal for the three electrodes, as expected if the 156-1.1 sphere beds provide
the surfaces for electrochemical reaction in each electrode. The peaks obtained as
differential pressure is increased are generally broader and higher than the first
peaks, and this is attributed to the better liquid contact, which helps the formation of
liquid filaments and films in the sphere bed after the electrode has been subjected to
a lower differentialpressure. The second peaks are broadest and highest for the double- porosity electrodes, and the 14/156 electrode has a broader and higher peak than the 38/156 electrode. An increase in the maximum current density to 63 mAcm2 at
500 mV was observed with the 14/156 electrode. This type of behavior is anticipated
i f the finer, 14-1.1 sphere layer is better able to draw liquid to the interface between the coarse and fine layer.
The results of Fig. 36 may be used to show that a double-porosity electrode does
more than prevent bubbling o r flooding. The fine layer may serve to provide intimate
liquid contact with the coarse layer. A synergistic effect occurs which assists the
performance of the electrode. This effect is also apparent at higher differential
67

DECREASING DIFFERENTIAL PRESSURE
4
0 SINGLE POROSITY ELECTRODE: 156p SPHERES, 1700p BED -
0 DOUBLE POROSITY ELECTRODE: 37p SPHERES IN 400p FINE LAYER, 156p SPHERES IN1300p COARSE LAYER
A DOUBLE POROSITY ELECTRODE: 14p SPHERES IN 400 p FINE LAYER, 156p SPHERES IN1300p COARSE LAYER
-
-
10 20 30 40 50 60 70 80 90 DIFFERENTIAL OXYGEN PRESSURE,
CM OF WATER
Fig. 36 Comparison of Single- and Double-Porosity Electrodes as Differential Pressure Is Changed. Silver Sphere Beds With Total Thickness at 1700 p at Potential of 500 mV Versus Hydrogen Reference Electrode
68

pressures after the peak is passed and leveling in the curves is observed. Some
performance contribution from the fine layer should then occur at the higher pressures
when oxygen gas enters the fine pores.
The contribution to performance of the fine layer in a double-porosity electrode or, for example, in a fine middle layer in a graded triple-porosity structure with
successively finer layers toward the electrolyte should become important as the
optimum differential pressure of that layer is approached. The attainable current for a given potential should then be, to a reasonable approximation, the sum of
currents derived from each layer considered separately at the differential pressure
of the system. The optimum differential pressure for each layer of spheres should be inversely proportional to the average sphere diameter of each layer (Section 5).
In one set of experiments, a double-porosity electrode having a 400-,u fine layer of
14-,u silver spheres and a 1300-,u coarse layer of 54-1.1 silver spheres was built up and
operated. The optimum differential pressure was estimated from the data for the
156-p spheres given in Fig. 26 to be (156/54) 42 o r 121 cm of water for the 54-p sphere
layer. In Fig. 37 are shown the results of a pressure increase for this electrode to 90
cm of water differential pressure (100 cm total). The coarse layer of this dauble-
porosity electrode did not contribute to performance appreciably until the differential
pressure reached 60 cm of water. Then a sharp improvement in performance was
observed as pressure was increased further, and the performance of the electrode
appeared to approach but not attain an optimum value for differential pressures up to
90 cm of water, the limit imposed by the maximum height of the water column used in
the experiment. The current at 90 cm of water, 155 mA (125 mA cm ) at 0.5 V, surpassed the highest current attained with the 156-1.1 spheres, 78 mA (63 mA cm-2) at 0.5 V, in the 14/156 double-porosity electrode of Fig. 36. These limited data at least demonstrated the anticipated sense of the shift and the improvement in performance
that can be expected with the higher specific surface area for the 54-p spheres. A
cross section of this electrode is shown in Fig. 18.
-2
If a coarse layer is placed on the electroformed mesh, it might be expected to isolate
a subsequently placed fine layer from electrolyte flow through the coarser bed. The
69

20 30 40 50 60 70 80 90 100 PRESSURE, cm OF WATER HEAD
Fig. 37 Effect of Pressure Variation for Double-Porosity Electrode With Two Fine Layers (Increasing Pressure)
70

fine layer would then only be in contact with the 1 thin film from the coarse layer and
relatively large pores and spheres of the coarse layer, and the advantages of a higher
specific surface area might be achieved without local flooding at differential pressures
lower than the optimum for the fine layer. This concept was tested, and the results
are given in Fig. 38 and Table 4. A coarse layer of 156-1.1 silver spheres was placed toward the electrolyte on the mesh, and a fine layer of 54-p spheres was placed
at the gas side on top of the coarse layer. The differential pressure was maintained
at 25 cm of water head throughout the experiments so that the differential pressure
for the 156-,u spheres was more than the optimum, 16 cm of water, and less than the
optimum for the 54-p spheres, which is about (156/54) 16, o r 46 ern of water.
Electrodes were built up to a total thickness of 2000 p with 325-, 550-, and 775-1.1
coarse layers. Little or no improvement in performance was noted when the thickness was increased to more than 1000 p , and a slight improvement occurred as thicker
coarse layers were used (Table 4 and Fig, 38). The performance of the "inverted
double-porosityll electrode was improved over that of the single-porosity 156-,u
electrode, e. g. , about 40 instead of 30 mA cm-2 at 0.5 V under the same conditions
(Figs. 29 and 38). However, the improvement was increased as the coarse layer
was made thicker for the three thicknesses studied (Table 4).
Table 4
BEHAVIOR OF INVERTED DOUBLE-POROSITY ELECTRODE FOR DIFFERENT COARSE LAYER THICKNESSES (Cathodic Current, 14.0 mA) (a)
Potential Versus Hydrogen Reference
in Same Solution (m V)
Thickness of Coarse Thickness of Fine Overall Layer of 156-p Spheres Layer of 54 ,u Spheres Thickness
( P ) b) (P)
71

ELECTRODE POTENTIAL VERSUS H2 REFERENCE ELECTRODE I N SAME SOLUTION (mV)
Fig. 38 Performance of Built-Up Inverted Double-Porosity Electrodes. Coarse Layer, 156-p Spheres Next to Electrolyte; Fine Layer, 54-1.1 Spheres (Steady-State Data After Current Variations, N 2000-p Electrode Thickness)
72

r
For the electrode with a 550-1.1 coarse layer, a serious loss in performance took place
5 min after the thickness was increased from 1400 to 2000 p . Potential dropped
rapidly to 500 mV and continued to decrease to 400 mV over a 10-min period at
14.0 mA. This behavior supports the belief that a basic instability exists with
these systems because flow through the film in the coarse layer is possible. Lindstrom gives a discussion on electrolyte flow through thin films on the walls of porous gas electrodes (Ref. 21), and Muller has experimentally demonstrated
this flow by his optical observations of the movement and growth of supermeniscus
films on flat silver surfaces (Ref. 28). The inverted double-porosity system should
eventually fail as differential pressure is increased because of the loss of effective liquid films in the coarse layer which supply ionic conducting paths for the fine layer.
4 .6 TRIPLE-POROSITY STRUCTURES
Two structures were prepared containing three layers of silver spheres, each layer
consisting of spheres of a different size. The first structure was prepared by building
up with increasingly coarse layers towards the electrolyte, and the second structure
had exactly the same thickness for each layer but with the order reversed:
Structure I: Oxygen gas
250 p of 14 p spheres
700 p of 54 p spheres
300 p of 156 p spheres
4 .4 p of mesh
13.5 M KOH
Structure 11: Oxygen gas
300 p of 156 p spheres
700 p of 54 p spheres
250 p of 14 p spheres 4 .4 p of mesh
13.5 M KOH
73
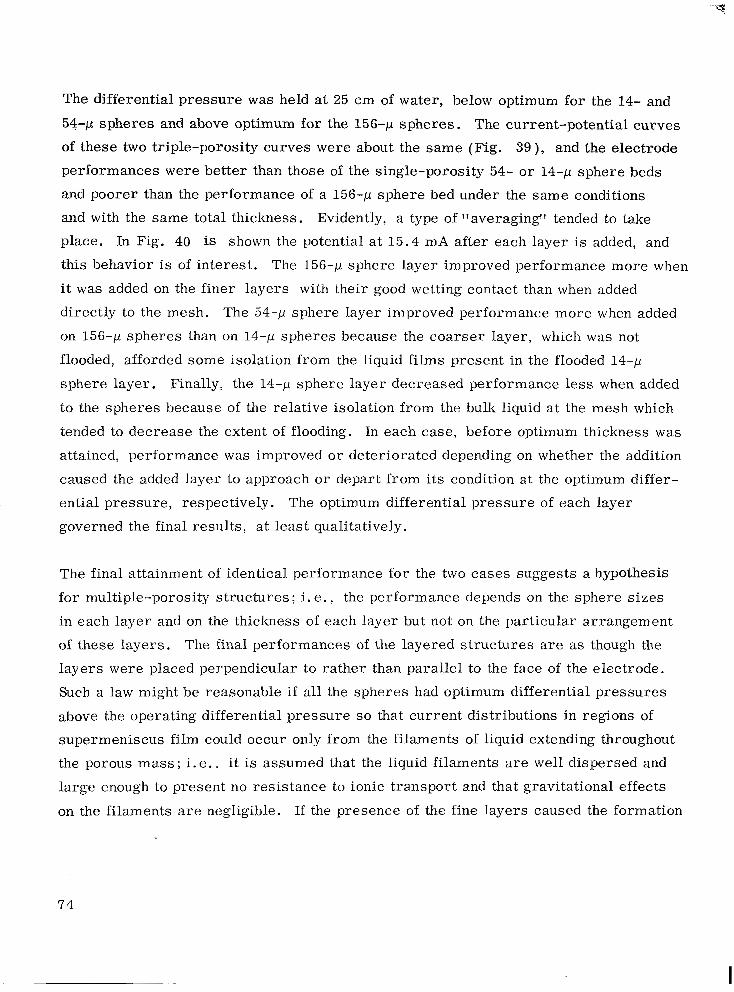
The differential pressure was held at 25 cm of water, below optimum for the 14- and
54-12 spheres and above optimum for the 156-p spheres. The current-potential curves
of these two triple-porosity curves were about the same (Fig. 39 ), and the electrode
performances were better than those of the single-porosity 54- o r 14-12 sphere beds
and poorer than the performance of a 156-p sphere bed under the same conditions
and with the same total thickness. Evidently, a type of "averaging" tended to take
place. In Fig. 40 is shown the potential at 15.4 mA after each layer is added, and
this behavior is of interest. The 156-p sphere layer improved performance more when
i t was added on the finer layers with their good wetting contact than when added
directly to the mesh. The 54-1.1 sphere layer improved performance more when added
on 156-,u spheres than on 14-p spheres because the coarser layer, which was not
flooded, afforded some isolation from the liquid films present in the flooded 14-p
sphere layer. Finally, the 14-p sphere layer decreased performance less when added
to the spheres because of the relative isolation from the bulk liquid at the mesh which
tended to decrease the extent of flooding. In each case, before optimum thickness was attained, performance was improved or deteriorated depending on whether the addition
caused the added layer to approach or depart from its condition at the optimum differ-
ential pressure, respectively. The optimum differential pressure of each layer
governed the final results, at least qualitatively.
The final attainment of identical performance for the two cases suggests a hypothesis
for multiple-porosity structures; i. e. ~ the performance depends on the sphere sizes
in each layer and on the thickness of each layer but not on the particular arrangement
of these layers. The final performances of the layered structures are as though the
layers were placed perpendicular to rather than parallel to the face of the electrode.
Such a law might be reasonable if all the spheres had optimum differential pressures
above the operating differential pressure so that current distributions in regions of
supermeniscus film could occur only from the filaments of liquid extending throughout
the porous mass ; i . e . . it is assumed that the liquid filaments a re well dispersed and
large enough to present no resistance to ionic transport and that gravitational effects
on the filaments are negligible. If the presence of the fine layers caused the formation
74
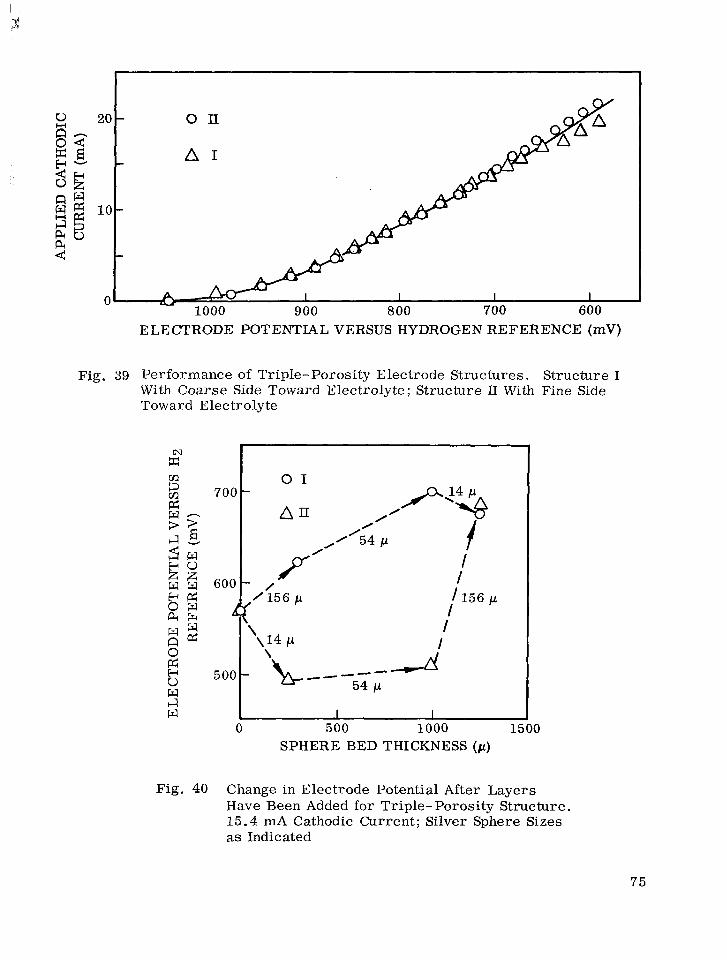
ELECTRODE POTENTIAL VERSUS HYDROGEN REFERENCE (mV)
Fig. 39 Performance of Triple-Porosity Electrode Structures. Structure I With Coarse Side Toward Electrolyte; Structure II With Fine Side Toward Electrolyte
x" 1
I
I
156 p 156 p
i I
I I I 0 500 1000 1500
SPHERE BED THICKNESS ( p )
Fig. 40 Change in Electrode Potential After Layers Have Been Added for Triple-Porosity Structure. 15.4 rnA Cathodic Current; Silver Sphere Sizes as Indicated
75

of such idealized filaments in the 156-p sphere layer, then the results could be ex- plained in terms of the other results of this report. It should be noted, however, that
masking of oxygen by excessive flooding at gas-side fine layer would invalidate the
above assumptions.
If it is assumed that performance at the optimum differential pressure improves as porosity is made finer o r as sphere size is made smaller, i. e. , as specific area is increased (Section 7), then broadening of the differential pressure peak to facilitate
differential pressure control may best be accomplished by utilizing a graded porosity
structure with successively finer porosities toward the electrolyte. A s differential
pressure is increased, the electrode areas that contribute to electrochemical per- formance would shift from the coarser layers at the gas side toward the electolyte.
As the differential pressure is increased beyond the optimum value for the coarsest
layers, their contribution to performance would decrease as that of the finest layers
is increased. The design of such an electrode would entail determination of differential
pressure - current plots for various thicknesses of each layer under the conditions of
contact in the final electrode and would not be an easy task. It should be noted that for
a given electrode thickness and a given minimum sphere size for the finest layer, the
broadening of the differential pressure peak in this manner would theoretically result
in a loss of electrochemical performance when the performance is compared with
that of a single-porosity electrode using the given finest layer size. In this case, the
addition of coarse layers to the gas side would require that the finest layer be made
thinner for a given electrode thickness, and if the given electrode thickness is equal to
o r less than the optimum thickness of the finest layer, the contribution to the perform-
ance by the finest layer would necessarily be decreased. If the given electrode thick-
ness is greater than the optimum thickness of the finest layer and if the finest layer
is at its optimum thickness o r thicker, the coarse layers would be too far removed
from thebulkelectrolyte to have an appreciable influence at the optimum pressure for
the fine layer. Also, synergistic effects such as those observed with the double-
porosity electrodes (section 4 . 5 ) then should not appreciably help in improving per-
formance because the optimum pressure of the coarse layer would be exceeded. Most
of the electrochemical performance of a given minimum sphere size for a finest layer
should be retained, however, in designing for pressure peak broadening by allowing
the electrode thickness to be somewhat greater than its optimum value for the finest
7 6

r
layer when this finest layer is present in a single-porosity electrode, i. e. , by design-
ing so that the reaction zone at the gas side near the flooded portions of the graded
porosity eleclro.de continually moves toward the liquid face of the electrode until the
maximum performance is attained when the optimum pressure &x the fine layer is attained. The thickness of each coarse layer would be designed so'that it contributes
to the broadening of the pressure peak to a desired extent. Further, a finer, very thin
layer could be added to the liquid side of the electrode adjacent to the working fine
layer to prevent bubbling if the electrode's pressure peak is unduly exceeded. By
using such an electrode, the total thickness would be more than optimum for the fine
layer in a single-porosity electrode although the fine layer would be present at its single-porosity optimum thickness, ohmic resistance losses would occur in the liquid through the flooded layers at pressures lower than optimum, but approximately the
same performance would be obtained at the optimum pressure for the working fine
layer as for a single-porosity electrode having this fine layer.
4 . 7 EFFECT O F PLATINUM LOADING ON SILVER SPHERES
Smooth platinum and smooth silver surfaces are probably approximately equivalent
as catalysts in the reduction of oxygen in aqueous KOH solutions (Ref. 12). The
coating of the silver spheres used in this work with smooth platinum should not yield appreciably different results. However, the deposition of platinum on silver by
chemical displacement from a chloroplatinic acid solution is known to produce a
rough surface; e.g., the surfaces are characteristically black in color. Such
deposited surfaces should nevertheless behave as though they are catalytically more
active because local current densities would be increased at a given potential by the increased surface area. The imparted roughness should also have some effect on the optimum differential pressure (Section 5); i.e., the roughened surface should behave
as if a layer of very small spheres were present on the surface of the large spheres.
For the studied spheres, 156 p in diameter, beds were 1300 1-1 thick. This corresponds
to 1.009 g or to a surface area on the spheres of 37.0 cm2 in the 1.246 cm contact
area of the electrode, assuming smooth spheres and considering the bed's fractional
2
77

void volume of 0.407. The deposition of 10 mg of platinum in this bed would give a thickness of 1, 265 A if the deposit were not porous. The fact that depositions occurred
by chemical displacement for a 10-mg platinum loading is considered as evidence that
the deposits were porous. Otherwise, access to the chloroplatinic acid solution and
subsequent platinum deposition would be blocked after only a few layers of platinum
0
atoms were formed on the silver surface (- 1 .4 to 14 A) . Thus, the actual platinum
thickness should be greater than the calculated thickness. In attempts to place more
platinum (30 mg) on the silver, separation of a porous black platinum from the spheres
was observed, and tests were not made with loadings of more than 10 mg of platinum
per electrode. The unflooding of pores of the deposited porous platinum with its relatively small pores should require higher pressures than for the unflooding of the
large pores in the silver sphere bed (section 4.4). Also, the deposited porous platinum
should actually have a wide pore size distribution with some pores which a r e s o fine
that they could never be unflooded at reasonable differential pressures but with other
pores which are larger and which could be unflooded more easily.
Performances were examined of electrodes in which the 156-p silver spheres in the
1300-p coarse layer of a double-porosity structure were catalyzed at a platinum
loading of 1 0 , 3 , 1, and 0 mg per electrode or 8 , 2 .4 , 0.8, and 0 mg cm of facial
area. The fine layer, on the electrolyte side of the electrode, consisted of a 400-p-
thick bed of uncatalyzed 14-p silver spheres. The results of these experiments are
shown in Figs. 41 through 44. The data for an uncatalyzed double-porosity electrode
a re included for comparison (Fig. 41).
-2
The performance with the 10-mg platinum loading (Fig. 42) was found to be inferior
to that for the uncatalyzed electrode at 0.5 V and at differential pressures of less than
57 cm of water (67 cm of water applied pressure). Under these conditions of relatively
large polarizations, the layer of porous platinum with its flooded pores is too thick for
the diffusion of oxygen to sustain the higher rates of electrochemical reaction; i .e. ,
diffusion limitations occurred. At differential pressures greater than 57 cm, 0 .5 V ,
the performance of the 10-mg catalyzed electrode was better than that of the
78
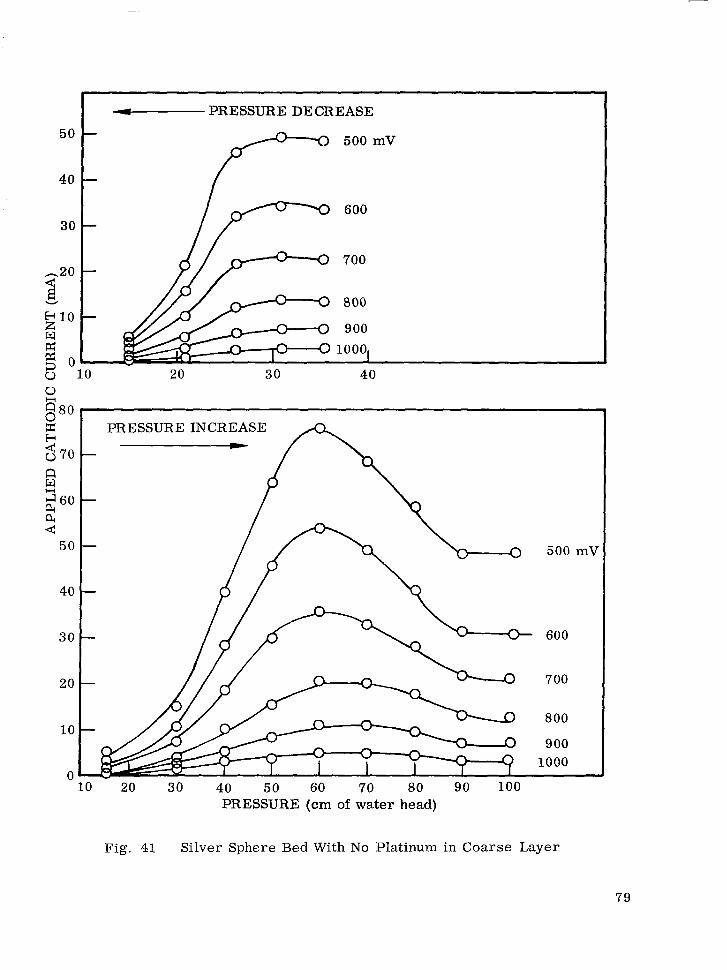
I -PRESSURE DECREASE
50
40
30
-20
3 E 10 w
$ 0 u 10 20 30 40
u -
0 x b 8 70
w
80
n H
60 e, 4
5 0
40
30
20
10
0 10 20 30 40 50 60 70 80 90 100
PRESSURE (cm of water head)
Fig. 41 Silver Sphere Bed With No Platinum in Coarse Layer
79

u w
40
30
20
10
n
- PRESSURE DECREASE p 500 mV
" 10 20 30 40
90
80
70
60
50
40
PRESSURE INCREASE - /
30
20
10
0
500 mV
600 mV
700 mV
800 mV
900 mV
1000 mV
PRESSURE (cm of water head)
Fig. 42 Silver Sphere Bed With 10 mg of Platinum in Coarse Layer
80

40
30
20
0
b
n 80
d n 70
?i PI
4 DI 60
50
40
30
20
10
-PRESSURE DECREASE P 500 mV
10 20 30 40
PRESSURE INCREASE - 500 mV
600 mV
700 mV
800 mV
900 mV
1000 mV
PRESSURE (cm of water head)
Fig. 43 Silver Sphere Bed With 3 mg of Platinum in Coarse Layer
81

PRESSURE (cm of water head)
Fig. 44 Silver Sphere Bed With 1 mg of Platinum in Coarse Layer
82

r
uncatalyzed electrode because the bulk liquid began to be forced from the pores of
the platinum at the higher pressure and performance continued to increase as the
pressure was increased. Conversely, the performance of the uncatalyzed electrode
decreased because its optimum differential pressure w a s exceeded and liquid filaments
for ionic transport were forced out of the electrode. The optimum differential pressure
of the 10-mg platinized electrode w a s not yet reached because the pores in the black
platinum layer on the spheres are smaller than the effective pores between the spheres;
i. e. , the porous platinum tended to cause uncontrolled flooding at the surface of the
large spheres (Section 5).
For low polarizations, e.g. , at potentials greater than 700 to 800 mV, the performance
of the uncatalyzed electrode (Fig. 41) was poorer than for the 10-mg catalyzed electrode
over the entire pressure range studied, up to 85 cm of water (Fig. 42). At the lower
rates of oxygen consumption existing at low polarizations, the thickened film in the
catalyzed electrode no longer caused diffusion limitation. Rather, the increased
surface area of the catalyzed electrode caused it to be superior to the uncatalyzed
electrode within the confines of this low polarization region.
The performance of the electrode catalyzed at a 3-mg platinum level (Fig. 43) did not
differ appreciably from that with the 10-mg platinum level over the pressure range
studied. Only a slight improvement could be seen with the 3-mg loaded electrode.
A better than threefold decrease in platinum content did not suffice to effectively
change performance, apparently because the flooded porous platinum layer was still
thick enough to cause flooding and oxygen diffusion limitations. It can be anticipated
that if the platinum layer is made thin enough, eventually the largest pores in the
porous platinum could become unblocked and unflooded and increased areas of super- meniscus film both on the platinum and on the silver would become available at
pressures lower than the optimum for thick layers (e. g. , see section 4.4). Thin
layers would then give better performance than thick layers of deposited platinum.
However, if the pore sizes and porosity of the deposited platinum a re indeed independent
of the deposited platinum-layer thickness, then as the pressure is increased to the
83

, . . . .. .. - . . . . _ . . . . . . . ." _. . . .
Optimum for the porous platinum, the electrodes having a thicker layer of the platinum
wi l l have the best performance because of their greater surface area, provided the
optimum thickness of the layer is not exceeded and provided gross bubbling from the
electrode's larger pores does not occur.
When the platinum loading was reduced to 1 mg (Fig. 44), a marked change in per-
formance w a s noted when compared with the performances of the 10- and 3-mg
electrodes. An optimum differential pressure peak appeared and the performance
approached that of the uncatalyzed electrode. The platinum content was now so low
that film thickening by surface porosity was much less, and peak formation could
occur. The 1-mg loaded electrode could be compared with 10- and 3-mg electrodes
in much the same way that the uncatalyzed electrode was, and for the same reasons.
At differential pressures of less than 61 cm of water, 0 .5 V , the 1-mg loaded electrode
w a s better, and the reverse was true for larger differential pressures. A t low
polarizations, however, the appearance of the differential pressure peak complicated
comparison. In general, the performance of the 1-mg loaded electrode w a s better
for differential pressures less than 55 to 63 cm of water because of the appearance
of a pressure peak, and poorer for larger differential pressures when liquid filaments
could be forced from the less heavily catalyzed electrode. The pressure at which the
more heavily catalyzed spheres became more effective could now be seen to decrease
from 63 to 55 cm of water as the potential was increased from 700 to 1000 mV because
of the decreasing importance of film thickness or oxygen diffusion limitation (Figs. 42
and 44). For the more heavily catalyzed spheres, even though the large pores between
the silver spheres could be made free of electrolyte, rupture of the liquid filaments
on the surface of the spheres could not occur because of the retention of electrolyte
by the porous platinum, and an optimum pressure w a s not observed in the studied
range of pressures.
Comparisons of the 1-mg (0.8 mg cm ) loaded electrode (Fig. 44) and the uncatalyzed
electrode (Fig. 41) show that the uncatalyzed electrode is now inferior at all potentials,
0.5 to 1 . 0 V, and at al l pressures, 15 to 100 cm of water, even after the attainment of
-2
84

.. .
pressures higher than the optimum differential pressure. Maximum current density
with the 0.8 mg loading was 66 mA at 500 mV. The 1-mg platinum loading
imparts a microstructure on the macrostructure of the spheres which broadens the
peak and increases its height by increasing the surface area, and perhaps by introducing
enough micropores to retain good liquid connections with the bulk electrolyte for ionic
transport, without excessive f i l m thickening. The fact that the optimum pressures are
about the same for the uncatalyzed and 1-mg loaded electrode indicates that the latter
effect is minimal and that the pores of the spheres are providing the governing geometry
for the removal of liquid filaments in the sphere bed. It appears, then, that by reduction
of platinum loading to a 1-mg level a simulated "catalytic effect" is approached in the
observed improvement in performance.
4.8 CATALYST PLACEMENT IN THE ELECTRODE
Experiments were conducted in which a platinized silver sphere layer was placed
toward the electrolyte, in the middle, o r at the gas side of the reaction bed in the
electrode. Silver spheres were used which were 156 y in diameter and which had
about 0.31 mg of platinum in a sphere bed layer 400 p thick. The platinum content
in the 400-p layer was at the same loading density (milligrams per cubic centimeter)
used in the 1-mg platinum loaded electrode (Fig. 43 ). The fine layer of the electrode
was 400 p thick and consisted of silver spheres 14 p in diameter. This fine layer
rested on the 2000 LPI silver screen which was reinforced at the electrolyte side with
a coarse silver screen. The coarse sphere layer consisted of the catalyzed layer
together with a layer or layers of uncatalyzed silver spheres of the same diameter,
156 p, such that the total coarse layer thickness was 1300 p . The following combinations
were used:
Gas 400-p catalyzed silver spheres, 156 p in diameter
900-p uncatalyzed silver spheres, 156 p in diameter
85

400-1.1 uncatalyzed silver spheres, 14 1-1 in diameter
2000 LPI silver mesh (reinforced), 4'1.1 thick
Electrolyte
Gas
450-1.1 uncatalyzed silver spheres, 156 ,u in diameter
400-,u catalyzed silver spheres, 156 ,u in diameter
450-,u uncatalyzed silver spheres, 156 ,u in diameter
400-1.1 uncatalyzed silver spheres, 14 ,u in diameter
2000 LPI silver mesh (reinforced), 4 ,u thick
Gas
900-,u uncatalyzed silver spheres, 156 ,u in diameter
400-,u catalyzed silver spheres, 156 ,u in diameter
400-,u uncatalyzed silver spheres, 14 p in diameter
2000 LPI silver mesh (reinforced), 4 ,u thick
Under the conditions of the experiment and from the previous results, the 14-p-diameter
layer is believed to be flooded. To further assure this flooding, the fine layer was
brought to a differential pressure, P , near zero before the coarse layers were added
at a P of 35 cm of water head. The P of the electrode was then lowered to 5 cm
of water head and the results taken for increasing P .
The results for the three electrodes at 500 mV are shown in Fig. 45 . It was found
that the performances of the electrodes generally improve as the platinized layer is
brought closer to the electrolyte for both low and high polarizations but that improve-
ment was less when the platinized layer was changed from the gas side to the middle
than when changed from the middle to the electrolyte side of the 156-,u sphere bed.
Performance was greatly improved when the platinized layer was placed directly on
the fine sphere bed, and a considerable broadening of the peak can be seen as well
as an increase in peak height, Fig. 45 . Such an effect would be anticipated if a decrease
in local current density took place in the uncatalyzed sphere bed as the distance from
86

ELECTROLYTE SIDE
\ MIDDLE
GAS SIDE
PRESSURE (cm of water head)
Fig. 45 Comparison of Performances With .Three Types of Catalyst Distribution at 500 mV Versus Hydrogen Reference in Same Solution. Silver oxygen elec- trodes are compared with small amount of platinum catalyst at gas side, middle, and electrolyte side of coarse layer
87
the coarse/fine interface toward the gas was increased because of the limitations in
ionic transport through the liquid filaments and films in the electrode. Further, the
performances of the three electrodes are separated more after the optimum pressure
is exceeded, when ionic transport limitation is more important than at the optimum
pressure. For pressures less than the optimum, the placement of the platinized
spheres at the fine, flooded layer also results in a relatively large improvement in
performance, whereas the other two electrodes have about the same performance.
Apparently, the ion transport limitations are important even in this partially flooded
regime when the thickened films or liquid filaments are present. However, the
described improvements are found at low current densities (Figs. 46 and 47), which
suggests that the optimum electrode thickness has become quite small, on the order
of 400 p in this partially flooded, low-pressure regime (sections 4.3 and 4.4).
Ln another experiment, the amount of platinum for the same contact area, 1.25 cm , 2
was maintained at 3 mg while the thickness of the coarse layer of 156-p spheres was
reduced from 1300 to 433 1.1. The results of this experiment are shown in Fig. 48,
which should be compared with Fig.43 which gives data for the same electrode but
with 3 mg of platinum in a 1300-p layer instead of in a 433-p layer. A decrease in
performance occurs with the thinner electrode, probably because of the excessive
thickness of the flooded porous platinum (section 4.7) and the lack of attainment of an
optimum electrode thickness. The loading density (mg/cm ) for the 433-1.1 electrode
(Fig. 48) is about twice that of the 1300-p electrode with 3-mg platinum (Fig. 43) and
about the same as the comparable electrode with the 10-mg platinum loading (Fig. 42).
The thinner electrode does not perform as well as these other two electrodes in the
pressure range studied. Performances are still improving at the highest pressures
tested, and comparisons could not be made at an optimum pressure.
3
4.9 GOLD AS AN OXYGEN CATALYST
Gold-coated silver spheres, 156 p in diameter, were used in a coarse layer, 1300 u
thick, on top of a 400-p-thick fine layer of 14-p silver spheres. The results are
given in Fig. 49. In Fig. 50 are given the similar curves for a 50/50 mixture
88

500 mV
- 0 - 700 mV
0
-
-
n u 900 mV
I 1 I 10 20 30 40 50 60 70 80 90 100
PRESSURE (cm of water head)
ELECTRODE:
Gas, Oxygen at - 1 atm, 15 cc min- 900 p Ag 156 ,u Diameter 400 p Ag 156 ,u Diameter, 0.31 mg Pt
400 ,u Ag 14 p Diameter
5 ,u Ag Mesh 2000 LPI
0.5 mm Ag Mesh - 40 LPI Liquid, 13.5 M KOH , 95 O C, 1.25 cm2 Contact
1
Fig. 46 Performance of a Silver Oxygen Electrode With Platinum Catalyst at the Electrolyte Side
89

80
PRESSURE (cm of water head)
ELECTRODE:
Gas , Oxygen at - 1 atm, 15 cc min-'
400 p Ag 156 p Diameter, 0.31 mg Pt 900 p Ag 156 p Diameter
400 p Ag 14 p Diameter
5 p Ag Mesh 2000 LPI
0.5 mm Ag Mesh - 40 LPI
Liquid, 13.5 M KOH, 95 O C y 1.25 cm2 Contact
0
Fig. 47 Performance of a Silver Oxygen Electrode With Platinum Catalyst Distributed at the Gas Side
90

90
80
h
4 E 70
E
5
v
60
u u 0
50
E;
8 40
30 2i PI 2 20
10
0
PRESSURE INCREASE - 500 mV
PRESSURE (cm of water head)
Fig. 48 Silver Sphere Bed With 3 mg'of Platinum in Coarse Layer. 400-1.1 Fine Layer of 14-p-Diameter Spheres; 433-p Coarse Layer of 156-p-Diameter Spheres
91

80
70 E Y
B 60
P4
2 50 u
$ 40 B ' 30
E
n 2 I4
PI 4
20
10
0
PRESSURE (cm of water head)
ELECTRODE:
Gas, Oxygen at - 1 atm, 15 cc min- 1
1300 p Au 156 p Diameter, Ag Substrate
400 p Ag 14 p Diameter
5 p Ag Mesh 2000 LPI
0.5 mm Ag Mesh - 40 LPI
Liquid, 13.5 M KOH, 1.25 cm2 Contact, 95 "C
Fig. 49 Performance of Oxygen Electrode With Gold a s the Principal Catalyst
92

8o r 70 b
n 3 20 PI
4 PC
10
Q 0 10 20 30 40 L
500 mV
700 mV
900 mV n n
v I I I I I 1
50 60 70 80 90 100 PRESSURE (cm of water head)
ELECTRODE:
Gas, Oxygen at - 1 atm, 15 cc min-l 1300 p of 50/50 Mix of Au (on Ag Substrate) and Ag Each 156 p Diameter
400 p Ag 14 p Diameter
5 p Ag Mesh 2000 LPI
0 . 5 mm Ag Mesh 40 LPI
Liquid, 13.5 M KOH, 1.25 cm2 Contact, 95 O C
Fig. 50 Performance of Oxygen Electrode With Gold and Silver as the Principal Catalysts
93

Of silver and gold-coated spheres built up to the same thickness and with the same
diameter, 156 p. These results of Figs. 49 and 50 .may be compared with the
results obtained with the fine layer by itself without a coarse layer present, Fig. 51.
The fine layer contributes more to performance as the differential pressure is increased, and eventually its contribution should mask the contribution of the coarse
layer, i. e., at differential pressures approaching (156/14) 42 o r 457 cm of water.
In the utilized range of differential pressure, it is seen that the gold-coated silver
spheres contribute about as much as the silver spheres of 156-p diameter by a
comparison of Figs. 49 and 50 and by comparison with the results for a similar
all-silver electrode, Fig. 41. The gold coating is believed to be nonporous, from
superficial microscopic examinations, and these spheres were not attacked by nitric
acid. The use of gold as an oxygen catalyst was suggested by its high specific rate
constant in the decomposition of dilute, alkaline hydrogen peroxide solutions (Ref. 29).
4.10 NICKEL AS A SUBSTRATE MATERIAL FOR PLATINUM
The use of platinum catalyst on nickel spheres was found to give performances almost
as good as with platinum on silver spheres of the same diameter and with the same
platinum loading. Nickel spheres, about 156 p in diameter, were catalyzed with platinum
to a level of 10 mg per 1 . 2 ern for a 1300-p-thick bed placed on a 400-p layer of 14-p
silver spheres. The results are given in Fig. 52 , and a dashed line shows the results
with silver spheres with the same platinum loading, thickness, and diameters from
Fig. 52 . The platinum-on-silver combination yields better results than the platinum-
on-nickel combination, although the results were comparable and hardly distinguishable
at lower polarizations, i . e . , a t 900 mV versus the hydrogen reference electrode.
2
4.11 THE EFFECT O F TEFLON LOADING
A minimal amount of Teflon TFE powder having 1-p particles (advertised) of 1 7 mg was mixed with 1 g of silver spheres, 156 1-1 in diameter, which had previously been
catalyzed with 10 mg of platinum (as outlined in Section 3) and which occupied a
94

60
50
40
30
20
10
0 0 10 20 30 40 50 60 70 80 90 100
PRESSURE (cm of water head)
ELECTRODE:
Gas , Oxygen at - 1 atm, 15 cc min-' 400 p Ag 14 p Diameter
5 p Ag Mesh 2000 LPI
0.5 mm Ag Mesh 40 LPI
Liquid, 13.5 M KOH, 1.25 cm2 Contact, 95'C
Fig. 51 Performance of Silver Oxygen Electrode With Only a Fine Layer Present
95

PRESSURE (cm of water head)
E LE CTRODE :
Gas , Oxygen at - 1 atm, 15 cc min-l
1300 p Ni 156 p Diameter, 10 mg Pt 400 1.1 Ag 14 1.1 Diameter
5 p Ag Mesh 2000 LPI
0.5 mm Ag Mesh - 40 LPI Liquid, 13.5 M KOH, 1.25 cm2 Contact, 95°C
Fig. 52 Performance of an Oxygen Electrode With a Platinum Catalyzed Nickel Coarse Layer
96

1300-p-thick coarse layer in the 1.2 cm of the electrode. A fine layer was used, as
previously described (section 4.10). An infinitely high ohmic resistance was found
for the coarse layer, and when this electrode was run no appreciable improvement
was noticed over the fine layer by itself (compare Figs. 51 and 53). A 17"mg TFE
loading had previously been used successfully with black platinum (Ref. 30), but the
surface area of the silver spheres was too low for such a loading. Less and less Teflon was mixed with the spheres until the specific resistance was found to be
increased only slightly. This corresponded to a loading of 4.4 x mg (3.5 x
rngcm 2, of Teflon for the same number of catalyzed spheres as above or to about
eighty 1-p Teflon particles per silver sphere 156 p in diameter. The results with this
sample are given in Fig. 54. A substantial improvement is seen over the 10-mg
(8 mg cm of facial area) platinum-loaded spheres without Teflon a t the differential
pressures tested (Fig. 42); and a t 42 cm of water differential pressure the current
at 500 mV increased from 58 mA (46 mA cm ) to 98 mA (79 mA cm-2). Improvement
is more pronounced at lower differential pressures in the presence of small amounts
of Teflon. The effect of Teflon appears to be to lower the differential pressure
required to yield optimum performance. The use of too much Teflon destroyed
the activity of the sphere bed by increasing its electrical resistance to prohibitively
large values.
2
-
-2
-2
These results tend to confirm the recently reported work of Burshtein et al. (Ref. 31),
which indicates that electrode performance experiences a maximum as Teflon content
in platinum electrodes is increased from 0 to 100 percent. The curves of Burshtein
et al. resemble the curves obtained in this work, with the differential pressure axis
replaced by a Teflon-content axis, e.g., as in Fig. 50. Teflon content should act
in much the same way as differential pressure if the presence of small hydrophobic
particles in the electrode causes the formation of supermeniscus film areas adjacent
to the particles. The correct placement of Teflon particles and porous Teflon fila-
ments can, in theory, cause a favorable distribution of liquid and gas in an electrode
resembling that distribution at the optimum differential pressure described in
section 4.2 and treated in Section 5.
97

80
70
2 E - 60 E w 5 u
50
40
0 13 z E 30 s n g 20 Cb PI c 10
0
500 mV
700 mV
900 mV
0 10 20 30 40 50 60 70 80 90 100 PRESSURE (cm of water head)
ELECTRODE:
Gas, Oxygen at - 1 atm , 15 cc min-1
1300 p Ag 156 1.1 Diameter, 10 mg Pt, 17 mg TFE Teflon Powder 400 p Ag 14 p Diameter
5 p Ag Mesh 2000 LPI
0.5 mm Ag Mesh 40 LPI
Liquid, 13.5 M KOH , 1.25 cm2 Contact, 95 C
Fig. 53 Performance of Platinum Catalyzed Silver Electrode With 17 mg Teflon Powder
98

PRESSURE (cm of water head)
ELECTRODE:
Gas, Oxygen at - 1 atm, 15 cc min-l 1300 p Ag 156 p Diameter, 10 mg Pt, 4.4 x 10⁻³ mg TFE Teflon Powder
400 p Ag 14 1 Diameter 5 p Ag Mesh 2000 LPI
0.5 mm Ag Mesh 40 LPI
Liquid, 13.5 M KOH, 1.25 cm2 Contact, 95°C
I / Without
0 .I&’ Teflon (500 mV)
/ /
/
10 20 30 40 50 60 70 80 90 100 - - 1
10
Fig. 54 Performance of Platinum Catalyzed Silver Electrode With 4 x mg Teflon Powder
99

4.12 BONDING OF SILVER I N THE ELECTRODE
In the described experiments with silver spheres, 86 p in diameter or less, the silver
sphere bed could be removed from the electroformed mesh after an experiment, often
as a solid piece. The solidity of the porous mass was more or less retained even
after soaking in distilled water, but it could easily be broken up with a glass rod.
The electroformed mesh also had a tendency to stick to the sphere bed, but not as much as with the spheres. With the few measurements taken before these structures
crumbled, it was found that the specific resistance of the bonded porous mass was
very low, approaching that of the silver metal. It was determined that the bonding
did not occur at open circuit but only after the electrode had been subjected to cathodic
currents while acting as an oxygen electrode.
In Fig. 55 are shown photomicrographs of a cross section taken through a porous
mass of the agglomerate of silver spheres. This bonded agglomerate w a s obtained
by permitting a 3000-1.1 bed of silver spheres, about 38 1.1 in diameter, to remain for
approximately 3 hr at 1 2 mA cm at about 500 mV and 25 cm of water differential
pressure without preflooding of the bed. Vacuum impregnation with epoxy, polishing,
and etching were performed in such a way that no smearing or overlap of metal was possible. In the plane of sectioning, metal bridges at the sphere-to-sphere contacts
were found as shown, and these bridges comprise the structural bonds that hold the
porous mass together.
-2
Little is known of this bonding mechanism. It is considered that the bridges may be
associated with a continual oxidation of silver by oxygen and a reduction of dissolved
Ag20 (Ref. 32) by the applied cathodic current. Such a process may help surface
diffusion of silver (Ref. 33), or it may be the basis for assuming diffusion of Ag 0 2 into the film-thickened region between the spheres where silver is then deposited.
It has also been pointed out (Ref. 34) that if two pieces of metal are brought into
atomic contact with one another, they wi l l weld together, regardless of temperature.
This does not happen on ordinary contacts between metal surfaces, mainly because
100

Fig. 55
. ..
. .

each metal contains a film of oxide or other substance which prevents atomic contact.
Perhaps under the conditions with cathodic currents, when freshly formed silver
atoms are presented, atomic silver is made more available. This is an alternate
explanation, which may be used to explain some of the transient responses that have
been observed.and which is perhaps more acceptable because silver oxides should be
reduced rapidly at the polarized potentials of the working electrode, e. g . , at potentials
versus the utilized hydrogen reference of less than 1 .17 V for Ag20 (Ref. 35).
4.13 ELECTRODE RESPONSE WITH TIME
It was observed throughout the work with the all-silver electrodes that potential
gradually changed in a sense opposite to its original change after the application of
a constant current. For example, after a relatively large cathodic current was
applied, the potential might fall immediately to 600 mV and then r i se to a steady value
of 620 mV after 7 min. After the cathodic current w a s reduced, the potential might
r ise to 900 mV but then drop to a steady value of 885 mV after 10 min. Such behavior.
has been observed by others (e. g. , Ref. 15). The sense of these changes is in
keeping with the suggestion that the removal of residual surface oxides is associated
with good catalysis, and that their formation is associated with poor catalysis; i. e.,
oxygen reduction occurs more rapidly via weak adsorption than by strong adsorption,
which is always competitive. The silver bonding described in the previous section
would then occur more readily at heavier cathodic currents, as observed, despite
the presence of an oxidizing atmosphere because of the potential at the electrode.
Another typical potential response behavior w a s the slow attainment of a steady state
value after a current change for differential pressures below the optimum value,
whether o r not the electrode was preflooded. Relaxation times were typically 20 to
30 min. The thickened film apparently caused a longer time for equilibration of the
system with respect to its transient intermediates. Conversely, at the optimum
differential pressure, such potential responses were immediate. The volume of
electrolyte in the interconnected network of liquid filaments throughout the electrode
102
was then minimized, i. e. , just before their rupture or expulsion by a slight increase
in pressure. However, above the optimum pressures, the potential responses again
became sluggish, with relaxation times of about 2 to 5 min. For the slow potential
responses noted above, response times were slightly longer when the cathodic current
was increased.
4.14 SUMMARY AND CONCLUSIONS
The high performance of film-type oxygen cathodes is shown to depend on the formation
of continuous networks of gas and liquid in the porous medium. Disruption of either
network, by excessive flooding or by rupture of liquid filaments at low flooding levels,
generally wi l l cause a deterioration in electrode performance. In a ser ies of related
experiments, the importance of this internal liquid configuration was demonstrated,
and it was shown how laboratory electrodes that are designed to be well characterized
can be used to provide a well-controlled liquid distribution to yield a s much as 50 mA
crn at 500 mV from an all-silver electrode having only 29.6 cm of internal surface
for each square centimeter of electrode-electrolyte contact area.
-2 2
It was found that differential pressure, optimum electrode thickness, effective pore
size, and pore size distribution are mutually dependent and that this dependence is
governed by the differential pressure across the system which affects the internal
liquid configuration. A number of experimental examples are given which can be
explained and related in te rms of these dependences. A s differential pressure or
sphere diameter is decreased, all other conditions being the same, optimum electrode
thickness is increased until the onset of severe flooding, when it is decreased.
In other experiments, it was determined that platinized nickel structures were
comparable in behavior to platinized silver structures, although slightly poorer;
that gold could act as a suitable oxygen catalyst; and that Teflon effectively acts as though it imparts a differential pressure to the electrode. In catalyst distribution tests,
it was found that a catalyst is most effective when placed at the electrolyte side of the
electrode when the catalyst w a s platinum deposited on a silver substrate by chemical displacement.
103

Section 5
PENDULAR-FUNICULAR TRANSITION STATE THEORY
5 . 1 INTRODUCTION
An interesting series of papers by Haines appeared from 1925 to 1930 (Refs. 1-4).
Haines studied the infiltration of soils with liquids and also the infiltration of beds of
small spheres with liquids. He was able to show that two states of liquid internal
configuration exist in partially flooded porous media, i. e. , the pendular and the
funicular, as shown in Fig. 56 (Ref. 9) . In the pendular state the liquid in the
porous medium is distributed as isolated, pendular bodies in the form of annular
rings around the points of contact of the particles. In the funicular state the pendular
bodies have become joined, and the liquid forms a continuous network across the
porous medium in tortuous o r funicular paths. The gas phase is also continuous
throughout the porous medium in this region. A s liquid infiltration is increased,
the saturation regime or completely flooded condition is finally attained.
In Fig. 57 (Ref. 3) is shown the beginning of a transition from the pendular to the
funicular state for an ideal case of hexagonal closest packing of uniform spheres.
The crosses represent sphere-to-sphere contacts, 12 for each sphere, and the shaded
areas represent the liquid regions. The dashed lines around the crosses show the
maximum contraction of the liquid surface due to the concave curvature of the liquid.
The dashed lines forming a circle between three spheres represent the shape of the
liquid surface at that position. A t the first stage of coalescence, Fig. 57, the liquid
bodies just touch each other and the funicular state is being formed. The dry area (supermeniscus film area) of each sphere is divided into eight portions of triangular
symmetry and six portions of quadrangular symmetry. At the final stages of coalescence,
Fig. 58, flooding occurs simultaneously throughout the bed to enclose bubbles as shown
(Ref. 3). This might be considered to form a regime which is pendular with respect to
the gas.
104

Fig. 56 Drawing of Pendular (a) and Fbnicular (b) Saturation Regime in the Case of an Idealized Porous Medium Consisting of Packed Spheres
105

106
L
Fig. 57 Distribution of Liquid at First Stage of Coalescence
Fig. 58 Distribution of Liquid After Final Stage of Coalescence

I-
In Fig. 59 (Ref. 3) is shown the shape of the gas passage through the bed a t the onset
of the funicular regime as shown in Fig. 57. Crosses represent sphere-to-sphere
contacts as in Fig. 57. The dashed lines now outline the areas where gas contacts
the spheres, and the heavy circles are the gas passages between three spheres per-
pendicular to the plane of the paper. A t the lower left, this gas passage is sectioned
somewhere above the plane of the paper to show how the shape of the circular gas
passage changes. The heavy lines around the crosses now show the contraction of the
liquid surface because of the liquid's concave curvature. In section A of Fig. 59, the
dashed line is continued as a heavy line to show how the liquid shape is changed as
further flooding occurs, and the very heavy line in section A represents the liquid
shape at the final stage of coalescence. These configurations are necessarily idealized
in a closest packing arrangement to facilitate understanding, and, in practice, for a
loose packing arrangement, are distributed throughout the media in a manner which
depends on the average number of contacts or nearest neighbors of each sphere.
5.2 THEORY
For a gas electrode, the most favorable liquid configuration for a bed of spheres should
be formed with a funicular regime that is only slightly removed from the pendular-
funicular transition state, i. e., a configuration closely resembling that shown in
Fig. 57. With this configuration, interconnected and continuous funicular liquid paths
would be ideally established throughout the sphere bed to assist ion transport to the bulk
electrolyte; gas passages would remain open and form a continuous, interlacing network
(e. g. , Fig. 59) to facilitate gas transport; and isolated patches of supermeniscus film
adjacent to funicular liquid could act efficiently because of the short path from the
electrochemical reaction site beneath the film to the funicular liquid. Electrode
performance should become poorer as a result of a slight flooding because of the loss of
supermeniscus film area of this funicular state (differential pressure too low) or as a result of a slight unflooding because of a disruption of the continuous network of liquid
throughout the bed to form the pendular regime with its poor ionic conductivity (differential
pressure too high). This would require the existence of an optimum differential pressure.
107
I
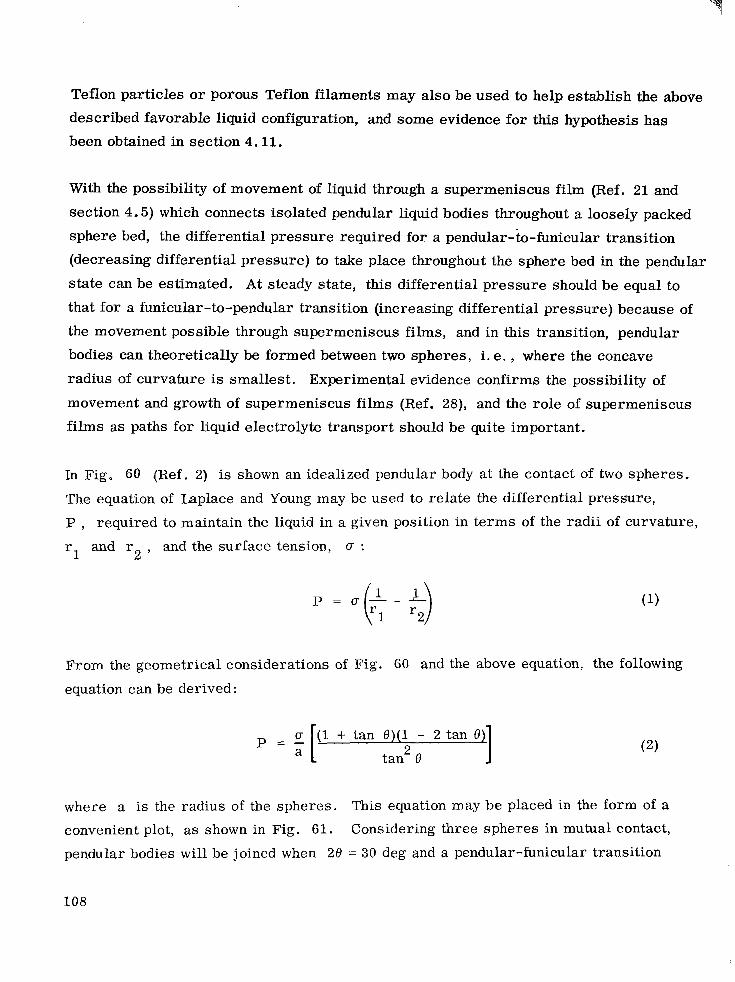
Teflon particles o r porous Teflon filaments may also be used to help establish the above
described favorable liquid configuration, and some evidence for this hypothesis has
been obtained in section 4.11.
With the possibility of movement of liquid through a supermeniscus film (Ref. 21 and
section 4.5) which connects isolated pendular liquid bodies throughout a loosely packed
sphere bed, the differential pressure required for a pendular-&funicular transition
(decreasing differential pressure) to take place throughout the sphere bed in the pendular
state can be estimated. At steady state, this differential pressure should be equal to
that for a funicular-to-pendular transition (increasing differential pressure) because of
the movement possible through supermeniscus films, and in this transition, pendular
bodies can theoretically be formed between two spheres, i. e. , where the concave
radius of curvature is smallest. Experimental evidence confirms the possibility of
movement and growth of supermeniscus films (Ref. 28), and the role of supermeniscus
films as paths for liquid electrolyte transport should be quite important.
In Fig. 60 (Ref. 2) is shown an idealized pendular body at the contact of two spheres.
The equation of Laplace and Young may be used to relate the differential pressure,
P , required to maintain the liquid in a given position in terms of the radii of curvature,
r and r and the surface tension, cr : 1 2 '
p z c J - - - (.: :$ From the geometrical considerations of Fig. 60 and the above equation, the following
equation can be derived:
P = - [ cr (1 + tan 0 ) ( l - 2 tan 0) a 2 tan 0 1
where a is the radius of the spheres. This equation may be placed in the form of a convenient plot, as shown in Fig. 61. Considering three spheres in mutual contact,
pendular bodies wi l l be joined when 28 = 30 deg and a pendular-funicular transition
108

Fig. 59 Perspective Drawing Showing Shape of Continuous Gas Space at First Stage of Coalescence, With Development of Final Stage Shown at One Neck
Fig. 60 Diagram Showing Annular Liquid Body Between Two Spheres
109

13
12
11
10
9
8
7
6
5
4
3
2
1
0
ANGLE 2 8 (deg)
Fig. 61 Dependence of Internal Bulk Liquid Configuration on Differential Pressure for Ideal Sphere Bed
110

will take place, correspondingly, in a loosely packed sphere bed, provided three
spheres are in mutual contact frequently enough so that the formed connections are
continuous. From Eq. (2) and Fig. 61, it can be seen that for 28 = 30 deg , the
value of the differential pressure is 4.1 o/a . For only a few degrees from 30 deg
P may vary from 7 to 2 o/a . The penetration pressure of the sphere bed should be
approximately 4.5 o/a (e. g. , see Ref. 5),
An expression for the fraction of surface area covered with liquid can also be made from the assumed geometry:
where n is the number of nearest neighbors. In Fig. 62, f is plotted as a function of
P and n with the use of Eqs. (2) and (3). Twelve nearest neighbors are present
in a closest packing configuration with a fractional void volume (fvv) of 0.2595, whereas
six nearest neighbors are present in a "most open" packing with a 0.4764 fw. Our
observed fw is 0.41 (section 3.2). Using a linear correspondence, as suggested by
Smith (Ref. 36),our beds have eight nearest neighbors and from Fig. 62 approximately
55 percent of the sphere surface is covered by bulk liquid for an ideal sphere bed with
eight nearest neighbors. A s the differential pressure is lowered below 4.1 a/a, the
remaining film area is quickly lost and vanishes at about 1 . 2 a/a for this idealized case.
5.3 CORRELATION WITH EXPERIMENT
The described observation or̂ an optimum differential pressure for an oxygen gas
electrode comprising a bed of spheres (section 4.2) is predicted by the p-f transition
state theory. Also, the shape of the peak near the optimum differential pressure can
be explained by the theory, e.g. , Fig. 27. A s pressure is increased and the f-p
transition state is approached, a gradual formation of larger supermeniscus film
areas would occur. For small differential pressures greater than the differential
pressure at the optimum pressure, a sudden decrease in performance would occur
as observed when the funicular filaments are ruptured.
111

Fig. 62
0.2 0.4 0.6 0.8 Fraction of Surface Covered by
Bulk Liquid
NEAREST NEIGHBORS
12
10
8
6
Surface Coverage by Lnternal Bulk Liquid in Ideal Sphere Bed
112

r
By comparing the bubble pressure from a fritted glass disk in water and in 13.5 M KOH
at 95'C , an evaluation of the surface tension of the 13.5 M KOH at 95°C was made and
found to be 90 f 1 dyne cm-l. This value may Be used to estimate the p-f transition
differential pressure with the following equation:
P = 4.1- a (T
For a bed of 156-p spheres in contact with 13.5 M KOH at 95"C, P should be 48 cm of
water, a value which should be compared with the measured 42 c m of water that was
found after the sphere bed had been wetted but not completely flooded with a number
of electrodes (e.g., Fig. 26). This agreement is considered to be good. It is noted
that in the experiments of Section 4 the differential pressure was not cycled to determine
a steady state optimum pressure. Instead, the pressure was only lowered from its
initial value and then increased, and some incomplete wetting occurred, so that the
observed optimum differential pressure should be somewhat less than the theoretical.
In a similar experiment with glass spheres, 130 p in diameter, Haines determined
that for the first capillary rise and drainage the differential pressures should be 1.4
and 3.5 a/a, respectively (Ref. 37). From the corresponding observations of Fig. 26,
the values of 16 and 42 cm of water are used to estimate the surface tension of 13.5 M KOH
at 95°C as 9 1 + 3 dynes cm which agrees well with the independently measured value
of 90 f 1 dyne cm . The agreement with the theory is thus good considering that there
is an 8-percent average deviation of the average sphere diameter of utilized 156-p
spheres and that only small deviations from the p-f transition configuration result in
large changes in the optimum differential pressure, Fig. 61.
-1
-1
Indirect evidence for the theory can be obtained by comparing the work of Lindholm
and Edwardsson (Ref. 24) and Haines (Ref. 1) , who measured the ohmic resistance
of liquid in porous media under partially flooded conditions. Haines made these
measurements with the purpose of relating conductivity changes to the transition
between the pendular and funicular regimes, while Lindholm and Edwardsson wished
to relate the conductivity to the electrode performance. Examination of the conductivity
curves (resistance curves) of both workers reveals a linear dependence until a
113

"shoulder" or change in slope is formed; Haines ascribes this shoulder to the transition
between the two regimes, and from Lindhohn and Edwardsson's work it can be seen
that the shoulder corresponds approximately to the optimum differential pressure.
The pendular-funicular transition and the appearance of an optimum differential
pressure thus can be related by these two separate studies. This comparison may
be considered as evidence of the importance of the funicular regime, removed by
very small differential pressures from the pendular regime, as a condition where
the film area is still maintained and where good ionic conductivity is supplied.
5.4 SUMMARY
A theory has been developed which explains that electrodes should be designed to be
well characterized s o that they can be used to provide a certain kind of controlled
liquid distribution. The importance of the pendular-funicular transition state for
internal liquid configuration was shown in its relation to the design and performance
of oxygen gas electrodes.
114

Section 6
EFFECTS OF STRUCTURE DURING EVAPORATION
In this section, some effects of evaporation from gas electrodes are outlined. Gas
electrode structure can have an additional influence in such cases. To adequately
describe these evaporation effects, attention must be given to the pores and regions
of the porous mass and to a method for representing the porous mass.
A pore may have changes in properties along its path for a continuous through-path
from the gas side of the electrode to the bulk liquid. A sequence of zones may be
present along this path, with each zone distinguished from others by differences in
location and geometry and in physical and chemical properties. When these zones
bear a certain relation to each other and to the porous mass and when some of these
zones form regions which are f ree of liquid, evaporation from the electrode can
materially affect performance. In this section, some of these relations and conditions
a r e given for the zones and regions ("regions" being used to mean aggregates of zones
having approximately the same properties).
To facilitate discussion, a system of symbols is introduced to represent a continuous
through-path of an elementary pore with its zones in the following manner (e. g . ,
see Ref. 38):
g/sg-l/sg-2/sg-3/. . . /slg-l/slg-2/slg-3/. . . /sl-l/sl-2/sl-3/. . . /1
In this system, the first letter represents the principal phase present, and, in the
electrode, other letters consecutively represent the phases toward the central portion
of the pore. Diagonal lines are used to separate zones having different pore properties
which are numbered consecutively from the gas side for the gas-filled portions of the
pores, sg; the liquid-filled portions, s l ; and the gas-filled portions that contain a
115

liquid film coating the pore walls, slg. A series of such elementary paths, usually
interconnected, is considered to form the electrode. A high degree of order of
the zones may exist in regions that form layers parallel to the electrode faces. as in the double-porosity electrode, or order may be established in channels conslsting
of single pores or groups of pores in an interlaced and interconnected system, as in a Teflon-impregnated electrode. Capital letters are substituted for small letters when
symbols represent regions having a higher degree of order or regularity of the pores
(e. g., in Fig. 63).
6.1 THE PHENOMENA OF BUBBLING AND DISPLACED REGIONS, AND ELECTRODE DESIGN
In general, saturation should exist with water vapor in the gaseous portions of the slg zones. Here diffusion coefficients are on the order of 0.1 cm sec-l, and the pores
a re smal l (about 10 cm) so that D/x "= 100 cm sec . For an appreciable vapor
pressure, it can be expected that saturation should be attained quickly in film-coated
pores when the pore lengths are much greater than their effective diameters. Diffusion
of gas toward slg can occur in the porous mass, with an accompanying total pressure
build up at s lg if s lg is separated from g by a liquid-free or wet-proofed zone, sg, if
the bulk gas is unsaturated in vapor and at a higher partial pressure at g than at slg,
and if the pore at sg is sufficiently small (Ref. 39 ). It is necessary for some degree
of order to exist and that dry regions be next to the gas region. Without order, the
total pressure may be quickly relieved through pores connected to slg, and when slg
zones a r e in contact with the gas region evaporation can saturate gas regions where
the open mouths of the pores have dry or hydrophobic zones. A s a general example,
for the system G/SG/SLG/SL/L where the bulk gas is unsaturated in water vapor,
evaporation from SLG and diffusion of vapor toward G wi l l be accompanied by the
formation of a water vapor partial pressure gradient in SG. For an initially constant
total pressure in the pores, an equal and opposite partial pressure gradient of gas is formed, and gas is induced to diffuse toward SLG. If the pores of SG are small enough,
e.g., less than about 0 . 1 p in effective diameter at about room temperature and pressure
(Ref. 40), and if bubbling is prevented, the total pressure in SLG wi l l r i se as gas diffuses
2
-3 -1
116

G/SG/SLG/SL/L
0
GAS
mic roporous Teflon film
LAYER STRUCTURE
LIQUID
l i q u i d f i l l e d ”-- pores
gas f i l l e d pores with l i q u i d f i lm covering pore walls
Fig. 63 Schematic Representation of a Double-Porosity Electrode With a Microporous Teflon Film
117

into SLG until the gas partial pressure at G equals the gas partial pressure in SLG.
This diffusive process is independent of the total pressure difference. The maximum
possible increase in pressure in SLG over that at G is thus the difference in
water vapor partial pressures existing in these two regions. In practice, the
increase may be expected to be somewhat less because of diffusion layers which are formed at the G/SG and SG/SLG interfaces and because of the wide distribution in
pore sizes encountered with most porous media. The possibility of a total pressure
buildup of this type was clearly shown by Wheeler in his treatment of catalyst pores
(Ref. 40 ) .
If the pores in SL are sufficiently large for the system G/SG/SLG/SL/L, the developed
pressure may be relieved by the formation of bubbles, as shown in Fig. 64. This
bubble formation can seriously disturb operation of a fuel cell system, and it constitutes
a problem that has been studied by several workers (Refs. 41, 42, 43).
Bubbling can be prevented in the following ways: (1) The gas at G may be saturated in
water vapor at the temperature of the operating electrode s o that counter diffusion
does not take place; (2) a total pressure may be applied to L, balancing the difference
in water vapor partial pressure between G and SLG so that the gas partial pressure is
constant; (3) a large fraction of the interconnected pores or all the isolated pores may
be made to have their effective diameters in SG large enough so that convective inter-
play can offset the diffusive processes and relieve any developed total pressures toward
the gas side, i. e . , larger than about 1 1-1 for conditions near those of room temperature
and pressure; or (4) the pores in SL may be made s o small and hydrophilic that a bubble
cannot be released because of the capillary attraction of the liquid. Actually, constant
saturation of G is difficult during electrode operation because temperatures at SLG or SL may fluctuate and differ from those in G. Design considerations, such as the
attainable electrode strength, often preclude application of pressure to L, s o that
the most practical approach is usually to control pore size at SG or SL.
118

C)/SG/SLG/SL/L - 0- - 'le
0
- vapor
*G
Fig. 64
SG SIli SL L
Bubbling Caused by Evaporation
The total pressure at the electrode's gas side, PG , is less than
the total pressure in the electrolyte, PL , but the partial pressure
of the gas at the electrode's gas side, (Fg)G , is greater than its partial pressure in the electrolyte, (Fg)L .
119

A more subtle influence on electrode performance should result for evaporation from
the system G/SG/SLG/SL-l/SL-B/L when pores in SG are sufficiently small, i. e., in
the transition-or Knudsen flow region (Ref. 43). The developed total pressure in SLG could displace electrolyte from SL-1, while the pores in SL-2 may be made so small
that bubbling is prevented, as shown in Fig. 65. The occurrence of displacements
of this kind was suggested by Palmer, Fishman, and Koslow (Ref. 44 ). It is further
suggested that the formation of new SLG regions by pressure displacement may
materially improve performance in some cases by making more void volume available
for electrochemical reaction beneath a supermeniscus film which could extend through-
out portions of this volume (Refs. 28 , 45 ), by causing a more favorable pendular-
funicular transition state, and by causing an increase in the partial gas pressure at SLG regions. A pressure balance is formed by which regions are made available for
electrochemical reaction; i. e., the system would then be changed to
G/SG/SLG-l/SLG-2/SL/L with SLG changed to SLG-1, SL-1 to SLG-2, and SL-2 to SL (Fig. 65).
Such pressure displacements may occur in Teflon-impregnate.d electrodes (Figs. 66
and 67 ) or in porous electrodes having a wet-proofing film placed on the gas side
(Fig. 67 ), with an increase in the feed-gas partial pressure at SLG-1 and SLG-2. The
region between the wet-proofing film and the intrinsic meniscus could be increased by
the increased total pressure. With Teflon-impregnated electrodes, wet-proofed gas
channels may form an interconnected network throughout the electrode mass. SL regions adjacent to this network are then changed to SLG regions. The advantage of
this structure is in the possible presentment of short film lengths to the feed gas
throughout the porous mass. The first lengths of the supermeniscus film contribute
most to performance (Ref. 46), and a larger area of first lengths is made available
throughout the electrode structure. A system resembling that of two superimposed
scales of pore structure (Ref. 47) may be formed in which region SLG is connected to
many different pores of the sl type leading to L. Similar advantages could result if the
increased total pressure inside the electrode caused a favorable approach toward the
formation of a pendular-funicular transition state, as described in Section 5.
120
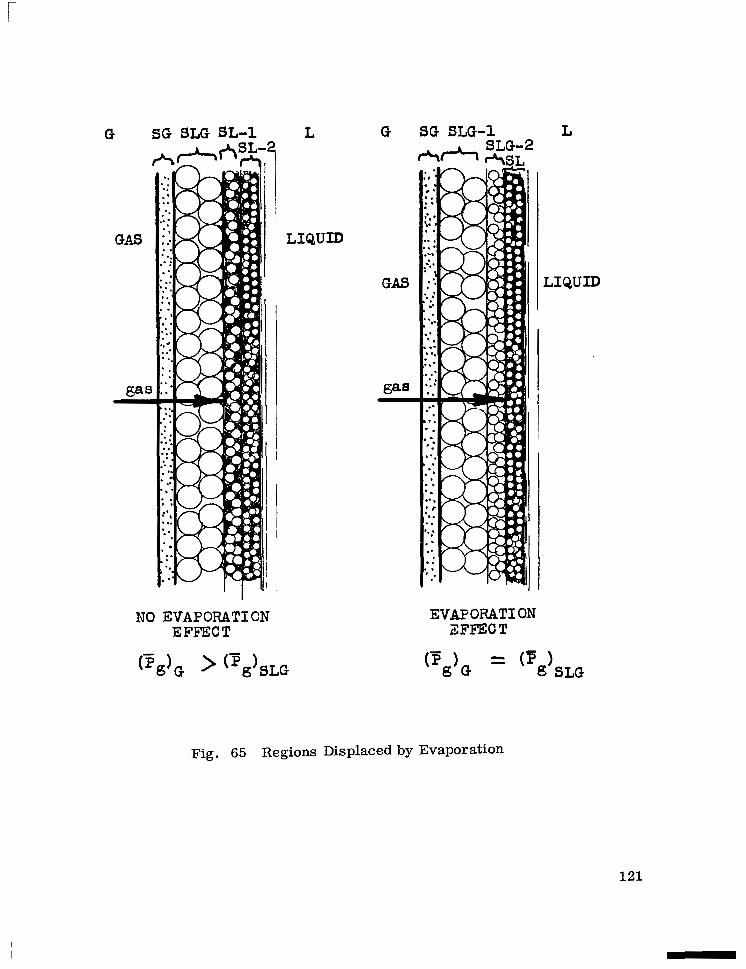
r
G S G SLG SL-1
NO E V A P O R A T I O N EFFECT
L
LIQUID
G SG SLG-1 L
LIQUID
I
EVAPORATION EFFECT
Fig. 65 Regions Displaced by Evaporation
121
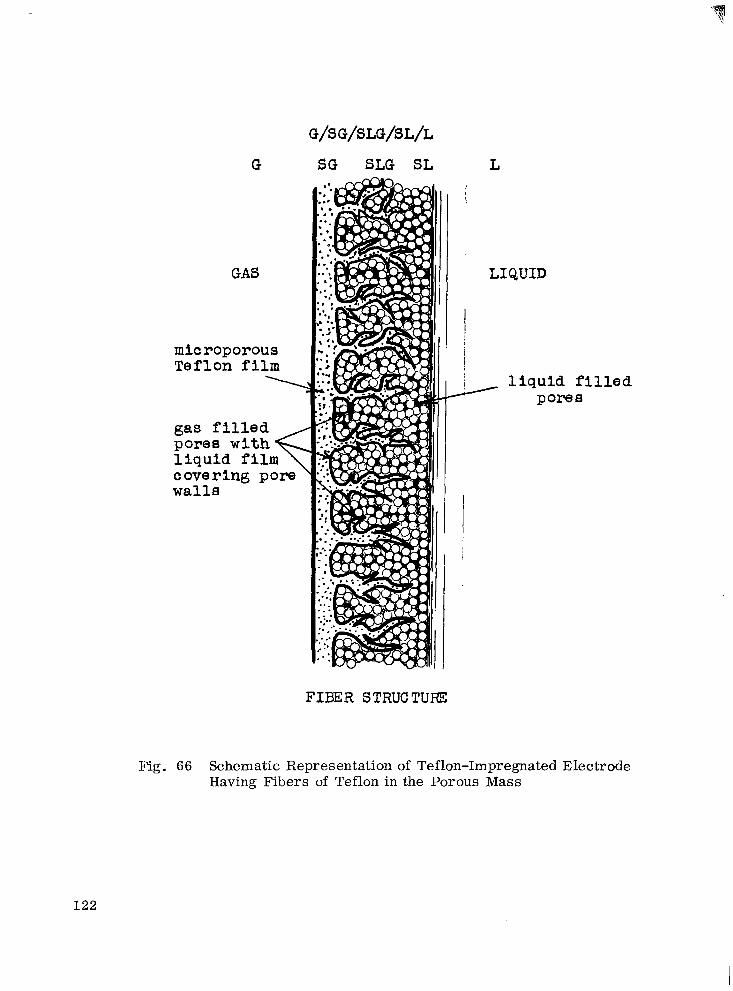
G/SG/SLG/SL/L
G S G SLG SL L
i
LIQUID
/ l i q u i d f i l l e d pores
FIBER STRUCTURE
Fig. 66 Schematic Representation of Teflon-Impregnated Electrode Having Fibers of Teflon in the Porous Mass
122

microporoua Teflon (SG)
\
GAS
formed by 1 counter d l f f u e i o n
I I
1 !
i l i q u i d i n f i l t r a t e d re g i on8
I LIQUID
Fig. 67 Evaporation Effect With Porous Teflon Fiber Structure (gas flows through microporous Teflon filaments)
123

Another effect may result when sufficiently narrow pores are connected to large pores
in the slg zones near sl or 1 . Induced gas flow into the narrow slg zones could develop
a total pressure at slg which is easily relieved out of the large pore back toward g.
A circulation of gas may develop, accompanied by evaporation as long as g is kept
unsaturated at the mouth of the narrow pore.
In Fig. 68 a sketch is shown of this type of circulating electrode which may be
generalized symbolically as follows :
Narrow: g/sg/slg-l/slg-2/sl/1
1 Wide: g/sg/slg-l/slg-2/~1/1
This type of design may be beneficial when continuous purging is required to remove
inert impurities or contaminants (e.g., see Ref. 48). In other cases, it may bring
water-saturated gas to cooler regions where condensation can cause blockage if pores
in the cooler region are improperly designed (Ref. 41 ).
Evaporation is often encountered in fuel cell operation, and it is a natural consequence
that effects such as those described should be considered in electrode design.
6.2 DESIGN METHODS FOR EVAPORATING ELECTRODES
The advantages of accurately placed regions of uniform pores cannot be easily
realized because of present-day fabrication limitations and because pore sizes
usually vary over a wide range. Pore zones may be randomly present which are in
the Poiseuille, the Knudsen, and the transition ranges of size. Conversely, in
considerations of electrode design even the description of porous masses can be
difficult (Refs. 49 , 50 ), and although several treatments for gas transport in gas-
filled pores have been published (Refs. 51 - 55j, it appears that they have not been
124


applied to cases of evaporation from gas electrodes. Several design aids are available,
however, which although approximate are useful as guides, and they are briefly
outlined below.
In diffusion through porous media and in considerations of effective diffusion coeffi-
cients, the above cited works a re helpful, together with some good reference works
(e. g., Refs. 56 , 57 ). The approximation technique suggested by Wheeler (Ref. 40)
can be used by applying the Pollard-Present equation (Ref. 58 ) to estimate the diffusion
coefficient in an ideal pore and to obtain an approximate value for the 1
diameter for the onset of a total pressure gradient formation. In Fig.
of such an approximation are shown for the air-water system at 95°C.
imaginary Poiseuille Diffusion Coefficient'? defined by Wheeler, D P
arges tpore 69 the results
When the
has the value
of the diffusion coefficient of air in water vapor in the example of a< idealized
cylindrical pore, the diffusive processes may be expected to become competitive
with the convective processes, with consequent development of a total pressure
gradient in a porous body having a pore size distribution with an average pore diameter
which is equivalent to that of the cylinder. For the given example, such total pressure
gradients become important in the transition range of flow or for pores with effective
diameters less than about 3 p . The results of this calculation are corroborated to
some extent by experiments which have been conducted with microporous Teflon
membranes (Ref. 43).
The equations developed by Stefan (Ref. 59) for the evaporation rate from a liquid
at the end of a single pore may be used for the case of pores in a porous body with
flow in the Poiseuille range to estimate evaporation rates. For transition range flow,
Stefan's equations may be used with Poiseuille's law to estimate the manifested total
pressure for small pressures as the pore diameter is assigned successively smaller
values. Technically, such an application to the domain of transition range flow is incorrect, but even an approximation of this manifested total pressure for total
pressures which are small compared with the value of the vapor pressure of the
liquid is of interest in design. In Fig. 70 the results of such an approximation
126
I

r
1.00
.)
FI
' 0
0
0.01 0.001 0.01 0.1 1.0 10
PORE DIAMZTER, MICRONS
Fig. 69 Comparison of the Effective Poiseuille Diffusion Coefficient and the Pore Diffusion Coefficient Considering Onset of Knudsen Flow (Air-Water System at 95.0"C)
127

0.1 1.0 10 100 PO= DIAUETEX, MICRONS
Fig. 70 Estimations of Developed Head for Various Pore Diameters Using Generated-convective- Flow Approach (Air-Water System at 70.0"C)
128

a r e shown for unsaturated gas and gas which is 80 percent saturated in the vapor at the mouth of the pore. The possible developed pressure is seen to increase rapidly
as the effective pore diameter is decreased below 1 to 10 p. For pores much smaller
than 1 to 10 ,u when Knudsen flow is governing, the approximation can no longer be
used, and the maximum possible manifested total pressure is the displacing vapor
pressure of the electrolyte. This maximum is usually reduced by the formation of
diffusion layers which a re influenced by the gaseous flow rate past the electrode
(Ref. 43).
Other theoretical tools are also available for use in the design of electrodes in accord
with the described effects of evaporation. The treatment of Shropshire, Okrent, and
Horowitz (Ref. 41) is convenient in predicting pore properties such as effective
diameter and hydrophobicity which wi l l prevent condensation within the pore, and a
ser ies of papers has been provided by Haines (Refs. 1,3,4,60),who has experimentally
and theoretically treated the pressure required to expel varying amounts of liquid
from a bed of spheres (see also Ref. 5 ). These last results may be replaced by the
classical expression for a cylindrical pore for some special electrode designs.
6.3 EXPERIMENTAL EVIDENCE FOR EVAPORATION EFFECTS
Although bubbling at fuel cell electrodes has been repeatedly observed (Refs. 41,
42, 43 ) there appears to be no known direct evidence of the other, beneficial effects
outlined in this section. However, some indirect evidence was collected with a
previously described apparatus (Ref. 43) which is capable of measuring induced
gaseous fluxes through microporous Teflon membranes. In Fig. 7 1 a re shown the
results of such measurements with a randomly selected microporous TFE Teflon
membrane 230 1.1 thick and 1.17 cm in diameter. The data of Fig. 7 1 serve to
confirm the practical import of the predicted effects caused by induced gaseous flow
and spontaneously developed total pressures by indicating approximate values of the
fluxes and pressures which are easily attainable when evaporation occurs at gas
electrodes.
2
129

6
5
4
3
2
1
0 0 20 40 60 ao
APPLIED HZAD, CU OF WATER
Fig. 71 Effect of Applied Head on Pumping Rate (Air-Water System; Flow-by Rate, 43.0 STP cc/min; 1 .17 cm2Area; Microporous Teflon Membrane; 263 p Thick)
130
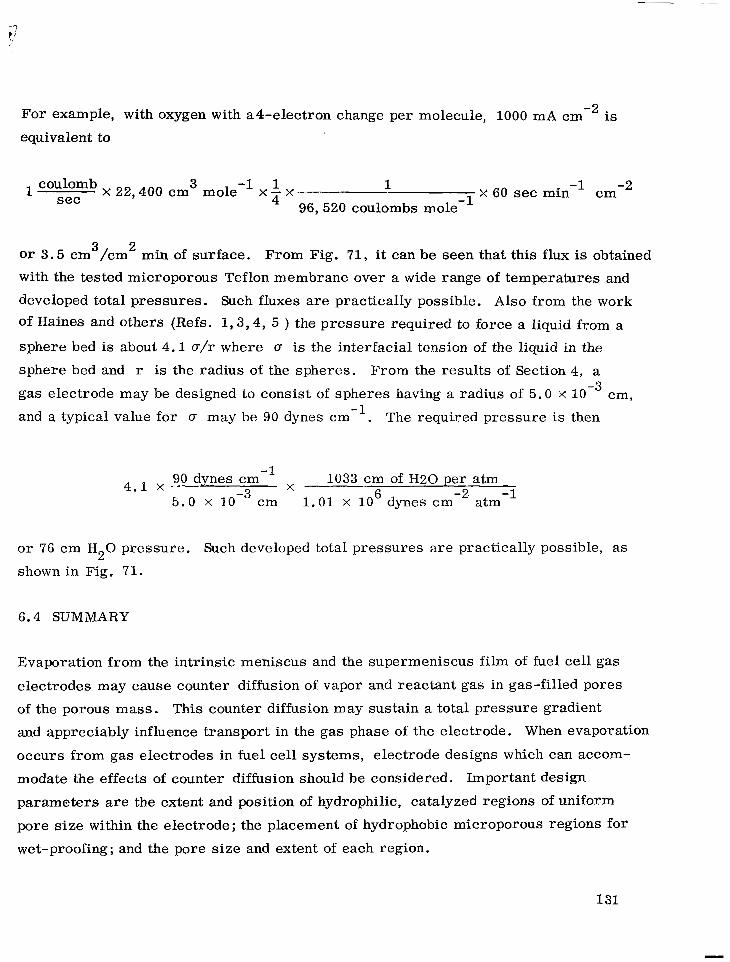
For example, with oxygen with a4-electron change per molecule, 1000 mA is
equivalent to
coulomb sec X 22,400 cm mole-' x 1. x 3 1
X 60 sec min cm -1 -2
96 ,520 coulombs mole-'
or 3 . 5 cm /cm min of surface. From Fig. 71 , it can be seen that this flux is obtained with the tested microporous Teflon membrane over a wide range of temperatures and
developed total pressures. Such fluxes are practically possible. Also from the work
3 2
of Haines and others (Refs. 1 , 3,4 , 5 ) the pressure required to force a liquid from a
sphere bed is about 4.1 a/r where a is the interfacial tension of the liquid in the
sphere bed and r is the radius of the spheres. From the results of Section 4, a
gas electrode may be designed to consist of spheres having a radius of 5 .0 X cm,
and a typical value for a may be 90 dynes cm-l. The required pressure is then
90 dynes cm x 1033 cm of H20 per atm
5.0 X cm 1 . 0 1 x 10 dynes cm-2 atm
-1 4.1 x 6 -1
or 76 cm H 0 pressure. Such developed total pressures are practically possible, as
shown in Fig. 71. 2
6.4 SUMMARY
Evaporation from the intrinsic meniscus and the supermeniscus film of fuel cell gas
electrodes may cause counter diffusion of vapor and reactant gas in gas-filled pores
of the porous mass. This counter diffusion may sustain a total pressure gradient
and appreciably influence transport in the gas phase of the electrode. When evaporation
occurs from gas electrodes in fuel cell systems, electrode designs which can accom-
modate the effects of counter diffusion should be considered. Important design
parameters are the extent and position of hydrophilic, catalyzed regions of uniform
pore size within the electrode; the placement of hydrophobic microporous regions for
wet-proofing; and the pore size and extent of each region.
131

Section 7
RELATING STRUCTURAL PARAMETERS O F POROUS MEDIA
In this section, an idealized structure of porous media is treated to find typical relations ;
between the structural parameters of porous systems. While it is recognized that the ' description of porous media is generally a difficult task (Ref. 49), simplified models
of porous media have been presented for various purposes in the past (Refs. 8,9,10,50,
51 , 53 , 54 , 55 , 61). These models usually satisfy certain requirements, but a model still ,
appears to be needed specifically to relate the commonly accepted structural parameters
of porous.media. The parameters that are of concern in practical systems are the specig surface area, A, fractional void volume, 0 , tortuosity factor, T , effective pore
radius, r , and solid radius, R .
In many fields, and especially in battery and fuel-cell electrode technology, it is necessary for the designer and fabricator to have a knowledge of the interrelations of ,
structural parameters of porous media. At present, not only is the designer limited
in his available knowledge of the effects of changing one or more parameters of complex
structures of porous media but aIso the fabricator has no well-developed methods or clear guidelines for obtaining specified structures. Porous media are often expeditiously
prepared with practical intent, without regard for the resulting complexity or effects on
structure, and with poor understanding of the mutual influence of structural parameters.
It is the purpose of this section to present a scheme for theoretical but practical con-
siderations of porous media and their structural parameters. A method o r technique
of developing imaginary structures is suggested which lends itself to facile, semi-
quantitative interpretations for applications to design or fabrication. Examples are
given in which the parameters are related and in which the effect is discussed of
changing some of the structural parameters on the other structural parameters of
the porous system. In this way, an attempt is made to bring some understanding and
to supply a guide for work in porous media technology.
132

7.1 THE IDEAUZED MODEL
In this scheme, an idealized porous structure is postulated in which fibers are assumed
to have their ends touching two parallel, facial planes of a porous mass. The fibers
are assumed to comprise the solid part of the porous mass, to be electrically connected
at the boundary of the facial planes, and to be positioned s o that their ends are at the
intercepts of Cartesian coordinate systems in the two planes. The effective pore
radius is considered to be the radius of an imaginary pore which just fits between
four fibers, as shown in Fig. 72. With this general model, further structural
detail can be assigned depending on the construction materials used or on the desired
resemblance to a given structure. .A basis can be established for comparing and
evaluating the structural parameters in terms of a model which approximates an actual electrode.
The idealized model enables some quick qualitative evaluations of the relations between
A, 0 , T , and r , even without mathematical treatment. It is seen that variations
in T and (1 - 0) are more or less interchangeable and that other relations may be
anticipated. The fibers may be placed as close to each other as required to vary
porosity or fractional void volume, or they may be bent to change the tortuosity factor
and porosity. Specific surface area may be changed in the same way. As r/R increases (e.g., see Fig. 72), so should 6 , and an increase in T should result in
an increase in A . Fiber shape influences A . Fibers may be selected which a r e
cylinders, stacks of spheres, or rods with square cross section. It should be noted
that the peripheral area of a cylindrical fiber is the same as that for a fiber consisting
of a stack of spheres with the same diameter and length. Also, cylindrical fibers can be notched, and it can be shown that for a cylinder of radius R with right angle,
concentric notches with radius q and length 1 , the peripheral area per unit length
of cylinder will be increased over that of the unnotched cylinder as long as q -F R > 1 . Fibers of square cross section may be considered when it is required that the fibers
completely fill the porous mass in the limit as they are made larger.
133

FIBER CROSS SECTION CENTERED IN SQUARE -THICKNESS, t UNIT WITH SIDE X\ <
EFFECTIVE PORE FACIAL PLANES WITH RADIUS I WHICH FORM
I I I I 1 THE BOUNDARY FIBER WIT OF THE RADIUS R POROUS MASS
Fig. 72 Unit Section of Electrode Matrix With Four Fibers, Showing Location and Size of Pore

7.2 ANALYSES OF SPECIFIC SYSTEMS
In the following analyses, the ends of the fibers are considered to have negligible
effect on the treatment. Tortuosity is taken as fiber tortuosity, and it is assumed
that tortuosity is capable of unlimited variation within the confines of the unit fiber
volume, x t . This last assumption introduces an impossible physical condition for
large T , and it should always be considered in interpretations of the mathematical
treatments.
2
An analysis is made for the case in which the fibers consist of a row of spheres
placed end-to-end. This structure resembles the loosely stacked spheres or particles
used in a sintered fuel-cell electrode matrix or in a test electrode. The equations
are derived by considering the cross-sectional relation of x , R , and r and by
using the Pythagorean theorem,
x = a ( R + r)
Then, a unit volume, x t , is considered, and the fractional void volume is related
to x , T , and R :
2
(1 - e ) = sphere volume - 4/3 7rR3(~t /2R) total volume
-
x t 2
Equations (5) and ( 6 ) a re used together with the definition for A , i.e. , unit area
per unit volume of porous bulk, to obtain the following set of equations:
135

A similar set of equations may be obtained for a rod fiber with a square cross section
if the side of the square is taken as s :
A = 4 ST ( f i r t s)2
The similarity of the functions for the two se ts of equations should extend to other
sets for cases in which the above derivation procedure is used. The minimum value
for 8 which is possible wil l vary depending on the selected fiber configuration.
For T = 1 , the following minimum values for 8 can be determined:
For a fiber of spheres : 1 - n/6 = 0.4764 5 8 5 1
For a cylindrical fiber: 1 - 7r/4 = 0.2146 5 8 5 1
For a square fiber: o r e 5 1
The fractional void volume, 8 , is 0.2595 for the closest packed arrangement of
spheres.
7.3 DISCUSSION
The derived equations may 5e examined directly for interpretations of design and
fabrication, but it is often advantageous to place the equations in the form of graphs
so that trends and functional relations can be visualized. The graphs that are con-
veniently prepared are plots of r/R versus 1 - 8 and T , A versus R , and
T versus 1 - 8 . The equations and graphs are the tools that enable predictions in
the relations between the structural parameters and that form the basis of electrode
structure design recommendations.
136

Graphs are shown for the case of a fiber consisting of a stack of spheres in Figs. 73
through 76. In f ig . 73 is plotted r/R versus 1 - 0 for T = 1, 5, and 10. The
fractional void volume is also shown. Here, it is seen how the increase in pore size
or r/R results in an increase in porosity o r 100 8 for a constant tortuosity. The
porosity of a porous mass, for a constant tortuoisty factor, is most sensitive to
changes in pore radius when the pore radius is very small. A s the porosity approaches
100 percent, the pore radius or r/R approaches infinity. As the porosity approaches
zero, the ratio r/R approaches a finite value depending on the minimum possible
value of 0 for a given value of T which is compatible with physical reality.
In Fig. 74 is given the expected linear .relation for T and 1 - 8 . A dashed line is
included for T = 1 because physical meaning is lost for T < 1 . This plot is interesting
because reasonable values of the tortuosity factor are obtained, particularly for small
values of tortuosity. Other relations are well shown. A s tortuosity decreases, so does
1 - 0 , and the slope for this decrease is greater for larger values of r /R . The
latter effect can be readily understood because for larger effective pore radii or r/R
the tortuosity must be greater to obtain a given porosity.
A s the pore size or r /R is made larger for a given porosity, then the tortuosity must
also increase so that the given porosity can be retained. This effect is shown in
Fig. 75 for three different porosities. Finally, in Fig. 76 the increase of specific
surface area to infinity is shown as the fiber (sphere) diameter is decreased to zero
while the porosity is kept constant. The values of specific surface area in Fig. 76
are actually reasonable despite the generalizations and assumptions used in the model
(e.g., Ref. 8 ) .
With the presented scheme for treating structural parameters of porous media, the
interrelations of the structural parameters can be easily shown (Figs. 73 through
76 ) , at least in a semiquantitative fashion. The effect of changing any of the five
structural parameters can be found at a glance with a suitable graph. For the three
parameters, r/R , 6 , and T , the third is always set if the other two are fixed
137

10 !
8
6 a >
4
2
0
8 ) 0.8 0.6 0.4 0.2
0 0.2 0.4 0.6 0.8 1.0 1-8
Fig. 73 Variation of Ratio of Pore Radius to Sphere Radius With Changes in Tortuosity Factor and Fractional Void Volume
8 1 .O 0.8 0.6 0.4 0.2
i5 t r / R = 3 A
i -8
Fig. 74 Relation of Tortuosity to Porosity at Fixed Pore Radius and Sphere Radius Ratios
138

40 I I I I I
30 -
I- 20 -
IO -
0 2 3 4 5 6 r / R
Fig. 75 Change of Pore Size With Changes in Tortuosity Factor for Fixed Fiber Size and Porosity
5000 - P)
0 E
(U 4000 -. \ - 0 E
a-
i 3000 - - W V c 5 2000
: I000 - -
v)
0
W
v)
- - a
0 I I I I 0 10 20 30 40 50
FIBER RADIUS,microns
Fig. 76 Change in Specific Surface Area With Fiber Radius at Three Fractional Void Volumes
139

serious. It is also assumed that the current density at a given potential is proportional
to the specific surface area of the regular structure. In this connection, performance
may be improved more than anticipated from a dependence on specific surface area
because the isolated patches of supermeniscus films are made smaller and offer less
resistance to ion transport.
With the 156-p spheres, 50 mA cm-2 was obtained at 500 mV (Section 4). To obtain
1000 mA a t 500 mV [i. e., about 200 mA cm-2 at 900 mV (compare Fig. 25)],
the sphere size should be (50/1000) 156, o r 7 .8 p . With the 156-1.1 spheres, the
optimum differential pressure is 48 cm of water (Section 5), so this pressure should
be (156/7.8) 48 or 960 cm of water (i. e . , 1 3 . 7 psi).
It is assumed that the optimum electrode thickness is not changed, and a fine-layer
sphere size is selected which will cause the fine layer always to be flooded.
As a substrate to reduce cost, nickel spheres may be used which are silvered before
assembly. The construction of the desired electrode may be accomplished by hot
pressing at relatively high pressure and low temperature to minimize contact area
loss, or by spark sintering (Refs. 62, 63), which is noted for its low area loss.
Some general recommendations may tentatively be made based on the findings of this
investigation.
(1) A structure should be used which enables the formation of continuous net-
works of liquid and gas in the electrode (section 4.2). With this structure, internal
liquid configuration should be controlled so that a suitable balance is obtained between
liquid filaments or thickened f i l m regions and the supermeniscus films as in the
funicular regime near the funicular-to-pendular transition state (Section 5).
(2) Internal liquid configuration can be suitably controlled by using regular
structures which allow regions of supermeniscus film to be periodically formed,
distributed,and interspersed between continuous filaments of liquid at an optimum dif- ferential pressure (Section 5). Such structures may be sintered aggregates of spheres
142
or particles of uniform size. Liquid paths may be controlled by use of wedges which
a r e uniformly distributed throughout the structure, as at the point of contact between
two spheres or in cracks and valleys of irregularly shaped particles. Thin supermen-
iscus film areas, preferentially formed at convex surfaces, should be extensive enough
and sufficiently numerous to account for approximately half of the specific area
(section 5.2) . (3) Other techniques should be considered for obtaining the above-described
liquid distribution throughout the porous mass. These may take the form of using a
mixture of particles, some with roughened surfaces to bring in good ionically conduc-
ting paths of bulk liquid and others with smooth, convex surfaces for supermeniscus
film formation; e. g. , surface roughness may be accomplished by chemical deposition
of platinum (section 4.7)- Alternatively , the aforementioned roughened particles may
have, instead , very fine through pores to serve the same function of bringing liquid in by capillarity. Another alternative may be to use a mixture of fine particles for
capillary attraction of bulk liquid together with relatively large , smooth particles in
a ratio which would not cause the flooding of the larger particles. In addition, a mix-
ture of fine particles of a catalytic material and of a hydrophobic substance (e. g. , Teflon) might be used if the proper ratio and structure could be obtained (section 4.11).
With this mixture, continuous gas networks should form within and possibly on the
surface of continuous networks of Teflon filaments which are porous. The interlacing
continuous network of catalytic particles would draw bulk liquid in and throughout the
electrode by capillarity to the liquid-gas interface, where Teflon filaments meet
catalytic particle filaments and where gas is brought into contact with catalyst because
of the hydrophobic properties of Teflon (Ref. 12), i. e. , a s in the Teflon-impregnated
black-platinum electrode. Such techniques are limited by the imaginative approach
of the designer and fabricator , and in each case the optimum differential pressure
will change according to the structure used. (4) Electrodes should be about 1 3 0 0 ~ thick at the optimum differential pressure
according to the observations limited to this study. In the pendular regime, elec-
trodes can be only 400 p thick or less , depending on the differential pressure. In the
funicular regime, near flooding, electrode thichess can be reduced to 120p for 3 8 p
spheres or less for smaller effective solid diameters in a loose sphere packing,
although performances under these last two conditions are relatively poor (Section 4).
143

I II I I 111111.11 IIIIIII 111 I I1 I 1
(5) The effective pore and solid radii should be made as small as possible
before onset of flooding by supermeniscus films in the pores in order to maximize
specific surface area. This limit will probably correspond to an effective pore radius
of about 0.01 to 0 . 1 p or, for a loose sphere packing, to an effective solid diameter of
about 0.13 to 1 . 3 p for a 0 . 4 fractional void volume. The limiting optimum differential
pressures should then be from 820 to 82 psi, respectively (section 5.2) , although the
use of dispersed Teflon particles should reduce these values (section 4.11) .
(6) Double-porosity structures should be uged in the classical "Bacon sense"
to prevent bubbling at the optimum differential pressure for the coarse layer and to
gain resulting synergism (sectim 4 . 5 ) . The pores in the fine layer should be com-
pletely flooded to increase ionic transport. Effective diameters in the fine layer then
should be at least (4 .1/1.2) or 3 . 4 t imes smaller than the effective diameter in the
coarse layer (for loose-packed spheres) (section 5.2) .
(7) In the use of wet-proofed structures from which evaporation of electrolyte
occurs, advantage may be taken of the processes involving counter diffusion and an
induced total pressure gradient to increase the internal reactant gas partial pressure
to a value approaching the external gas partial pressure at the gas side of the electrode,
to circulate gas, and to free flooded regions for electrochemical reaction (Section 6).
144

Appendix A CALCULATION OF PERIMETER AND CROSS-SECTIONAL AREA O F CLOSE-PACKED
ARRAYS O F SPHERES*
A. 1 INTRODUCTION
In this appendix, the general equations for the positions of the sphere centers, for the
cross-sectional area of metal in a horizontal plane, and for the wetted perimeter in a
horizontal plane are developed for the two possible close-packed arrays that can be formed if the bottom layer is itself close packed.
A. 2 PERIMETER AND CROSS-SECTIONAL AREA
If the first layer of a close-packed array of spheres is itself close packed, then the
positions of the centers of the spheres in the first two layers are the same whether
the array is hexagonal or close-packed cubic. Figure 77 shows the positions of the
sphere centers, viewed from above, together with the sphere equators, for the first
three layers. The array is disposed upon a se t of coordinates, of which the origin is
arbitrari ly placed at the height of the centers of the spheres in the first layer, and
along a vertical dropped from the center of a sphere in the third layer of a cubic array.
In the horizontal plane the x and y axes are chosen such that the y axis is parallel to
a line joining two nearest neighbor spheres in any layer.
*By A . J. Shaler , Consultant.
145

- - SECOSD LAYER - BOTTOOU LAYER -- -- THIRD LAYER
Fig. 77 Close-Packed Arrays of Spheres. Horizontal Planes
146

r-
At the top of the figure, the solid lines are the equators of the spheres of the first l.ayer in a hexagonal packing, the long-dashed circles are the equators of the spheres
in the second layer, and the equators of the spheres in the third layer are, of course,
superimposed upon those of the spheres in the first layer; this pattern is periodic
, upward from that third layer. In the middle third of the figure, a third set of circles is shown - the lines with the shorter dashes; these are the equators of the spheres in
the third layer in a cubic packing.
In each layer, two species of spheres are shown: those with their centers on the x-axis
and periodically one sphere diameter away from the previous one, and those with
centers - half a sphere diameter away from the x-axis and periodically one sphere
diameter away from the previous one. Thus, in the lower layer, species 1 and 2 a r e
represented; in the second layer, species 3 and 4 are seen; and in the third layer, the
species are again 1 and 2 in the hexagonal packing but 5 and 6 in the cubic. The pattern
is made independent of the sphere diameter by scaling the axes as:
Multiples of a / 6 d in the x-direction (d = sphere diameter)
Multiples of d/2 in the y-direction
Multiples of G / 3 d in the z-direction (vertical)
In each horizontal (x-y) plane, the adjacent sphere centers form equilateral triangles
of edge 2 d. Thus, the centers are, for the six species of spheres, as follows:
Layer (From Screen) Species , k i X Z - First 1 (2+3i) a d / 3 jd 6 kd
2 (1+6i)ad/6 (1+2j)d/2 6 kd
4 (5+6i)ad/6 (1+2j)d/2 (1+3k)fid/3
Second 3 (1+3i)fid/3 jd (1+3k)fid/3
Third 5 a i d jd (2+3k)d%d/3
6 (1+2i)fid/2 (1+2j)d/2 (2+3k)d%d/3 (fcc only)
147

To determine the area attributable to a single sphere in the horizontal plane, one can
begin with the equation for the surface of any sphere,
(x - + (y - y.) + (z - zk) = d2/4 2 2 J
At any integral value of k , a rectangle measuring one unit of i by one unit of j has
an area of a d 2 . In that area are two full great circles of spheres, so the horizontal
unit area per sphere center is a d /2 . 2
When any plane parallel to the x-y plane cuts horizontally through the array, it cuts
either spheres of one layer only or spheres of two layers. In the first layer (k = 0) , from z = 0 to z = ( 6 / 3 - 1/2)d it cuts spheres of layer 1; from z = (G/3 - 1/2)d
to z = d/2 it cuts spheres of both the f i rs t and second layers. Thus, in the first of
these ranges, the perimeters of species 1 and 2 are cut, and in the second, the
perimeters of spheres of species 1, 2, 3, and 4 are cut. We need go no farther
upward than z = d/2 , since the pattern is then repeated equally in both the cubic
and hexagonal arrays, but we must also find the special perimeter values from z = 0
to z = - d/2 , where we encounter no new sphere layers but do find the screen.
If the screen opening is cylindrical and has a diameter s , then from z = 0 to z = - the spheres of species 1 and 2 only are cut. From that height
down to z = - d/2 , these spheres plus the screen are cut. The solid horizontal
cross section of the screen is, in the unit area a d /2 , a d /2 - T S /4 a t any z
below z = - ; its wetted perimeter in that area is, therefore, 27r/ad . 2
The solid cross section per unit area is 1 - T S / 2 a d .
2 2 2
' 2 2
A t any z , the perimeter per unit area of a sphere of layer 1 (species 1 and 2) is
(4a/ad24d2/4 - (Z - zk)2. In the bottom layer, k =
is, from z = - Jdz/4 - s2/4 to z = ( G / 3 - 1/2)d , 0 , so zk = 0 , and the perimeter
148

Below the top level of the screen it is, from z = - 4d2/4 - s2/4 to z = - d/2 ,
and f rom z = - d/2 on downward it is
Above z = (G/3 - 1/2)d , the plane z cuts spheres of layer 2 as well (species 3 and 4),
so the perimeter is, from there to z = d/2
To permit plotting the perimeter as a function of z , on coordinates in terms of d (to
make them dimensionless in respect to the diameter of the spheres), it is further necessary to find a value of s in terms of d . We elect to define s such that the
value of the cross-sectional area'of metal, horizontally, per unit area of the screen,
equals the least value of cross-sectional area of spheres from - d/2 to + d/2 . The
former is 1 - ns2/243d2 , and by inspection it is evident that the latter occurs
infinitesimally above z = - d/2 , just above the screen, where the cross-sectional
area is always ns2/2fid2 . Therefore, s = d = 0.7425 d . If the cross section
of the screen opening is hexagonal instead of round, this figure is 0.7241 d , and if it
is triangular, 0.6458 d.
The cross-sectional area of the metal in the screen, per unit area as defined above,
is then 1 - ns2/2J3d2 = 1/2 . For a hexagonal opening, it is 0.4756, and for a
triangular opening, 0.3708. We can now numerically define the limits where the
perimeter functions change as z = 0.5000d, -0.3349d, 0.3165d, and 0.5000d. The
perimeters, computed from the expressions listed above for the various ranges, are shown in Fig. 78 . To obtain the actual perimeter in centimeters (for example), at
149

/ . . ~ ~ ~~~ ~
FIRST (LOWER) LAYER OF SPHERES ENDS
-
SECOND LAYER OF SPHERES BEGINS
CENTERLINE O F LOWER LAYER O F SPHERES """" """""
SMALLEST PERIMETER
\ /
/
1 2 3 4 5 6
PERIMETER PER UNIT AREA/SPHERE DIAMETER
Fig. 78 Per imeter per Unit Area of Array of Spheres Lying on a Screen. Array is close packed in either face-centered cubic arrangement o r hexagonal array. Screen opening is such that its cross- sectional area equals the minimum cross-sectional area of sphere array
150

any height z above the origin, it is sufficient to multiply the appropriate number on
the ordinate by the sphere diameter d in centimeters, giving a value of z in centi-
meters, and to multiply the number corresponding to it on the abscissa by A/d , where A is the area in square centimeters for which the perimeter is required.
Thus, at the height marked 0.1, for spheres of diameter 100 1.1 (0 .01 cm), the level is z = 0.001 cm above the origin, or 0.004349 cm above the top of the screen, and the
perimeter per square centimeter of screen surface is marked 3.550, which corresponds
to 3 . 5 5 0 ~ 1/0.01 = 355 cm/cm . In an electrode of horizontal cross-sectional area
0 .1 cm , there would therefore be a wetted perimeter of 35.5 cm cut by a plane
0.004349 cm above the screen, the openings of which would be, if cylindrical,
0.007425 cm or 74.25 p, in diameter.
2
2
The cross section of metal cut by a horizontal plane at any level z is similarly
computed and shown in Fig. 79. Using the same 100 p spheres at the same level,
the abscissa reads 0.8706. Here the abscissa figures need only be multipled by A , so the cross-sectional area in an electrode of horizontal cross-sectional area 0 .1 cm
2
at a level 0.004349 cm above the top of the screen is 0.08706 cm'.
The formulations for the cross-sectional area of metal per unit area of horizontal
plane at level z are:
From z = - 0.5000d downward 0.5000
From z = - 0.5000d up to z = - 0.3349d (27r/ad2)(d2/4 - 22) + 1/2 From z = - 0.3349d up to z = 0.3165d (27r/Gd2)(d2/4 - 22)
From z = 0.3165d to z = 0.5000d (27r/nd2)(- d2/6 - 2z2 + 2d%dz/3)
151

CROSS-SECTIONAL AREA PER UNIT AREA X SPHERE DIAMETER
Fig. 79 Cross-Sectional Area of Metal p e r Unit Area of Array of Spheres Lying on a Screen. Array is close-packed in either face-centered cubic o r hexagoal arrangement. Screen opening is round and is such that its cross-sectional area equals in metal the minimum metal cross-sectional area of sphere a r r ay
152

r
REFERENCES
' 1. W. B. Haines , J. Agr. Sci. - 15 , 529 (1925)
2. W. B. Haines, J. Agr. Sci. 1 5 , 536 (1925)
3. W. B. Haines, J. Agr . Sci. - 17, 264 (1927)
4. W. B. Haines, J. Agr. Sci. - 20, 97 (1930)
1
5. R. P. Iczkowski, Ind. Eng. Chem. Fund. '7, 572 (1968)
6. A. J. Shaler, Int. J. Powder Metal. - 1, 3 (1965)
7. S. Kruyer, Trans. Faraday SOC. 5 4 , 1758 (1958)
1
8. J. M. DallaValle, Micromeritics, 2nd Ed., Pitman Publishing Corp. , New York, 1 "
1948
9. A. E. Scheidegger, The Physics of Flow Through Porous Media, The Macmillan 1
Co., New York, 1961 1
10. R. E. Collins, Flow of Fluids Through Porous Materials , Reinhold Publishing 1
Corp., New' York, 1961 1
11. A. H. Boerdijk, Philips Research Repts. - 7, 303 (1952) I
' 12. T. Katan, S. Szpak, and R. A. Botosan, "Development of Improved Electrodes I . for Fuel Cells, 1 1 Bureau of Naval Weapons Contract NOW 64-0597-f, May 1965
13. T . Katan, S . Szpak, and E . A. Grens II, J. Electrochem. Soc. - 112, 1166 (1965) I
' 14. 0. Loew, Ber . - 23, 289 (1890)
' 15. Y . A. Mazitov, Elektrokhimiya - 1, 349 (1965) I
I
16. E. A. Grens, R . M . Turner, and T. Katan, Advanced Energy Conversion 4, I 109 (1964)
1 153

56.
57.
58.
59.
60.
61.
62.
63.
C . N. Satterfield and T. K. Sherwood, The Role of Diffusion in Catalysis,
Addison-Wesley, 1963
E. E. Petersen, Chemical Reaction Analysis, Prentice-Hall, Englewood Cliffs,
N . J., 1965
W. G. Pollard and R . D. Present, Phys. Rev. - 73, 762 (1948)
J. Stefan, Sitzber. Akad. Wiss . Wien, Abt. 11, - 68, 385 (1873)
W. B. Haines, J. Agr. Sci. - 15, 178 (1925)
D . H. Everett, The Structure and Properties of Porous Materials , Butterworths
Scientific Publications, London, 1958, p . 95
U. S . Patent 3,241,956, Kiyoshi Inoue, 22 M a r 1966
U. S. Patent 3,250,892, Kiyoshi Inoue, 10 May 1966
156 NASA-Langley, 1910 - 3 E- 5568