continuous measurements of methane mixing ratios from ice cores
TRANSCRIPT

Atmos. Meas. Tech., 5, 999–1013, 2012www.atmos-meas-tech.net/5/999/2012/doi:10.5194/amt-5-999-2012© Author(s) 2012. CC Attribution 3.0 License.
AtmosphericMeasurement
Techniques
Continuous measurements of methane mixing ratios from ice cores
C. Stowasser1, C. Buizert1, V. Gkinis1, J. Chappellaz3, S. Schupbach2, M. Bigler2, X. Faın3, P. Sperlich1,M. Baumgartner2, A. Schilt2, and T. Blunier1
1Centre for Ice and Climate, Niels Bohr Institute, University of Copenhagen, Juliane Maries Vej 30,2100 Copenhagen, Denmark2Physics Institute, Climate and Environmental Physics and Oeschger Centre for Climate Change Research,University of Bern, Sidlerstrasse 5, 3012 Bern, Switzerland3Laboratoire de Glaciologie et Geophysique de l’Environnement, CNRS and University of Grenoble, 54 rue Moliere –Domaine Universitaire, 38400 St Martin d’Heres, France
Correspondence to:C. Stowasser ([email protected])
Received: 6 December 2011 – Published in Atmos. Meas. Tech. Discuss.: 9 January 2012Revised: 25 April 2012 – Accepted: 26 April 2012 – Published: 9 May 2012
Abstract. This work presents a new, field-deployable tech-nique for continuous, high-resolution measurements ofmethane mixing ratios from ice cores. The technique is basedon a continuous flow analysis system, where ice core sam-ples cut along the long axis of an ice core are melted con-tinuously. The past atmospheric air contained in the ice isseparated from the melt water stream via a system for con-tinuous gas extraction. The extracted gas is dehumidifiedand then analyzed by a Wavelength Scanned-Cavity RingDown Spectrometer for methane mixing ratios. We assessthe performance of the new measurement technique in termsof precision (±0.8 ppbv, 1σ ), accuracy (±8 ppbv), temporal(ca. 100 s), and spatial resolution (ca. 5 cm). Using a firn airtransport model, we compare the resolution of the measure-ment technique to the resolution of the atmospheric methanesignal as preserved in ice cores in Greenland. We concludethat our measurement technique can resolve all climaticallyrelevant variations as preserved in the ice down to an icedepth of at least 1980 m (66 000 yr before present) in theNorth Greenland Eemian Ice Drilling ice core. Furthermore,we describe the modifications, which are necessary to make acommercially available spectrometer suitable for continuousmethane mixing ratio measurements from ice cores.
1 Introduction
Atmospheric methane (CH4) is the second most importantanthropogenic greenhouse gas, and a sensitive indicator ofclimate change and millennial-scale temperature variabil-ity. Records obtained from ice cores show CH4 variabilityof ca. 300 to 800 parts per billion by volume (ppbv) overthe last 800 kyr both on the orbital time scale of glacial-interglacial cycles (Loulergue et al., 2008), and on the millen-nial time scale of abrupt Dansgaard-Oeschger cycles (Chap-pellaz et al., 1993). Due to its short atmospheric lifetime, at-mospheric CH4 variations can be very abrupt, allowing syn-chronization of ice core chronologies from both hemispheres(e.g.Blunier and Brook, 2001; Blunier et al., 2007; Capronet al., 2010). To capture atmospheric variability on the cen-tennial to decadal scale, and to maximize the precision ofinterhemispheric synchronization, high resolution CH4 icecore records are desirable (Schupbach et al., 2011). CH4 mix-ing ratio measurements need to be of high precision and ac-curacy to resolve small details in the records, such as theinterhemispheric gradient (IHG) that reflects the latitudinalsource distribution. The IHG, obtained by comparing Green-landic and Antarctic records, is as small as 15 ppb duringglacial conditions (Dallenbach et al., 2000), requiring a com-bined precision and accuracy of±5 ppbv.
Published by Copernicus Publications on behalf of the European Geosciences Union.

1000 C. Stowasser et al.: Continuous measurements of methane mixing ratios from ice cores
Measurements of CH4 mixing ratios from ice cores aretypically based on gas chromatography (e.g.Sowers et al.,1997; Fluckiger et al., 2004; Mitchell et al., 2011). Here, theair is extracted from individual ice core samples either bya dry (crushing or grating) or wet (melt-refreeze) extractiontechnique. In the column of the gas chromatograph, CH4 isseparated from other gas species of the sample before mix-ing ratios can be determined e.g. via a thermal conductiv-ity detector (for oxygen and nitrogen) and a flame ionizationdetector (for CH4). While measurements of CH4 mixing ra-tios from ice cores based on gas chromatography yield goodreproducibility (4–15 ppbv), they are time consuming andlabor-intensive, especially when aiming for high-resolutionmeasurements over a large part of the ice core. Due to theseparation of gas species within the column of the gas chro-matograph, measurements are destructive and preclude con-secutive measurements of several gas species from one icecore sample.
Gulluk et al. (1997) developed a high-frequency modu-lated tunable diode laser absorption spectrometer for dis-crete measurements of CH4 and other gas mixing ratios fromice cores. The measurement technique is non-destructive,which allows for simultaneous measurements of up to fourgas species from the same piece of ice. Uncertainty of CH4mixing ratio measurements with this method varies between±13 ppbv and±36 ppbv, depending on the age of the ice(Gulluk et al., 1998). This technique is time consuming andlabor intensive, since air is extracted from individual ice coresamples similar to the techniques discussed above:Gulluket al. (1998) used a dry extraction technique, where the icecore sample is sublimated in a high-vacuum apparatus. En-ergy for sublimation is transferred to the ice sample by near-infrared radiation. The temperature of the ice is kept below−20◦C to avoid the formation of liquid water and, thus, thedissolution of gas molecules in the liquid phase.
Recently, a semi-automated technique for measurementsof CH4 mixing ratios from ice cores has been developedat the University of Bern (Schupbach et al., 2009). Thisfield-deployable technique utilizes a gas chromatograph formeasurements of CH4 mixing ratios (reproducibility of 10–20 ppbv) in combination with a continuous melting deviceas used in Continuous Flow Analysis (CFA) systems (Kauf-mann et al., 2008; Bigler et al., 2011). Due to the partly au-tomated measurement technique and the continuous meltingdevice, measurements are fast and achieve a high resolutionof 15 cm.
The new technique presented in this study is, to a highdegree, automated, field-deployable and allows for non-destructive measurements of mixing ratios of multiple gasspecies from the same ice core sample (no separation or trap-ping of air components is required). A CFA system providesa continuous sample stream, i.e. a mixed flow of melted icewater and past atmospheric air. The air is separated fromthe melt water in two stages by means of a debubbler and ahydrophobic membrane, respectively. CH4 mixing ratios of
the extracted air are measured with a Wavelength Scanned-Cavity Ring Down Spectrometer (WS-CRDS).
In order to make the commercially available WS-CRDS(Picarro Inc., CFADS36 CO2|CH4|H2O analyzer) suitablefor continuous measurements of CH4 mixing ratios from icecores in combination with a CFA system, we had to mod-ify the spectrometer. The original version of the WS-CRDSis designed for higher gas flows compared to the gas flowavailable from CFA. We present the necessary modifica-tions and characterize the performance of the modified WS-CRDS in terms of stability, precision, accuracy and temporalresolution.
We characterize the combined field-deployed system ofCFA, gas extraction and modified spectrometer in terms ofstability, precision, accuracy and resolution, and present re-sults of in-field measurements along ca. 27 m of the NEEMdeep ice core (North Greenland Eemian Ice Drilling). Finally,we show that the resolution of our measurement techniqueis sufficient to resolve all climatically relevant variations inCH4 mixing ratio as preserved in the NEEM ice core downto a depth of at least 1980 m (66 000 yr before present).
2 Methods
2.1 Experimental setup description
Here we describe the experimental setup for continuousmeasurements of CH4 mixing ratios in combination with aCFA system as applied during the NEEM 2011 field season(Fig. 1). The CFA system was developed and operated by theUniversity of Bern. On a heated melt head ice core rods (in-ner cross section of 2.6× 2.6 cm, length 1.1 m) are melted ina cold environment (T ≈ −20◦C) at a rate of 3.2 cm min−1.This results in a stream of melt water and bubbles of pastatmospheric air (17 ml min−1, ca. 10 % air by volume).
In the warm laboratory of the CFA three peristaltic pumpsand a debubbler (internal volume of ca. 0.8 ml) distribute thesample stream between several systems for chemical analy-sis (for details seeKaufmann et al., 2008; Schupbach et al.,2009). In brief, the debubbler is a standard pipette tip sealedagainst ambient with a custom-made plug at the top includ-ing two holes for an inlet and outlet tube, respectively. Thesample stream from the melt head enters through the inlettube and air bubbles rise, driven by buoyancy, to leave thedebubbler with some residual water through the outlet tube.Hence, no bubbles reach the tip of the pipette tip, where wa-ter is pumped away for analyses of chemical components andstable isotopes of water. An open split with small internalvolume is installed downstream of the outlet tube and pre-vents pressure fluctuations in the debubbler that would affectthe chemical analyses. From here the air and residual water(3.2 ml min−1, ca. 50 % air by volume) are pumped through aheated transfer line (to avoid freezing of the sample) towards
Atmos. Meas. Tech., 5, 999–1013, 2012 www.atmos-meas-tech.net/5/999/2012/

C. Stowasser et al.: Continuous measurements of methane mixing ratios from ice cores 1001
Fig. 1.Schematic drawing of the experimental setup for continuous measurement of CH4 mixing ratios as used during the NEEM 2011 fieldseason. The ice core samples are melted on a heated melt head(A). By buoyancy, air bubbles are removed from the melt water in a sealeddebubbler(B). An open split(C) prevents pressure changes in the debubbler. The air-free sample is distributed between different systemsfor analyses of the chemical composition of water and the ratio of stable isotopes of water(D). A heated tube(E) transfers gases and someresidual water to a second warm laboratory for CH4 mixing ratio analysis. Here, a hydrophobic membrane module(F) separates the gas fromany residual water. For calibration of the system deionized water is purged with nitrogen gas(G).
a second warm laboratory where CH4 mixing ratio analysistakes place.
The remaining melt water of the pressure decoupling unitoverflow is removed with a module for continuous gas ex-traction (MicroModule 0.5′′ × 1′′, G591, Membrana GmbH,Germany). With its internal volume of 5.4 ml, the Micro-Module is small compared to other commercial systems forgas extraction and well-suited to degas small sample streams.Gas extraction is driven by the built-in vacuum pump of theWS-CRDS, which maintains a pressure gradient over a bun-dle of hydrophobic, gas-permeable membrane tubes withinthe module.
The performance of the gas extraction module depends onthe pressure gradient over the hydrophobic membrane. Also,the mixing ratio of gas molecules dissolved in the melt wa-ter depends on both pressure and temperature of the samplestream. Thus, temperature and pressure should be constant onboth the water and gas side of the gas extraction module toguarantee a stable gas extraction. For temperature stabiliza-tion the gas extraction module is located in a temperature-stabilized compartment (T = 30.0± 0.2◦C). The pressure atthe gas side of the gas extraction module is indirectly reg-ulated to 700± 20 mbar by the internal electronic pressureregulator of the WS-CRDS, which primarily controls pres-sure in the sample cavity (EPC Proportional Control Valve,EPCA06SSVXAA, Parker Hannifin Corporation). This re-sults in a pressure gradient of approximately 300 mbar acrossthe hydrophobic membrane of the module, which is sufficientto extract all visible air from the sample stream. Variations inthe water-to-gas ratio in the sample stream as well as changesin the experimental setup (e.g. degradation of peristaltic
pump tubing) introduce the observed pressure fluctuations of±20 mbar at the gas side of the gas extraction module. In thisexperimental setup pressure is kept constant only on the gasside; an additional pressure regulator on the water side of thegas extraction module could improve the stability of the gasextraction.
The extracted air (ca. 1.6 ml min−1) is dried from wa-ter vapor while flowing through a two meter long custom-made Nafion dryer (Nafion TT-020, Perma Pure LLC,0.3 mm inner diameter) the outside of which is purged withca. 20 ml min−1 of dry nitrogen gas (Nitrogen, technicalgrade, Air Liquide). The water mixing ratio of the dried sam-ple is measured by the WS-CRDS to be ca. 0.003 % by vol-ume. By drying the sample, an otherwise necessary watervapor correction can be avoided (for more details about thewater vapor correction seeRella, 2010). From here the driedsample gas is directed towards the WS-CRDS for CH4 mix-ing ratio analysis. The built-in diaphragm pump of the WS-CRDS maintains a constant gas flow and creates a pressuredrop over the hydrophobic membrane tubes of the gas ex-traction module. Note that all measurements are made on the12CH4 isotopologue, and therefore neglect variations ofδ13Cand δD (= δ2H). However, given the natural isotopic abun-dances, combined with the small range of natural isotopicvariation, the induced error is far below our detection limit.
The system idles as a new ice rod is placed on the melthead, enabling ambient air to enter the gas analysis sys-tem through the melt head. To prevent the ambient air fromreaching the gas extraction module, a segmented flow of3.2 ml min−1 (ca. 50 % air by volume) of deionized water andbottled gas (mix of gases, Air Products, Belgium, 21 % O2,
www.atmos-meas-tech.net/5/999/2012/ Atmos. Meas. Tech., 5, 999–1013, 2012

1002 C. Stowasser et al.: Continuous measurements of methane mixing ratios from ice cores
0 200 400 600 800 10000
200
400
600
800
true CH4 mixing ratio [ppbv]
mea
sure
d C
H4 m
ixin
g ra
tio [p
pbv]
WS−CRDS & front−end
y = ax + ba = 0.6697 ± 0.0053b = 11.896 ± 2.616
0 400 800 1200 16000
400
800
1200
1600
true CH4 mixing ratio [ppbv]
mea
sure
d C
H4 m
ixin
g ra
tio [p
pbv]
WS−CRDS alone
y = ax + ba = 0.7941 ± 0.0006b = −0.1258 ± 0.5967
R2 = 0.9999
r1 = 0.709
r2 = −0.964
r3 = 0.255
A B
Fig. 2. (A) Calibration curve for the WS-CRDS plus front-end (except the melt head), where a mixture of gas and deionized water is injecteddownstream of the melt head.(B) Calibration curve of the WS-CRDS alone, where standard gas is directly injected into the spectrometer.r1,r2 andr3 are the residuals of the fit given in ppbv.
79 % N2, 701.2 ppbv of CH4) is mixed in the temperature-stabilized compartment of the gas extraction system (topright in Fig.1) and injected into the gas extraction module viathe automated 6-port valve (#6 in Fig.1, Cheminert C22Z-3186EH, VICI AG). Hereby the pressure in the gas extrac-tion module and the gas flow through the WS-CRDS stayroughly constant between CFA runs (one CFA run is definedas measurements along 1.1 m of ice).
2.2 Calibration
For calibration a segmented flow of deionized water and bot-tled gas (17 ml min−1, ca. 10 % air by volume) is generated,and injected into the system downstream of the melt head(top left in Fig.1). This segmented flow mimics the sampleflow from the melt head and is treated just as an ice core sam-ple from the moment it enters the system. The reservoir of thedeionized water is purged with dry nitrogen gas at a rate ofca. 20 ml min−1 to keep the molar fraction of dissolved gasmolecules roughly constant and to prevent contamination ofthe water with ambient air.
For day-to-day calibration of the system in the field, wemade two gas mixtures (21 % O2, 79 % N2) with mixing ra-tios of 403.1 ppbv and 701.2 ppbv, respectively. CH4 mixingratios of both gas mixtures were determined prior to the fieldseason using three synthetic air standard gases calibrated byNOAA (National Oceanic and Atmospheric Administration,Boulder CO, CH4 mixing ratios of 344.3 ppbv, 688.6 ppbvand 1646.2 ppbv, respectively). Calibration takes place oncea day using one of the two gas mixtures. Furthermore, avalve (#4 in Fig.1, C4WMPH, VICI AG) can be switched toabruptly change between the two gas mixtures. This enables
us to determine the response of the experimental setup to astepwise change in CH4 mixing ratio (see Sect.3.2.1).
Figure2a shows a typical calibration curve of the systemfor continuous measurements of CH4 mixing ratios (WS-CRDS and front-end) as recorded during the field season.True CH4 mixing ratios of the two gas mixtures are plottedagainst the corresponding measurements of the WS-CRDS.Here, the front-end includes the complete system for gas ex-traction, except the melt head which we cannot account forduring calibration since the segmented flow is injected down-stream of the melt head (Fig.1).
Each data point in Fig.2a refers to continuous measure-ments of the corresponding gas mixture for ca. 30 min. Forlinear regression we use Chi-square fitting, which is a spe-cial case of least-square fitting where every data point has itsown, known standard deviation (for details seePress et al.,2007). Here the known standard deviations are the standarddeviations of the continuous measurement series of the twogas mixtures. By using individual standard deviations foreach measurement, we account for a dependance of the mea-surement precision on the CH4 mixing ratio of the samplegas. The optimal linear fit parametersa andb including theirerrors found from linear regression are shown in Fig.2a.When using the calibration curve to find the correct val-ues of measured CH4 mixing ratios the errors from the fitparameters propagate. Using propagation of error we deter-mine the measurement accuracy to be±8 ppbv for typicalglacial/interstadial CH4 mixing ratios.
Prior to the field season we determined a calibrationcurve for the WS-CRDS without the front-end as shown inFig. 2b. To this end, standard gas is injected directly intothe spectrometer. CH4 mixing ratios of two NOAA-certifiedsynthetic air standards (CH4 mixing ratios of 344.3 and
Atmos. Meas. Tech., 5, 999–1013, 2012 www.atmos-meas-tech.net/5/999/2012/

C. Stowasser et al.: Continuous measurements of methane mixing ratios from ice cores 1003
1646.2 ppbv, respectively) are plotted against the correspond-ing measurements of the WS-CRDS. Each data point refersto continuous measurements of the corresponding standardgas for ca. 30 min. Again, we use propagation of error to de-termine the measurement accuracy of the WS-CRDS to be±2 ppbv for typical glacial/interstadial CH4 mixing ratios.As a test we determine the CH4 mixing ratio of a third stan-dard gas to be 686.8± 2 ppbv which is in agreement with thetrue mixing ratio of 688.8 ppbv.
We can conclude that the measurements of the WS-CRDSare more accurate when the spectrometer is measuring di-rectly from a gas bottle (±2 ppbv), compared to measure-ments in combination with our gas extraction system as de-scribed earlier (±8 ppbv). This is due to instabilities in thegas extraction system and a better measurement precision ofthe WS-CRDS for direct measurements of bottled gas (seeSect.2.3).
Figure2a shows that the WS-CRDS in combination withthe front end measures significantly less CH4 compared tothe stand-alone instrument as shown in Fig.2b. This is a re-sult of the solubility of CH4 in water: prior to measurementsof CH4 mixing ratio by the WS-CRDS in combination withthe front-end, the calibration gas has been in contact with wa-ter from the moment it was mixed with deionized water untilit reached the gas extraction module (Fig.1). A significantamount of CH4 molecules are dissolved in the water and arenot completely extracted by the gas extraction module. Anestimation of the amount of dissolved CH4 molecules can befound in the interactive discussion (Stowasser et al., 2012).
The intersect of almost 12 ppbv in Fig.2a suggests a leakin the front-end or, alternatively a non-linearity in the calibra-tion curve. Neither a leak in the front-end, nor non-linearityof the calibration curve could be checked during field mea-surements due to the lack of a third calibration gas and aCH4-free gas, respectively.
2.3 Stability and precision
The stability of the system is characterized by investigatinglong-term drifts in the CH4 mixing ratio measurements. Inthe following we characterize the stability of different partsof the experimental setup and determine the precision of thecorresponding CH4 mixing ratio measurements.
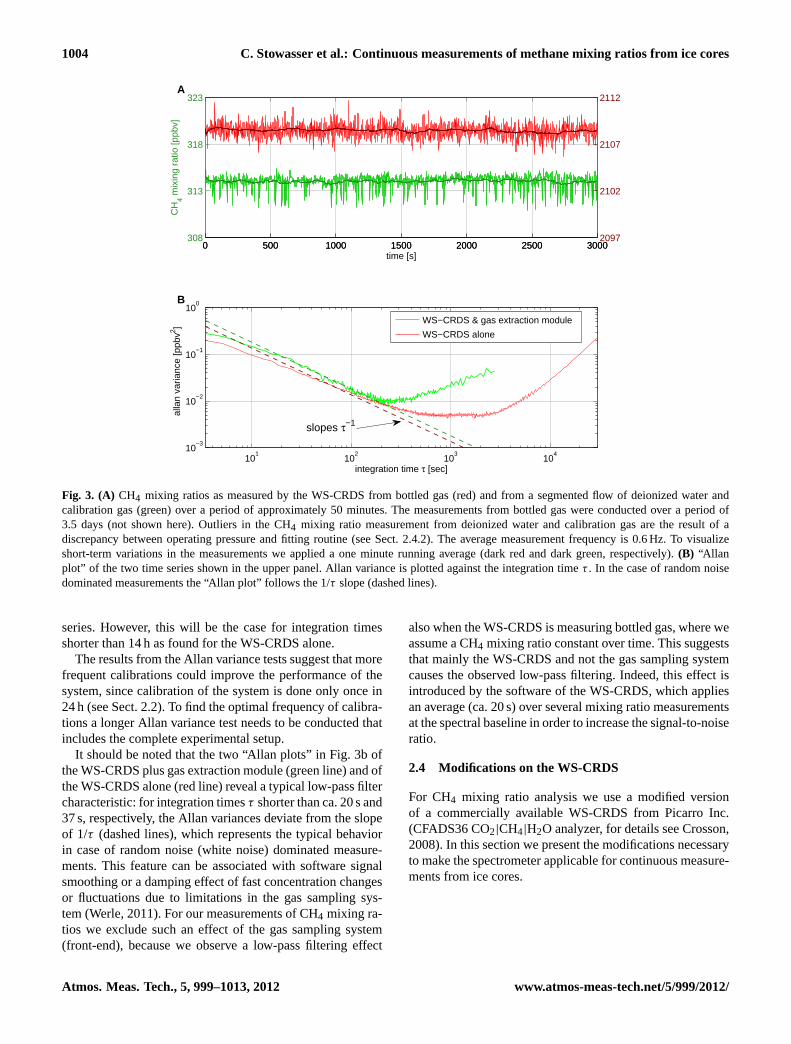
First we characterize the stability of the WS-CRDS incombination with the gas extraction module. For this, we in-troduce a segmented flow of deionized water and bottled gas(3.2 ml min−1, ca. 50 % air by volume) into the setup via the6-port valve (#6 in Fig.1). The green line in Fig.3a showsCH4 mixing ratio measurements of this segmented flow overa period of ca. 1 h. The measurement precision we state forthe combination of WS-CRDS and gas extraction module isgiven by the standard deviation of the non-averaged time se-ries shown in Fig.3a which is 0.7 ppbv (1σ ).
From this series of measurements we quantify the stabilityof the gas extraction system by applying an Allan variance
test (described in detail byWerle, 2011). In brief, Allan vari-ance (Allan, 1966) describes the variance of the mean of aseries of measurements for different integration times. In thetheoretical case of zero-drift measurements, increasing inte-gration times would unboundedly decrease the variance and,thus, the standard deviation of the measurements. However,instrumental drifts will limit the decrease of the standard de-viation for progressively longer integration times. The greenline in Fig.3b shows the Allan variance (or Allan plot) of themeasurement series (green) in Fig.3a. For integration timesτ up to seven minutes the Allan variance decreases and av-eraging of the signal can decrease the standard deviation ofthe CH4 mixing ratio measurements. For longer integrationtimes instrumental drifts overcome the benefits of signal av-eraging, and the Allan variance increases.
The same stability test has been conducted for the WS-CRDS alone without the gas extraction module prior to thefield season; we injected bottled gas into the WS-CRDS di-rectly over a period of 3.5 days. For comparison we showa ca. 1 h long section from this stability test (red line inFig. 3a). The precision for non-averaged measurements isca. 0.6 ppbv (1σ ). The Allan variance of the complete timeseries (red line in Fig.3b) reveals that signal averaging withintegration times up to ca. 30 min improves the variance. Weconclude that the CH4 mixing ratio measurements of the WS-CRDS are more stable when the WS-CRDS is measuring di-rectly from a gas bottle compared to measurements in com-bination with the gas extraction module. Thus, the limitingfactor in terms of the stability of our measurements are insta-bilities in the gas extraction module and not in the measure-ment of the WS-CRDS.
We could not test the stability of the complete experimen-tal setup, i.e. the combination of WS-CRDS, gas extractionmodule and the CFA system. The calibration series describedin Sect.2.2do include WS-CRDS, gas extraction module andCFA system (except the melt head) but are too short to per-form an Allan variance test. The standard deviation of thesecalibration series is 0.8 ppbv (1σ ). The calibration series donot include the melt head, but represent the closest estimatewe can obtain for the precision of continuous measurementsof CH4 mixing ratios from ice cores. Thus, we estimate theprecision of our measurement technique to be ca. 0.8 ppbv.
The results from the Allan variance test of the WS-CRDS alone show that the standard deviation of the averagedtime series becomes larger than the standard deviation ofthe non-averaged time series (0.6 ppbv) for integration timelonger than 14 h. This suggests that the WS-CRDS shouldbe calibrated at least every 14 h to account for instrumentaldrifts and to optimize the performance of CH4 mixing ratiomeasurements.
The Allan variance tests of the WS-CRDS plus gas extrac-tion module is too short to show integration times for whichthe standard deviation of the averaged time series becomeslarger than the standard deviation of the non-averaged time
www.atmos-meas-tech.net/5/999/2012/ Atmos. Meas. Tech., 5, 999–1013, 2012
1004 C. Stowasser et al.: Continuous measurements of methane mixing ratios from ice cores
0 500 1000 1500 2000 2500 3000308
313
318
323
time [s]
CH
4 mix
ing
ratio
[ppb
v]
0 500 1000 1500 2000 2500 30002097
2102
2107
2112
101
102
103
104
10−3
10−2
10−1
100
integration time τ [sec]
a
llan
varia
nce
[ppb
v2 ]
WS−CRDS & gas extraction module
WS−CRDS alone
A
B
slopes τ−1
Fig. 3. (A) CH4 mixing ratios as measured by the WS-CRDS from bottled gas (red) and from a segmented flow of deionized water andcalibration gas (green) over a period of approximately 50 minutes. The measurements from bottled gas were conducted over a period of3.5 days (not shown here). Outliers in the CH4 mixing ratio measurement from deionized water and calibration gas are the result of adiscrepancy between operating pressure and fitting routine (see Sect.2.4.2). The average measurement frequency is 0.6 Hz. To visualizeshort-term variations in the measurements we applied a one minute running average (dark red and dark green, respectively).(B) “Allanplot” of the two time series shown in the upper panel. Allan variance is plotted against the integration timeτ . In the case of random noisedominated measurements the “Allan plot” follows the 1/τ slope (dashed lines).
series. However, this will be the case for integration timesshorter than 14 h as found for the WS-CRDS alone.
The results from the Allan variance tests suggest that morefrequent calibrations could improve the performance of thesystem, since calibration of the system is done only once in24 h (see Sect.2.2). To find the optimal frequency of calibra-tions a longer Allan variance test needs to be conducted thatincludes the complete experimental setup.
It should be noted that the two “Allan plots” in Fig.3b ofthe WS-CRDS plus gas extraction module (green line) and ofthe WS-CRDS alone (red line) reveal a typical low-pass filtercharacteristic: for integration timesτ shorter than ca. 20 s and37 s, respectively, the Allan variances deviate from the slopeof 1/τ (dashed lines), which represents the typical behaviorin case of random noise (white noise) dominated measure-ments. This feature can be associated with software signalsmoothing or a damping effect of fast concentration changesor fluctuations due to limitations in the gas sampling sys-tem (Werle, 2011). For our measurements of CH4 mixing ra-tios we exclude such an effect of the gas sampling system(front-end), because we observe a low-pass filtering effect
also when the WS-CRDS is measuring bottled gas, where weassume a CH4 mixing ratio constant over time. This suggeststhat mainly the WS-CRDS and not the gas sampling systemcauses the observed low-pass filtering. Indeed, this effect isintroduced by the software of the WS-CRDS, which appliesan average (ca. 20 s) over several mixing ratio measurementsat the spectral baseline in order to increase the signal-to-noiseratio.
2.4 Modifications on the WS-CRDS
For CH4 mixing ratio analysis we use a modified versionof a commercially available WS-CRDS from Picarro Inc.(CFADS36 CO2|CH4|H2O analyzer, for details seeCrosson,2008). In this section we present the modifications necessaryto make the spectrometer applicable for continuous measure-ments from ice cores.
Atmos. Meas. Tech., 5, 999–1013, 2012 www.atmos-meas-tech.net/5/999/2012/

C. Stowasser et al.: Continuous measurements of methane mixing ratios from ice cores 1005
2.4.1 Gas flow and pump rate
Gas flow through the WS-CRDS is maintained by a di-aphragm pump which is located at the exhaust of the spec-trometer. For precise spectroscopic measurements of mixingratios a constant pressure in the optical cavity of the WS-CRDS is crucial. A sensitive pressure transmitter records thecavity pressure and sends a feedback to a proportional con-trol valve located at the outlet of the cavity. In this way thevalve regulates the cavity pressure (225.00± 0.05 mbar) andthe gas flow through the spectrometer.
By default, the WS-CRDS is designed for sample gasflows between 70–400 ml min−1. In the case of continuousmeasurements from ice cores the sample flow is set by themelt speed of the CFA system to 1.6 ml min−1. When oper-ating the WS-CRDS at a such a low flow the cavity pressureis unstable and fluctuates around the set point. We applied thefollowing modifications on the gas flow path to enable stableoperation of the WS-CRDS at a gas flow of 1.6 ml min−1:
– An orifice at the inlet of the WS-CRDS is replaced witha fused silica capillary (0.18 mm ID, length ca. 1 m) toincrease resistance for the inlet gas flow.
– A needle valve (SS-SS2-A, Swagelok Company, orificesize 0.81 mm) is placed between the proportional con-trol valve at the outlet of the cavity and the diaphragmpump, which makes it possible to adjust the pump rate.
It is noteworthy that we also tried to dilute the sample gaswith helium in the ratio 1:20, in order to operate the unmod-ified WS-CRDS at the high flow rates for which it was de-signed. To measure the total amount of sample gas withinthe air-helium mixture we used an oxygen sensor (FOSPOR-R probe, Ocean Optics Inc.). This sensor was installed withinthe WS-CRDS as close to the sample cavity as possible toget approximately simultaneous measurements of the oxygenand CH4 mixing ratios of the air-helium mixture. However,this approach was unsuccessful because uncertainties in theoxygen measurement were too large and measurements ofCH4 mixing ratio could not be corrected for the dilution withhelium without introducing unacceptably large errors.
2.4.2 Cavity pressure and fitting routine
The continuous flow of gas through the WS-CRDS is sub-ject to dispersion (sample mixing). Thus, every signal in thecontinuous sample flow is smoothed when analyzed by thespectrometer.
The average time a sample molecule spends in each vol-ume of the WS-CRDS is long when the spectrometer is oper-ated at the low sample gas flow of 1.6 ml min−1, compared todefault operation at gas flows between 70 and 400 ml min−1.Therefore, dispersion and memory effects in the WS-CRDSincrease and reduce the optimal resolution of CH4 mixingratio measurements.
To improve resolution, the pressure in the sample cavity,which is with ca. 33 cm3 by far the largest volume in thespectrometer, is reduced from 225 mbar to 60 mbar1. The in-ternal volume of the WS-CRDS is reduced by switching tosmall-diameter tubing throughout the spectrometer. Further-more, we removed a high-purity gas filter at the inlet of thespectrometer (Wafergard II F Micro In-Line Gas Filter, En-tegris Inc.). The cavity remains protected from contamina-tion by a second, identical filter upstream of the cavity. As areplacement for the first filter, we installed a small-volume,0.5 micron filter at the inlet of the cavity (Valco filters forGC, ZBUFR1, VICI AG). Up to this date no degradationof the quality of CH4 mixing ratio measurements could bedetected.
As a consequence of the lower cavity pressure and the vol-ume reduction, sample gas dispersion and memory effectsin the spectrometer decrease. We quantify this improvementin Sect.3.2.3, where we compare the optimal resolution ofmodified and original WS-CRDS.
To determine the CH4 mixing ratio in air, the softwareof the WS-CRDS applies a spectral fit to the CH4 ab-sorption feature. The low pressure in the sample cavity re-duces pressure-broadening effects and, thus, sharpens the ab-sorption line of CH4 (for detail see e.g.Di Rocco, 2004;Demtroder, 2003). A spectral fit tailored to the lower cav-ity pressure was provided and implemented into the soft-ware by the manufacturer Picarro. However, it turned outafter the field campaign that the pressure reading of theWS-CRDS had a bias of several mbar. This caused insta-bilities in the custom-made spectral fit and, as a conse-quence, outliers in the CH4 mixing ratio measurements asshown in Fig.3a (green line). The reason being that this fit(Levenberg-Marquardt algorithm) is bi-stable under the low-pressure conditions with two optimal points that correspondto two different mixing ratios. Hence, the fit switches be-tween these two states depending on small differences be-tween each spectrum. The red line in Fig.3a shows mea-surements without outliers: during these measurements theinstrument was running in its original mode with a cavitypressure of 225 mbar and the corresponding spectral fit.
The above-mentioned modifications enable us to use acommercial instrument for measurements of CH4 mixing ra-tios from small air samples extracted from ice cores with ahigh temporal resolution. In principle, these modificationscan improve the measurement resolution of any spectrom-eter. However, in the case of continuous flow, small-sampleapplications as described in this work, the internal volume ofthe sample cavity is critical and should be chosen to be assmall as possible. Lowering the sample pressure in the cavity
1The reduced cavity pressure of 60 mbar was a recommenda-tion of the manufacturer. Since then a reduced cavity pressure of30 mbar was tested successfully. It is noteworthy that the standarddeviation of CH4 mixing ratio measurements becomes worse withlower cavity pressure.
www.atmos-meas-tech.net/5/999/2012/ Atmos. Meas. Tech., 5, 999–1013, 2012

1006 C. Stowasser et al.: Continuous measurements of methane mixing ratios from ice cores
A
B
18:00 19:00 20:00 21:00 22:00200
400
600
800
1000
time [HH:MM]
CH
4 mix
ing
ratio
[ppb
v]
2345 2350 2355 2360 2365
500
550
600
650
depth [m from top]
C
H4 m
ixin
g ra
tio [p
pbv]
continuous measurementsdiscrete measurements
Fig. 4. (A) Approximately six hours of uncalibrated CH4 mixing ratios as measured by the WS-CRDS, containing four ice core measure-ments (CH4 mixing ratio ca. 390 ppbv,) and a calibration (red line). Between two consecutive measurements, the WS-CRDS measures amixture of deionized water and bottled gas (ca. 550 ppbv). Switches between this mixture and the sample are indicated by dashed cyanlines. Approximately the first third of each 1.1 m long run is discarded due to sample dispersion and memory effects leaving approximately0.7 m of measurements (green).(B) Discrete measurements of CH4 mixing ratio along the NEEM deep ice core covering a depth between2343–2368 m (black diamonds). 25 consecutive continuous measurements of CH4 mixing ratios along the NEEM deep ice core coveringthe same depth, each along 1.1 m of ice (green line). The continuous measurements have been corrected for the +25 ppbv bias compared todiscrete measurements.
improves the measurements resolution, but decreases the pre-cision due to a smaller signal-to-noise ratio. Hence, one hasto find a compromise between resolution and precision foreach application.
3 Results
3.1 Field measurements
Figure4a shows ca. six hours of CH4 mixing ratio raw data asrecorded by the WS-CRDS during the 2011 NEEM field sea-son representing four CFA runs. Uncalibrated CH4 mixingratios of the four CFA runs are around 390 ppbv, each along1.1 m of ice. Between two consecutive measurements, theWS-CRDS measures a mixture of deionized water and bot-tled gas (CH4 mixing ratio of ca. 550 ppbv). Valve switches(#6 in Fig. 1) between this mixture and the sample are in-dicated by dashed cyan lines. The end of each measurementis clearly defined since ambient air briefly enters the system
which results in spikes in the CH4 mixing ratio. Approxi-mately the first third of each measurement run is discardeddue to sample dispersion and memory effects. This leavesca. 0.7 m per CFA run for non-contaminated CH4 mixing ra-tio measurements (green segments).
Figure4a also shows measurements of two gas mixtureswith known CH4 mixing ratios in red, which are injectedinto the system in order to calibrate the measurements (seeSect.2.2) and to evaluate the response of the experimen-tal setup to a stepwise change in CH4 mixing ratio (seeSect.3.2.1).
In Fig. 4b we show 25 consecutive measurements of CH4mixing ratios (green) on a depth scale measured over a pe-riod of ca. 24 h (ca. 2340–2370 m from top, NEEM deep icecore). We convert the time series of the measurements to adepth scale via the CFA melt rate of 3.2 cm min−1. The mea-surements cover a change in CH4 mixing ratio values fromca. 650 ppbv to ca. 540 ppbv. The measurements are cali-brated using the 2-point calibration described in Sect.2.2.In a second step we correct the measurements for a +25 ppbv
Atmos. Meas. Tech., 5, 999–1013, 2012 www.atmos-meas-tech.net/5/999/2012/

C. Stowasser et al.: Continuous measurements of methane mixing ratios from ice cores 1007
bias we found compared to discrete measurements of CH4mixing ratios. As a comparison we show the discrete mea-surements of CH4 mixing ratio (black diamonds) whichwere conducted at the University of Bern (reproducibility±10 ppbv, melt-refreeze extraction, gas chromatography).
The bias in our calibrated measurements suggests that thecalibration of our experimental setup does not take into ac-count all possible sources of error. A possible cause of thebias could be, that we inject the segmented flow for calibra-tion downstream of the melt head. Thus, we do not includethe melt head and the phase change from ice to water into ourcalibration. By doing so, we make the assumption that boththe sample and the calibration mixture are in equilibrium(with a constant mixing ratio of dissolved CH4 molecules inthe water phase) before the air-water mixture enters the de-bubbler. This, however, might not be the case and could leadto wrong correction factors for the calibration.
Furthermore, the water-to-gas ratio of the segmented flowfor calibration differs slightly from the water-to-gas ratio ofthe sample flow which alters the mixing ratio of dissolvedCH4 molecules. The lack of a precise gas flow meter in theexperimental setup, makes it impossible to compare the gasflow rate of the segmented calibration flow with the sampleflow. It is therefore possible that differences in the water-to-gas ratio result in wrong correction factors.
Also, the 2 l reservoir of deionized water used for the seg-mented calibration flow (upper left in Fig.1) is constantlypurged with 20 ml min−1 of nitrogen gas (ca. 100 % nitro-gen). Thus, we can assume saturation of the deionized wa-ter with nitrogen. Once the nitrogen-saturated water is mixedwith the calibration gas (ca. 70 % nitrogen), the nitrogen mix-ing ratios of the gas and of the water will start to equilibrate.The extra nitrogen will raise the nitrogen content of the cali-bration gas and, thus, lower its CH4 mixing ratio. In this case,the correction factor of the calibration will be too high, whichexplains the positive bias in our results compared to discretemeasurements of CH4 mixing ratio.
Finally, the calibration gases used during the field cam-paign (see Fig.2a) are synthetic air standards, which donot contain Argon. Argon broadens the absorption spectra ofCH4 and a lack of Argon in the calibration gas introduces ameasurements bias. According to the manufacturer, the mag-nitude of this effect is less than 1 ppbv at CH4 mixing ratiosof 600 ppbv and, thus, can only account for a small part ofthe bias found in our measurements.
As shown in Fig.4b, we can correct our continuousmeasurements with discrete measurements at similar depthto account for the bias. When correcting the continuousmeasurements with discrete measurements, the uncertaintyfrom the discrete measurements will propagate and worsenthe earlier stated accuracy of±8 ppbv for the continuousmeasurements.
Gaps within the continuous measurements in Fig.4b aredue to dispersion and mixing effects during the first third ofeach measurement which have to be discarded. The reason
being that it takes approximately 10 min (one third of a CFArun) to replace most of the gas molecules in the sample cav-ity of the WS-CRDS and other parts of the experimentalsetup. These gaps could be minimized by reducing the largevolumes in the experimental setup, like the gas extractionmodule and sample cavity of the WS-CRDS. Alternativelya larger CFA ice core sample would provide a higher gasflow and accelerate the exchange of gas molecules within thesystem.
3.2 Resolution of continuous methane mixing ratiomeasurements
3.2.1 Measurement resolution
To quantify dispersion and memory effects in the experimen-tal setup and to estimate the resolution of CH4 mixing ratiomeasurements we investigate the response of the experimen-tal setup to a stepwise change in CH4 mixing ratio. Here, wefollow an approach similar toGkinis et al.(2010), who usedsimilar techniques to characterize a system for continuousmeasurements of stable isotopes of water using a WS-CRDS.
The continuous flow of gas through the experimental setupis subject to dispersion and memory effects. Thus, every sig-nal in the continuous sample flow is smoothed when analyzedby the system. This sets a limit to the measuring resolutionof the system. A stepwise change between two different CH4mixing ratios is injected into the system via a 4-port valve(#4 in Fig.1). In the theoretical case of zero dispersion andmemory effects, the change between two CH4 mixing ratioscan be described by a scaled version of the Heaviside unitstep functionH(t) as:
S(t) = (C2 − C1)H(t) + C1 (1)
where the valve switch takes place att = 0 andC1 andC2 arethe CH4 mixing ratios of the two gas mixtures as measuredby the WS-CRDS. The measured signal, which is smoothedby dispersion and memory effects, can be described as theconvolution ofS(t) with a smoothing functionG:
m(t) = [S ∗ G](t), (2)
wherem(t) is the signal as measured by the WS-CRDS. Fig-ure5a shows the normalized WS-CRDS signal as a responseto a stepwise change in CH4 mixing ratios at a gas flow rateof 1.6 ml min−1 (black dots). A fit to the data using a scaledversion of the cumulative distribution function (cdf) of a log-normal distribution is shown as a dashed red line. The deriva-tive of the measured signal dm/dt gives the response of theexperimental setup to a scaled version of theδDirac pulse:
dm
dt=
dS
dt∗ G = (C2 − C1)
dHdt
∗ G = (C2 − C1) δDirac ∗ G. (3)
Figure 5b shows the derivative of the normalized step re-sponse shown in Fig.5a, i.e. the response of the system to a
www.atmos-meas-tech.net/5/999/2012/ Atmos. Meas. Tech., 5, 999–1013, 2012

1008 C. Stowasser et al.: Continuous measurements of methane mixing ratios from ice cores
−400 −300 −200 −100 0 100 200 300 400
0
0.2
0.4
0.6
0.8
1
time [s]
mnorm
(t)
−400 −300 −200 −100 0 100 200 300 400−6
−4
−2
0
2
4
6
8
10
x 10−3
time [s]
d/d
t(m
norm
(t))
[1/s]
10−4
10−3
10−2
10−1
10−3
10−2
10−1
100
frequency [1/s]
abs(
G(f
))A
B
C
Fig. 5. (A) Normalized response of the complete experimental setup(except melt head) to a stepwise change in CH4 mixing ratio (blackdots) and a cdf fit (dashed red line) as a function of measurementtime. (B) The derivative of the normalized step response (blackdots) and of the cdf fit (dashed red line) with respect to the mea-surement time.(C) The transfer functions of the experimental setup(black dots) and of the theoretical case of zero-noise measurements(dashed red line).
δDirac pulse (black dots). The derivative of the cdf fit is shownas a dashed red line. We define the normalized derivativem′
as
m′=
dm
dt∗ (C2 − C1)
−1 . (4)
The transfer functionG(f ) of the experimental setup is theFourier transform of the normalized derivativem′. The mag-nitude of the transfer function describes how the amplitudeof a periodic input signal of a certain frequency is dampedwhen analyzed by the system. Figure5c shows the magni-tude of the transfer function (black dots) of the system. Forexample, the amplitude of a periodic input signal with a fre-quency of 0.004 s−1 is attenuated by 80 % after being ana-lyzed by the system compared to the amplitude of the inputsignal. The transfer functions of the derivative of the cdf fitrepresents the theoretical zero-noise case (dashed red line).Due to noise in the measurements, it is not possible to re-solve any periodic input signal with a frequency larger thanca. 0.01 s−1 which sets the optimal temporal resolution of oursystem.
We convert the time scalet in seconds to a length scalex in meters by using the CFA melt rate of ca. 3.2 cm min−1.Hereby we can estimate the spatial resolution of CH4 mix-ing ratio measurements along an ice core. This determinesthe maximal spatial resolution of our measurement technique(WS-CRDS and front-end) to be ca. 5 cm of ice, correspond-ing to ca. 100 s of measurement time. Thus, our system candetected a damped version of periodic input signals with awavelength longer than 5 cm.
The spatial resolution of 5 cm in combination with the highmeasurements speed of typically 20–25 m of ice per day isthe main advantage of our measurement technique. The semi-automated method with a gas chromatograph coupled to theCFA system offers the same measurement speed but the res-olution is limited to 15 cm (Schupbach et al., 2009). Discretemeasurements of CH4 mixing ratios from ice cores yield atypical measurement speed of 10–12 samples per day anda resolution of 140 cm (Loulergue et al., 2008) up to 100 cmfor detailed studies over short parts of the core (e.g.Fluckigeret al., 2004; Huber et al., 2006).
3.2.2 Comparing the measurement resolution to the firnresponse
In this section we compare the estimated resolution of theanalytical setup to the resolution available from different icecores using firn modeling.
The porous firn layer at the top 40–120 m of the ice sheetcauses diffusive smoothing of the atmospheric signal (e.g.Schwander et al., 1988; Battle et al., 1996). This limits thetemporal resolution at which variations in atmospheric com-position are preserved in the air bubbles. The firn acts as alow-pass filter for the atmospheric signal, and high frequencyvariations, such as the annual cycles of various trace gases,are not recorded in the ice. Here we shall study the frequencyresponse of the firn layer to assess how atmospheric varia-tions at different frequencies are attenuated and preserved.Knowing the accumulation rate and thinning function in theice sheet, the temporal CH4 variations in the atmosphere canbe mapped onto spatial CH4 variations along a drilled ice
Atmos. Meas. Tech., 5, 999–1013, 2012 www.atmos-meas-tech.net/5/999/2012/

C. Stowasser et al.: Continuous measurements of methane mixing ratios from ice cores 1009
core. By comparing the transfer function of the firn to that ofour experimental setup we can assess whether our measure-ments capture all the CH4 variations recorded in the ice core,i.e. whether we are over- or undersampling the available cli-matic signal.
We use the Center for Ice and Climate firn air model (Buiz-ert et al., 2011) to model gas transport in the porous firn.The model was adapted to allow calculation of mixing ratiosin the closed pores, using the porosity parameterization ofGoujon et al.(2003). We force the model at the surface witha unit step function in CH4 mixing ratio, equivalent to thestep function we used to characterize the experimental setup.We model the firn response on a time scale; this can easilybe converted to a depth scale by multiplying with the annuallayer thicknessλ at the depth considered. Ice flow reducesthe layer thicknesses towards the bed; we base our estimatesof λ on a preliminary NEEM depth-age scale constructed bymatching of reference horizons to the NGRIP GICC05 timescale (S. O. Rasmussen, personal communication, 2011).
We analyze four time slices representing different climaticconditions, and degrees of annual layer thinning. The firsttwo represent the early and late Holocene, with ages of 1 kyrand 7 kyr before present (1 kyr = 1000 yr); these periods arepresent in the NEEM ice core at annual layer thicknesses ofλ = 18 andλ = 11 cm, respectively. For both we use the mod-ern day firn air transport characteristics as described byBuiz-ert et al.(2011). The effects of Holocene temperature andaccumulation variability on the firn transport properties arenot taken into account as they are small (Schwander et al.,1997; Goujon et al., 2003). Note that for these two cases thetime response of the firn is assumed to be identical; they onlydiffer in the amount of layer thinning they experienced. At-mospheric variation in the late Holocene will be more easilyresolved, due to less severe layer thinning in this part of thecore compared to the early Holocene.
The other two time slices represent the glacial period, withages of 23 kyr (LGM) and 66 kyr before present; withλ = 1andλ = 0.5 cm, respectively. Modeling the firn transport inthe past requires detailed knowledge of the firn denisty pro-file and transport properties. Unfortunately the relationshipbetween density and diffusivity is highly site specific andnot well represented by measurements on finite firn samples(Fabre et al., 2000). The current day diffusivity-depth rela-tionship can be reconstructed using measurements of tracegas mixing ratios in firn air samples (Rommelaere et al.,1997; Trudinger et al., 1997). However, since climatic con-ditions strongly influence the firn transport properties, thisis of limited use when considering e.g. ice from glacial pe-riods (Schwander et al., 1997). We estimate the LGM ac-cumulation at NEEM to be around 8 cm yr−1 ice equivalentbased on reconstructions for the NGRIP ice core (Andersenet al., 2004); our estimate of the mean annual temperature is−50◦C based on an inversion study of borehole thermometryat GRIP byDahl-Jensen et al.(1998). With an accumulationrate of 8 cm yr−1 and a mean annual temperature of−49.5◦C
(Battle et al., 1996), South Pole offers a good modern dayanalog for NEEM during the LGM. Consequently we havetuned the effective diffusivity of the model to firn air mea-surements from modern day South Pole. We increased thedepth of convective mixing until gravitational fractionationmatched LGM data from the GRIP core (Schwander et al.,1997).
In Fig. 6a we show the comparison of the firn responsesfrom the four analyzed time slices. Furthermore, we com-pare the firn responses to the normalized step-response ofthe experimental setup (see Sect.3.2.1). For the normalizedstep-response we converted from measurement time to depthusing the CFA melt rate of ca. 3.2 cm min−1. Figure6b showsthe transfer functions of the five responses shown in Fig.6aas a function of frequencyf and wavenumberk.
It must be noted that the modeled firn response, partic-ularly during the glacial, has a high uncertainty. By usingSouth Pole as a realistic modern analog this uncertainty isminimized; we estimate the firn response time shoud be ac-curate within 50 % for the glacial, and within 25 % for theHolocene. Even with such a high uncertainty we can con-clude that the continuous measurements of CH4 mixing ra-tio can resolve all climatically relevant CH4 variations in thefirn column with wavenumbers (frequencies) smaller than0.2 cm−1 (0.01 s−1) down to a depth of 1980 m (66 kyr BP).CH4 variations in the firn column with wavenumbers largerthan 0.2 cm−1 cannot be resolved due to measurement noise.
Nevertheless, a higher resolution of the continuous mea-surements of CH4 mixing ratios from ice cores would bebeneficial. A higher measurement resolution would shortenthe gaps between consecutive measurements (see Sect.3.1).Furthermore, non-atmospheric variations in CH4 mixing ra-tio found in the ice could be resolved better, such as in-situproduction of CH4 or high CH4 mixing ratios associated withmelt layers.
3.2.3 Improving measurement resolution of theWS-CRDS
To quantify the improvement in resolution due to the WS-CRDS modification we use the same techniques as describedin Sect.3.2.1. Omitting the front-end, gas was directly in-jected into the original and modified spectrometer, respec-tively. Figure7a shows the normalized responses of the origi-nal analyzer (green squares) and the modified analyzer (blackdots) to an identical stepwise change in CH4 mixing ratio ata gas flow rate of 2 ml min−1. A cdf fit to the data is shown asa dashed red line. The modified analyzer responds faster to achange in CH4 mixing ratio: it takes 250 s to go from 10 %to 90 % of the normalized step using the original analyzer,whereas it takes only 48 s using the modified analyzer.
Figure7b shows the time derivative of the normalized re-sponses from which we calculate the transfer functions ofthe original and modified analyzer as shown in Fig.7c. Theamplitude of a periodic input signal with a frequency of
www.atmos-meas-tech.net/5/999/2012/ Atmos. Meas. Tech., 5, 999–1013, 2012

1010 C. Stowasser et al.: Continuous measurements of methane mixing ratios from ice cores
−213 −107 0 107 213
0
0.2
0.4
0.6
0.8
1
distance[cm]
mnorm
(t)
−4000 −2000 0 2000 4000time[s]
mnorm
(x)
10−4
10−3
10−2
10−1
10−3
10−2
10−1
100
frequency[1/s]
abs(
G(f
))
10−3
10−2
10−1
100
wavenumber[1/cm]
abs(G
(k))
A B
Fig. 6. (A) Firn responses from four different time slices compared to the response of the experimental setup to a stepwise change in CH4mixing ratio. Curves are aligned with maximum slope att = 0 s.(B) The transfer functions of the responses shown in the left panel.
0.001 s−1 e.g. is attenuated by 20 % of the input amplitudein the original analyzer. However, in the modified analyzerthe same input signal is not attenuated noticeably. By com-paring the transfer functions of the analyzer to the transferfunction of the cdf fit (dashed red lines) we find that the orig-inal analyzer cannot resolve periodic input signals with fre-quencies larger than ca. 0.01 s−1 due to noise in the measure-ments. Using the modified analyzer it is possible to resolveperiodic input signals with frequencies up to ca. 0.03 s−1.We can conclude that the modifications on the WS-CRDSimproved the resolution of CH4 mixing ratio measurement,which makes continuous measurements of CH4 mixing ratiosfrom ice cores feasible.
Comparing the optimal resolution of the modified spec-trometer (0.03 s−1) with the optimal resolution of the mod-ified spectrometer plus front-end as derived in Sect.3.2.1(0.01 s−1), we conclude that the front-end has a significanteffect on the optimal resolution of continuous measurementsof CH4 mixing ratios from ice cores. To improve resolutioneven further it is necessary to minimize sample volumes bothin the spectrometer (e.g. sample cavity) and in the front end(e.g. gas extraction module).
For frequencies larger than ca. 0.01 s−1 the transfer func-tion of the original analyzer shows flat (white) noise, whichis independent of frequency (green squares in Fig.7c). How-ever, the transfer function of the modified analyzer plus front-end shows frequency-dependent noise (Figs.5c and6b). Forfrequenciesf larger than ca. 0.01 s−1 the transfer functionscales approximately withf . We cannot determine whetherthe cause of this noise behavior lies in the modified analyzeror the front-end.
4 Summary and conclusions
We modified a commercially available WS-CRDS to make itsuitable for continuous CH4 mixing ratio measurements fromice cores in combination with a CFA system. The modifiedflow path enables stable operation of the WS-CRDS at a gasflow of ca. 1.6 ml min−1. The reduced cavity pressure im-proves the resolution of the measurements considerably, al-lowing for highly resolved continuous measurements of CH4mixing ratios. The measurement resolution (ca. 5 cm of ice)of the complete experimental setup, i.e. CFA system (exceptmelt head), gas extraction module and WS-CRDS combined,is sufficient to resolve all climatic relevant CH4 variations inthe firn at least down to a depth of 1980 m of the NEEM deepice core.
For the current system we determine a precision of0.8 ppbv (1σ ). We find that the limiting factor of the stabilityof the measurement technique is the gas extraction systemand not the WS-CRDS. Given the current stability of the sys-tem one calibration per day is not sufficient to capture andcorrect for all drifts in the measurement. By improving thestability of the gas extraction the precision of CH4 mixingratio measurements could be improved further.
We estimate the accuracy of continuous CH4 mixing ra-tio measurements to be±8 ppbv. By comparing the contin-uous measurements of CH4 mixing ratios with traditionaldiscrete measurements from the same ice core we find aconcentration-independent bias of ca. 25 ppbv between thetwo techniques. We need to correct for this bias using dis-crete measurements at similar depth.
To improve the quality of future measurements, the fieldcalibration procedure needs to be refined. A review of the
Atmos. Meas. Tech., 5, 999–1013, 2012 www.atmos-meas-tech.net/5/999/2012/

C. Stowasser et al.: Continuous measurements of methane mixing ratios from ice cores 1011
−400 −200 0 200 400
0
0.2
0.4
0.6
0.8
1
time [s]
mnorm
(t)
originalanalyzermodifiedanalyzer
−400 −200 0 200 4000
0.005
0.01
0.015
0.02
0.025
time [s]
d/d
t(m
norm
(t))
[1/s]
10-4
10-3
10-2
10-110
-3
10-2
10-1
100
frequency [1/s]
abs(
G(f
))A
B
C
Fig. 7. (A) Normalized response of the original (green squares) andthe modified analyzer (black dots) to a stepwise change in CH4mixing ratio plotted against measurement time in seconds. Cdf fitsto the measurements are shown as dashed red lines.(B) The timederivative of the normalized responses from(A). (C) The transferfunctions of the original and modified analyzer. The dashed linesshow the transfer functions of the analyzer in the theoretical case ofzero-noise measurements.
importance of calibration procedures can be found inWerleet al. (2004). Our calibration procedure needs to be com-pleted by measurements of “zero air” (ambient air devoid ofthe target substance CH4) and checks of linearity by mea-suring calibration gases of three known CH4 mixing ratios(closely covering the dynamic range as found in the ice coresanalyzed). Hereby, potential drifts in the measurements of
the spectrometer can be detected (and corrected for) and theaccuracy of CH4 mixing ratio measurements is optimized.Additionally, the optimal interval between individual calibra-tions needs to be determined by further Allan variance teststo improve measurement stability.
We conclude that our new technique for continuous mea-surements of CH4 mixing ratios from ice cores provides mea-surements of high resolution and precision. The spatial res-olution of 5 cm in combination with the high measurementspeed of typically 20–25 m of ice per day is the main ad-vantage of our measurement technique. The new techniqueis coupled to a CFA system where the chemical compositionof the ice core is measured. Therefore, our system does notrequire ice core samples solely dedicated for measurementsof CH4 mixing ratio.
Acknowledgements.We like to thank Eric Crosson, Chris Rellaand Aaron van Pelt from Picarro Inc. for their support of this work.The authors did not receive any financial support from Picarro forthe work presented in this study. NEEM is directed and organisedby the Center for Ice and Climate at the Niels Bohr Instituteand US NSF, Oce of Polar Programs. It is supported by fundingagencies and institutions in Belgium (FNRS-CFB and FWO),Canada (GSC), China (CAS), Denmark (FIST), France (IPEV,CNRS/INSU, CEA and ANR), Germany (AWI), Iceland (RannIs),Japan (NIPR), Korea (KOPRI), The Netherlands (NWO/ALW),Sweden (VR), Switzerland (SNF), UK (NERC) and the USA(US NSF, Oce of Polar Programs). LGGE contribution was sup-ported by the French ANR NEEM (ANR-07-VULN-09-001). Thisis Past4Future contribution no. 14. The research leading to theseresults has received funding from the European Union’s SeventhFramework programme (FP7/2007-2013) under grant agreementno. 243908, “Past4Future. Climate change – Learning from thepast climate”.
Edited by: P. Werle
References
Allan, D.: Statistics of atomic frequency standards, Proc. IEEE, 54,221–230, 1966.
Andersen, K., Azuma, N., Barnola, J., Bigler, M., Biscaye, P., Cail-lon, N., Chappellaz, J., Clausen, H., Dahl-Jensen, D., Fischer,H., Fluckiger, J., Fritzsche, D., Fujii, Y., Goto-Azuma, K., Gron-vold, K., Gundestrup, N., Hansson, M., Huber, C., Hvidberg, C.,Johnsen, S., Jonsell, U., Jouzel, J., Kipfstuhl, S., Landais, A.,Leuenberger, M., Lorrain, R., Masson-Delmotte, V., Miller, H.,Motoyama, H., Narita, H., Popp, T., Rasmussen, S., Raynaud, D.,Rothlisberger, R., Ruth, U., Samyn, D., Schwander, J., Shoji, H.,Siggard-Andersen, M., Steffensen, J., Stocker, T., Sveinbjorns-dottir, A., Svensson, A., Takata, M., Tison, J., Thorsteinsson,T., Watanabe, O., Wilhelms, F., and White, J.: High-resolutionrecord of Northern Hemisphere climate extending into the lastinterglacial period, Nature, 431, 147–151, 2004.
www.atmos-meas-tech.net/5/999/2012/ Atmos. Meas. Tech., 5, 999–1013, 2012

1012 C. Stowasser et al.: Continuous measurements of methane mixing ratios from ice cores
Battle, M., Bender, M., Sowers, T., Tans, P., Butler, J., Elkins,J., Ellis, J., Conway, T., Zhang, N., Lang, P., and Clarke, A.:Atmospheric gas concentrations over the past century mea-sured in air from firn at the South Pole, Nature, 383, 231–235,doi:10.1038/383231a0, 1996.
Bigler, M., Svensson, A., Kettner, E., Vallelonga, P., Nielsen, M.,and Steffensen, J.: Optimization of High-Resolution ContinuousFlow Analysis for Transient Climate Signals in Ice Cores, Envi-ron. Sci. Technol., 45, 4483–4489,doi:10.1021/es200118j, 2011.
Blunier, T. and Brook, E.: Timing of millennial-scale climatechange in Antarctica and Greenland during the last glacial pe-riod, Science, 291, 109–112,doi:10.1126/science.291.5501.109,2001.
Blunier, T., Spahni, R., Barnola, J.-M., Chappellaz, J., Loulergue,L., and Schwander, J.: Synchronization of ice core records via at-mospheric gases, Clim. Past, 3, 325–330,doi:10.5194/cp-3-325-2007, 2007.
Buizert, C., Martinerie, P., Petrenko, V. V., Severinghaus, J. P.,Trudinger, C. M., Witrant, E., Rosen, J. L., Orsi, A. J., Rubino,M., Etheridge, D. M., Steele, L. P., Hogan, C., Laube, J. C.,Sturges, W. T., Levchenko, V. A., Smith, A. M., Levin, I., Con-way, T. J., Dlugokencky, E. J., Lang, P. M., Kawamura, K., Jenk,T. M., White, J. W. C., Sowers, T., Schwander, J., and Blunier, T.:Gas transport in firn: multiple-tracer characterisation and modelintercomparison for NEEM, Northern Greenland, Atmos. Chem.Phys. Discuss., 11, 15975–16021,doi:10.5194/acpd-11-15975-2011, 2011.
Capron, E., Landais, A., Chappellaz, J., Schilt, A., Buiron, D.,Dahl-Jensen, D., Johnsen, S. J., Jouzel, J., Lemieux-Dudon, B.,Loulergue, L., Leuenberger, M., Masson-Delmotte, V., Meyer,H., Oerter, H., and Stenni, B.: Millennial and sub-millennialscale climatic variations recorded in polar ice cores over the lastglacial period, Clim. Past, 6, 345–365,doi:10.5194/cp-6-345-2010, 2010.
Chappellaz, J., Blunier, T., Raynaud, D., Barnola, J., Schwander, J.,and Stauffer, B.: Synchronous changes in atmospheric CH4 andGreenland climate between 40 and 8 kyr BP, Nature, 366, 443–445,doi:10.1038/366443a0, 1993.
Crosson, E.: A cavity ring-down analyzer for measuring atmo-spheric levels of methane, carbon dioxide, and water vapor, Appl.Phys. B-Lasers O., 92, 403–408,doi:10.1007/s00340-008-3135-y, 2008.
Dallenbach, A., Blunier, T., Fluckiger, J., Stauffer, B., Chappellaz,J., and Raynaud, D.: Changes in the atmospheric CH4 gradientbetween Greenland and Antarctica during the Last Glacial andthe transition to the Holocene, Geophys. Res. Lett., 27, 1005–1008,doi:10.1029/1999GL010873, 2000.
Dahl-Jensen, D., Mosegaard, K., Gundestrup, N., Clow, G.,Johnsen, S., Hansen, A., and Balling, N.: Past temperatures di-rectly from the Greenland ice sheet, Science, 282, 268–271,doi:10.1126/science.282.5387.268, 1998.
Demtroder, W.: Laser Spectroscopy, Springer-Verlag, 2003.Di Rocco, H.: The exact expression of the Voigt pro-
file function, J. Quant. Spectrosc. Ra., 92, 231–237,doi:10.1016/j.jqsrt.2004.08.002, 2004.
Fabre, A., Barnola, J., Arnaud, L., and Chappellaz, J.: Determina-tion of gas diffusivity in polar firn: comparison between experi-mental measurements and inverse modeling, Geophys. Res. Lett.,27, 557–560,doi:10.1029/1999GL010780, 2000.
Fluckiger, J., Blunier, T., Stauffer, B., Chappellaz, J., Spahni, R.,Kawamura, K., Schwander, J., Stocker, T., and Dahl-Jensen,D.: N2O and CH4 variations during the last glacial epoch: In-sight into global processes, Global Biochem. Cy., 18, GB1020,doi:10.1029/2003gb002122, 2004.
Gkinis, V., Popp, T., Johnsen, S., and Blunier, T.: A con-tinuous stream flash evaporator for the calibration ofan IR cavity ring-down spectrometer for the isotopicanalysis of water, Isot. Environ. Healt. S., 46, 463–475,doi:10.1080/10256016.2010.538052, 2010.
Goujon, C., Barnola, J., and Ritz, C.: Modeling the densi-fication of polar firn including heat diffusion: Applicationto close-off characteristics and gas isotopic fractionation forAntarctica and Greenland sites, J. Geophys. Res., 108, 4792,doi:10.1029/2002JD003319, 2003.
Gulluk, T., Wagner, H., and Slemr, F.: A high-frequency modulatedtunable diode laser absorption spectrometer for measurements ofCO2, CH4, N2O, and CO in air samples of a few cm, Rev. Sci.Instrum., 68, 230–239, 1997.
Gulluk, T., Slemr, F., and Stauffer, B.: Simultaneous measure-ments of CO2, CH4, and N2O in air extracted by sublimationfrom Antarctica ice cores: confirmation of the data obtained us-ing other extraction techniques, J. Geophys. Res., 103, 15971–15978, 1998.
Huber, C., Leuenberger, M., Spahni, R., Fluckiger, J., Schwan-der, J., Stocker, T., and Johnsen, S.: Isotope calibrated Green-land temperature record over Marine Isotope Stage 3 andits relation to CH4, Earth Planet. Sc. Lett., 243, 504–519,doi:10.1016/j.epsl.2006.01.002, 2006.
Kaufmann, P., Federer, U., Hutterli, M., Bigler, M., Schupbach,S., Ruth, U., Schmitt, J., and Stocker, T.: An improved con-tinuous flow analysis system for high-resolution field measure-ments on ice cores, Environ. Sci. Technol., 42, 8044–8050,doi:10.1021/es8007722, 2008.
Loulergue, L., Schilt, A., Spahni, R., Masson-Delmotte, V., Blu-nier, T., Lemieux, B., Barnola, J., Raynaud, D., Stocker, T., andChappellaz, J.: Orbital and millennial-scale features of atmo-spheric CH4 over the past 800,000 years, Nature, 453, 383–386,doi:10.1038/nature06950, 2008.
Mitchell, L., Brook, E., Sowers, T., McConnell, J., and Tay-lor, K.: Multidecadal variability of atmospheric methane,1000–1800 CE, J. Geophys. Res.-Biogeo., 116, G02007,doi:10.1029/2010jg001441, 2011.
Press, W., Flannery, B., Teukolsky, S., and Vetterling, W.: Numeri-cal recipes, vol. 3, Cambridge Univ. Press, 2007.
Rella, C.: Accurate Greenhouse Gas Measurements inHumid Gas Streams Using the Picarro G1301 Car-bon Dioxide/Methane/Water Vapor Gas Analyzer,Tech. rep., Picarro Inc.,www.picarro.com/assets/docs/White PaperG1301WaterVapor Correction.pdf (last access:8 May 2012), 2010.
Rommelaere, V., Arnaud, L., and Barnola, J.: Reconstructing recentatmospheric trace gas concentrations from polar firn and bub-bly ice data by inverse methods, J. Geophys. Res., 102, 30069–30083,doi:10.1029/97JD02653, 1997.
Schupbach, S., Federer, U., Kaufmann, P., Hutterli, M., Buiron,D., Blunier, T., Fischer, H., and Stocker, T.: A new method forhigh-resolution methane measurements on polar ice cores us-ing continuous flow analysis, Environ. Sci. Technol., 43, 5371,
Atmos. Meas. Tech., 5, 999–1013, 2012 www.atmos-meas-tech.net/5/999/2012/

C. Stowasser et al.: Continuous measurements of methane mixing ratios from ice cores 1013
doi:10.1021/es9003137, 2009.Schupbach, S., Federer, U., Bigler, M., Fischer, H., and Stocker,
T. F.: A refined TALDICE-1a age scale from 55 to 112 kabefore present for the Talos Dome ice core based on high-resolution methane measurements, Clim. Past, 7, 1001–1009,doi:10.5194/cp-7-1001-2011, 2011.
Schwander, J., Stauffer, B., and Sigg, A.: Air mixing in firn and theage of the air at pore close-off, Ann. Glaciol., 10, 141–145, 1988.
Schwander, J., Sowers, T., Barnola, J., Blunier, T., Fuchs, A., andMalaize, B.: Age scale of the air in the summit ice: Implicationfor glacial-interglacial temperature change, J. Geophys. Res.,102, 19483–19493,doi:10.1029/97JD01309, 1997.
Sowers, T., Brook, E., Etheridge, D., Blunier, T., Fuchs, A., Leuen-berger, M., Chappellaz, J., Barnola, J., Wahlen, M., Deck, B., andWeyhenmeyer, C.: An interlaboratory comparison of techniquesfor extracting and analyzing trapped gases in ice cores, J. Geo-phys. Res.-Oceans, 102, 26527–26538,doi:10.1029/97JC00633,1997.
Stowasser, C., Buizert, C., Gkinis, V., Chappellaz, J., Schupbach,S., Bigler, M., Faın, X., Sperlich, P., Baumgartner, M., Schilt, A.,and Blunier, T.: Continuous measurements of methane mixingratios from ice cores, Atmos. Meas. Tech. Discuss., 5, 211–244,doi:10.5194/amtd-5-211-2012, 2012.
Trudinger, C., Enting, L., Etheridge, D., Francey, R., Levchenko, V.,Steele, L., Raynaud, D., and Arnaud, L.: Modeling air movementand bubble trapping in firn, J. Geophys. Res., 102, 6747–6763,doi:10.1029/96JD03382, 1997.
Werle, P.: Accuracy and precision of laser spectrometers for tracegas sensing in the presence of optical fringes and atmosphericturbulence, Appl. Phys. B, 10, 251–253,doi:10.1007/s00340-010-4165-9, 2011.
Werle, P., Mazzinghi, P., D’Amato, F., Rosa, M. D., Maurer, K., andSlemr, F.: Signal processing and calibration procedures for in situdiode-laser absorption spectroscopy, Spectrochim. Acta A, 60,1685–1705,doi:10.1016/j.saa.2003.10.013, 2004.
www.atmos-meas-tech.net/5/999/2012/ Atmos. Meas. Tech., 5, 999–1013, 2012