continuous benthic community change along a depth gradient in antarctic shallows: evidence of...
TRANSCRIPT
Polar Biol (2008) 31:189–198
DOI 10.1007/s00300-007-0346-3ORIGINAL PAPER
Continuous benthic community change along a depth gradient in Antarctic shallows: evidence of patchiness but not zonation
Dan A. Smale
Received: 14 May 2007 / Revised: 20 July 2007 / Accepted: 24 July 2007 / Published online: 10 August 2007© Springer-Verlag 2007
Abstract Many shallow water polar communities demon-strate considerable change along a bathymetric gradient.However, it is currently unclear whether communitychange is generally continuous or discrete. To determinethe nature of community change with depth, extensive pho-tographic surveys at three sites at Adelaide Island, WestAntarctic Peninsula, were conducted along a bathymetricgradient of 5–35 m depth. Macroalgae were largely absentat the sites, so only distinguishable macrofauna werecounted and analysed. Faunal abundance was greatest at theshallowest stations of the depth transects, whilst richness atboth species and phylum level increased with depth. Vari-ability in community structure between replicate transectsdecreased with depth, so that assemblages at >25 m depthwere more homogenous. Depth had a highly signiWcanteVect on total abundance, species richness and communitystructure, and it is likely that the frequency of ice distur-bance, which also decreases with depth, drives this pattern.Overall, high variability between transects at each site wasrecorded, which suggested considerable patchiness at thescale of tens of meters. Community change along thebathymetric gradient was continuous and no evidence ofdiscrete zones of assemblages was recorded.
Keywords Antarctica · Environmental gradients · Subtidal ecology · Polar communities · Underwater photography
Introduction
In most habitats, the distribution of species reXects thechanging physical constraints acting along an environmen-tal gradient. Classic examples include the distributions ofinvertebrates and macroalgae on rocky shores (Colman1933; Stephenson and Stephenson 1972) and vegetationalong mountain slopes (Beals 1969). However, recentresearch shows that patterns of assemblage change alongenvironmental gradients are patchy, and may be discrete,continuous or hierarchal, depending on a number of com-plex interacting factors (Underwood and Chapman 1995;Benedetti-Cecchi 2001; Hemp 2006). In the past half-century, Antarctic benthologists have presented strong evi-dence to suggest the existence of depth-dependentdistribution of organisms in shallow nearshore waters(Zamorano 1983; Gambi et al. 1994; Nonato et al. 2000;Barnes and Brockington 2003). To date, at least 30published studies from around Antarctica have suggestedthat benthic community structure in shallow subtidal zones(0–50 m depth) changes along a bathymetric gradient. Ice-mediated disturbance, in the form of iceberg scouring (Peckand Bullough 1993; Sahade et al. 1998; Nonato et al.2000), encapsulation by the ice foot (Barnes 1995a; Walleret al. 2006) or the eVects of anchor ice (Dayton et al. 1969,1970), have been frequently suggested as the driving forcebehind the depth-dependent distribution of benthos.
Recently, attempts have been made to quantify the fre-quency and intensity of disturbance by ice in the shallowsubtidal zone. Exposed communities at »10 m depth maybe impacted by ice more than once a year (Brown et al.2004), whilst the frequency of ice disturbance signiWcantlydecreases with depth (Smale et al. 2007a). Therefore, itseems likely that in the shallows ice disturbance structuresthe benthos, whilst at depths below »30 m biological factors
D. A. Smale (&)British Antarctic Survey, Natural Environment Research Council, High Cross, Madingley Road, Cambridge, CB3 OET, UKe-mail: [email protected]
123

190 Polar Biol (2008) 31:189–198
such as competition and predation become more dominantin determining organism distribution (Dayton et al. 1974;Sahade et al. 1998). Antarctic communities often demon-strate a high degree of patchiness (Gutt and Starmans 1998;Gutt 2000; Gutt and Piepenburg 2003) and factors otherthan ice disturbance that may inXuence community struc-ture include substratum (Kirkwood and Burton 1988;Barnes 1995b), input of settling phytoplankton (Dayton andOliver 1977), contamination (Lenihan and Oliver 1995;Conlan et al. 2004) and current Xow (Ragua-Gil et al.2004).
Despite the widely accepted paradigm that coastal Ant-arctic benthic community structure changes along a bathy-metric gradient, there are currently no studies withacceptable replication at the sample, transect and site levelof study. Furthermore, very few studies have utilised pow-erful multivariate techniques, which have become usefultools for modern ecologists studying natural systems(James and McCulloch 1990; Clarke 1993; Jackson 1993).A number of previous studies have suggested that assem-blages in the Antarctic subtidal are arranged in discrete“zones” along the depth gradient, although the level of rep-lication and resolution of these studies have been generallyinsuYcient to assess both horizontal and vertical variability(Sahade et al. 1998; Nonato et al. 2000; Barnes and Broc-kington 2003).
The current study aimed to test the following hypothe-ses: (1) the abundances of species, phyla and structuralforms change along a vertical (bathymetric) gradient innearshore Antarctic waters, (2) assemblages change along a
continuum and do not form discrete boundaries or zones,(3) due to the stochastic nature of ice disturbance, horizon-tal patchiness across the bathymetric gradient is signiWcant.
Materials and methods
Study sites
Sampling was conducted at three sites, Cheshire Island,South Cove and Ryder Buttress, close to the British Antarc-tic Survey research station at Rothera Point, AdelaideIsland, West Antarctic Peninsula (67° 34.5� S, 68° 07.0� W,Fig. 1). Typically the study area is covered by winter fastice for »7 months of the year, temperatures range from¡1.9 to +1.5°C (see Brockington and Clarke 2001 for fulldescription of these waters) and the benthos is frequentlysubjected to ice-mediated disturbance during the australsummer (Smale et al. 2007a). The study sites had a numberof similar characteristics, including the aspect of theirslopes (south-facing), current velocities and water masscharacteristics (British Antarctic Survey long-term oceano-graphic monitoring records). All sites consisted of primar-ily hard bedrock substrata with patches of semi-stablecobbles and occasionally a thin layer (<5 cm) of overlyingsilt. The benthos has been described as rich and abundant inthis area (Barnes and Brockington 2003; Bowden 2005).The three sites diVered markedly in topography; CheshireIsland had a constant but gently sloping depth proWle,Ryder Buttress was an almost vertical cliV face with numerous
Fig. 1 The location of Adelaide Island on the Antarctic Penin-sula (inset) and the positions of the Cheshire Island (A), South Cove (B) and Ryder Buttress (C) study sites at Adelaide Island
123
Polar Biol (2008) 31:189–198 191
overhangs and crevices, whilst South Cove had an interme-diate gradient. These pronounced diVerences in topographymay provide benthos with diVering degrees of protectionfrom ice disturbance.
Sampling design
Three replicate transects, running from 5 to 35 m depth,were sampled at each site. Transects ran parallel to eachother, and were »10 m apart. Cheshire Island and SouthCove were sampled through winter fast ice during October2005, Ryder Buttress was sampled in January 2006. Tran-sects were sampled at seven stations, each at 5 m depthintervals. At each station (63 in total) 10–15 photoquadratswere taken; SCUBA divers placed the camera with closedeyes. From this pool of photoquadrats eight were later cho-sen by randomly selecting Wles, for analysis.
A Nikon D100 digital SLR camera Wtted with Nikkor12–24 mm (set at 24 mm) DX lens was housed in a NexusD100 casing and used throughout. Lighting was producedby a single Nikonos SB105 Xash unit Wtted with a diVuser.A carbon Wbre frame was attached to the housing and usedto standardise the sample area and to ensure the cameraremained perpendicular to the seabed. Each image wascropped (centrally) to a sample area of 0.32 m2
(0.8 £ 0.4 m) and all discernible fauna >5 mm in lengthwere identiWed to the lowest possible taxonomic level,which was generally species (although hydroids andpycnogonids could not always be identiWed to this level).All individuals of solitary taxa were counted, whilst colo-nial taxa (hydroids, bryozoans and some ascidians) werequantiWed by estimating the number of colonies. Somecomponents of the biota were excluded from analysis:encrusting taxa (some smaller bryozoans and sponges, spi-rorbid and serpulid worms) could not be accurately identi-Wed and quantiWed; although conspicuous at other Antarcticlocations, macrophytes were neither speciose nor abundantat the study sites and were not quantiWed; Wsh were notincluded in the analysis. Furthermore, once identiWed faunawere classiWed into three mobility groups; errant animalswere those that moved to feed (mainly asteroids, ophiu-roids, echinoids and gastropod molluscs); vagile were thosethat could move (slowly) but generally maintain a positionwhilst suspension feeding (holothurians and terebellidpolychaetes); and Wnally sessile fauna, which were attachedto the substrata (mainly bryozoans, ascidians and sponges).
Data analysis
DiVerences in faunal abundance and species richnessbetween depths, transects and sites were tested with abalanced ANOVA in Minitab 14.0. Transects were treatedas random and nested within sites, depth was a Wxed
orthogonal factor. An examination of the residuals sug-gested that data required a log-transformation to increasehomogeneity of variance. Data presented in Wgures werepooled for each depth station and averaged across the threereplicate transects within each site (§SE).
Multivariate analyses were applied using routines in thePrimer v.6 statistical software (Clarke and Warwick 2001).Replicates for each depth station were initially pooled andthen square root transformed, to down-weight the impor-tance of the highly abundant limpet Nacella concinna andsea urchin Sterechinus neumayeri. A Bray–Curtis similaritymatrix was used to produce MDS (non-metric multidimen-sional scaling) plots with site and depth factors. Two-wayANOSIM tests were then applied to test the signiWcance ofthe observed groupings. Finally, the RELATE procedurewas applied to determine the correlation between the abun-dance similarity matrices from each site and a model matrixof vertical distance between samples.
Results
Changes in community structure with depth
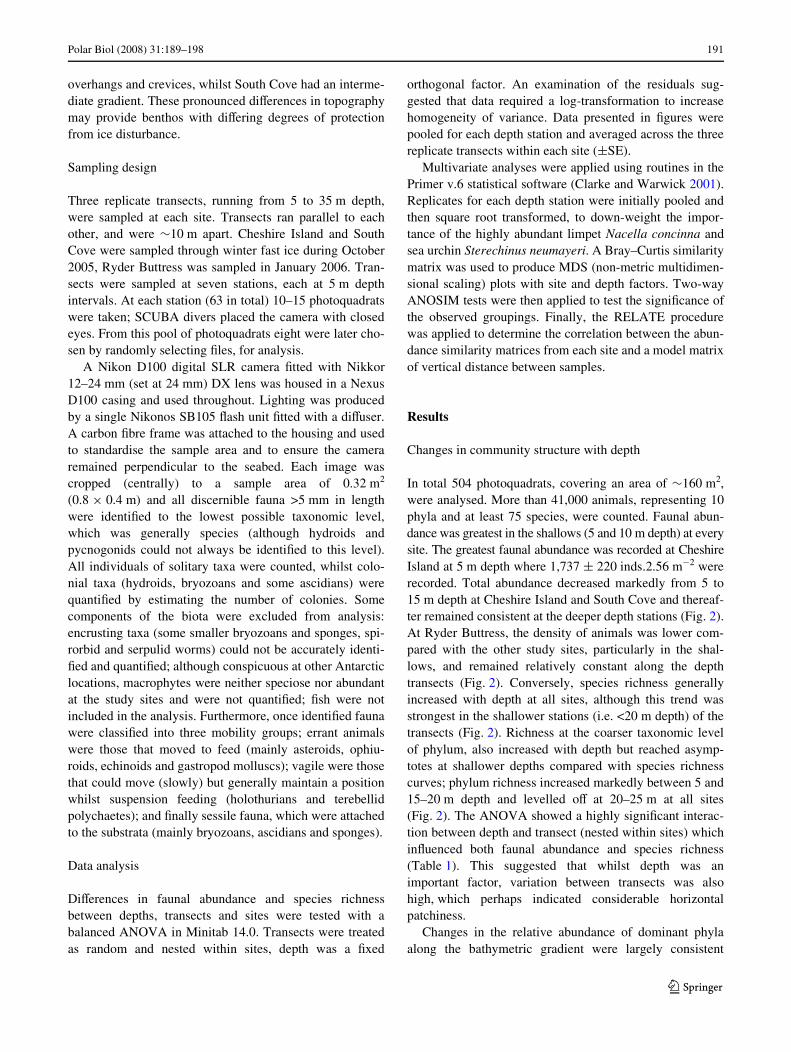
In total 504 photoquadrats, covering an area of »160 m2,were analysed. More than 41,000 animals, representing 10phyla and at least 75 species, were counted. Faunal abun-dance was greatest in the shallows (5 and 10 m depth) at everysite. The greatest faunal abundance was recorded at CheshireIsland at 5 m depth where 1,737 § 220 inds.2.56 m¡2 wererecorded. Total abundance decreased markedly from 5 to15 m depth at Cheshire Island and South Cove and thereaf-ter remained consistent at the deeper depth stations (Fig. 2).At Ryder Buttress, the density of animals was lower com-pared with the other study sites, particularly in the shal-lows, and remained relatively constant along the depthtransects (Fig. 2). Conversely, species richness generallyincreased with depth at all sites, although this trend wasstrongest in the shallower stations (i.e. <20 m depth) of thetransects (Fig. 2). Richness at the coarser taxonomic levelof phylum, also increased with depth but reached asymp-totes at shallower depths compared with species richnesscurves; phylum richness increased markedly between 5 and15–20 m depth and levelled oV at 20–25 m at all sites(Fig. 2). The ANOVA showed a highly signiWcant interac-tion between depth and transect (nested within sites) whichinXuenced both faunal abundance and species richness(Table 1). This suggested that whilst depth was animportant factor, variation between transects was alsohigh, which perhaps indicated considerable horizontalpatchiness.
Changes in the relative abundance of dominant phylaalong the bathymetric gradient were largely consistent
123
192 Polar Biol (2008) 31:189–198
across the study sites. Echinoderms (dominated by Stere-chinus neumayeri) increased considerably in abundancefrom 5 to 15–20 m depth, and then remained fairly consis-tent at the deeper stations. Molluscs (dominated by Nacellaconcinna) decreased in abundance along depth transectswhilst bryozoans and sponges were absent from all 5 and10 m depth stations and then increased in abundance from15 to 35 m (Fig. 3). At the 35 m depth stations bryozoanswere a dominant component of the benthos, comprising37 § 3, 40 § 2 and 18 § 3% of total faunal abundance atCheshire Island, South Cove and Ryder Buttress, respec-tively (Fig. 3).
The relative abundance of errant, vagile and sessilefauna showed a distinct pattern along the depth transects atall study sites. In the shallows (5 and 10 m depth stations)at all sites errant fauna dominated assemblages, but thisdominance decreased with depth until at the deepest
stations (35 m) more than half of the animals observedwere sessile (Fig. 3). Cheshire Island and South Cove hadvery similar patterns in the relative abundances of motilitygroups. At both sites the sessile group became the mostabundant group at 30 m depth, and the vagile group had rel-atively low abundance values (Fig. 3). At Ryder Buttress,however, the sessile group became most abundant at 25 mdepth and the vagile group was consistently more abundant,peaking at a 25 § 5% of the total abundance of animals at20 m depth (Fig. 3).
Continuous community change
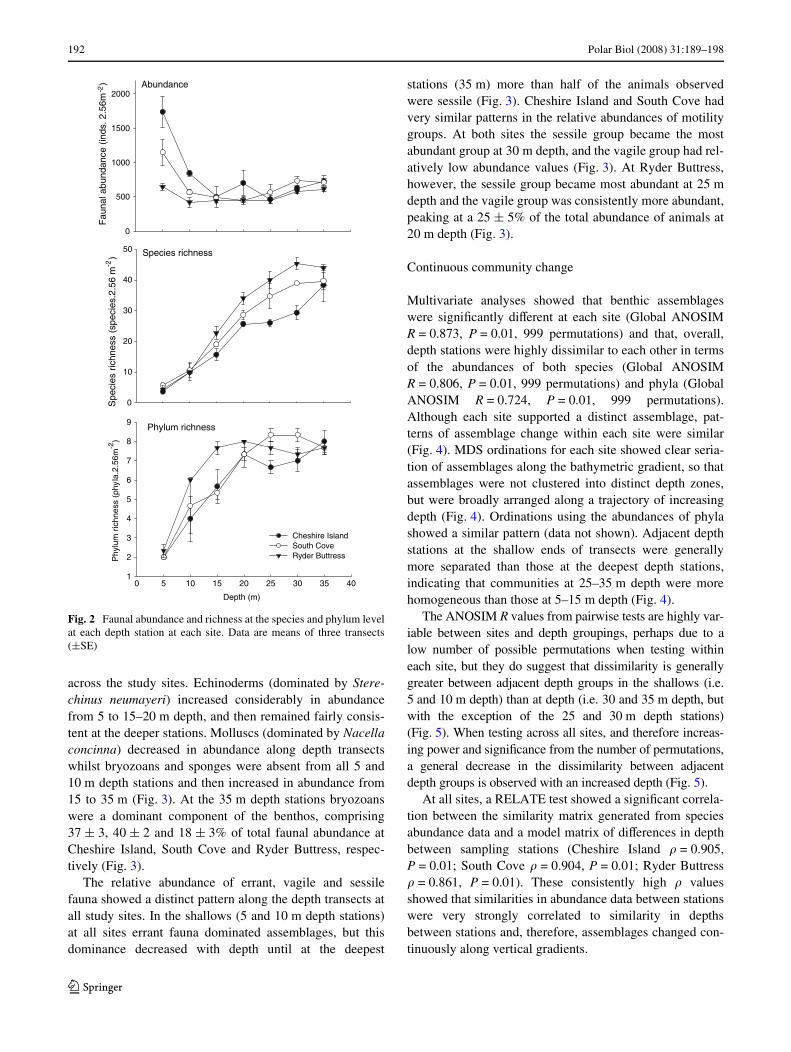
Multivariate analyses showed that benthic assemblageswere signiWcantly diVerent at each site (Global ANOSIMR = 0.873, P = 0.01, 999 permutations) and that, overall,depth stations were highly dissimilar to each other in termsof the abundances of both species (Global ANOSIMR = 0.806, P = 0.01, 999 permutations) and phyla (GlobalANOSIM R = 0.724, P = 0.01, 999 permutations).Although each site supported a distinct assemblage, pat-terns of assemblage change within each site were similar(Fig. 4). MDS ordinations for each site showed clear seria-tion of assemblages along the bathymetric gradient, so thatassemblages were not clustered into distinct depth zones,but were broadly arranged along a trajectory of increasingdepth (Fig. 4). Ordinations using the abundances of phylashowed a similar pattern (data not shown). Adjacent depthstations at the shallow ends of transects were generallymore separated than those at the deepest depth stations,indicating that communities at 25–35 m depth were morehomogeneous than those at 5–15 m depth (Fig. 4).
The ANOSIM R values from pairwise tests are highly var-iable between sites and depth groupings, perhaps due to alow number of possible permutations when testing withineach site, but they do suggest that dissimilarity is generallygreater between adjacent depth groups in the shallows (i.e.5 and 10 m depth) than at depth (i.e. 30 and 35 m depth, butwith the exception of the 25 and 30 m depth stations)(Fig. 5). When testing across all sites, and therefore increas-ing power and signiWcance from the number of permutations,a general decrease in the dissimilarity between adjacentdepth groups is observed with an increased depth (Fig. 5).
At all sites, a RELATE test showed a signiWcant correla-tion between the similarity matrix generated from speciesabundance data and a model matrix of diVerences in depthbetween sampling stations (Cheshire Island � = 0.905,P = 0.01; South Cove � = 0.904, P = 0.01; Ryder Buttress� = 0.861, P = 0.01). These consistently high � valuesshowed that similarities in abundance data between stationswere very strongly correlated to similarity in depthsbetween stations and, therefore, assemblages changed con-tinuously along vertical gradients.
Fig. 2 Faunal abundance and richness at the species and phylum levelat each depth station at each site. Data are means of three transects(§SE)
Depth (m)
0 5 10 15 20 25 30 35 40
Phy
lum
ric
hnes
s (p
hyla
.2.5
6m-2
)
1
2
3
4
5
6
7
8
9
Species richness
Spe
cies
ric
hnes
s (s
peci
es.2
.56
m-2
)
0
10
20
30
40
50
Abundance
Fau
nal a
bund
ance
(in
ds. 2
.56m
-2)
0
500
1000
1500
2000
Cheshire IslandSouth CoveRyder Buttress
Phylum richness
123

Polar Biol (2008) 31:189–198 193
Table 1 Results of balanced ANOVA with (log transformed) total abundance and species richness response factors
Source df SS MS F P
Total abundance (log transformed)
Site 2 4.6339 2.3170 1.20 0.364
Transect(site) 6 11.5634 1.9272 3.26 0.012
Depth 6 40.9301 6.8217 11.52 0.000
Site £ depth 12 19.0700 1.5892 2.68 0.011
Depth £ transect (site) 36 21.3141 0.5921 5.96 0.000
Error 441 43.8307 0.0994
Total 503 141.3422
Species richness (log transformed)
Site 2 3.1264 1.5632 5.84 0.039
Transect (site) 6 1.6070 0.2678 1.02 0.430
Depth 6 171.2033 28.5339 108.28 0.000
Site £ depth 12 6.7130 0.5594 2.12 0.040
Depth £ transect (site) 36 9.4863 0.2635 5.13 0.000
Error 441 22.6495 0.0514
Total 503 214.7855
Transects were nested within sites and treated as random factors
Fig. 3 Percentage abundance of major phyla (left) and mobility groups (right) at each depth sta-tion at each site. Data are means of three transects (§SE)
South Cove
% a
bund
ance
of m
obili
ty g
roup
s
Ryder Buttress
Depth (m)
0 5 10 15 20 25 30 35 40
% a
bund
ance
of m
obili
ty g
roup
s
Cheshire Island
% a
bund
ance
of m
obili
ty g
roup
s
ErrantVagileSessile
Depth (m)
0 5 10 15 20 25 30 35 40
EchinodermataMolluscaCnidariaChordata Bryozoa
% a
bund
ance
of m
ajor
phy
la%
abu
ndan
ce o
f maj
or p
hyla
% a
bund
ance
of m
ajor
phy
la
123
194 Polar Biol (2008) 31:189–198
Patchiness
Nested ANOVA of both abundance and species richnessdata from stations at the same depth showed signiWcantdiVerences between replicate transects at 6 of the 7 depthincrements sampled (Table 2). Furthermore, at two depthstations (15 and 20 m) the variation in abundance databetween transects accounted for over 50% of the totalobserved variability (Table 2). As mentioned above, signiW-cant diVerences in faunal abundance between transectswere also detected in the global (all depth stations)ANOVA, whilst MDS ordination showed that samplesfrom replicate depth stations in the shallows were variable
and as dissimilar to each other as they were to adjacentdepth stations. These analyses suggest a high degree ofvariability and patchiness at the scale of tens of meters inthe shallow subtidal environment at Adelaide Island,Antarctica.
Discussion
Changes in community structure with depth
The benthic assemblages at Adelaide Island changed sig-niWcantly along a bathymetric gradient of 5 to 35 m; theWrst hypothesis can therefore be accepted. In fact, changesin community structure with depth were so pronounced that
Fig. 4 MDS ordinations of samples from each depth station, both overall and from within each site. MDS plots generated from Bray–Curtis similarity matrix of square-root transformed abundance data
Fig. 5 ANOSIM R values of pairwise tests of adjacent depth stationswithin each study (one-way tests, 10 permutations) and overall (two-way; site and depth factors 999 permutations). An ANOSIM R value ofone indicates that depth groups were entirely dissimilar. Data pointsthat lie within the grey box were not signiWcant at the 10% level(P > 0.1)
Depth (m) groups in pairwise tests
5 v 10 10 v 15 15 v 20 20 v 25 25 v 30 30 v 35
AN
OS
IM R
Val
ue
-0.2
0.0
0.2
0.4
0.6
0.8
1.0
All sites Cheshire Island South Cove Ryder Buttress
Table 2 ModiWed results table of nested ANOVA (site/transect/repli-cate) for each depth increment, showing variation between transects
Response variables were (log transformed) abundance and speciesrichness and tests used 71 degrees of freedom. The percentages of thetotal variation (i.e. site, transect and error) derived from “between tran-sect” comparisons are also shown
Depth Abundance Species richness
F P Variance (%)
F P Variance (%)
5 3.90 0.002 10.83 2.78 0.018 6.07
10 1.83 0.108 5.79 6.16 0.000 38.09
15 16.11 0.000 65.38 8.294 0.000 47.69
20 14.95 0.000 63.56 3.32 0.007 21.86
25 9.34 0.000 46.51 4.57 0.001 25.46
30 4.31 0.001 21.56 1.77 0.119 6.12
35 8.67 0.000 48.96 7.82 0.000 46.02
123
Polar Biol (2008) 31:189–198 195
the patterns were still observed when analysing abundancesat the phylum level, despite just ten phyla being present.Furthermore, communities at each site were highly distinct,despite the sites being separated by distances of only »0.5,3.5 and 4.0 km and having similar substrata types, slopeaspects and current Xows. The importance of local environ-mental conditions on structuring polar benthos has beenpreviously suggested (Barnes 1995b; Ragua-Gil et al.2004), and it seems likely that small-scale diVerences in thefrequency of ice disturbance (perhaps due to variation inslope and topography), combined with biological factorssuch as recruitment and predation, have resulted in highbetween-site variation in community composition.
Depth dependent patterns in faunal density and richnesshave been reported previously from Antarctic locations, butthe current study is the Wrst to use a fully replicated sam-pling design to evaluate variation at the site, transect andsample level. Faunal abundance was highest in the shallow-est depth stations due to the superabundant gastropodNacella concinna and the ubiquitous echinoid Sterechinusneumayeri. The ecological importance of these widespreadspecies is well known, and dense grazing aggregations ofboth species at <10 m depth have been observed aroundAntarctica (Picken 1980; Kirkwood and Burton 1988;Brethes et al. 1994; Brey et al. 1995; Brockington et al.2001; Bowden 2005). In the current study, species richnessincreased by an order of magnitude between 5 and 35 mdepth. An increasing richness of fauna along a bathymetricgradient in the shallow subtidal zone has been reported pre-viously at Signy Island in the South Orkneys (Barnes1995b), King George Island in the South Shetlands(Jazdzewski et al. 1986; Sahade et al. 1998; Nonato et al.2000), Terra Nova Bay (Gambi et al. 2000), the PalmerArchipelago (Zamorano 1983) and McMurdo Sound (Day-ton et al. 1970). At Adelaide Island, the speciose groups ofsponges and bryozoans were largely absent at depths lessthan 20 m, whilst at 30 and 35 m depth stations they wereimportant contributors to richness. Sahade et al. (1998) alsorecorded high species richness at 30 m depth at KingGeorge Island, although communities were dominated byascidians rather than the structural sponges and bryozoansrecorded at Adelaide Island.
Our data suggested that the forces acting on assemblagesat 5 m depth were very diVerent from those at 35 m depth.At the shallowest depth stations of all transects sessilefauna were entirely absent, variation between transects washighest and the dissimilarity between adjacent depthstations was greatest. These observations strongly suggestthat the physical disruptive force of ice is prominent atthese depths, and that intense, discrete disturbance eventsresult in patchy and dynamic communities dominated byerrant organisms. Anchor ice (Dayton et al. 1970), icescouring (Gambi et al. 2000; Nonato et al. 2000; Barnes
and Brockington 2003) and the formation of winter fast ice(Barnes 1995a) can all result in a near denudation of sessileforms and low species richness in Antarctic shallows. AtAdelaide Island, anchor ice formation is very rare but dis-turbance from iceberg scouring and the winter ice foot isboth intense and frequent, particularly at 0–10 m depth(Brown et al. 2004; Smale et al. 2007a), which may explainthe lack of large sessile fauna in all but the most shelteredand protected refugia (but see Waller et al. 2006). It isimportant to note that although disturbance is most frequentat depths of less than 10 m, iceberg scours have beenreported at depths of greater than 500 m (Dowdeswell et al.1993) and that these disturbances considerably alter benthiccommunity structure (Gutt and Starmans 1998). It is there-fore likely that all the depth stations sampled in the currentstudy were inXuenced by ice disturbance to some degree, andthat even assemblages at 35 m depth have probably beeninXuenced by disturbance in their recent ecological past.
In conjunction with disturbance, the eVects of large scalegrazing at shallow depths may also drive the observed spe-cies distributions. Bowden et al. (2006) reported signiWcanteVects of grazing, particularly by Sterechinus neumayeri at8 m depth, on artiWcial hard substrata, which considerablyrestricted the recruitment and development of sessile fauna.High densities of limpets and sea urchins were recorded atthe shallowest depth stations, and intense grazing by thesespecies may inhibit the settlement and growth of sessilerecruits originating from deeper water.
With increasing depth, adjacent depth stations generallybecame more similar, and variation between transects ateach site decreased, as demonstrated by MDS ordinationsand ANOSIM R values. It seems that biological factorssuch as competition, predation, recruitment and develop-ment had more inXuence on assemblage composition asdepth increased. Dayton et al. (1974) described the benthosat 33–60 m depth at McMurdo Sound as being dominatedby a diverse group of structural sponges, competing primar-ily for space, and being regulated by asteroid and mollus-can predators. Intense competition for space at depthsgreater than 30 m has also been reported at lower latitudeAntarctic locations (Barnes 1995b; Barnes and Brockington2003). At Adelaide Island, a decreasing frequency of dis-turbance with depth (Smale et al. 2007a) may have resultedin communities at >30 m depth being more homogenousand characterised by structural sessile fauna, which in turnmay have promoted species richness by increasing habitatcomplexity and providing space for epifauna (Dayton et al.1974; Gutt and Schickan 1998; Gutt 2000).
Interestingly, sessile forms dominated at shallowerdepths and species richness was higher at Ryder Buttresscompared with Cheshire Island and South Cove. This sitehad the steepest sloped topography, which included over-hangs and crevices, and may be more protected from ice
123
196 Polar Biol (2008) 31:189–198
disturbance. As a result of decreased disturbance pressure,complex sessile assemblages may have developed at shal-lower depths at Ryder Buttress, although at this stage thehypothesis that the observations were purely due to a “siteeVect”, rather than increased protection from ice scouringcannot be rejected.
Patchy distributions along a continuum
Examples of species being distributed along an environ-mental gradient are plentiful in nature, with perhaps themost well known being the distribution of vegetation alongan altitudinal cline (e.g. Beals 1969; Hemp 2006) and theposition of intertidal organisms on a rocky shore (e.g. Colman1933; Stephenson and Stephenson 1972). Early studies ofthe distributions of biota on the intertidal rocky shore led tothe paradigm of “zonation”; the idea that communities werearranged in vertical bands or zones, perhaps as a result ofphysical constraints, reproductive potential, competition orgrazing pressures (see Underwood 1991 and referencestherein). It is now clear that the concept of zonation over-simpliWes a complicated system and is dependent on boththe scale of measurement and the biological entity of inter-est (Underwood 1978; Underwood and Chapman 1995;Benedetti-Cecchi 2001). However, on many rocky shore-lines species boundaries are clearly evident and “zonation”may provide a useful framework for research. Recently, theconcept of marine communities being distributed in zoneshas re-emerged in polar ecology (Gambi et al. 1994;Sahade et al. 1998; Nonato et al. 2000; Barnes andBrockington 2003), although there is little evidence forspecies or assemblage boundaries at any spatial scale.
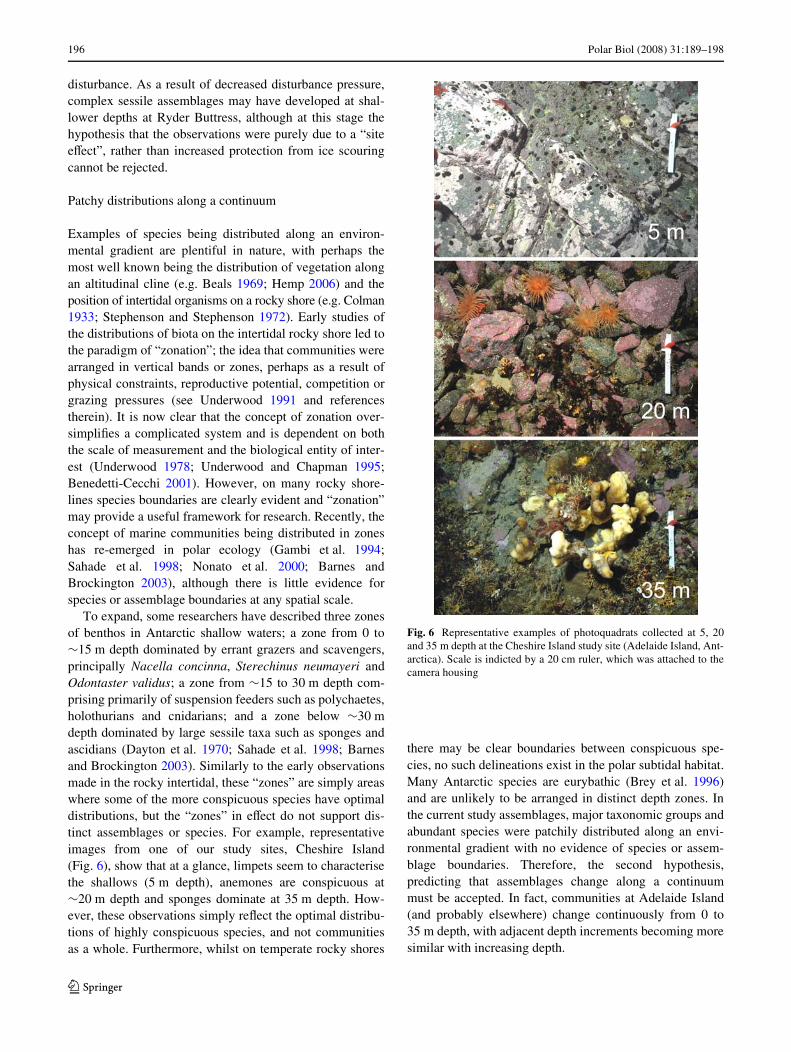
To expand, some researchers have described three zonesof benthos in Antarctic shallow waters; a zone from 0 to»15 m depth dominated by errant grazers and scavengers,principally Nacella concinna, Sterechinus neumayeri andOdontaster validus; a zone from »15 to 30 m depth com-prising primarily of suspension feeders such as polychaetes,holothurians and cnidarians; and a zone below »30 mdepth dominated by large sessile taxa such as sponges andascidians (Dayton et al. 1970; Sahade et al. 1998; Barnesand Brockington 2003). Similarly to the early observationsmade in the rocky intertidal, these “zones” are simply areaswhere some of the more conspicuous species have optimaldistributions, but the “zones” in eVect do not support dis-tinct assemblages or species. For example, representativeimages from one of our study sites, Cheshire Island(Fig. 6), show that at a glance, limpets seem to characterisethe shallows (5 m depth), anemones are conspicuous at»20 m depth and sponges dominate at 35 m depth. How-ever, these observations simply reXect the optimal distribu-tions of highly conspicuous species, and not communitiesas a whole. Furthermore, whilst on temperate rocky shores
there may be clear boundaries between conspicuous spe-cies, no such delineations exist in the polar subtidal habitat.Many Antarctic species are eurybathic (Brey et al. 1996)and are unlikely to be arranged in distinct depth zones. Inthe current study assemblages, major taxonomic groups andabundant species were patchily distributed along an envi-ronmental gradient with no evidence of species or assem-blage boundaries. Therefore, the second hypothesis,predicting that assemblages change along a continuummust be accepted. In fact, communities at Adelaide Island(and probably elsewhere) change continuously from 0 to35 m depth, with adjacent depth increments becoming moresimilar with increasing depth.
Fig. 6 Representative examples of photoquadrats collected at 5, 20and 35 m depth at the Cheshire Island study site (Adelaide Island, Ant-arctica). Scale is indicted by a 20 cm ruler, which was attached to thecamera housing
123
Polar Biol (2008) 31:189–198 197
As with some rocky shores, considerable horizontal var-iability in assemblage composition was recorded. Therewere signiWcant diVerences between stations at the samedepth just 10 m apart, whilst variation at the scale of 1 m(between replicate) was also high. Therefore the hypothesis(3) that horizontal patchiness across the bathymetric gradi-ent is signiWcant can be accepted. The distribution of spe-cies in Antarctic shallow waters is inevitably highlyheterogeneous as it is widely accepted as being driven (tosome degree) by the physical pressures of ice disturbance.Iceberg scouring, by its very nature, is highly stochastic inspace and time (Brown et al. 2004; Smale et al. 2007a) andthese discrete disturbance events create of patchy mosaic ofassemblages at diVering stages of recovery in polar waters(Gutt and Piepenburg 2003; Conlan and Kvitek 2005;Smale et al. 2007b). To suggest that species are distributedin zones or depth bands ignores the small-scale patchinessand habitat heterogeneity that, at larger scales, may pro-mote high levels of biodiversity in the shallow regions ofthe Antarctic shelf (Gutt and Piepenburg 2003).
Critically, the frequently proposed concept that ice-med-iated disturbance is a key driving force resulting in theobserved depth-dependent distributions of subtidal polarorganisms is, thus far, a purely conceptual model. It is nowknown that the frequency of ice disturbance does vary withdepth (Smale et al. 2007) and that subtidal benthic commu-nities change along a depth gradient, but there is no evi-dence to suggest causality. The experimental manipulationof the intensity of ice disturbance would be logistically andconceptually challenging for ecologists, but data generatedfrom Weld manipulations are needed to “put some meat onthe bones” of ecological theory at polar latitudes.
Acknowledgments The author would like to thank the 2005 winter-ing team at Rothera Research Station for their hard work, support andenthusiasm for marine science. The National Facility for ScientiWcDiving is acknowledged for providing support to BAS diving opera-tions.
References
Barnes DKA (1995a) Sublittoral epifaunal communities at SignyIsland, Antarctica. I. The ice-foot zone. Mar Biol 121:555–563
Barnes DKA (1995b) Sublittoral epifaunal communities at Signy Island,Antarctica. II. Below the ice-foot zone. Mar Biol 121:565–572
Barnes DKA, Brockington S (2003) Zoobenthic biodiversity, biomassand abundance at Adelaide Island, Antarctica. Mar Ecol Prog Ser249:145–155
Beals EW (1969) Vegetation change along altitudinal gradients.Science 165:981–985
Benedetti-Cecchi L (2001) Variability in abundance of algae andinvertebrates at diVerent spatial scales on rocky sea shores. MarEcol Prog Ser 215:79–92
Bowden DA (2005) Quantitative characterization of shallow marinebenthic assemblages at Ryder Bay, Adelaide Island, Antarctica.Mar Biol 146:1235–1249
Bowden DA, Clarke A, Peck LS, Barnes DKA (2006) Antarctic sessilemarine benthos: colonisation and growth on artiWcial substrataover three years. Mar Ecol Prog Ser 316:1–16
Brethes JC, Ferreyra G, Vega S (1994) Distribution, growth and repro-duction of the limpet Nacella (Patinigera) concinna (Strebel1908) in relation to potential food availability, in Esperanza Bay(Antarctic Peninsula). Polar Biol 14:161–170
Brey T, Pearse JS, Basch L, McClintock JB, Slattery M (1995) Growthand production of Sterechinus neumayeri (Echinoidea: Echino-dermata) in McMurdo Sound, Antarctica. Mar Biol 124:279–292
Brey T, Dahm C, Gorny M, Klages M, Stiller M, Arntz WE (1996) DoAntarctic benthic invertebrates show an extended level of eury-bathy? Antarct Sci 8:3–6
Brockington S, Clarke A (2001) The relative inXuence of temperatureand food on the metabolism of a marine invertebrate. J Exp MarBiol Ecol 258:87–99
Brockington S, Clarke A, Chapman ALG (2001) Seasonality of feed-ing and nutritional status during the austral winter in the Antarcticsea urchin Sterechinus neumayeri. Mar Biol 139:127–138
Brown KM, Fraser KPP, Barnes DKA, Peck LS (2004) Links betweenthe structure of an Antarctic shallow-water community and ice-scour frequency. Oecologia 141:121–129
Clarke KR (1993) Non-parametric multivariate analysis of changes incommunity structure. Aust J Ecol 18:117–143
Clarke KR, Warwick RM (2001) Change in marine communities: anapproach to statistical analysis and interpretation, 2nd edn. PRIM-ER-E, Plymouth
Colman J (1933) The nature of the intertidal zonation of plants and ani-mals. J Mar Biol Assoc UK 18:435–476
Conlan KE, Kvitek RG (2005) Recolonization of soft-sediment icescours on an exposed Arctic coast. Mar Ecol Prog Ser 286:21–42
Conlan KE, Kim SL, Lenihan HS, Oliver JS (2004) Benthic changesduring 10 years of organic enrichment by McMurdo Station,Antarctica. Mar Poll Bull 49:43–60
Dayton PK, Oliver JS (1977) Antarctic soft bottom benthos in oligo-trophic and eutrophic environments. Science 197:55–58
Dayton PK, Robbiliard GA, Paine RT (1969) Anchor ice formation atMcMurdo Sound, Antarctica, and its biological eVects. Science163:273–274
Dayton PK, Robbiliard GA, Payne T (1970) Benthic faunal zonation asa result of anchor ice at McMurdo Sound, Antarctica. In: Hold-gate MW (ed) Antarctic ecology, vol 1. Academic, New York, pp244–258
Dayton PK, Robbiliard GA, Paine RT, Dayton LB (1974) Biologicalaccomodation in the benthic community at McMurdo Sound,Antarctica. Ecol Monogr 44:105–128
Dowdeswell JA, Villinger H, Whittington RJ, Marienfeld P (1993) Ice-berg scouring in Scoresby Sund and on the East Greenland conti-nental shelf. Mar Geol 111:37–53
Gambi MC, Lorenti M, Russo GF, Scipioni MB (1994) Benthic associ-ations of the shallow hard bottoms oV Terra Nova Bay, Ross Sea:zonation, biomass and population structure. Antarct Sci 6:449–462
Gambi MC, Buia MC, Mazzella L, Lorenti M, Scipioni MB (2000)Spatio-temporal variability in the structure of benthic populationsin a physically controlled system oV Terra Nova Bay: the shallowhard bottoms. In: Faranda, Guglielmo, Ionora (eds) Ross Seaecology. Springer, Berlin
Gutt J (2000) Some “driving forces” structuring communities of thesublittoral Antarctic macrobenthos. Antarct Sci 12:297–313
Gutt J, Piepenburg D (2003) Scale-dependent impact on diversity ofAntarctic benthos caused by grounding of icebergs. Mar EcolProg Ser 253:77–83
Gutt J, Schickan T (1998) Epibiotic relationships in Antarctic benthos.Antarct Sci 10:398–405
Gutt J, Starmans A (1998) Structure and biodiversity of megabenthosin the Weddell and Lazarev Seas (Antarctica): ecological role of
123

198 Polar Biol (2008) 31:189–198
physical parameters and biological interactions. Polar Biol20:229–247
Hemp A (2006) Continuum or zonation? Altitudinal gradients in theforest vegetation of Mt. Kilimanjaro. Plant Ecol 184:27–42
Jackson DA (1993) Multivariate analysis of benthic invertebrate com-munities: the implication of choosing particular data standardiza-tions, measures of association, and ordination methods.Hydrobiologia 268:9–26
James FC, McCulloch CE (1990) Multivariate analyses in ecology andsystematics: panacea or pandora’s box? Annu Rev Ecol Syst21:129–166
Jazdzewski K, Jurasz W, Kittel W, Presler E, Presler P, Sicinski J(1986) Abundance and biomass estimates of the benthic fauna inAdmiralty Bay, King George Island, South Shetland Islands.Polar Biol 6:5–16
Kirkwood JM, Burton HR (1988) Macrobenthic species assemblagesin Ellis Fjord, Vestfold Hills, Antarctica. Mar Biol 97:445–457
Lenihan HS, Oliver JS (1995) Anthropogenic and natural disturbancesto marine benthic communities in Antarctica. Ecol Appl 5:311–326
Nonato EF, Brito TAS, De Paiva PC, Petti MAV, Corbisier TN (2000)Benthic megafauna of the nearshore zone of Martel Inlet (KingGeorge Island, South Shetland Islands, Antarctica): depth zona-tion and underwater observations. Polar Biol 23:580–588
Peck LS, Bullough LW (1993) Growth and population structure in theinfaunal bivalve Yoldia eightsi in relation to iceberg activity atSigny Island, Antarctica. Mar Biol 117:235–241
Picken GB (1980) The distribution, growth, and reproduction of theAntarctic limpet Nacella (Patinigera) concinna (Strebel, 1908).J Exp Mar Biol Ecol 42:71–85
Ragua-Gil JM, Gutt J, Clarke A, Arntz WE (2004) Antarctic shallow-water mega-epibenthos: shaped by circumpolar dispersion orlocal conditions? Mar Biol 144:829–839
Sahade R, Tatian M, Kowalke J, Kuhne S, Esnal GB (1998) Benthicfaunal associations on soft substrates at Potter Cove, King GeorgeIsland, Antarctica. Polar Biol 19:85–91
Smale DA, Barnes DKA, Fraser KPP (2007a) The inXuence of depth,site exposure and season on the intensity of iceberg scouring innearshore Antarctic waters. Polar Biol 30:769–779
Smale DA, Barnes DKA, Fraser KPP (2007b) The inXuence of icescour on benthic communities at three contras ting sites at Adela-ide Island, Antarctica. Austral Ecol (in press)
Stephenson TA, Stephenson A (1972) Life between tidemarks onrocky shores. W. H. Freeman & Co, San Francisco
Underwood AJ (1978) A refutation of critical tide levels as determi-nants of the structure of intertidal communities on British shores.J Exp Mar Biol Ecol 33:261–276
Underwood AJ (1991) The logic of ecological experiments: a case his-tory from studies of the distribution of macro-algae on rockyintertidal shores. J Exp Mar Biol Ecol 71:841–866
Underwood AJ, Chapman MG (1995) Coastal marine ecology in tem-perate Australia. University of New South Wales Press, Sydney
Waller C, Barnes DKA, Convey P (2006) Ecological constraints acrossan Antarctic land-sea interface. Austral Ecol 31:656–666
Zamorano JH (1983) Zonación y biomasa de la macrofauna betonicaen Bahía South, Archipiélago de palmer, Antartica. Inst Antárcti-co Chil Ser Cient 30:27–38
123