seismic hazard analysis and zonation
TRANSCRIPT

1
Seismic Hazard Analysis and Zonation for
Pakistan, Azad Jammu and Kashmir
by
and
Norway
July, 2007

Seismic Hazard Analysis and Zonation for
Pakistan, Azad Jammu and Kashmir
by
and
Norway
July, 2007


1
Preface
The study of strong earthquake ground motions and associated seismic
hazard and risk plays an important role for the sustainable development of
societies in earthquake prone areas. Using the hazard estimates produced by
seismology, risk analysis yields probabilistic estimates of the expected losses
of property and lives from earthquakes hazard estimation and vulnerabilities
of structures, facilities, and people distributed over the site. Population
growth, modern economic developments, real time communication, and
industrial interdependence among countries have sharpened the impact of
natural disasters. It is now realized that much can be done through studies
and knowledge enhancement to mitigate these risks to life and social well
being. This is particularly true for the risk due to great earthquakes.
The 8th October, 2005, Muzaffarabad earthquake emphasized the importance
of redefining the seismic zonation of Pakistan. The Pakistan Meteorological
Department (PMD) has been working in the field of seismic monitoring since
1954 and has the national responsibility for the issuance of earthquakes
information to Government and to the public.
The present study is particularly valuable as it contributes to mitigation of
earthquake risk as well as post earthquake management of the disasters. The
study is in particular concerned with obtaining an estimate of the ground
motion parameters at a site for the purpose of earthquake resistant design or
seismic safety assessment. This study can also be used to prepare
microzonation maps of an area by estimating the strong motion parameters
for a closely-spaced grid of sites.
This study is the result of the three-year cooperation between Pakistan
Meteorological Department and NORSAR, Norway. This study is conducted
by the PMD personnel Mr. Zahid Rafi and Mr. Ameer Hyder Leghari and the
NORSAR personnel Dr. Conrad Lindholm, Dr. Hilmar Bungum and Dr.
Dominik Lang.
The funding for this study was facilitated by the Norwegian Ministry of
Foreign Affairs through the Norwegian Embassy, and Government of
Pakistan through bilateral framework for institutional cooperation, which is
coordinated by the Planning and Development Division.
Dr. Qamar-uz-Zaman Chaudhry
Director General
August, 2007 Pakistan Meteorological Department
Islamabad
Table of Contents

2
Summary ..................................................................................................................7
1 Introduction.................................................................................................9
1.1 Scope of the study .........................................................................................9
2 Technical Approach ..................................................................................10
2.1 Design codes and construction details..........................................................10
2.2 Methodology of probabilistic seismic hazard analysis .................................14
2.3 Probabilistic seismic hazard analysis ...........................................................16
2.3.1 Theoretical framework ................................................................................16
2.3.2 The earthquake recurrence model ................................................................17
2.3.3 Strong-motion (attenuation) models.............................................................19
2.4 Implementation ...........................................................................................20
2.4.1 Geology ......................................................................................................20
2.4.2 Seismology .................................................................................................20
2.4.3 Seismotectonic interpretation ......................................................................21
2.4.4 Ground motion (attenuation) models ...........................................................21
2.4.5 Computational model ..................................................................................21
2.4.6 Hazard results and design criteria ................................................................22
3 Geologic Setting.........................................................................................22
3.1 Seismotectonics of Pakistan ........................................................................28
4 Seismology of the Study Region................................................................29
4.1 Earthquake information ...............................................................................29
4.1.1 The USGS historical database .....................................................................30
4.1.2 The PMD historical database.......................................................................30
4.1.3 The ISC instrumental database ....................................................................30
4.1.4 The Harvard instrumental database..............................................................31
4.1.5 The PMD instrumental database ..................................................................32
4.1.6 The PDE-NEIC database .............................................................................33
4.2 Seismic zonation .........................................................................................33
4.2.1 The historical earthquakes ...........................................................................34
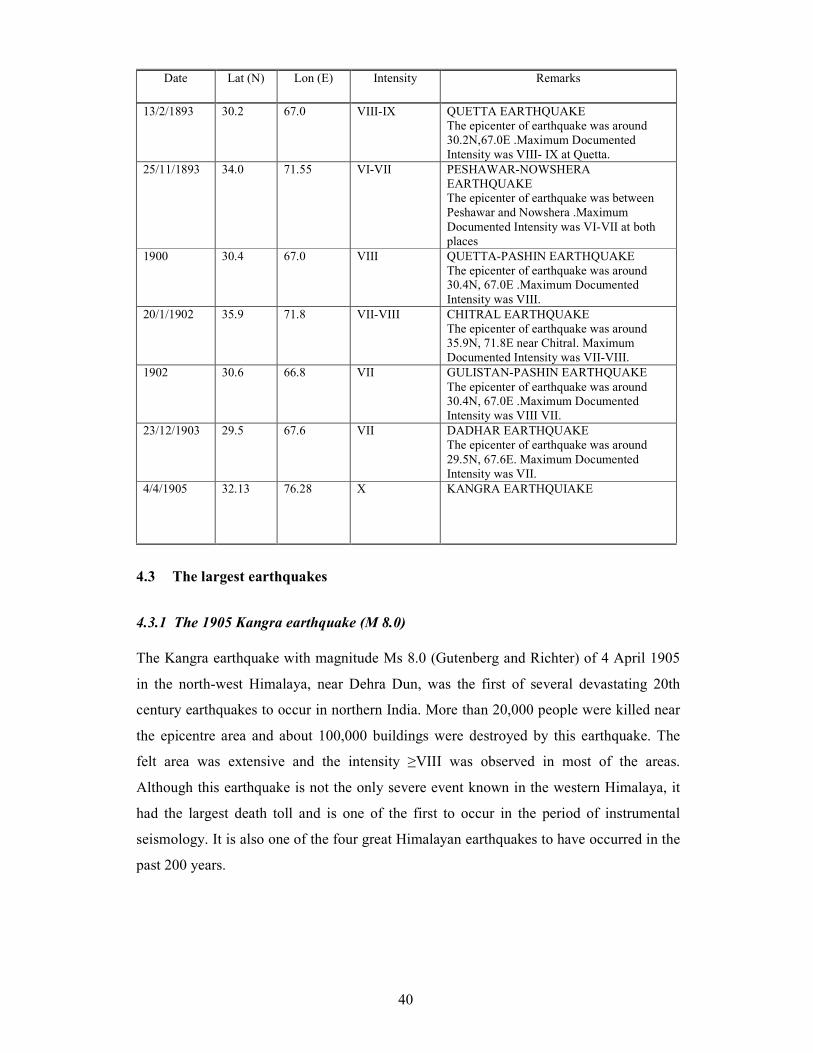
4.3 The largest earthquakes ...............................................................................40
4.3.1 The 1905 Kangra earthquake (M 8.0) ..........................................................40
4.3.2 The 1935 Quetta earthquake ........................................................................42
4.3.3 The 1945 Makran earthquake ......................................................................43
4.3.5 The 2005 Muzaffarabad earthquake (M 7.6)................................................45
5 Seismotectonic Interpretation...................................................................46
5.1 Seismic provinces and area sources .............................................................46
5.1.1 Seismic source zones...................................................................................47
5.2 Zones of high seismic activity in Pakistan ...................................................53
5.3 Magnitude conversions................................................................................55

3
5.4 Maximum magnitude ..................................................................................56
5.5 Focal depths ................................................................................................56
5.6 Earthquake focal mechanisms......................................................................59
5.6.1 Source zone stress distributions ...................................................................61
6 Ground Motion Models.............................................................................62
6.1 General review of models............................................................................62
6.2 Considered models ......................................................................................64
6.2.1 Specifics on the data used by Ambraseys et al. (2005) .................................67
6.2.2 Adapting of the selected relation to deep sources.........................................71
6.2.3 Dependence on the scatter of magnitude......................................................73
7 Seismic Analysis of the Study Area ..........................................................74
7.1 Catalogue completeness ..............................................................................74
7.2 Quantification of earthquake recurrence ......................................................75
7.2.1 Recurrence parameters ................................................................................76
7.2.2 Additional parameters for hazard calculations .............................................90
8 Seismic Hazard Results .............................................................................91
8.1 Deaggregation results ..................................................................................95
9 References................................................................................................101
10 Glossary ...................................................................................................108
11 Appendix..................................................................................................116

4
List of figures and tables
No. Figure caption Page
Fig. 1 Earthquake hazard for Pakistan and surrounding areas in terms of PGA
[m/s2] for the 0.002 annual exceedance probability (500 years recurrence).
8
Fig. 2.1
Relationship between return periods (inverse of annual exceedance
probability), period of interest and desired probability of exceedance
during the period of interest (according to Reiter, 1990).
13
Fig. 2.2 Earthquake recurrence functions. The red line indicates the truncated
cumulative Gutenberg-Richter relation, while the blue line indicates the
truncated characteristic recurrence model used in CRISIS (Ordaz et al.,
2003).
18
Fig. 3.1
The Indian plate colliding with the Eurasian plate (right: courtesy by the
Geological Survey of Pakistan).
23
Fig. 3.2
The regional seismicity of Southern Asia (above magnitude 3.0) according
to the British Geological Survey (BGS).
24
Fig. 3.3
Major tectonics in the northwest of Pakistan (courtesy: Geological Survey
of Pakistan).
26
Fig. 3.4
Seismic risk map (prepared by Geological Survey of Pakistan) overlaid
with historical seismicity.
27
Fig. 4.1 Earthquakes epicentres shown in red circles (from the ISC catalogue). 31
Fig. 4.2 Earthquakes with magnitudes M ≥ 5.0 (red circles) according to the
Harvard catalogue.
32
Fig. 4.3 Seismicity of the study region according to the PMD-catalogue. 33
Fig. 4.4 Seismicity of the study region according to the PDE-catalogue. 34
Fig. 4.5 The historical earthquakes from the PMD-catalog occurring before 1905. 35
Fig. 4.6 Map showing location and felt time in minutes of Kangra aftershocks.
Histogram below shows the clustering of these in time relative to main-
shock and aftershock recorded by magnetometer at Dehradun (Hough et
al., 2005).
41
Fig. 4.7 .Tectonic map of the Arabian, Indian and Eurasian plates showing the
location of the Makran zone
44
Fig. 4.8 The rge earthMuzaffarabad 8th October 2005 earthquake rupture zone
seen in the context of other laquakes on the Himalaya Main Boundary
Thrust (MBT) (after Avouac et al., 2006). Annotation: IKSZ – Indus-
Kohistan Seismic Zone.
46
Fig. 5.1 Seismic Zones of Pakistan for Hazard Analysis. 47
Fig. 5.2 Seismicity of the region (map with the 19 zones overlaid in Google Earth). 54
Fig. 5.3 Conversion of (a) surface-wave magnitude (Ms) and (b) body-wave
magnitude (mb) into moment magnitude (Mw) based on the Harvard
catalogue.
55
Fig. 5.4 Number of earthquakes with different depths [km] for the 19 seismic zones
of the study area.
56-57

5
No. Figure caption Page
Fig. 5.5 Distribution of focal depth for the Hindu Kush region (zones 5, 6 and 7). 58
Fig. 5.6 Focal mechanisms from the Harvard CMT solutions between 1977 and
2006. Inset are aggregated directions of maximum horizontal compression
in the crust as derived from the focal mechanisms following the WSM
recommendations (http://www-wsm.physik.uni-karlsruhe.de).
59
Fig. 5.7 Orientation of nodal planes and directions of P and T axes for 31
earthquakes (from Verma et al., 1980).
60
Fig. 6.1 Comparison of predicted PGA using the empirical ground motion
prediction equations by Ambraseys et al. (1996) and Ambraseys et al.
(2005) for magnitude M 5.0.
65
Fig. 6.2 PGA predictions for a suite of magnitudes for Ambraseys et al. (2005). 65
Fig. 6.3 Spectral acceleration predictions for two magnitudes (6.0 and 7.5) and two
distances (4 and 32 km) from Ambraseys et al. (2005).
66
Fig. 6.4 Observed dependence of σ on Mw using the binned data for PGA. The
fitted line has the equation: σ =0.5774−0.0561Mw. (Ambraseys et al.,
2005).
67
Fig. 6.5 Representation of the seismic activity with respect to depth. The
hypocentres of almost 50% of earthquakes in the Hindu Kush region and
the Northern areas of Pakistan lie within a range of 0 to 30 km range.
72
Fig. 6.6 Observed dependence of σ (standard deviation) on Mw using the data for
PGA values.
74
Fig. 7.1 The comparison of completeness of three earthquake catalogues (PMD,
PDE & ISC)
75
Fig. 7.2 b values from PDE catalogue for the 19 zones of the study region. 77-79
Fig. 7.3 b value for the whole catalogue PDE. 80
Fig. 7.4 b values from ISC catalogue for the 19 zones of the study region. 80-83
Fig. 7.5 b value for the whole catalogue ISC. 84
Fig. 7.6 b values from PMD catalogue for the 19 zones of the study region. 84-87
Fig. 7.7 b value for the whole catalogue PMD. 88
Fig. 7.8 Comparison of b-values from catalogues: ISC, PMD and PDE. 90
Fig. 8.1 Earthquake hazard for Pakistan in terms of PGA [m/s2] for the 0.02 annual
exceedance probabilities (50 year recurrence).
93
Fig. 8.2 Earthquake hazard for Pakistan in terms of PGA [m/s2] for the 0.01 annual
exceedance probabilities (100 year recurrence).
93
Fig. 8.3 Earthquake hazard for Pakistan in terms of PGA (m/s2) for the 0.002
annual exceedance probabilities (500 year recurrence).
94
Fig. 8.4 Seismic hazard map of Pakistan prepared for PGA for 500 years return
period
94
Fig. 8.5 PGA Hazard Curves for different Cities of Pakistan (500 years). 95
Fig. 8.6 Hazard spectrum for Different Cities of Pakistan 95
Fig. 8.7 Deaggregation results for Different Cities at Peak Ground Acceleration: 97
Fig. 8.8 Probability Density Function (PDF) of Peak Ground Acceleration (PGA)
for ground motion level at 2.27 m/s2 for Islamabad.
98
Fig. 8.9 Probability Density Function (PDF) of Peak Ground Acceleration (PGA)
for ground motion level at 2.49 m/s2 for Peshawar.
98

6
No. Figure caption Page
Fig. 8.10 Probability Density Function (PDF) of Peak Ground Acceleration (PGA)
for ground motion level at 6.14 m/s2 for Quetta.
99
Fig. 8.11 Probability Density Function (PDF) of Peak Ground Acceleration (PGA)
for ground motion level at 1.40 m/s2 for Karachi.
99
Fig. 8.12 Probability Density Function (PDF) of Peak Ground Acceleration (PGA)
for ground motion level at 5.75 m/s2 for Gwadar.
100
Fig. 8.13 Probability Density Function (PDF) of Peak Ground Acceleration (PGA)
for ground motion level at 3.25 m/s2 for Muzaffarabad.
100
No. Table caption Page
Table 1 Expected Peak Ground Acceleration (PGA) in [m/s2] for the different
cities against annual exceedance probabilities and return periods.
8
Table 2 Expected spectral acceleration [m/s2] for different cities for the annual
exceedance rate of 0.002.
9
Table 4.1 Historical earthquakes as collected by Pakistan Meteorological
Department
36-40
Table 6.1 Derived coefficients for the estimation peak ground acceleration and
response spectral acceleration for 5% damping.
73
Table 7.1 Summary of a- and b-values. Average normalized a-value for all zones
(Zone 0) is 6.15 when the b-value is fixed to 0.95. This corresponds to an
average return period of about 1 year for M≥6.5 for the larger area.
88
Table 7.2 Seismicity model of the study area. 89
Table 8.1 Expected Peak Ground Acceleration (PGA) in [m/s2] for the different
cities against annual exceedance probabilities and return periods.
92
Table 8.2 Expected spectral acceleration (m/s2) for different cities for the annual
exceedance rate of 0.002.
92

7
Summary
The study of earthquake ground motions and associated earthquake hazards and risks
plays an important role in the sustainable development of countries like Pakistan, where
devastating earthquakes have occurred repeatedly. The objective of the present study has
been to conduct a seismic hazard investigation that covers all of Pakistan, and the
methodology adopted to achieve this was a probabilistic approach. In this study a new
version of attenuation and ground acceleration prediction models are used and the
parameterization has been based on the most recently updated earthquake catalogues.
The seismicity was modelled through a spatial model and ground motion was computed
for 8 frequencies including PGA. Seismic hazard maps in terms of PGA for the annual
exceedance rates of 0.02, 0.01 and 0.002 (return periods of 50, 100 and 500 years) for stiff
rocks were prepared. These maps are designed to assist in the risk mitigation by providing
a general seismic hazard framework. The largest seismic hazard values occur in Quetta
region and northern parts of Pakistan. High seismic hazard values are computed in the
areas where shallow-to-intermediate seismicity occurs.
PGA values are given for a range of annual exceedance probabilities (Table 1) together
with the expected PGA values at 500 years return period of different frequencies (Table
2). The seismic hazard was computed in a one-degree grid and the maps in Figs. 1 to 3
show earthquake hazard in terms of smoothed PGA.
Table 1.Expected Peak Ground Acceleration (PGA) in [m/s2] for the different cities
against annual exceedance probabilities and return periods.
Expected PGA (m/s2) for the cities of
Annual
exceedance
probability
Return period
(years)
Islamabad
Peshaw
ar
Quetta
Karachi
Gwadar
Muzaffarabad
Gilgit
Lahore
Multan
Khuzdar
0.02 50 1.50 1.35 1.91 0.54 0.53 2.04 2.93 0.97 0.71 1.34
0.01 100 2.25 2.40 2.90 0.95 0.88 3.23 4.42 1.69 1.22 2.26
0.005 200 3.33 3.19 3.59 1.28 1.15 4.02 5.28 2.24 1.61 2.96
0.002 500 3.65 3.49 3.85 1.42 1.25 4.31 5.55 2.46 1.78 3.24
0.001 1000 3.71 3.55 3.90 1.45 1.28 4.36 5.60 2.51 1.81 3.30

8
Table 2. Expected spectral acceleration [m/s2] for different cities and an annual
exceedance probability of 0.002.
Period
T [s] Islamabad Peshawar Quetta Karachi Gwadar Muzaffarabad
PGA 3.65 3.49 3.85 1.42 1.25 4.31
0.1 5.07 5.59 14.28 2.86 5.75 7.03
0.2 5.57 6.11 15.75 3.54 6.35 8.06
0.5 3.12 3.32 9.17 2.57 3.48 4.75
1.0 1.42 1.45 4.37 1.08 1.37 2.24
1.5 0.84 0.84 5.56 0.64 0.75 1.31
2.0 0.75 0.75 2.20 0.57 0.65 1.15
2.5 0.45 0.45 1.67 0.34 0.43 0.75
Figure 1.Earthquake hazard for Pakistan and surrounding areas in terms of PGA [m/s2] for
the 0.002 annual exceedance probability (500 years recurrence).

9
1 Introduction
Pakistan is situated in a highly seismically active region which has experienced many
disastrous earthquakes during historical times. The last 100 years alone include the 1945
Makran coast earthquake with magnitude above 8.0, the Mach earthquake in August
1931, M 7.3, the Quetta earthquake in 1935, M 7.4, the Pattan earthquake in 1974, M 6.0,
and the recent disastrous Muzaffarabad earthquake in October 2005, M 7.6, which has
shaken the entire nation in many ways. Many active faults exist in Northern and Southern
areas of Pakistan and more than half of the total population are living with earthquakes
and will have to continue doing that.
The October 2005 Muzaffarabad earthquake enhanced the consciousness about the
increasing vulnerability that the growing population is confronted with. The increasing
population in the earthquake-prone cities is a major reason why the vulnerability due to
earthquakes is also increasing. It is globally realized that poorly-constructed buildings and
houses are the main reason for the large number of victims due to earthquakes. In recent
years several destructive earthquakes occurred in the world, with significant social and
academic impact. The observation of strong motion and aftershock sequences as well as
the investigation of the destruction from these earthquakes, which include the 1995 Kobe
Japan earthquake, the 1999 Chi-Chi Taiwan, China earthquake, the 2001 Gujrat, India
earthquake and October, 2005 Muzaffarabad earthquake, among other, provide the
disciplines of seismology and earthquake engineering with informative and valuable data,
experiences and lessons, and raise a number of important scientific problems. It is
believed that the new technologies such as GIS, GPS and remote sensing, among other,
have proven to be of significant help in the study of seismic hazard and risk. These efforts
have resulted in a significant expansion of knowledge in seismic hazard analysis.
1.1 Scope of the study
The study of strong ground motion, earthquake hazard, and risk plays an important role in
modern seismology viz; it is of such great societal importance (e.g., Bilham et al., 2001;
Bilham, 2006). Hazard analysis requires characterisation of the seismic sources that can
be expected to affect a selected place in terms of location, magnitude, and frequency of
occurrence of potentially damaging earthquakes. Using the hazard estimates produced by
seismology, risk analysis yields deterministic or probabilistic estimates of the expected

10
losses of properties and lives from earthquakes, which in turn is a convolution of the
hazard estimates and vulnerabilities of structures, facilities, and people distributed over
the site.
Seismic hazard also has a major impact on the earthquake-resistant design of structures by
providing justified estimates of hazard parameters, such as Peak Ground Acceleration
(PGA) or response spectrum amplitudes at different natural periods. Traditionally, PGA
has been a widely used hazard parameter, partly because it can so easily be read from
analogue accelerograms. However, PGA is often found not to be well-correlated with the
damage potential of ground motion, which has led to more frequent use of measures (such
as Peak Ground Velocity, PGV, or spectral acceleration, SA) that reflect also other
wavelengths, or frequencies. By taking into account the entire available databases on
seismicity, tectonics, geology and attenuation characteristics of the seismic waves in the
area of interest, the seismic hazard analysis is used to provide estimates of the site-
specific design ground motion at the site of a structure (Dravinski et al., 1980; Westermo
et al., 1980). One important result of our study is the preparation of zoning maps for the
generalized applications.
In this study historical data is used which is available only in intensity scales for the
ground motion, based on the description of observed damages. Intensity data is still used
as an important supplement to the instrumental recordings, not the least because it allows
for the use of historical observations.
2 Technical Approach
2.1 Design codes and construction details
The U.S. Army Corps of Engineers have issued a manual under Engineering and Design
(U.S. Army Corps of Engineers, 1999) in which several general guidelines are included.
While their approach is generally deterministic it contains key concepts that are applicable
also to the present study. The seismic assessment has several key steps:
• Establishment of earthquake design criteria. In the present case this means that the
definitions of Maximum Design Earthquake (MDE) and Operating Basis
Earthquake (OBE) are commonly understood.
• Development of ground motion corresponding to the MDE and OBE levels.

11
• Establishment of analysis procedures, i.e. procedures applied to reveal how the
structure responds to the specified seismic load.
• Development of structural models.
• Prediction of earthquake response of the structure.
• Interpretation and evaluation of the results.
For the present study we will exclusively focus on the second bullet point above, except
that we refrain from using the terms MDE or OBE in the following, since these terms are
relevant in particular for sensitive structures. The background is however a clear
understanding of the MDE and OBE definitions:
• The Operating Basis Earthquake (OBE) is an earthquake or equivalent ground
motion that can reasonably be expected to occur within the service life of the
project, that is, with a 50% probability of exceedance during the service life. The
associated performance requirement is that the project functions with little or no
damage, and without interruption of function.
• The Maximum Design Earthquake (MDE) is the maximum earthquake or equivalent
level of ground motion for which the structure is designed or evaluated. The
associated performance requirement is that the project performs without
catastrophic failure although severe damage or loss may be tolerated.
While, in the following, ground motions for different annual exceedance probabilities are
provided, it is the responsibility of any contractor to associate the safety levels in terms of
MDE and OBE or in accordance with any other defined safety level, e.g., the national
building regulations.
As already noted, Peak Ground Acceleration (PGA) is the most commonly-used measure
of the ground motion in seismic hazard analyses for many purposes, and it is the simplest
way to characterise the damage potentials of an earthquake.
This study is entirely based on a probabilistic computation in which the expected ground
motions are evaluated for various levels of exceedance probability. Naturally, the various
seismic provisions and guidelines reflect first of all the seismicity level of the study area,
where the expectance for the future is based on the past experience. The most detailed
seismic code provisions come from regions like Japan and the United States where strong
earthquakes hit frequently in regions with complex infrastructure. In such countries the

12
seismic awareness is very high due to the combination of past losses and economic
strength that facilitates effective counter measures.
The seismicity of Pakistan is, as already noted, characterised by important historical and
recent major earthquakes, with a steadily increasing vulnerability of its northern and
south-western regions. Unfortunately, the seismic awareness of these regions is still low.
Seismic design codes have the purpose of providing building guidelines for the reduction
of both property and life losses due to the seismic events. These building design codes
define standards for the seismic resistant design and construction of new building and for
the retrofit of the existing ones. Guidelines are developed based on sound theoretical and
physical modelling and on the observed damages caused by major earthquakes. The
lessons given by past earthquakes help to promote advances in the development of design
methods, the knowledge of materials performance and the enhancement of construction
practices.
Basically, a seismic code contains specifications for the seismic hazard, including soil and
possible near-fault effects that should be used in seismic design of buildings in the
considered region, which in turn is based on a base shear load that the building should
resist. In Europe there has been a great effort in launching a set of so-called Eurocodes
(EC) which contains complete guidelines for the construction industry including the
seismic provisions (EC 8, 2004). Eurocode 8 defines two goals of the anti-seismic design:
• The structure shall be designed to withstand the design seismic action without local
or general collapse.
• The structure shall be designed and constructed to withstand a seismic action
(seismic load) having a higher probability of occurrence than the design seismic
action.
Modern codes, notably the 1997 Uniform Building Code (ICBO, 1997) and the EC-8,
2004, are based on the specification of a base shear that depends on the seismic hazard
level of the site, site effects coming from the site geology, near fault effects, weight,
fundamental period, lateral forces, and the resisting system of the building. In areas of
high seismicity, sufficient ductile detailing to accommodate the inelastic demand
(Bachman and Bonneville, 2000) is needed.

13
The objective of this study is to provide the seismic actions at various annual exceedance
probability levels. The building constructors/designers must choose an appropriate risk
level/exceedance probability level for the structure for which the design ground motion is
associated.
The selection of the appropriate risk level is essentially a question of the consequences of
a failure. The risk level is most often specified either as annual exceedance probability or
as exceedance probability during the expected lifetime of the structure. The discussion of
risk levels is supported through the following connection between return period TR and
lifetime T, where P is annual probability of exceedance (see also Fig. 2.1):
))(1ln( zZP
TTR >−
−=
Figure 2.1. Relationship between return periods (inverse of annual exceedance
probability), period of interest and desired probability of exceedance during
the period of interest (according to Reiter, 1990).
If, for example, the expected lifetime of a structure is T = 200 years, and a 95% non-
exceedance probability (5% exceedance probability, P = 0.05) is required, then this safety
requirement corresponds to a return period of TR = 3900 years, or an equivalent 3x10⁻⁴
annual exceedance probability. The curves for various lifetime structures and the
corresponding return periods are shown in Fig. 2.1.

14
2.2 Methodology of probabilistic seismic hazard analysis
It is well known that uncertainties are essential in the definition of all elements that go
into seismic hazard analysis, in particular since the uncertainties often drive the results,
and increasingly so for low-exceedance probabilities. As might be anticipated this can
sometimes lead to difficult choices for decision makers. Rational solutions to dilemmas
posed by uncertainty can be based on the utilization of some form of probabilistic seismic
hazard analysis. In contrast to the typical deterministic analysis, which (in its simplest
form) makes use of discrete single-valued events or models to arrive at the required
description of earthquakes hazard, the probabilistic analysis allows the use of multi-
valued or continuous model parameters. Of most importance, the probability of different
magnitude or intensity earthquakes occurring is included in the analysis. Another
advantage of probabilistic seismic hazard analysis is that it results in an estimate of the
likelihood of earthquake ground motions or other damage measures occurring at the
location of interest. This allows for a more sophisticated incorporation of seismic hazard
into seismic risk estimates; probabilistic seismic hazard estimates can be expanded to
define seismic risk.
The methodology used in most probabilistic seismic hazard analysis (PSHA) was first
defined by Cornell (1968). There are four basic steps for assessment of PSHA:
Step 1 is the definition of earthquake sources. Sources may range from small faults to
large seismotectonic provinces with uniform seismicity.
Step 2 is the definition of seismicity recurrence characteristic for the sources, where each
source is described by an earthquake probability distribution, or recurrence relationship. A
recurrence relationship indicates the chance of an earthquake of a given size to occur
anywhere inside the source during a specified period of time. A maximum or upper bound
earthquake is chosen for each source, which represents the maximum event to be
considered. Because these earthquakes are assumed to occur anywhere within the
earthquake source, distances from all possible location within that source to the site must
be considered.
Step 3 is the estimation of the earthquake effects which is similar to the deterministic
procedure except that in the probabilistic analysis, the range of earthquake sizes
considered requires a family of earthquake attenuation or ground motion curves, each

15
relating to a ground motion parameter, such as peak acceleration, to distance for an
earthquake of a given size.
Step 4 is the determination of the hazard at the site, which is substantially dissimilar from
the procedure used in arriving at the deterministic hazard. In this case the effects of all the
earthquakes of different sizes occurring at different locations in different earthquake
sources at different probabilities of occurrence are integrated into one curve that shows
the probability of exceeding different levels of ground motion level (such as peak
acceleration) at the site during a specified period of time. With some assumptions this can
be written as:
∫ ∫∑==
>=a
o
m
m r
ri
N
i
i drdmrmzZPrfmfZE01
),|()()()( α
where E(Z) is the expected number of exceedances of ground motion level z during a
specified time period t, αi is the mean rate of occurrence of earthquakes between lower
and upper bound magnitudes (mo and mu), fi (m) is the probability density distribution of
magnitude within the source I, fi(r) is the probability density distribution of epicentral
distance between the various locations within source I and the site for which the hazard is
being estimated, and P(Z>z | m,r) is the probability that a given earthquake of magnitude
m and epicentral distance r will exceed ground motion level z.
It is usually assumed when carrying out the probabilistic seismic hazard analysis that
earthquakes are Poisson-distributed and therefore have no memory; implying that each
earthquake occurs independently of any other earthquake.
One of the most important of the recent developments within PSHA has been in seismic
source modelling. Originally, seismic sources were crudely represented as line sources
(Cornell, 1968) and later area zones, which could be narrowed to represent the surface
outcrop of faults as in McGuire’s (1976) computer program EQRISK. An improved
scheme, which included the effects of fault rupture, was proposed by Der Kiureghian and
Ang (1977), and in a modified form implemented by McGuire (1978) in his fault
modelling program FRISK, written as a supplement to his earlier and very popular
EQRISK area source program.
While the standard practice for a long time was to present the results of seismic hazard
analyses in terms of a single best-estimate hazard curve, the growing awareness of the

16
importance of parametric variability and the trend to consult expert opinion in matters of
scientific doubt, led later to the formulation of Bayesian models of hazard analysis
(Mortgat and Shah, 1979) which seek to quantify uncertainty in parameter assignment in
probabilistic terms.
In the present work we have applied the CRISIS computer code for seismic hazard
assessment (Ordaz et al., 2003). The code accommodates uncertainty in a number of the
seismicity model parameters, and has a user-friendly interface. It accepts polygon-dipping
areas as well as fault sources, and also facilitates characteristic earthquake recurrence
models.
2.3 Probabilistic seismic hazard analysis
2.3.1 Theoretical framework
The model for the occurrence of ground motions at a specific site in excess of a specified
level is assumed to be that of a Poisson process. This follows if the occurrence of
earthquakes is a Poisson process, and if the probability that any one event will produce
site ground motions in excess of a specified level is independent of the occurrence of
other events. The probability that a ground motion level is exceeded at a site in unit time
is thus expressed as:
)(1)( zezZP ν−−=>
where ν(z) is the mean number of events per unit time in which Z exceeds z. According to
the convention (McGuire, 1976) in probabilistic hazard analysis, the region around a site
is partitioned into polygons, which constitute a set of area sources. Basic differences in
seismicity and geology may exist between the zones; however, it is assumed that the
seismicity within each zone is sufficiently homogeneous to be treated uniformly in the
computations. This assumption applies even where non-seismological criteria have been
used in the zone definition, e.g., geological structures. With N seismic sources, and
seismicity model parameters Sn for each source n, the mean number of events pr. unit time
in which ground motion level z is exceeded can be written as:
∑=
=N
n
nn Szvzv1
)|()(
where

17
)|()|()|()|(,
nijnnijn
ji
ninnn SMrzGSMrPSMSzv ⋅⋅=∑λ
and where )|( nin SMλ is the mean number of events per unit time of magnitude Mi
( [ ]maxmin ,MMM i ∈ ) in the source n with seismicity parameters Sn. Moreover,
)|( nin SMzP is the probability that a significant site–source distance is rj,
( ),( maxmin rrr j ∈ ) given an event of magnitude Mi at distance rj in source n with seismicity
parameters Sn. The expression )|( nijn SMrzG is the probability that the ground motion
level z will be exceeded, given an event of magnitude Mi at distance rj in source n with
seismicity parameters Sn. The three functions )|( nin SMλ , )|( nin SMzP and
)|( nijn SMrzG model the inherent stochastic uncertainty in the frequency of occurrence
and location of earthquakes, and in the attenuation of seismic waves.
Given that the mean number of events per unit time for which Z exceeds z is expressed
for example as 1/TR, where TR is the return period (inverse of annual exceedance
probability), then the number of events in a time period T (e.g. the life time of a certain
construction) for which Z exceeds z is given by T/TR and the probability for Z exceeding
z during that life time T is given by:
NTTezZP
/1)(
−−=>
For a life time T of 50 years and a return period TR of 475 years (annual probability of
exceedance 0.211x10⁻²) the probability for Z exceeding z becomes 0.1, corresponding to
90% probability that this size ground motion is not exceeded in 50 years. This is also
illustrated in Fig. 2.1.
With several seismic sources, described through particular model parameters, the mean
number of events per unit time in which the ground motion level z is exceeded can be
expressed specifically, involving functions that model the inherent stochastic uncertainty
in the frequency and location of earthquakes, and in the attenuation of the seismic waves.
2.3.2 The earthquake recurrence model
The recurrence rate of earthquakes is assumed to follow the cumulative Gutenberg-
Richter relation:
log N(M) = a – bM

18
where N(M) is the number of events per year with magnitude greater or equal than M.
This relation appears with few exceptions to hold quite well, indicating a self-similarity of
earthquakes.
In seismic hazard analyses a modified and truncated version of this relation is used,
involving an engineering threshold magnitude Mlim, a limiting upper bound magnitude
Mmax for the source, a slope parameter β = bxln(10) that describes the relation between the
number of smaller and larger earthquakes, and an activity rate parameter A=a(Mlim) which
describes the number of events on the source with magnitude equal to or greater than
Mlim. See Fig. 2.2 for two recurrence models.
Figure 2.2. Earthquake recurrence functions. The red line indicates the truncated
cumulative Gutenberg-Richter relation, while the blue line indicates the
truncated characteristic recurrence model used in CRISIS (Ordaz et al.,
2003).
The activity rate parameter is liable to vary substantially from one seismic source to
another while the b-value is expected to be regionally stable, with variations less than the
uncertainty limits. Faults, which may be separately included as seismic sources in addition
to area sources, are usually attributed their own b-values, which need to bear no
immediate relation to the values obtained from the regional recurrence statistics (Youngs
and Coppersmith (1985).

19
2.3.3 Strong-motion (attenuation) models
There is evidence that the decay rate of ground motions is dependent on the magnitude of
the causative earthquake (e.g. Douglas, 2003), and the decay rate also changes
systematically with distance. Fourier spectra and response spectra moreover decay
differently. Geometrical spreading is dependent on wave type, where in general body
waves spread spherically and surface waves cylindrically, while anelastic attenuation is
wavelength (frequency) dependent. As hypocentral distance increases, the upgoing ray
impinges at a shallower angle on the interfaces, reflecting increasing amount of energy
downwards, thereby reducing the energy transmitted to the surface. For moderate and
large earthquakes the source can no longer be considered a point source and therefore the
size of the fault will mean the decay rate will be less than for smaller events, which is
essentially why, for large events, the distance to the causative fault (Joyner-Boore
distance) usually is used instead of epicentral or hypocentral distance.
Assuming the occurrence of an event of magnitude Mi at a site-source distance of Rj, the
probability of exceedance of ground motion level Z needs to be defined. From studies of
strong-motion records, a lognormal distribution is found to be generally consistent with
the data, where the mean often have a simple form such as:
lnZ = c1 + c2 ⋅ Mi + c3 ⋅ ln Rj + c4 ⋅ Rj
where Z is the ground motion variable and c1 to c4 are empirically determined constants
where c2 reflects magnitude scaling (often in itself magnitude dependent), c3 reflects
geometrical spreading and c4 reflects inelastic attenuation. Also found from the recorded
data is an estimate of the distribution variance.
One of the most important sources of uncertainty in PSHA is the variability or scatter in
the ground motion (attenuation) models, which is an aleatory uncertainty usually
expressed through a sigma (σ) value which is often of the order of 0.3 in natural
logarithms, corresponding to about 0.7 in base 10 units. This uncertainty, which usually
also is both magnitude and frequency dependent, is mostly expressing a basic randomness
in nature and therefore cannot be significantly reduced with more data or knowledge. In
PSHA we integrate over this uncertainty which thereby is directly influencing (driving)
the seismic hazard results.

20
2.4 Implementation
The earthquake criteria development performed for this study is, as explained in more
detail above, based on probabilistic seismic hazard analysis techniques designed to
incorporate uncertainties and to quantify the uncertainties in the final hazard
characterizations (confidence limits).
The procedure for identifying potential seismic sources in the project region comprises:
• An evaluation of the tectonic history of the region in light of available geological
data and information.
• An evaluation of the historical and recent instrumental seismicity data in relation to
the project region, emphasizing that these data are the primary empirical basis for
conducting seismic hazard analyses.
The present study is building on knowledge and experience within the field of earthquake
criteria development for numerous sites in different tectonic environments, thereby
ensuring results which are comparable on a larger scale.
2.4.1 Geology
The general approach to this side of the seismic criteria development is to review relevant
and available geological information in order to locate and characterize active and
potentially active geological structures, i.e. faults and/or segments of faults which may
represent a potential seismic source that could influence the seismic hazard at the site. It
should be noted however, that the presence of a large fault is not always regarded as a
potential earthquake source, since faults are considered potentially active only if they
have ruptured fairly recently (which on a geological time scale could be as much as
10,000 years).
2.4.2 Seismology
A seismic hazard analysis should be based on both the geological and seismological
history of the region, including recent and historical seismicity, supplemented with paleo-
seismological information if available (Kumar et al., 2006). The information called for
here includes generally, besides the usual earthquake catalogue, also information which

21
can improve the understanding of the geodynamics of the region, such as earthquake
rupture processes, mode of faulting, stress field, source mechanism, etc.
2.4.3 Seismotectonic interpretation
The geological and seismological information is used to define models for the potential
earthquake sources that could influence the hazard at the site. The main aspects of the
source characterization are: (1) modelling of area sources based on the geologic history of
the region in general and on earthquake occurrence statistics (historical and contemporary
seismicity catalogues) in particular, and (2) modelling of fault-specific sources with three-
dimensional geometry, if such detailed information is available. Note that fault modelling
is rarely included in regional hazard studies as the present.
The characterization of each seismic source will be as comprehensive as the data allows
and will specifically incorporate the uncertainties in each source characteristic. Maximum
earthquake magnitudes are assessed using a combination of physical methods, historical
seismicity and empirical evidence from geologically similar regions.
2.4.4 Ground motion (attenuation) models
The present earthquake hazard study requires the availability of earthquake ground
motion models for peak ground acceleration and spectral acceleration, for the frequency
range of engineering interest. Available models include near field excitation as well as the
attenuation with distance, and the scaling with magnitude here is essentially developed for
estimating the effects of an earthquake which is not yet been observed in the region
considered.
Strong-motion attenuation relationships are important in any seismic hazard model along
with seismic source characterization, and it is noteworthy here that the uncertainties in
attenuation often are among those which contribute the most to the final results. This is
true for any area, and in particular for the Himalaya region, where very few strong-motion
observations exist in spite of a high seismicity level.
2.4.5 Computational model
The actual seismic hazard computations for a specific site are based on integrated
probabilistic contribution to the ground motion by the fault-specific and area sources
22
modified by the seismic wave attenuation. The uncertainties of some of the input
parameters are carried through the computation.
2.4.6 Hazard results and design criteria
The relationship between a range of ground motion levels and the associated annual
exceedance probability (hazard curve) is established through median values for each
frequency.
An essential element of the present earthquake hazard methodology is that seismic
loading criteria may be evaluated in terms of equal-probability (equal hazard) spectra.
This means that each frequency is evaluated independently, with its own uncertainty
estimate.
The seismic loading criteria are specifically developed for bedrock outcrop (site with no
soil). Design response spectra for the required annual exceedance probabilities may then
be developed based on the PGA values, and in certain cases accompanied with sets of real
time histories (earthquake recordings), appropriately scaled to match the spectra. The
latter is done only when specific advanced design analysis is conducted.
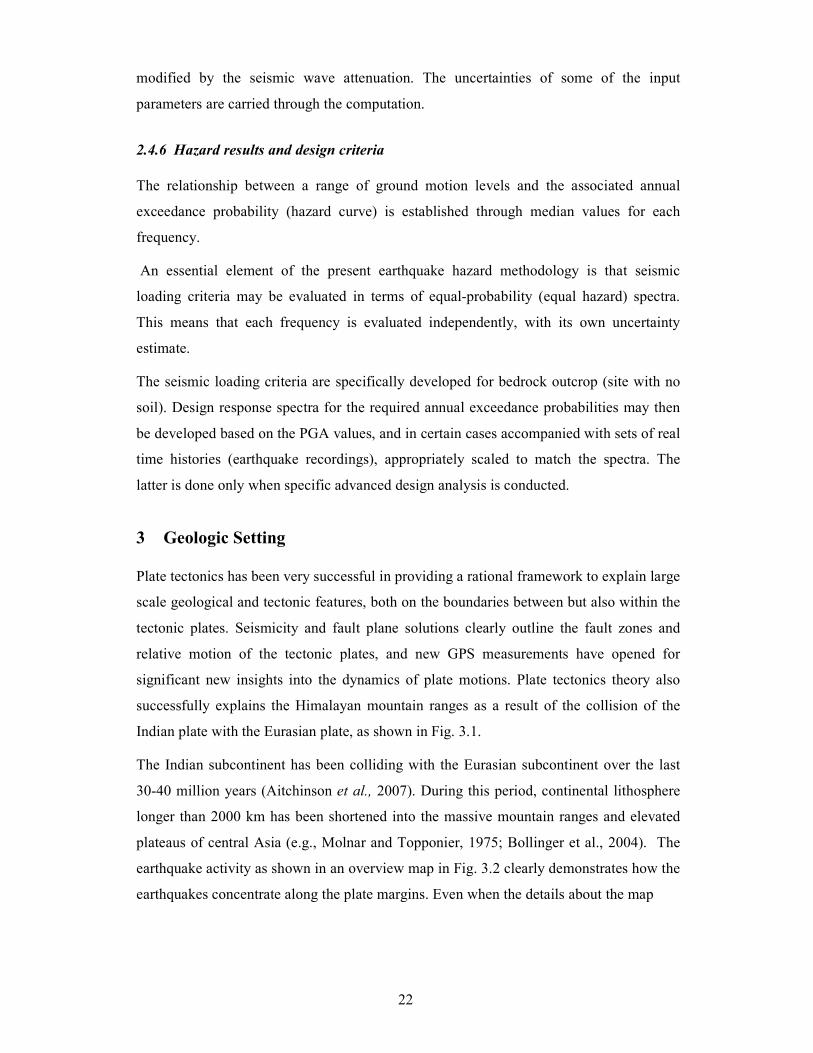
3 Geologic Setting
Plate tectonics has been very successful in providing a rational framework to explain large
scale geological and tectonic features, both on the boundaries between but also within the
tectonic plates. Seismicity and fault plane solutions clearly outline the fault zones and
relative motion of the tectonic plates, and new GPS measurements have opened for
significant new insights into the dynamics of plate motions. Plate tectonics theory also
successfully explains the Himalayan mountain ranges as a result of the collision of the
Indian plate with the Eurasian plate, as shown in Fig. 3.1.
The Indian subcontinent has been colliding with the Eurasian subcontinent over the last
30-40 million years (Aitchinson et al., 2007). During this period, continental lithosphere
longer than 2000 km has been shortened into the massive mountain ranges and elevated
plateaus of central Asia (e.g., Molnar and Topponier, 1975; Bollinger et al., 2004). The
earthquake activity as shown in an overview map in Fig. 3.2 clearly demonstrates how the
earthquakes concentrate along the plate margins. Even when the details about the map

23
(time period, sources, magnitude type etc.) are not available it shows clearly the regional
earthquake distribution.
Even though the Himalayan region is huge and contains large parts that are remote and
sparsely populated we still have some overview of the seismicity there for the last 500
years, even with indications of an earthquake deficit at present (e.g., Ambraseys and
Bilham, 2003; Bilham and Ambraseys, 2005; Feldl and Bilham, 2006).
As a result of the continent-to-continent collision in the Himalayas, the highest mountains
in the world have been created (Fig. 3.1), still being uplifted more rapidly than any other
mountain chain.
Figure 3.1. The Indian plate colliding with the Eurasian plate.
Some of the greater mountain structures resulting from the collision can be summarized as
follows:
• The Himalayas have been formed in the central part.
• The Arakan-Yoma Mountains of Burma.
• The Naga Hills of Assam towards the east.

24
• To the west, the Baluchistan arc manifested by the Kirther and Sulaiman ranges
delineate the continent-continent collision zone.
• The rising mountain ranges of the Tien-Shan Mountains in central Asia.
• The Karakoram Mountains in Pakistan.
• The Hindu Kush Mountains formed at the junction of the Baluchistan arc.
• The Karakorum Mountains and the Pamir ranges (Desio, 1965).
Fig 3.2 shows the regional seismicity and the fault in the Arabian Sea which has generated
earthquakes including the 1945 earthquake which generated a tsunami.
Figure 3.2. The regional seismicity of Southern Asia (above magnitude 3.0) according to
the British Geological Survey (BGS).
According to the Figs. 3.1 and 3.3 the mountains, notably HinduKush, Pamir and
Karakurom, are characterized by deep and concentrated seismicity through which
significant seismic energy is released every year. Seismically, Hindu Kush and Pamir is
one of the most active regions in the world (Nowroozi, 1971). The Himalayas and the
Baluchistan Arc are the southernmost frontal parts of this collision zone which extends

25
northward through Afghanistan and Tibet into China and Central Asia. Fig 3.3 shows how
the Chaman fault meets with the Herat fault and in the Pamir region these structures bend
eastward and split into the Karakoram and the Altayan Tagh fault systems. The under-
thrusting of the Indian shield beneath the Himalayas and transverse ranges of the
Balochistan arc was clearly recognized from fault plane solutions (Fig. 3.3). (Molnar et
al., 1973; Shirikovaa, 1974; Tandon and Shirokova, 1975). Left-lateral strike slip motion
on the north-south striking Chaman fault has been postulated on the basis of geologic
evidence (Wellman, 1966) and this is partly supported by the focal mechanism solution in
Fig. 3.4.
The Sulaiman and the Kirthar ranges of Pakistan are aligned in a north-south direction
forming the Balochistan Arc (Fig. 3.3). The NW-SE trending mountains of Kashmir,
which form the western part of the Himalaya Arc, bend sharply to the south near Nanga
Parbat (Meltzer et al., 2001) forming the western Himalayan syntaxis (often called the
Hazara syntax). From there, the NE-SW trend of the Balochistan arc is generally
maintained along the Sulaiman-Kirther ranges for about 1000 km, before taking another
sharp bend towards the west, after which a general east-west trend is maintained along the
Makran ranges and the mountains of Southern Iran. The Makran ranges of Iran and
Pakistan have been described as an active arc system by Farhoudi and Karig (1977).

26
Figure 3.3. Major tectonics in Pakistan (courtesy: Geological Survey of Pakistan).
The structure of the Baluchistan arc, like the Himalaya arc, is dominated by tight folds
and over thrusts, mainly from the north-west and west toward the Indian plate with axes
directed essentially in a north-south direction, parallel to the general trend of the arc
(William, 1976).
At the southern end of the Sulaiman ranges, the mountains swing sharply towards the
west, maintain an east-west trend for nearly 300 km, and then take a second sharp bend to
the south near the city of Quetta surrounding the Sibi trough (Figs. 3.2 and 3.4). The
north-south trend continues along the Kirthur mountains (West, 1936). The Sulaiman and
Kirthur mountains ranges are similar in geology, stratigraphy, and structure.

27
Figure 3.4. Seismic risk map (prepared by Geological Survey of Pakistan) overlaid with
historical seismicity.
The structure of the area consists of a complex pattern of folds and thrusts with axes
changing from east-west to north-south. The Chaman fault (Fig. 3.3) is a seismically
moderately active fault. It starts from Hirat, Afghanistan, in the west and moves to east
and causes the seismic activities in Pakistani area. It by-passes the angular configuration
of the Quetta and Sulaiman ranges. It connects the Kirther range from west of Quetta. The
Chaman fault zone represents the western boundary of the wide deformation zone. While
the northern part traverses Afghanistan the central part goes into Pakistan northwest of
Quetta before it continues southwards towards the Arabian Sea.

28
3.1 Seismotectonics of Pakistan
For the study of earthquake hazard in Pakistan, the country was divided into nineteen
zones (see Fig. 5.1 later in this report), including some portions of the neighbouring
countries of Afghanistan, Tajikistan, Iran and India. The division of the region into these
source zones is based on the seismicity, the fault systems and the stress direction analysis.
Pakistan is located on the north-west region of the Indian plate that pushes into the
Eurasian plate. The direction of horizontal compression has been mapped from the focal
mechanism and is shown in Section 5 (Fig. 5.6).
The Hindu Kush region generates regularly very large earthquakes, occurring down to
300 km depth, which are also felt in Pakistan. The compressive stress direction of this
region is NNW-SSE, albeit with a somewhat bimodal nature as seen in Fig. 5.6. The
direction of crustal stress in Kashmir is NE-SW, perpendicular to the line of plate
collision and MBT. In the Hindu Kush region the earthquake mechanism is generally
thrust faulting occasionally normal faulting whereas in Kashmir, the earthquakes mainly
show thrust fault mechanism with a clear NE-SW compression. Both the Karakoram and
Hindu Kush ranges are caused by the collision of the Indian plate into the Eurasian plate
the Indian plate collides and under plates the Eurasian plate. The Hindu Kush and the
Pamir constitutes one of the most seismically active earthquake zones in the world.
In the Kashmir region we find the important Hazara-Kashmir Syntax (HKS), which was
formed due to the change in the Himalayan thrust interface direction from NE in Kashmir
to NW along the Indus. The Punjal thrust and the Main Boundary Thrust (MBT) are
folded around this syntax and are subject to a 90o “rotation” from one side to the other.
The Panjal thrust, MBT and Muzaffarabad thrust are truncated by the active Jhelum fault
(Baig and Lawrence, 1987). Beside other faults in this region, the Jhelum fault acts as an
active left lateral oblique reverse fault. The general seismicity pattern of the Jhelum-
Ambore zone is low activity of regular earthquakes with magnitudes ≤ 4.0. The historical
and instrumental seismic data from this region show no earthquake with a size exceeding
magnitude 6.8.
In the western Himalayas (Gilgit Agency), the seismic activity is associated with
earthquakes of magnitude 5 and larger, and largely coincides with the surface trace of the
Himalayan Main Central Thrust (MCT) rather than with the Himalayan Main Boundary
Thrust (MBT) which represents the structural boundary. Many of the earthquakes that

29
occur on the MBT take place at depths of 20 to 40 km and are associated with a shallow
northward dipping subsurface extension of the MBT underlying the MCT (the under
plating of the Eurasian plate). One section of the eastern Himalaya front thrust was
relatively quite during the last decades. This is the source zone of the Kangra earthquake
(Ms 8.0) which occurred in 1905 and which extended from Kangra to Dehra Dun, i.e. 76o
E to 78o E (Middlemiss, 1910).
The second section of presently low seismic activity is near the eastern flanks of the
Kashmir syntaxial bend (Fig. 3.2). Note that the north western end of the zone of low
activity in Kashmir stops against a zone of high activity which is the area of the
destructive Pattan earthquake of December 28, 1974 (M=6.0) and the 8th October, 2005
Muzaffarabad earthquake (Mw 7.6).
The seismicity in the Kirther range is relatively diffuse compared to that in the Suleiman
range. In the latter, the seismicity falls on or near a well defined fault scarp which offsets
the range against the eastward extending Indus basin. The northern two thirds of the faults
have ruptured in the large Much earthquake of August 27, 1931 (West, 1934).
The most remarkable clustering of seismicity Fig. 3.2 occurs in the Quetta transverse
range as far as 100 km south of its higher peaks and is located within or beneath the thick
young tertiary sediments of the Indus basin.
4 Seismology of the Study Region
The seismicity of the region is directly related to the geo-tectonic processes; however, the
quantitative monitoring of the seismicity only goes some 100 years back. With the long
term processes in action the short seismicity monitoring time is a serious limitation, but a
limitation which we have to accept.
4.1 Earthquake information
The main data bases for earthquake information in this study are:
• PMD, Pakistan Meteorological Department, historical database.
• PDE, United State Geological Survey, database.
• ISC, International Seismological Centre England, database.

30
• Harvard database.
4.1.1 The USGS historical database
The historical database of USGS was obtained from the Internet. The data in the spatial
window was selected ranging from 20o to 40
oN and 58
o to 83
oE. This data base comprised
143 events with assigned Ms magnitudes up to 8.6. The seismological events were in
chronological order dating from year 765 to 1992. Each earthquake in the data base is
detailed according to source, date, time, latitude, longitude, magnitude, intensity, and
other seismic-related information.
4.1.2 The PMD historical database
The historical earthquake catalogue was compiled by Pakistan Meteorological
Department (Table 4.1). The historical data base comprises of 58 earthquakes from year
25 to 1905. All earthquakes are provided with a short description and estimates of
maximum intensity. Important extensions to the original database were made by including
data from Quittmeyer and Jacob, (1979; see also Menke and Jacob, 1976). Fig. 4.4 shows
these earthquakes.
The main scientific reason for using the two catalogues (PDE and PMD) simultaneously
was the definitive compilation of earthquake information and readings. It is a common
observation that the same earthquake may have slightly different hypocenters or
magnitudes in two different catalogues or an earthquake may be listed in one catalogue
and not in the other.
The USGS PDE instrumental database just like the historical database of USGS, the
instrumental database of the same (NEIC-PDE) was also obtained from the Internet. The
PDE catalogue contains the data from 1973 to February 2007. The data were extracted
from the catalogue in the spatial window ranges from 20o to 40
oN and 58
o to 83
oE. The
portion of this catalogue which was studied consisted of some fourteen thousand
earthquakes, having magnitude types such as Mb, ML, Mw, Ms.
4.1.3 The ISC instrumental database
Each earthquake in the data base is detailed according to source, date, time, latitude,
longitude, magnitude, and seismic-related information. It is a large database and in a

31
typical mode, the ISC (http://www.isc.ac.uk) receives more than 200,000 recordings from
world wide stations. The analysis of these digital records leads to the identification of an
average of 10,000 seismic events per month. Out of these almost 4,000 require manual
review.
About thirty thousand (29,970) seismic events from the ISC database were analyzed
during this study. The region from which these events were extracted from the database
was the same as in the previous cases. The data cover the period from 1900 through 2006.
These earthquakes from ISC were plotted using the Google Earth software and the map so
formed is shown in Fig. 4.1.
Figure 4.1. Earthquake epicentres shown in red circles (from the ISC-catalogue).
4.1.4 The Harvard instrumental database
The reason for selecting the Harvard catalogue as one of our study tools is that it contains
three consistent magnitude types (Mb, Ms and Mw) for each of the events in addition to
the standard location (coordinates), depth, time, half duration, moment tensor, scalar
moment, and mode of faulting (strike, dip and slip). Altogether 550 seismic events,
January 1977 to September 2006, with magnitude equal or greater than 5.0 were analyzed

32
and plotted on the map Fig. 4.2. Due to their magnitude these events are all significant,
showing that large parts of Pakistan are quite vulnerable to earthquakes, especially the
northern and south-western regions.
Figure 4.2.Earthquakes with magnitudes M ≥ 5.0 (red circles) according to the Harvard
catalogue.
4.1.5 The PMD instrumental database
The PMD data base is comprised of historical and instrumentally recorded earthquakes.
Only body wave magnitude Mb is assigned to the recorded earthquakes. The PMD
seismic recording network is operational since 1954 but this catalogue contains events
since 1905 and previous records were taken from International Seismological Centre. In
the 1960’s World Wide Standardized Seismic Network (WWSSN) stations were installed
at Peshawar, Islamabad and Quetta. Due to this network PMD recorded teleseismic
earthquakes and distant earthquakes records are available in PMD data base.
33
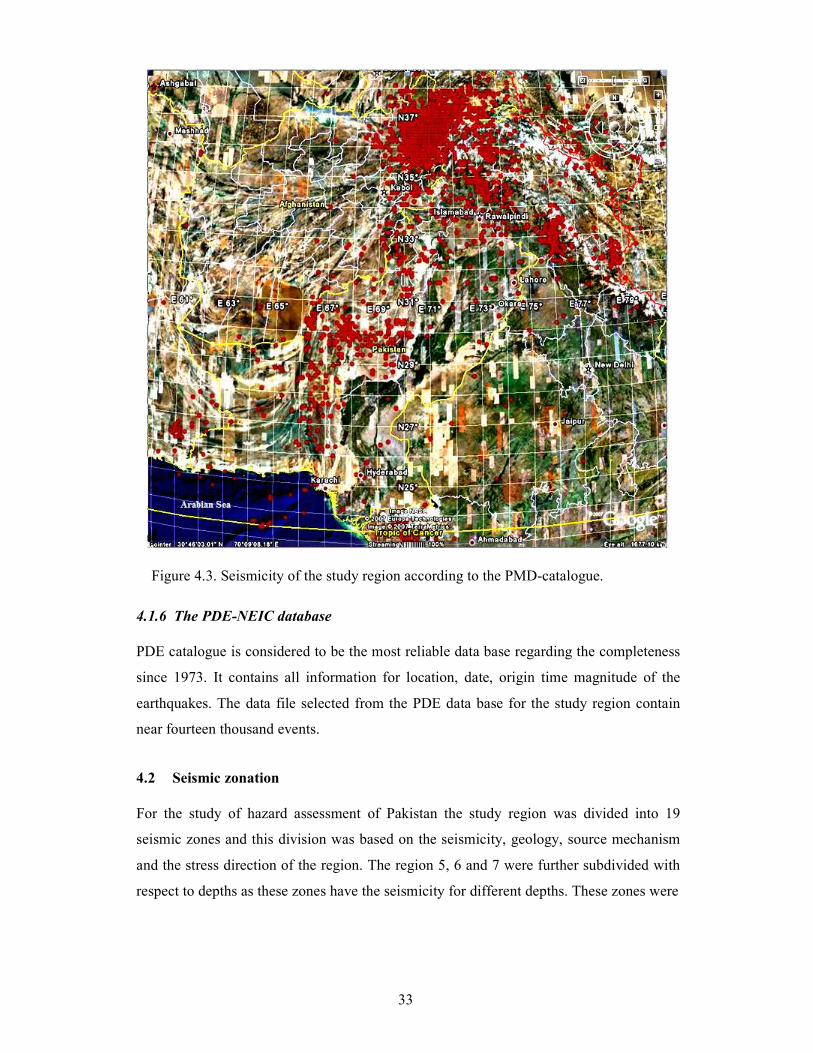
Figure 4.3. Seismicity of the study region according to the PMD-catalogue.
4.1.6 The PDE-NEIC database
PDE catalogue is considered to be the most reliable data base regarding the completeness
since 1973. It contains all information for location, date, origin time magnitude of the
earthquakes. The data file selected from the PDE data base for the study region contain
near fourteen thousand events.
4.2 Seismic zonation
For the study of hazard assessment of Pakistan the study region was divided into 19
seismic zones and this division was based on the seismicity, geology, source mechanism
and the stress direction of the region. The region 5, 6 and 7 were further subdivided with
respect to depths as these zones have the seismicity for different depths. These zones were

34
analysed at depths 75 km and 210 km as these contributes to the seismic hazard values.
The seismicity at all depths is shown in the Fig 4.4. There is clustering of earthquakes in
the northwest (Hindukush), northeast (zone 1) and at southwest (Quetta region) of
Pakistan, these are the main contributor of seismic hazard.
Figure 4.4. Seismicity of the study region according to the PDE-catalogue.
4.2.1 The historical earthquakes
The historical earthquakes from Pakistan are listed in Table 4.1 and shown in Fig. 4.5.
Many of these earthquakes have not been closely assessed in terms of magnitude;
however, the assigned intensity provides important indirect information on the strength of
the earthquake.
The main features that immediately can be extracted from the historical record:
• A concentration of earthquakes in the northern belt from Islamabad/Rawalpindi to
Peshawar.

35
• A concentration of earthquakes in the region around Quetta
• Four earthquakes in the Karachi-Ahmadabad region.
• Regions of low or no historical activity are:
o South-western Pakistan i.e. Makran, Chagai hills (sparse population)
o Toba-Kakar Range north of Quetta
o Punjab
Figure 4.5. The historical earthquakes from the PMD-catalogue before 1905.

36
Table 4.1. Historical earthquakes as collected by Pakistan Meteorological
Department.
Date Lat (N) Lon (E) Intensity Remarks
25 A.D 33.7 72.9 X TAXILA EARTTHQUAKE
The main centre of Budhist Civilization at
that time was turned into ruins. Epicentre of
the earthquake was around 33.7 N and
72.9E. Maximum documented Intensity was
X.
50 A.D 37.1 69.5 VIII-IX AIKHANUM EARHQUAKE
Epicentre of the earthquake was around
37.1 N, and 69.5E. Maximum documented
Intensity was VIII-IX . Caused extensive
damage in Afghanistan, Tajikistan and
N.W.F.P and was felt upto N.India.
893-894AD 24.8 67.8 VIII-X DABUL EARTHQUAKE
Epicenter of the earthquake was around
24.8 N, and 67.8E. Maximum documented
Intensity was VIII-X. An Indian ancient city
on the coast of Indian ocean was completely
turned into ruins. 1,80,000 people perished.
1052-1053 32.85 69.13 VII-IX URGUN; Quittmeyer and Jacob, 1979
June 1504 34.5 69.0 VI-VII QUITTMEYER AND JACOB, 1979
6/7/1505 34.6 68.92 IX-X PAGHMAN; QUITTMEYER AND
JACOB, 1979
6/7/1505 34.6 68.9 VIII-IX HINDUKUSHEARTHQUAKE
Epicenter of the earthquake was around
34.6 N, and 68.9E. Maximum documented
Intensity was VIII-IX. It was an immense
Earthquake causing famine and extensive
damage & loss of life in Afghanistan.
3/1/1519 34.8 71.8 VI-VII JANDOLVALLEY EARTHQUAKE
Jandol valley was severely rocked.
Epicentre of the earthquake was around
34.3 N and 71.8E. Maximum documented
Intensity wasVI-VII.
May 1668 24.8 67.6 VIII-IX SAMAJI OR SAMAWANI
Town of Samaji or Samawani sank into
ground. 80,000 houses destroyed. Epicenter
of the earthquake was around 24.8 N and
67.6E. Maximum documented Intensity was
VIII-IX.
4/6/1669 33.4 73.2 VI-XI MANDRA EARTHQUAKE
Epicenter of the earthquake was around
33.4 N, and 73.3E. Maximum documented
Intensity was VII.
22/6/1669 34 76 VI-VII KASHMIR EARTHQUAKE.
23/6/1669 33.87 72.25 VIII-IX ATTOCK EARTHQUAKE
1780 34 76 V-VII KASHMIR EARTHQUAKE
16/6/1819
23.3 68.9 IX-X RUNN OF CUTCH
It reduced to ruins.2000 people died.
Epicenter of the earthquake was around
23.3 N, and 68.9E. Maximum documented
Intensity was IX-X.

37
Date Lat (N) Lon (E) Intensity Remarks
24/9/1827 31.6 74.4 VIII-IX LAHORE EARTHQUAKE
In this earthquake the fort kolitaran near
Lahore was destroyed. About 1000 people
perished. A hill shaken down into river
Ravi.
6/6/1828 34.1 74.8 X KASHMIR EARTHQUAKE
In this earthquake 1000 people died and
1200 houses destroyed.
1831 31.75 70.35 VIII-IX DARABAN; QUITTMEYER AND
JACOB, 1979
1831 33.5 72.0 IV-VII HINDUKUSH EARTHQUAKE
It was severe earthquake felt from Peshawar
to D.G Khan Maximum documented
Intensity was VII at Peshawar VI at
Srinagar and IV at D.G Khan.
22/01/1832 36.9 70.8 VIII-IX HINDUKUSH EARTHQUAKE
It was severe earthquake Which rocked
Afghanistan, Northern and central parts of
Pakistan and NW India. Maximum
documented Intensity was VIII-IX at
Kalifjan, Jurm, Kokcha Valley, and VI at
Lahore.
21/2/1832 37.3 70.5 VIII-IX HINDUKUSH EARTHQUAKE
The epicenter of this earthquake was in
Badakhshan Province. Earthquake felt at
Lahore and NW India.
26.1 1840 34.53 69.17 VI-VIII KABUL; QUITTMEYER AND JACOB,
1979
19/2/1842 34.3 70.5 VIII-IX HINDUKUSH EARTHQUAKE
Epicenter of the earthquake was near Kabul
.Maximum documented Intensity was VIII-
IX Alingar valley, Jalalabad and Tijri and
VI-VII at Teezeen and VII-VIII at
Budheeabad.The earthquake was felt from
Kabul to Delhi Over an area of 2,16,000
sq.miles.Jalalabad and Peshawar damaged,.
19/6/1845 23.8 68.8 VII-VIII RUNN OF CUTCH
Documented epicenter of this earthquake
was lie between 23.8 N, 68.8 E, and
Maximum intensity was VII-VIII .Lakhpat
was badly affected.
17/1/1851
32.0 74.0 VI-VIII PUJAB PLAIN EARTHQUAKE
Maximum Documented intensity was VIII
and VI-VII at Wazirabad, Ferozpur and
Multan, VI at fort Munro.
19/4/1851 25.1 62.3 VII GAWADAR EARTHQUAKE
Epicenter of the earthquake was around
25.1 N, and 62.3E. Maximum documented
Intensity was VII at Gwadar.
24/1/1852 34.0 73.5 VIII MURREE HILLS EARTHQUAKE
Epicenter was in Murree hills and Kajnan
about 350 people died. Maximum
Documented Intensity was VIII.
1862 29.88 69.22 VIII KOHU VALLEY; QUITTMEYER AND
JACOB, 1979.

38
Date Lat (N) Lon (E) Intensity Remarks
10/7/1863 34.08 74.82 VI-VII SRINAGAR, ALSO FELT IN LAHORE
25/7/1864 25.12 62.33 VI-VIII GWADER
22/1/1865 34.00 71.55 V-VII PESHAWAR
1867
29.2 68.2 VII LAHRI EARTHQUAKE.
The epicenter of earthquake was around
29.2 N, 68.2 E; Maximum Documented
Intensity was VII at Lahri.
10/11/1868 32.5 71.3 VIII BANNU EARTHQUAKE
The epicenter of earthquake was around
32.5N, 71.3 E. Maximum Documented
Intensity was VIII at Bannu.
11/8/1868 34.0 71.6 VII-VIII PESHAWAR EARTHQUAKE
The epicenter of earthquake was around 34.
0N,71.6E, near Peshawar. Maximum
Documented Intensity was VII-VIII.
24/3/1869 32.92 73.72 V-VII JEHLUM, QUITTMEYER AND JACOB,
1979
April 1869 34.0 71.55 VII-VIII PESHAWAR, QUITTMEYER AND
JACOB, 1979
20/12/1869 33.6 73.1 VII-VIII RAWALPINDI EARTHQUKE
The epicenter of earthquake was around
33.6N,73.1E. Maximum Documented
Intensity was VII-VIII at Rawalpindi-VI at
Lawrancepur and Attock. It caused cracks
in walls in many houses at Rawalpindi.
April 1871
34.0 76.0 VII-VIII KASHMIR EARTHQUAKE
The epicenter of earthquake was around
34.0N,76.0E, in Kashmir. Maximum
Documented Intensity was VII-VIII. It was
also felt with Intensity VI at Rawalpindi and
Murree.
20/5/1871 36.9 74.3 VII-VIII GILGIT EARTHQUAKE
The epicenter of earthquake was around
36.9N,74.3E,in former Gilgit agency.
Maximum Documented Intensity was VII-
VIII. Quittmeyer and Jacob, 1979 claim that
this event occurred 22 May.with coord.
35.92 and 74.32
15/12/1872 29.2 68.2 IX-X LEHRI, BALOCHISTAN
18/10/1874 34.5 69.2 IX KABUL EARTHQUAKE
The epicenter of earthquake was around
34.5N,69.2E .Maximum Documented
Intensity was IX at Kabul,Jabal-al-saraj and
Gulbahar and VIII in Kohistan area of
N.W.F.P.
12/12/1875 34.0 71.55 VII-VIII LAHORE-PESHAWAR EARTHQUAKE
The epicenter of earthquake was around
31.6N,74.4E .Maximum Documented
Intensity was VII-VIII at Peshawar and
Lahore. Note: Coordinates from Quittmeyer
and Jacob, 1979

39
Date Lat (N) Lon (E) Intensity Remarks
2/5/1878 33.58 71.4 VII-VIII KOHAT-PESHAWAR EARTHQUAKE
The epicenter of earthquake was between
Kohat and Peshawar. .Maximum
Documented Intensity was VII-VIII at
Kohat and Peshawar VI-VII at Attock,
Abbotabad, Rawalpindi and Jhelum, V-VI
at Bannu, Nowshera, Mardan, Lahore and
Simla.
1883 28.08 66.08 VI KHALAT; QUITTMEYER AND JACOB,
1979
April 1883 34.0 71.55 VI-VII PESHAWAR, QUITTMEYER AND
JACOB, 1979
15/1/1885 34.08 74.82 VI-VII SRINAGAR; QUITTMEYER AND
JACOB, 1979
30/5/1885 34.1 74.8 IX-X KASHMIR EARTHQUAKE
The epicenter of earthquake was around
34.1N,74.8E .Maximum Documented
Intensity was IX–X in the epicentral
area.VIII-IX at Sopur.Gulmarg,Gingal and
Srinagar.VI-VII at Punch,Muzzafarabad
area.Extensive damage was about 47
sq.miles between Srinagar,Baramula and
Gulmarg.Total felt area was 1,00,000
sq.miles.About 3000 people parished and
some villages were completely destroyed.
6/6/1885 34.2 75.0 IX-X KASHMIR EARTHQUAKE
The epicenter of earthquake was around
34.2N,75.0E .Maximium Documented
Intensity was IX-X.
28/12/1888
30.2 67.0 VIII-IX QUETTA EARTHQUAKE
The epicenter of earthquake was around
30.2N,67.0E, at Quetta. Maximum
Documented Intensity was VIII-IX.
1889 27.7 67.2 VIII JHALAWAN EARTHQUAKE
The epicenter of earthquake was around
27.7N,67.2E at Jhalawan .Maximum
Documented Intensity was VIII.
1890 30.4 68.6 VII LORALAI EARHQUAKE
The epicenter of earthquake was around
30.4N, 68.6E .Maximum Documented
Intensity was VII at Loralai.
20/12/1892 30.9 66.4 VIII-IX CHAMAN EARTHQUAKE
The epicenter of earthquake was around
30.9N, 66.4E near Chaman. Maximum
Documented Intensity was VIII- IX at
Chaman and VII at Sanzal. In this
earthquake great damage to
buildings,bridges,railoads and other
structure etc.The earthquake was caused by
the movement of Chaman fault on the west
bank of Khojak range passing through the
north west railway between Shelabagh and
Sanzal.At Shelabagh the railway station
building was severely damaged.
40
Date Lat (N) Lon (E) Intensity Remarks
13/2/1893 30.2 67.0 VIII-IX QUETTA EARTHQUAKE
The epicenter of earthquake was around
30.2N,67.0E .Maximum Documented
Intensity was VIII- IX at Quetta.
25/11/1893 34.0 71.55 VI-VII PESHAWAR-NOWSHERA
EARTHQUAKE
The epicenter of earthquake was between
Peshawar and Nowshera .Maximum
Documented Intensity was VI-VII at both
places
1900 30.4 67.0 VIII QUETTA-PASHIN EARTHQUAKE
The epicenter of earthquake was around
30.4N, 67.0E .Maximum Documented
Intensity was VIII.
20/1/1902
35.9 71.8 VII-VIII CHITRAL EARTHQUAKE
The epicenter of earthquake was around
35.9N, 71.8E near Chitral. Maximum
Documented Intensity was VII-VIII.
1902 30.6 66.8 VII GULISTAN-PASHIN EARTHQUAKE
The epicenter of earthquake was around
30.4N, 67.0E .Maximum Documented
Intensity was VIII VII.
23/12/1903 29.5 67.6 VII DADHAR EARTHQUAKE
The epicenter of earthquake was around
29.5N, 67.6E. Maximum Documented
Intensity was VII.
4/4/1905 32.13 76.28 X KANGRA EARTHQUIAKE
4.3 The largest earthquakes
4.3.1 The 1905 Kangra earthquake (M 8.0)
The Kangra earthquake with magnitude Ms 8.0 (Gutenberg and Richter) of 4 April 1905
in the north-west Himalaya, near Dehra Dun, was the first of several devastating 20th
century earthquakes to occur in northern India. More than 20,000 people were killed near
the epicentre area and about 100,000 buildings were destroyed by this earthquake. The
felt area was extensive and the intensity ≥VIII was observed in most of the areas.
Although this earthquake is not the only severe event known in the western Himalaya, it
had the largest death toll and is one of the first to occur in the period of instrumental
seismology. It is also one of the four great Himalayan earthquakes to have occurred in the
past 200 years.

41
The magnitude of the Kangra earthquake influenced the estimates of the largest credible
earthquake that might occur in the western Himalaya. Moderate earthquakes occur every
few decades along the small circle that defines the southern edge of the Tibetan Plateau,
but no historical earthquakes have ruptured the surface along the Main Frontal Thrusts
bordering the Himalayan foothills (Ambraseys and Bilham, 2000; Kumar and Mahajan,
2001; Kumar et al., 2001; Bilham, 2001). Also the 1905 event produced no frontal
rupture.
Figure 4.6. Map showing location and felt time in minutes of Kangra aftershocks.
Histogram below shows the clustering of these in time relative to main shock
and aftershock recorded by magnetometer at Dehradun (Hough et al., 2005).
Though historical records are poor, it appears that the last great earthquake in this region
occurred in September 1555. Yet another major earthquake occurred in 1885 near
Srinagar. Seeber and Armbruster (1981) found evidence of strain accumulation in the
region. Only geodetic data to have been analyzed to assess the rupture parameters for this
event are from a levelling line inferred to cross the eastern edge of the rupture zone.
Various analyses of these data have been reported but conclusions concerning fault slip
42
and rupture geometry are weakened by considerable uncertainties in defining the northern,
southern and western edges of the inferred rupture zone (Chander, 1988). These analyses
of the data provide weak constraint for the slip in 1905 earthquake of 5-7.5 m.
It was observed that magnetograms saturated in the first 8 min, but also that a distinct
arrival occurred 11.3 min after the main shock. Fig. 4.6 shows the locations of reported
aftershocks reported during the 15 min following the main shock. The main location
based on reports for two consecutive 8 min windows are calculated to lie 20-100 km SE
of Dehradun. However, because the Kangra epicentral region was severely damaged, few
people were able to document the timing of aftershocks. The location may be away from
main shock epicentre (Hough. et al., 2005).
4.3.2 The 1935 Quetta earthquake
The magnitude 7.7 Quetta earthquake occurred on May 30, 1935. Although Baluchistan in
1935 had one of the lowest population densities on the subcontinent of India, this
earthquake occurred where most of the population lived. The depth, reported by
Ramanathan and Mukherji (1938) was 10 km. For this reason, and despite the initiation of
earthquake-resistant design triggered by the nearby 1931 sequence, the 1935 Quetta
earthquake resulted in the largest number of fatalities of any earthquake on the Indian
subcontinent.
The Quetta surface-wave magnitude calculated from 25 station magnitudes is 7.7, which
corresponds to a seismic moment of 17.0 x 10²⁰ Nm, as estimated by Singh and Gupta
(1980). Lawrence et al. (1992) and Yeats et al. (1997) associated these ruptures with the
Ghazaband fault zone, one of a series of large north-south left-lateral strike-slip systems
that accommodate plate boundary shear. A temporary seismic network operated in the
region in 1978 suggests that microseismicity was at that time concentrated near the ends
of the 1935 rupture (Armbruster et al., 1980). Fault-plane solutions in the area confirm
left-lateral faulting on this trend, and, in spite of the lack of reported observations of
strike-slip offsets at the time, this is the most likely mechanism for the 1935 earthquake.
Most of the damage to rural and urban houses, chiefly of mud brick construction, was
enclosed within a narrow zone, with Baleli and Quetta in the north extending in a
southwesterly direction into the Harboi Hills, about 160 km long and 25 km broad.). In
Quetta about 26,000 people were killed, of which a few thousand bodies were left buried

43
in the ruins of the town. Outside Quetta numbers are even more uncertain, particularly in
the Kalat tribal area, where more than 8,000 deaths were recorded. Altogether, the
earthquake could have killed about 35,000 people, but reliable figures are lacking.
It appears that the earthquake was associated with the zone of faults that lies along the
east edge of the Chiltan range and that this zone extends to the south, passing near the
towns of Mastung and Kalat.
4.3.3 The 1945 Makran earthquake
Based on the reported literature (Quittmeyer et al., 1979; Mokhtari et al., 2005;
Ramachandran, 2005; Jain et al., 2005) we find that the event occurred off the Makran
Coast on 28th November 1945 at 21.56 UTC, with an epicentre location about 90 km SSW
of Churi (Balochistan), Pakistan, with coordinates 24.5oN, 63.0
oE, and with Mw 8.0, Ms
7.8 and a seismic moment of 10.2 x 10²⁰ Nm. A tsunami occurred in the region of Kuch at
the southern coast of Makran, Pakistan, reported with wave heights as high as 17 m in
some Makran ports and caused great damage to the entire coastal region. The tsunami had
a height of about 11-15 m in the Kuch, Indian Gujrat. Also, the height of the tsunami in
Mumbai was 2m (Rastogi and Jaswal, 2006). A total of 4000 people are supposed have
died as a result of the earthquake and tsunami. These numbers are, however, mostly based
on non-scientific sources of more anecdotal nature.
Assessment of the historical records of the tsunami in the Indian Ocean, (Dominey-Howes
et al., 2006; Murty and Rafiq, 1991; Murty and Bapat, 1999) shows that essentially there
are main tsunamigenic zones in this ocean, which are Sunda subduction zone in the east,
and Makran subduction zone in the northwest of Indian Ocean. The Makran subduction
zone, with more than 900 km in length, is located off the southern coasts of Iran and
Pakistan in the north western Indian Ocean. In this region the Oman oceanic lithosphere
slip below the Iranian micro plate at the estimated rate of about 19 mm/year (Vernant Ph.
et al., 2004). The last major historical earthquake and tsunami in the Makran subduction
zone occurred on 28 November 1945. Data of historical tsunami in thye Indian Ocean
basin are collected by some researchers including Murty and Rafiq (1991), Murty aqnda
Rafiq (1999), Dominey-Howes et al. (2006), and Rastogi and Jaiswal (2006). According
to these catalogues, the total number of tsunami events in the Makran zones is three;
including two events are seismic origin, and one of unknown origin. Besides above
mentioned three tsunamis in the Makran coast, they have reported that another tsunami
has occurred in this region in 1897.

44
It would have been both interesting and important to model this tsunami numerically, but
there are two problems which complicates this at present, firstly that the source
parameters are poorly constrained, making it difficult to define a reasonable model for the
seabed dislocation, and secondly that the tsunami is poorly mapped, making it difficult to
perform back calculations. Also, the possible existence of a subsequent slide cannot be
excluded. For the Makran 1945 tsunami, a tsunami modelling is also strongly influenced
by large scale depth variations. However, if a 1945 wave height of 12 m can be confirmed
for the Makran coast, it is certainly reasonable to assume that a similar event can occur
again. There are also some unconfirmed and unsubstantiated claims for the generation of
tsunamis during the period 1524 to 1819 in the Arabian Sea.
Figure 4.7.Tectonic map of the Arabian, Indian and Eurasian plates showing the location
of the Makran zone
4.3.4 The 1974 Pattan earthquake (M 6.0)
This relatively modest yet destructive earthquake occurred on December 28, 1974 near
Pattan, and it was followed by many aftershocks. The main shock originated at about 12
km depth and showed an average body wave magnitude of mb 6.0. There is no evidence
that the earthquake was associated with surface ruptures. Individual cracks in relatively
flat ground running for a few tens of meters were found in the epicentral region.
The shaking of Pattan was very violent, particularly in the upper part of the village where
people found it difficult to stand.

45
Local residence reported ‘deafening’ noises associated with the main shock and some of
the largest aftershocks. The shock was felt over an area of 300,000 km2 and it caused
some damage also to the Karakorum Highway along the steep slopes of the Indus gorge.
The main shock of 28 December triggered four SMAC B1-2 accelerographs 139 km away
at Tarbela. On the rock the maximum acceleration recorded was about 1.4% g with a
predominant period of 0.14s. On alluvium acceleration with frequencies of about 10 Hz
reached 3.5% g. At both the base and crest of the earthfill dam of Tarbela, maximum
accelerations did not exceed 1.5% g at frequencies of 5 Hz (Ambraseys et al., 1981). This
earthquake occurred in the remote and mountainous region of northern Pakistan, resulting
in the loss of many lives and damage to property. The focal mechanisms of this and six
other moderate magnitude earthquakes since 1976 show consistent reverse motion on a
plane dipping towards northeast.
4.3.5 The 2005 Muzaffarabad earthquake (M 7.6)
Geographically, the recent earthquake of 8th October 2005 (Mw 7.6) occurred in the
Kashmir region, and the earthquake is already well studied (e.g., Avouac et al., 2006;
Pathier et al., 2007; Gahalaut, 2006). The United States Geological Survey (USGS) and
European-Mediterranean Seismological Centre (EMSC) have reported the epicentre of
this earthquake in the syntaxis, while the Indian Meteorological Department (IMD) has
reported it further west. Aftershocks of the earthquake as reported by Pakistan
Meteorological Department (PMD) and USGS lie NW of the main shock epicentre in the
Indus Kohistan Seismic Zone (IKSZ). The earthquake occurred at the western extremity
of the Himalaya, where the arc joins the Karakorum, Pamir, and Hindukush ranges.
This earthquake occurred on pre-existing active faults, as shown in Fig. 4.8. The newly
deformed area occupies a 90-100 km long northeast trending strip extending from
Balakot, Pakistan, southeast through Azad Kashmir. It cuts across the Hazara syntaxis,
reactivating the Tanda and Muzaffarabad faults. North of Muzaffarabad the surface
rupture coincides approximately with the MBT, on the south-western flank of the
syntaxis. The fault offset was 4 m on average and peaks to 7 m northwest of
Muzaffarabad. The rupture lasted for 25 s and propagated up dip and bi-laterally with a
rupture velocity of about 2 km/s (Philippe et al., 2006). The heavily damaged area north
of Muzaffarabad, Kashmir shows the maximum deformation. There are known active
faults stretching to the northwest and southeast near the epicentre, which reveal some

46
uplift on the northern side and dextral, right-lateral strike-slip activities (Fujiwara et al.,
2006). The known active faults are divided in two fault groups, the Muzaffarabad fault,
northwest of Muzaffarabad and the Tanda fault, southeast of Muzaffarabad (Nakata et al.,
1991).
Figure 4.8.The Muzaffarabad earthquake of October 8, 2005 rupture zone seen in the
context of other large earthquakes on the Himalaya Main Boundary Thrust
(MBT) (after Avouac et al., 2006). Annotation: IKSZ – Indus-Kohistan
Seismic Zone.
Seismically, the most active geological structures of this region are considered to be
capable of generating large events. However, it is not appropriate to equate the IKSZ with
the MBT, because the tectonic histories of these two are quite different. The activity along
the IKSZ is much more intense than along the MBT.
5 Seismotectonic Interpretation
5.1 Seismic provinces and area sources
For the study of earthquake hazard in Pakistan, the country was divided into 19 zones,
including some portions of the neighboring countries of Afghanistan, Tajikistan, Iran and

47
India. The division of the region into these source zones is based on the seismicity, the
fault systems and the stress direction analysis. The division was also based on the data
processing of the whole catalogue regarding the seismicity, depth and the study of
research papers. One of the basic principles for the zonation of a region is that the
seismicity within a single zone remains uniform and homogeneous, even though this
principle clearly is not always fulfilled as judged from the individual catalogues used in
the study. The nineteen seismic zones are all having geometric shapes (polygons) and the
coordinates of their corners are described below along with a Fig. 5.1.
Figure 5.1. Seismic Zones of Pakistan as used in the present study.
5.1.1 Seismic source zones
There are altogether 19 area zones defined for this study, as delineated in the following.

48
Zone 1; Kohistan-Kashmir
This zone includes mostly the Kashmir areas, some parts of the Gilgit region and the
NWFP (North-Western Frontier Province) and some of upper Punjab. The zone has
always been very active as it covers the plate boundary of the Eurasian and the Indian
plate. The northern region of Punjab is included in this zone as it was always affected by
the earthquakes originated from the faults present in the Kashmir region. Some areas of
Himachal Pradesh, India are also included in this zone. Lahore, a densely populated city
of Pakistan and the capital of Punjab, was destructed in 1905 by the devastating
earthquake in Kangra, India, which is also included in this zone. Chilas, Besham and
Gilgit city are other important cities of this zone. The coordinates of this zone are:
31.2o N 75.5
o E
32.1o N 78.0
o E
36.1o N 74.4
o E
35.0o N 72.3
o E
Zone 2; Northern Baluchistan
Although the name given to this region is the Northern Baluchistan Seismic Zone, it also
includes some areas of Punjab. The zone is the region of a large number of earthquakes
with magnitudes more than 4.5 in the PDE catalogue. The historical data from PMD does
not show any significant activity in this zone, however, one must then remember that the
epicenters of the historical catalogue is highly uncertain, and to a large part also reflects
on population density. The coordinates of the corners are:
30.0o N 68.7
o E
28.2o N 69.5
o E
31.1o N 71.4
o E
31.1o N 69.9
o E
Zone 3; Quetta-Sibi
The geological and the seismological features of this zone are almost similar to those of
Zone 2. This zone also contains Quetta which in 1935 was affected by an earthquake of
magnitude 7.6. Almost 30,000 people died during this seismic event and the whole city
perished. Jacobabad is also a city of Baluchistan in this zone.
30.1o N 65.0
o E
27.6o N 68.4
o E
28.2o N 69.5
o E
30.0o N 68.7
o E

49
31.3o N 67.8
o E
Zone 4; Southern Baluchistan
Only four earthquakes are found in this zone in the ISC catalogue having M ≥ 6.0.
Panjgur, and Sonmiani bay of Baluchistan and Larkana of Sindh are some of the
important places in this zone. The Central Brahui range, Siahan range, Kirthur range and
the Central Makran mountain ranges run through this zone.
30.1o N 65.0
o E
27.2o N 63.0
o E
25.0o N 66.7
o E
27.6o N 68.4
o E
Zone 5; Northern Afghanistan-Tajikistan
This zone covers mostly the border area of Pakistan, Afghanistan, Tajikistan and China.
The city of Sost, a very important town on the Karakoram Highway and the Kunjarab pass
are both located in this zone, as well as a small area of the province of China, Xinjiang.
Tashkurgan is a Tajik town in western Xinjiang, China. It is almost on the borders of both
Afghanistan and Tajikistan, and close to the borders of Kyrgyzstan and Kazakhstan.
Badakhshan in Afghanistan is also in this zone.
36.1o N 71.0
o E
36.1o N 76.0
o E
38.0o N 76.0
o E
38.0o N 71.0
o E
Zone 6; Hindu Kush
This zone entirely covers the Afghanistan region. Several earthquakes with their
epicentres in or around the Hindu Kush ranges have affected the Northern areas of
Pakistan. The earthquakes in 1983, 1985 and 1991 in the Hindu Kush had magnitudes 7.4,
7.4 and 6.7, respectively, and it has been reported that more than 300 people died as a
result of these events, in the regions of Peshawar, Chitral, Swat and Malakund (the PMD
database). A few records of large historic earthquakes have also been found in the PMD
data base. Any earthquake in Hindu Kush with magnitude greater or equal to 6 is reported
to be felt (although weakly) also in the southern Punjab.
36.5o N 66.4
o E
35.0o N 66.0
o E
36.1o N 71.0
o E

50
37.0o N 71.0
o E
Zone 7; North Western Afghanistan-Tajikistan Border Region
This zone covers the area just to the south of Dushanbe, the capital of Tajikistan. In
addition to Tajikistan and Afghanistan it also covers some areas of Uzbekistan and
Turkmenistan. Being situated near the Hindu Kush region and a few hundred kilometers
away from Pakistani region, this is the region of large earthquakes according to the ISC
and PDE catalogues. A few records of large earthquakes are found in the PMD historic
database, in this zone.
38.0o N 65.9
o E
36.5o N 66.4
o E
37.0o N 71.0
o E
38.0o N 71.0
o E
Zone 8; Eastern Afghanistan
This zone covers mainly the Afghan territories up to Baghlan in the west, and the border
region with Pakistan, in the south east. Kabul, Kandhar, Nuristan and Mazar-Sharif are
the major cities of Afghanistan covered in this zone. Many active faults are located in this
zone, which have generated significant earthquakes in the past as well as during the recent
few decades. The seismicity increases as we go from south to north in this zone and the
PMD historic database gives information about a few significant earthquakes in this zone,
however according to the PDE catalogue, most of the southern parts of this zone are
inactive.
30.1o N 65.0
o E
31.3o N 67.8
o E
34.75o N 71.2
o E
36.1o N 71.0
o E
35.6o N 68.5
o E
33.1o N 66.1
o E
Zone 9; Makran Coast
Tsunamis have also affected the coast of Pakistan. An active subduction zone exists off
the Makran coast and the 1945 earthquake originated in this region. The magnitude of this
earthquake was 8.2 Ms according to the PMD catalogue and a tsunami was generated by
this huge earthquake which struck the Makran coast. As discussed earlier in this report a
wave height of 12 m was reported during this tsunami.

51
From the PMD historical database, only two considerable events in 1851 and 1864 are
reported in the Gwadar area. The intensities of these earthquakes were VII.
27.2o N 63.0
o E
26.0o N 62.0
o E
23.0o N 62.0
o E
23.0o N 67.9
o E
25.0o N 66.7
o E
Zone 10; Runn of Kuchch
The area under consideration in this zone belongs mostly to India (Runn of Kuch). The
zone contains a reasonable number of earthquakes having M ≥ 4.5 as reported in the PDE
catalogue. In the historical data from PMD, there are two major earthquakes in this zone.
The seismic activity in this area has always affected also Pakistan.
23.0o N 67.9
o E
23.0o N 72.0
o E
24.5o N 70.1
o E
23.7o N 67.5
o E
Zone 11; Sindh-Punjab
This is the largest zone with respect to area, but it has the least seismic activity. It covers
most parts of Punjab and Sindh including the western areas of India. In the south it covers
the coastal areas of Sindh where a few but significant historical earthquakes are found,
however there are generally few earthquakes in this zone.
23.7 o N 67.5
o E
24.5 o N 70.1
o E
31.2 o N 75.2
o E
31.1 o N 71.4
o E
28.2 o N 69.5
o E
27.6 o N 68.4
o E
25.0 o N 66.7
o E
Zone-12; Pamir-Kunlun
This is a rectangular-shaped zone covering only the Chinese territories near the Pakistani
border with China. Kongur Tagh (also referred to as Kongur or Kongur Shan) is the
highest peak of the Kunlun Mountains in China.
36.1o N 76.0
o E
36.1o N 78.0
o E
38.0o N 78.0
o E
38.0o N 76.0
o E

52
Zone 13; Indian Kashmir
The northern areas of Pakistan, Kashmir, Xinjiang of China and Himachal Pradesh of
India are the main areas covered by this zone. It is not a densely populated zone but some
seismic activity is present.
32.1o N 78.0
o E
36.1o N 78.0
o E
36.1o N 74.4
o E
Zone 14; Upper Punjab-NWFP
According to the PDE catalogue this zone seems to be very active, especially parts of
NWFP. One of the important aspects of this zone is that it includes two provincial
capitals: Peshawar and Lahore, the country capital of Islamabad and one densely
populated city of India, Amritsar. Malakund and Mardan are other important places in this
zone. According to the historical PMD database, there is a belt of uniform seismic activity
which exists in this zone. This belt starts near Rawalpindi and ends near Peshawar. In
addition to the geological conditions of the area, it is thought that one of the reasons for
many earthquake reports from this area is that it has remained densely populated since
ancient times.
31.2o N 75.5
o E
35.0o N 72.3
o E
34.7o N 71.2
o E
31.1o N 71.6
o E
Zone 15; Chitral
This is a very small zone with respect to area. Chitral and Drosh of Pakistan and Asad-
abad of Afghanistan are the important cities in this zone.
34.75o N 71.2
o E
35.0o N 72.3
o E
36.1o N 74.4
o E
36.1o N 71.0
o E
Zone 16; Koh e Sulaiman
Some areas of Baluchistan, western Punjab, and most areas of the NWFP are included in
this zone. The seismic activity in this zone is very low as compared to that in the
neighboring zones i.e. Zones-2 and 3 in the south and 15 in the north.
30.0o N 68.7
o E
31.1o N 69.9
o E
31.1o N 71.6
o E

53
34.7o N 71.2
o E
31.3o N 67.8
o E
Zone 17; South West Iran
The Harvard and ISC catalogues contain three earthquakes each having M ≥ 6.0 whereas
the PMD historic database has no significant reports from this zone.
23.0o N 60.0
o E
23.0o N 62.0
o E
26.0o N 62.0
o E
27.2o N 63.0
o E
28.0o N 60.0
o E
Zone 18; Western Baluchistan
The old cities of Zahidan of Iran, Nimruz of Afghanistan and the Chaghi hills of Pakistan
are all included in this zone. The western parts of Baluchistan are noted to be inactive
according to the PMD historic database. The areas of Baluchistan and the border areas
with Iran and Afghanistan contain few large earthquakes, according to the ISC catalogue.
However, the PDE catalogue provides reports on several events with M ≥ 4.5 in this
region.
28.0o N 60.0
o E
27.2o N 63.0
o E
30.1o N 65.0
o E
32.0o N 60.0
o E
Zone 19; Central & Southern Afghanistan
According to the PDE catalogue only a few small earthquakes are found in this area with
magnitudes near 4.5. No earthquake with M ≥ 6.0 is reported. Except a few areas of Iran,
this zone mainly covers the Afghan territories e.g. Lashkargah, Chaghcharan and Negah
are the major cities of Afghanistan. The coordinates of the corners of this zone are as
below:
32.0o N 60.0
o E
30.1o N 65.0
o E
33.1o N 66.1
o E
35.6o N 68.5
o E
35.0o N 66.0
o E
5.2 Zones of high seismic activity in Pakistan
It was observed that most of the large earthquakes occurred in the following regions:
o Hindu Kush region.
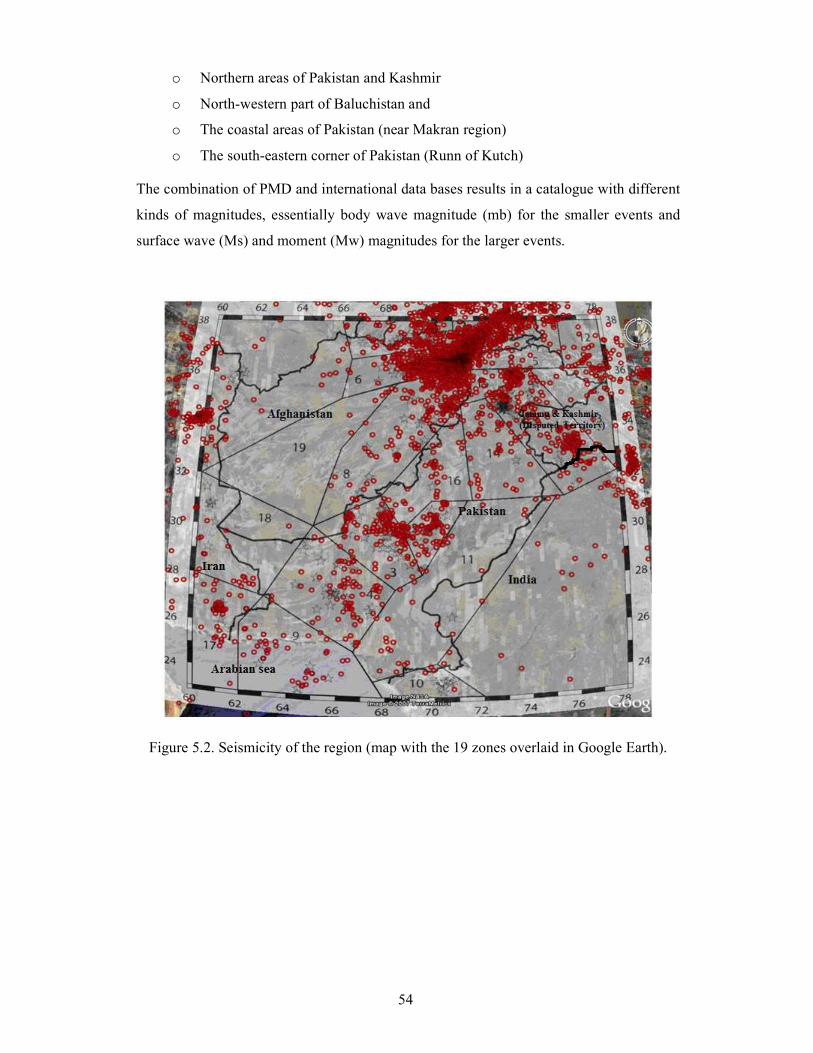
54
o Northern areas of Pakistan and Kashmir
o North-western part of Baluchistan and
o The coastal areas of Pakistan (near Makran region)
o The south-eastern corner of Pakistan (Runn of Kutch)
The combination of PMD and international data bases results in a catalogue with different
kinds of magnitudes, essentially body wave magnitude (mb) for the smaller events and
surface wave (Ms) and moment (Mw) magnitudes for the larger events.
Figure 5.2. Seismicity of the region (map with the 19 zones overlaid in Google Earth).

55
5.3 Magnitude conversions
The magnitude scale used in this study is moment magnitude (Mw) as defined by Hanks
and Kanamori (1977; see also Kanamori, 1977). But the seismological data bases like
PDE, ISC and PMD contain body wave and surface wave magnitudes. If for some events
Mw are available in catalogue these are only for new events. Mainly because the ground-
motion relation used is developed for moment magnitude there is need to convert the
magnitudes of all catalogues into Mw, for which purpose we have developed the
regressions shown in Fig. 5.3 based on magnitudes from the Harvard catalogue.
Regression between Ms & Mwy = 0.6328x + 2.2077
R2 = 0.8456
4
4.5
5
5.5
6
6.5
7
7.5
8
3.5 4.5 5.5 6.5 7.5 8.5
Ms
Mw
(a)
Regression between Mb & Mwy = 1.035x - 0.0703
R2 = 0.721
4
4.5
5
5.5
6
6.5
7
7.5
8
4 4.5 5 5.5 6 6.5 7
Mb
Mw
(b)
Figure 5.3.Conversion of (a) surface-wave magnitude (Ms) and (b) body-wave magnitude
(mb) into moment magnitude (Mw) based on the Harvard catalogue.

56
5.4 Maximum magnitude
After having reviewed the historical data it is clearly seen that the Pakistani area has been
struck by many large earthquakes in the past. For instance Quetta has been hit for four
times (1888, 1893, 1900 and 1935) with VIII to IX intensity earthquakes, and the areas
surrounding Peshawar have been hit thrice in a similarly short time period (1868, 1875
and 1878) with VII to VIII intensity earthquakes. Runn of Kuch was hit twice (1819 and
1845) with an intensity VII and X, Hindu Kush region has generated many earthquakes
with huge intensity and at last the Kashmir areas are hit four times in the recent history
(1828, 1871 and twice in 1885) with intensity IX to X earthquakes. All of these seismic
events within the boundaries of Pakistan or near have been devastating, causing famines
and extensive damage, such as loss of lives.
5.5 Focal depths
The focal depths of earthquakes vary from the shallow to deep in the whole study area, as
shown in Fig. 5-3 for all of the 19 zones defined in this study. It is found that from north
to south the depths and mechanism of earthquakes are different in different seismic zones.
Generally the seismicity of Pakistan is considered to be shallow and intermediate depths.
This great range of focal depths is a particular challenge with respect to the choice of
ground-motion models to be used in the hazard calculations, as discussed in more detail in
Section 6.
0
200
400
600
800
1000
1200
1400
1600
1800
0 40 80 120
160
200
240
280
320
360
400
0
20
40
60
80
100
120
140
0 40 80 120
160
200
240
280
320
360
400
0
50
100
150
200
250
300
350
400
0 40 80 120
160
200
240
280
320
360
400
0
20
40
60
80
100
120
140
0 40 80 120
160
200
240
280
320
360
400
0
200
400
600
800
1000
1200
1400
0 40 80 120
160
200
240
280
320
360
400
0
100
200
300
400
500
600
700
0 40 80 120
160
200
240
280
320
360
400
Zone-1
Zone-5 Zone-4
Zone-3
Zone-6
Zone-2
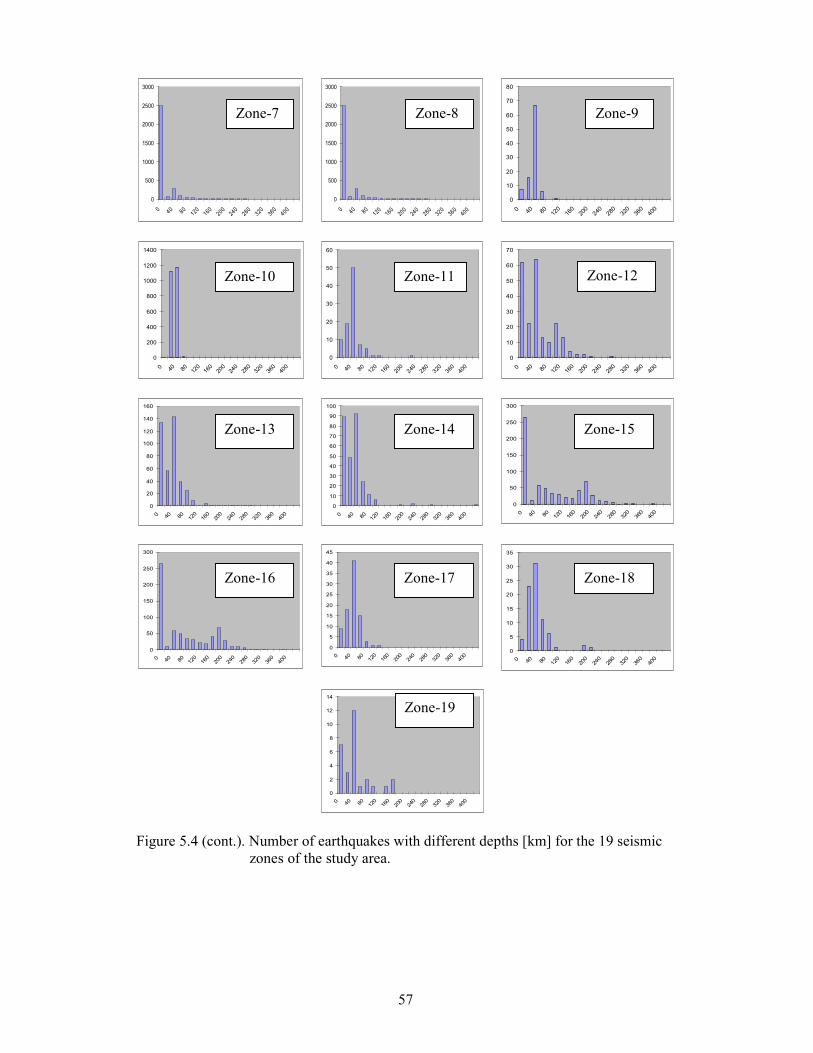
57
0
500
1000
1500
2000
2500
3000
0 40 80120
160200
240280
32036
0400
0
500
1000
1500
2000
2500
3000
0 40 80120 160 20
024
0280
320360
400
0
10
20
30
40
50
60
70
80
0 40 80 120
160
200
240
280
320
360
400
0
200
400
600
800
1000
1200
1400
0 40 80 120
160
200
240
280
320
360
400
0
10
20
30
40
50
60
0 40 80 120
160
200
240
280
320
360
400
0
10
20
30
40
50
60
70
0 40 80 120
160
200
240
280
320
360
400
0
20
40
60
80
100
120
140
160
0 40 80 120
160
200
240
280
320
360
400
0
10
20
30
40
50
60
70
80
90
100
0 40 80 120
160
200
240
280
320
360
400
0
50
100
150
200
250
300
0 40 80 120
160
200
240
280
320
360
400
0
50
100
150
200
250
300
0 40 80 120
160
200
240
280
320
360
400
0
5
10
15
20
25
30
35
40
45
0 40 80 120
160
200
240
280
320
360
400
0
5
10
15
20
25
30
35
0 40 80 120
160
200
240
280
320
360
400
0
2
4
6
8
10
12
14
0 40 80 120
160
200
240
280
320
360
400
Figure 5.4 (cont.). Number of earthquakes with different depths [km] for the 19 seismic
zones of the study area.
Zone-7 Zone-9
Zone-11
Zone-8
Zone-10 Zone-12
Zone-18
Zone-15 Zone-14
Zone-16 Zone-17
Zone-19
Zone-13

58
In Fig. 5.3 all of the 19 zones have been similarly analysed, because it was necessary to
find out the depths of earthquakes occurring in each seismic zone. The histogram analyses
clearly demonstrates the deep seismicity in the Hindu Kush region (Zone 5, 6 and 7), and
to allow for this we have subdivided them with respect to depths at 75 km and 210 km. To
this end the histogram and cumulative distribution in Fig. 5.4 were developed. It is seen
that most of the seismicity (80%) is shallow, i.e. below 40 km, while between 40 and 320
km depths nearly 20% of the events occur. In order to accommodate for this the
Ambraseys et al. (2005) model was modified (see Section 6) to allow for these depths,
and used in the CRISIS for the computation of seismic hazard. This is important since the
Hindu Kush seismicity is contributing significantly to the hazard also for locations outside
of that region.
Admittedly, there are also some other zones with some deep seismicity, notably zones 12,
15 and 16. These zones have, however, lower seismicity and are therefore contributing
less to the hazard, and we have therefore not treated these like for the Hindu Kush zones.
Since shallow seismicity contributes relatively more to the hazard than deeper events the
error made by not allowing for the deeper events in the other zones is moreover on the
conservative side, adding to the hazard.
0
500
1000
1500
2000
2500
3000
3500
4000
4500
0 40 80 120
160
200
240
280
320
360
400
Focal depth (km)
Frequency
0.00 %
20.00 %
40.00 %
60.00 %
80.00 %
100.00 %
120.00 %
Frequency
Cumulative %
Figure 5.5. Distribution of focal depth for the Hindu Kush region (zones 5, 6 and 7).

59
5.6 Earthquake focal mechanisms
Much of the northern and southern parts of Pakistan lie in high seismicity areas with a
history of large and damaging earthquakes, with Fig. 5.6 showing the Harvard CMT
solutions in the Pakistani region between 1977 and 2006.
Figure 5.6.Focal mechanisms from the Harvard CMT solutions between 1977 and 2006.
Inset are aggregated directions of maximum horizontal compression in the
crust as derived from the focal mechanisms following the WSM
recommendations (http://www-wsm.physik.uni-karlsruhe.de).

60
The earthquake focal mechanisms in Fig. 5.6 provide the description of the mode of
faulting of each single earthquake and implicitly thereby also reflects on the orientation of
the causative stress-tensor. Because of this, the focal mechanism solutions are used to
reveal the orientation (not the relative magnitudes) of the stresses in the crust. The inset
rose diagrams show the aggregated direction of σH in each of the small zones indicated.
The σH direction was derived by the application of the principles recommended by the
World Stress Map project (http://www-wsm.physik.uni-karlsruhe.de). Fig. 5.6 should also
be compared with Fig. 5.7, which is from Verma et al. (1980).
Figure 5.7.Orientation of nodal planes and directions of P and T axes for 31 earthquakes
(from Verma et al., 1980).

61
5.6.1 Source zone stress distributions
In the following we discuss the mode of faulting in some of the more important source
zones.
HinduKush and North Afghanistan-Tajikistan border region (Zones 5, 6, 7)
In these zones we find faulting modes ranging from normal faulting in the east to reverse
faulting in the west. It also seems that the σσσσH direction is subject to a 30 degree rotation
from Zone 5 to Zone 6 which is also reflected in a change of faulting mode. Zone 7 is
somewhat more difficult to characterize in a clear way. Fig. 3.3 does not provide any help
since it does not cover the Hindu Kush region.
The observed prevalent directions of crustal compression surely reflects on the fact that in
this corner the major transform faults of Karakoram and Heart and Chaman meet and at
the same time the region is pushed from south by the Indian continent.
Kashmir (Zone-1)
The clear NE-SW compression in this zone (about 45 degrees) reflects directly on the
continental collision as it is also reflected in the major reverse faults that run
perpendicular to the stress direction. It is interesting to compare with Fig. 3.3 where the
same picture is seen, however, one may in the Verma et al (1980) paper recognize how
the mode of faulting is more inhomogeneous as one translates into the Hazara mountains
(western section of Zone 1).
The Baluchistan Arc (Zones 2, 3, 4 and 8)
In perfect agreement with the known regional tectonics we see a 90 degree rotation of the
crustal compression from NE-SW in the Kashmir to NW-SE along the Baluchistan Arc.
To some extent this is also reflected in Fig. 3.3. This area is the western border of the
continent-continent collision and the general stresses are well understood in this tectonic
context.
However, along the Baluchistan Arc we observe another interesting feature: While Zones
2, 4 and 8 exhibit a fairy clear NW-SE compression close to 30 degrees, the crustal

62
compression in Zone 3 seem to deviate from the regional trend and show an N-S
compression.
It is not accidental that Zone 3 covers the area where the Sulaiman mountain range bends
90 degrees to the NE so that the mountain range runs towards Quetta and the Afghan
border. This is also the region of the largest historical earthquakes along the Baluchistan
arc.
The Murray Ridge
The earthquake activity off shore Pakistan is generally low, however, since the great 1945
earthquake which caused a devastating tsunami the tectonics of this region is important. It
is very interesting to recognize that Verma et al. (1980), see Figs. 5.6 and 5.7, could find
four focal mechanisms from the region of which three earthquakes indicate NE-SW
compression.
6 Ground Motion Models
It is well known from many earlier studies that the uncertainties in the wave attenuation
models contribute significantly to the absolute hazard level and to the total uncertainty in
the seismic hazard estimates, (e.g. Akkar and Bommer, 2006). The most important factor
in this sense is the aleatory uncertainty, since in the hazard computations we integrate
directly over the distribution described by the scatter (sigma value) in the ground motion
model. The scatter is therefore nearly as important as the mean with respect to
contribution to the total hazard.
6.1 General review of models
One complicating factor in the present study is that we need spectral attenuation relations,
i.e., spectral relations for a suit of frequencies. Such relations are much fewer than PGA
relations, but even for PGA there are few relations for the Himalaya region.
There are spectral relations available for:
• Transcurrent or strike-slip regimes (e.g., Boore et al., 1997), in particular California
where strong motion data, including in the near field, are in abundance compared to
any other region in the world. Such regions include also important compressional

63
conditions (revealed for example in hidden thrusts), as seen in many of the recent
larger earthquakes (such as 1989 Loma Prieta and 1994 Northridge).
• Subduction zones, including Japan, Mexico and Central America (Crouse, 1991;
Climent et al., 1994; Dahle et al., 1994; Atkinson and Boore, 1997). Related to this
are also relations for back-arc conditions or volcanic chain and shallow crustal
events (Schmidt et al., 1997), where there is an important component of
compression, but under crustal conditions which are quite different from the
Himalayas.
• Extensional regimes, developing global relations based on data from events
revealing normal faulting (Spudich et al., 1997). In terms of stress, this is the quite
different from what is found in Himalaya, which by the way may not mean that the
relations are very different.
• Intraplate regions (e.g., NORSAR and Risk Engineering, 1991; Atkinson and Boore,
1995; Toro et al., 1997), where the conditions are quite different and where
relations, because of insufficient empirical data, moreover have to be based more on
simulations and theoretical models.
• Compressional tectonics, where little as mentioned is available for the Himalayan
region and where the closest we get is the Mediterranean region (Caillot and Bard,
1993; Ambraseys et al., 1996; Ambraseys et al., 2005; Akkar and Bommer, 2007).
Tectonic conditions there are admittedly different, but still reasonably close to be
good candidates.
The relations discussed above have been studied in detail at NORSAR, finding that there
is some times as much difference between relations assumed to cover the same region as
there are differences between tectonically different regions. There is usually no such thing
as a ‘best relation’.
There are few relations available that have been developed specifically for the Himalayan
region or for a region which tectonically is reasonable similar. Notable exceptions here
are the PGA relations by Sharma (1998) and Jain et al. (2000) together with Khademi et
al (2002). These PGA relations are together with the spectral relation of Ambraseys et al.
(1996) and Ambraseys et al. (2005) among the possible relations.

64
A more recent spectral relation by Sharma and Bungum (2006) has been tested earlier.
The testing indicated unreasonable hazard contributions from low and intermediate
magnitude earthquakes, and it is not deemed as adequate in the present context.
6.2 Considered models
The following ground motion models have been considered:
• Ambraseys et al. (2005), spectral. Based on 595 horizontal records from shallow
earthquakes Europe and the Middle East from Mw greater or equal to 5.0 and
distance range 0 to 100 km.
• Sharma (1998), PGA only. Based on 41 hard rock records and 25 soil records with
distances greater than 50 km. No separation between soil and rock site.
• Jain et al. (2000), PGA only. Based on combined SMA and SRR (very simple 3
frequency maximum acceleration measurement device) data. The lowest frequency
is 0.4 seconds. Data from magnitude 5.5 to 7.0 and distance range 0 to 322 km.
• Khademi et al (2002), PGA only, Iran. Based on 160 horizontal records in the
magnitude range 3.4 to 7.4 in the distance range from 0 to 180 km.
• Akkar and Bommer (2006) which provides spectral ground motion prediction based
on 532 strong motion records which largely overlap with the Ambraseys et al.
(2005) dataset. The disadvantage being that this relation deals with spectral ground
velocity rather than with acceleration.
The Khademi relation is based on data from a presumably compressional regime (not
specified regions in Iran), but demonstrate unexpected low attenuation. The predicted
accelerations from this relation are extremely high at all magnitudes and distances,
indicating also a low scaling with increasing magnitude. This calls for caution.
The Sharma (1998), Jain et al. (2000) and Sharma and Bungum (2004) relations have the
advantage of being developed from Himalayan data, but unfortunately only the last one is
a spectral relation. The Jain et al. (2000) relation is largely based on data from SRR
(Seismic Response Recorder) sensors, which are low cost (low precision) sensors, and
sources are not confined to the Himalayan region. The Sharma (1998) relation is largely
replaced by the new Sharma and Bungum (2006) relation, which in tests was
demonstrated to be inadequate.

65
This leaves us essentially with the Ambraseys et al. (2005) relation. This relation is based
on a large and qualitatively secure dataset. Figs. 6.1 and 6.2 shows in this respect a
comparison between the two models for magnitudes 7.0 and 5.0 at different frequencies.
0.1
1
10
1 10 100
Fault distance, km
Ground Motion, m/s2
Amb. 1996 (Ms)
Amb. 2005 (Mw)
M5, Rock, Thrust
Figure 6.1.Comparison of predicted PGA using the empirical ground motion prediction
equations by Ambraseys et al. (1996) and Ambraseys et al. (2005) for
magnitude M 5.0.
0.01
0.1
1
10
1 10 100 1000
Fault Distance, km
Ground motion, m/s2
M5.0
M5.5
M6.0
M6.5
M7.0
M7.5
M8.0
M8.5
Rock, Thrust
Figure 6.2. PGA predictions for a suite of magnitudes for Ambraseys et al. (2005).
The Ambraseys et al. (1996) relation was developed for Ms while the Ambraseys et al.
(2005) was developed for Mw, partly on the same data. Fig. 6.1 compares the two
relations for a magnitude 5 event, while Fig. 6.2 shows predicted PGA for a suite of

66
magnitudes. In Fig. 6.3 the predicted spectral acceleration is plotted for two distances and
magnitudes.
Ambraseys et al. (2005) in particular analyzed the scatter in the data relative to the
predictions, and could state that they along with other authors found an increasing scatter
with decreasing magnitude as also shown in Fig. 6.4, which also shows that a sigma value
around 0.3 is adequate.
0
2
4
6
8
10
12
14
0 0.5 1 1.5 2 2.5 3
Period
Spectral Acc.
R4 M6.0
R32 M6.0
R4 M7.5
R32 M7.5
Figure 6.3.Spectral acceleration predictions for two magnitudes (6.0 and 7.5) and two
distances (4 and 32 km) from Ambraseys et al. (2005).
In conclusion it was decided to use the Ambraseys et al. (2005) relation for ground
motion modelling in the present study. It is furthermore based on shallow data which we
know are the potentially destructive earthquakes. Finally, it is established through a
rigorous quality checking that also lends trust to the results.
The σ-values found by Ambraseys for the various magnitudes and frequencies have been
applied in the hazard computation model.

67
Figure 6.4.Observed dependence of σ on Mw using the binned data for PGA. The fitted
line has the equation: σ = 0.5774 − 0.0561 ⋅ Mw (Ambraseys et al., 2005).
6.2.1 Specifics on the data used by Ambraseys et al. (2005)
The new Ambraseys et al. (2005) ground-motion model was as just explained selected for
the computation of ground motions, based on more data than what was available for
previous similar studies. Also, many of the associated parameters of the strong motion
data contained within the data bank were reassessed, leading to an improvement in the
reliability of the obtained equations.
The magnitude scale used here is moment magnitude (Mw), defined by Hanks and
Kanamori (1977) as:
Mw = (2 / 3) log M0 – 6
where M0 is the seismic moment in Nm. Only earthquakes with available estimates of Mo
were used in this model. The choice of MW means that only strong motion records from
moderate and large earthquakes can be used because Mw is not routinely calculated from
smaller earthquakes. Therefore in order to have a good distribution of records at all
magnitudes, only records from earthquakes with Mw ≥ 5 were chosen.
In the Ambraseys et al. (2005) model, distance to the surface projection of the fault
(Joyner and Boore, 1981) df (also known as fault distance or Joyner-Boore distance) is
used. For earthquakes where the location of the causative fault has not been reported,
mainly earthquakes with Mw ≤ 6, epicentral distance de was used instead. For small

68
earthquakes de and df are similar because of small rupture planes of such earthquakes. The
distance to the surface projection of the fault is used partly because this has been shown to
predict the ground motion quite well and partly because it does not require an estimate of
the depth of the earthquake, unlike distance to the rupture or seismogenic (e.g. Campbell
and Bozorgnia, 2003). It has also been found (Douglas, 2001) that distance to the rupture
does not lead to a reduction in standard deviation associated with ground motion
prediction equations.
Records from distances greater than 100 km were excluded for a number of reasons.
Firstly, this excludes that are likely to be of low engineering significance due to their large
source of site distances. Secondly, it reduces the bias that could be introduced by
including records from distance greater than the distance to the first non triggering station.
It means that the distribution of records with respect to magnitude and distance is
reasonably uniform and reduces the correlation between magnitude and distance. Only
earthquakes with published focal mechanism solutions in terms of the trends and plunges
of the T, B and P axes have been included.
The method of Frohlich and Apperson (1992) was used to classify earthquakes by style of
faulting. In this scheme earthquake with plunges of their T axis greater than 50o are
classified as thrust, those with plunges of their B axis or P axis greater than 60o are
classified as strike-slip or normal and other earthquakes are classified as odd.
In some parts of the world it is a common practice to install strong motion recording
instruments in the ground floors or basements of relatively large buildings. There is
evidence that such buildings can influence the measure ground motion and therefore such
type of data was excluded from analysis. Only records from stations with known site
classification in terms of categories proposed by Boore et al. (1993) have been used in
this model. Therefore four classes were used: very soft soil (L) Vs,30 ≤ 180 m/s, soft soil
(S) Vs,30 ≤ 360 m/s, stiff soil (A) Vs,30 ≤ 750 m/s, and rock (R) Vs,30 > 750 m/s.
For only 89 of the stations (out of 338), contributing 161 records (out of 595) measured
shear wave velocity profiles existed and therefore the rest of the stations have been
classified by using the description of the local site conditions. So the sites with unknown
site classifications had to be removed because they could not be handled by the regression
method.

69
All records from instruments that triggered late and hence missed the start of the motion
were rejected. The correction technique implemented in the Basic strong motion
Accelerogram Processing (BAP) software (Converse and Brady, 1992) was used for the
correction of all time histories used in the preparation of attenuation model. This method
consists of a correction for the instrument response and high-cut filtering, with a cosine
transition from the role-off frequency to cut-off frequency, followed by low-cut
bidirectional Butterworth filtering of the acceleration after padding the time histories with
zeros. The main problem with filtering strong motion records is the selection of
appropriate cut-off frequency for the high-cut and low-cut frequencies. For this a method
based on the estimated signal-to-noise ratio of each record was used. After choosing the
appropriate cut-off frequency for each component (two horizontal and one vertical) of
strong motion record, a single cut-off frequency was chosen for all three components for
consistency. The high frequency filtering was accomplished using the commonly chosen
roll-off frequency of 23 Hz and a cut-off of 100 Hz for records from digital instruments
(e.g. Converse and Brady, 1992). Since most digital instruments have natural frequencies
of about 50 Hz and some of those with lower natural frequencies correct for the
instrument response automatically, the affect of instrument correction is not large and
therefore the requirement to apply a high-cut filter is less than for records from analogue
instruments.
A number of strong motion records used by Ambraseys et. al. (1996) for spectral
acceleration up to 2s does not seem to be high enough equality to yield accurate SA
estimates. Therefore, it is likely that long period (greater than 1s) estimates from the
equations of Ambraseys et al. (1996) may be affected by noise. Only records within the
pass band of the filters (i.e. 1.25 f1 to fn, where f1 is the low cut-off frequency and fn is the
high roll-off frequency) used were included in the regression analysis at period of interest.
For example, a record with low cut-off frequency, f1 of 1 Hz is not used for frequencies
less than 1.25 Hz, i.e. for periods greater than 0.8s.
Consequently, the number of records used for the derivation of equations decreases as the
period increases. In the Ambraseys et al. (2005) model, equations are derived for the
prediction of the larger horizontal component of ground motion, also so that the same set
of records can be used for deriving mutually consistent equations for the estimation of
vertical ground motion. Only records with a vertical component were used. In total, 595

70
strong motion records were selected. These records came from 135 earthquakes and 338
different stations. The relatively strict criteria were adopted and numbers of selected
records (595) were about 50 % more than used by Ambraseys et al. (1996). Although the
total number of recordings from earthquakes with magnitude greater than 4, have been
more than double in the last ten years (Ambraseys et. al., 2005).
The algorithm for the one-stage maximum likelihood method proposed by Joyner and
Boore (1993) was used by Ambraseys to derive the equations because it accounts for the
correlation between ground motions from the same earthquake. The two stage maximum
likelihood method was not used by Ambraseys because it underestimates ‘σ’ for sets with
many singly recorded earthquakes (Spudich et al., 1999). This set was 39 single recorded
earthquakes out of 135.
The dependence of coefficient of variation on magnitude was investigated. The variation
coefficient σ was plotted against Mw (Fig. 6.4). The fitted line coefficients for PGA and
for almost all short periods show that there is a decrease in error with increasing Mw.
Therefore the lack of magnitude dependence in σ for longer periods may be due to this
and not a characteristic of earthquakes.
The evidence was used in Ambraseys model that decay of ground motions is dependent
on the magnitude. Ground motions from large earthquakes decay slower than from small
earthquakes and the decay rate of small earthquakes is faster than the commonly used
(e.g. Douglas, 2003). To investigate the dependence of decays rate on magnitude, records
from ten best recorded earthquakes within the selected set, were used. The PGA data from
each of these earthquakes were fitted individually assuming a functional form:
)log(log 2
3
2
21 adaay +⋅+=
i.e. geometric decay with a far-field decay rate of a2.
Finally, Ambraseys et al. (2005) derived the equations for the estimation of Peak Ground
Acceleration and spectral acceleration for 5 % critical damping ratio and for 61 periods
between 0.05 s (20 Hz) and 2.5 s (0.4 Hz) using Caltech spacing (Brady et al., 1973).

71
6.2.2 Adapting of the selected relation to deep sources
The earthquakes of the Hindu Kush region occur between depths of 0 to 300 km. This
faces us with a problem since the Ambraseys relation is applicable only for shallow
earthquakes (the relation was developed from a dataset where the average focal depth was
10.76 km). We can therefore not apply the Ambraseys relation for the deep earthquakes.
To solve this problem one option is to adapt the Ambraseys model to deep focus
earthquakes.
In Fig. 5.3 the earthquake depth distribution is plotted for all 19 seismic zones, from
which it is seen that around 50% of the total earthquakes occurred within a depth range of
0 to 30 km. These earthquakes are upper crust earthquakes for which the Ambraseys
relation is applicable (the average focal depth for these earthquakes is 15 km which is
relatively close to 10.76 km).
Around 23% of the earthquakes occurred between 30 to 120 km, and the remaining 27%
occurred between the depths ranging from 120 to 300 km. The earthquakes were
categorised into three classes as described above, and the average depth for the deeper
earthquakes were estimated to be 75 and 210 km. The depth distribution mentioned in
Fig. 5.3 was used in the hazard computations.
The problem with deeper earthquakes could be met by applying another attenuation
relation for the deep zones. The disadvantage of such an approach is that other relations
would not necessarily comply with Ambraseys with respect to the spectral ordinates. The
advantage of adapting the Ambraseys relations to deep focus earthquakes is that it brings
homogeneity to the computing procedure. The original Ambraseys relation is in the
following form:
0109876
2
5
2
4321 log)(log FaFaFaSaSaadMaaMaay TNASww ⋅+⋅+⋅+⋅+⋅++⋅⋅++⋅+=
In the third term the distance (Joyner-Boore) is given together with a regression parameter
a5. While a5 is a regression parameter it can also be interpreted as a proxy for focal depth.
In the need of a focal depth proxy we have established a5proxy parameters for 75 and 210
km depth using the following relation:
75)76.10/( 55 ⋅= aa proxy

72
where 75 is the average depth assigned to the intermediate depth earthquakes and 10.76 is
the depth of the earthquakes in the Ambraseys database. For the deep earthquakes the
quantity a5proxy is:
210)76.10/( 55 ⋅= aa proxy
where 210 is the average depth assigned to the deep earthquakes. Using the above a5proxy
values we established attenuation relations that were used for the deeper activity in the
HinduKush region (Zone 5, 6 and 7 in Fig. 5.3)
Figure 6.5.Representation of the seismic activity with respect to depth. The hypocentres
of almost 50% of earthquakes in the Hindu Kush region and the northern areas
of Pakistan lie within a range of 0 to 30 km.

73
6.2.3 Dependence on the scatter of magnitude
Dependency on the coefficient of variation (α) of magnitude was investigated for better
results of PGA. Table 6.1 shows the values of sigma which were calculated from the
relations given by Ambraseys et al. (2005) for different periods 0.05 s, 0.1 s, 0.2 s and 0.5
s, for periods 1.0 s, 1.5 s, 2.0 s and 2.5 s the sigma values did not change and it remain the
same for all magnitudes (4.5 to 8.5). Fig. 6.6 shows that as the magnitude increases the
variation becomes less and the maximum variation observed at lower magnitude.
Therefore, the lack of magnitude dependence in ‘α’ for longer periods may be due to this
and not a characteristic of the earthquakes. ‘α1‘ is the derived coefficient for the
estimation of horizontal peak ground acceleration and response spectral acceleration for
5% damping.
Table 6.1. Derived coefficients for the estimation peak ground acceleration and response
spectral acceleration for 5% damping.
Standard deviation σ
Magnitude
Mw T = 0.05 s T = 0.10 s T = 0.20 s T = 0.50 s
4.5 0.92 0.94 0.90 1.02
5.0 0.84 0.85 0.88 0.93
5.5 0.75 0.77 0.79 0.84
6.0 0.67 0.68 0.69 0.75
6.5 0.59 0.59 0.61 0.65
7.0 0.52 0.51 0.52 0.56
7.5 0.44 0.42 0.42 0.47
8.0 0.36 0.34 0.33 0.38
8.5 0.28 0.25 0.24 0.29
Σ1 0.708 – 0.069 ⋅ Mw 0.747 – 0.075 ⋅ Mw 0.784 – 0.080 ⋅ Mw 0.798 – 0.079 ⋅ Mw
σ = σ1 ⋅ ln(10)
σ1 is fixed for 1.0 s 1.5 s, 2.0 s and 2.5 s. So the standard deviation σ for such frequencies
is given as:
Standard deviation σ
Magnitude
Mw
T = 1.00 s T = 1.50 s T = 2.00 s T = 2.50 s
all 0.70 0.672 0.65 0.66

74
0
0.2
0.4
0.6
0.8
1
1.2
4.3 4.8 5.3 5.8 6.3 6.8 7.3 7.8 8.3 8.8
Moment Magnitude (Mw)
Standard Deviation
0.05s
0.10s
0.20s
0.50s
Figure 6.6.Observed dependence of σ (standard deviation) on Mw using the data for PGA
values.
7 Seismic Analysis of the Study Area
In this section we establish the basic recurrence parameters for each of the seismic zones,
which is the backbone of the source model used in the seismic hazard calculations. Firstly,
however, the question of catalogue completeness should be considered.
7.1 Catalogue completeness
A balanced quantification of seismicity of each zone ideally requires a very good
catalogue. One important point here is catalogue completeness, since this is important for
the calculation of ‘a’ and b-values for each seismic zone. To this end we have looked in
particular at the ISC, PDE and PMD data bases, as shown in Fig. 7.1. We found that the
PDE (USGS) catalogue was reasonably complete within the period 1973 to 2007 down to
a magnitude of at least 4.5, which is below the lower-bound magnitude of 4.8 used in the
hazard calculations. The PMD, PDE and ISC catalogues are appreciably well documented
with historical seismic data.

75
Completeness for PMD-catalogue
M
ag
nit
ud
e
Completeness for ISC-catalogue
Ma
gn
itu
de
Completeness for PDE-catalogue
M
ag
nit
ud
e
Figure 7.1.The comparison of completeness of the three earthquake catalogues (PMD, PDE
and ISC).
7.2 Quantification of earthquake recurrence
The combination of PMD and international data bases results in a catalogue with different
kinds of magnitudes, essentially body wave magnitude (mb) for the smaller events and
surface wave (MS) and moment (MW) magnitudes for the larger events. Since we need to
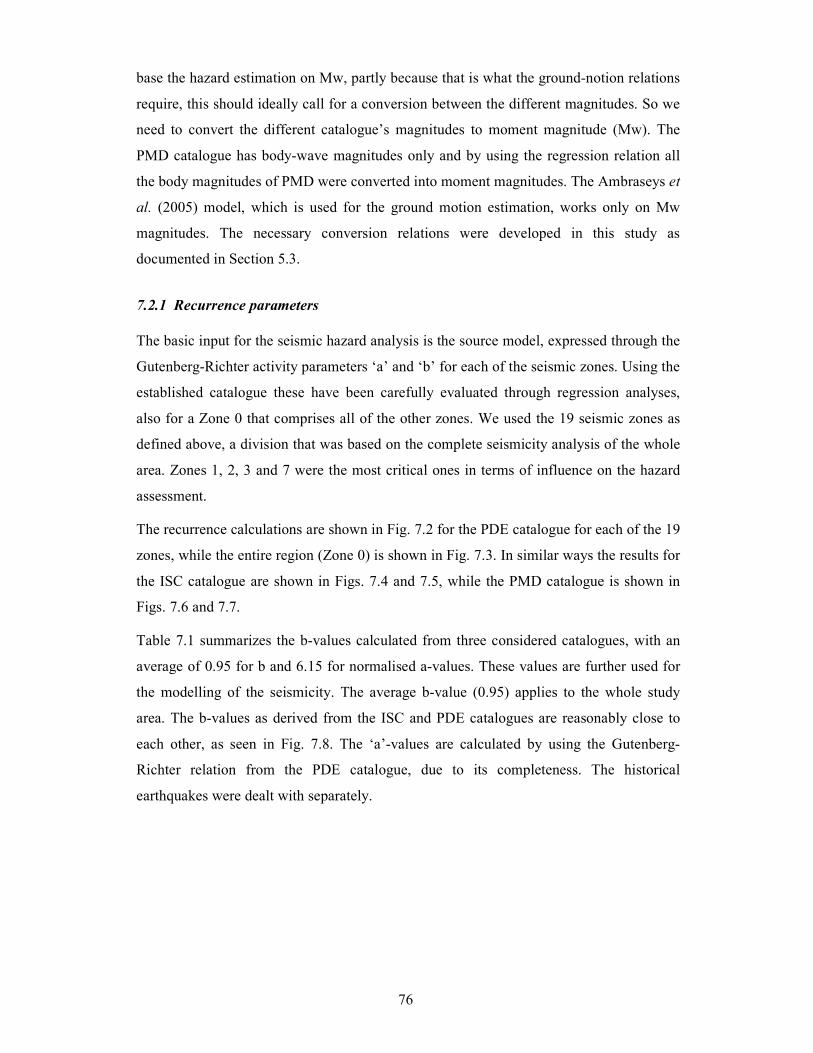
76
base the hazard estimation on Mw, partly because that is what the ground-notion relations
require, this should ideally call for a conversion between the different magnitudes. So we
need to convert the different catalogue’s magnitudes to moment magnitude (Mw). The
PMD catalogue has body-wave magnitudes only and by using the regression relation all
the body magnitudes of PMD were converted into moment magnitudes. The Ambraseys et
al. (2005) model, which is used for the ground motion estimation, works only on Mw
magnitudes. The necessary conversion relations were developed in this study as
documented in Section 5.3.
7.2.1 Recurrence parameters
The basic input for the seismic hazard analysis is the source model, expressed through the
Gutenberg-Richter activity parameters ‘a’ and ‘b’ for each of the seismic zones. Using the
established catalogue these have been carefully evaluated through regression analyses,
also for a Zone 0 that comprises all of the other zones. We used the 19 seismic zones as
defined above, a division that was based on the complete seismicity analysis of the whole
area. Zones 1, 2, 3 and 7 were the most critical ones in terms of influence on the hazard
assessment.
The recurrence calculations are shown in Fig. 7.2 for the PDE catalogue for each of the 19
zones, while the entire region (Zone 0) is shown in Fig. 7.3. In similar ways the results for
the ISC catalogue are shown in Figs. 7.4 and 7.5, while the PMD catalogue is shown in
Figs. 7.6 and 7.7.
Table 7.1 summarizes the b-values calculated from three considered catalogues, with an
average of 0.95 for b and 6.15 for normalised a-values. These values are further used for
the modelling of the seismicity. The average b-value (0.95) applies to the whole study
area. The b-values as derived from the ISC and PDE catalogues are reasonably close to
each other, as seen in Fig. 7.8. The ‘a’-values are calculated by using the Gutenberg-
Richter relation from the PDE catalogue, due to its completeness. The historical
earthquakes were dealt with separately.
77
Figure 7.2. b-values from PDE catalogue for the 19 zones of the study region.
Zone-1 Zone-2
Zone-3 Zone-4
Zone-5 Zone-6

78
Figure 7.2. (Cont). b-values from PDE catalogue for the 19 zones of the study region.
Zone-7 Zone-8
Zone-9 Zone-10
Zone-11 Zone-12

79
Figure 7.2. (Cont). b-values from PDE catalogue for the 19 zones of the study region.
Zone-13 Zone-14
Zone-15 Zone-16
Zone-17 Zone-18

80
Figure 7.3. b-value for the whole PDE catalogue.
Zone-1 Zone-2
Zone-3 Zone-4
Figure 7.4 (cont). b-values from ISC catalogue for the 19 zones of the study region

81
Zone-5 Zone-6
Zone-7 Zone-8
Zone-10 Zone-9
Figure 7.4 (cont). b-values from ISC catalogue for the 19 zones of the study region

82
Zone-11 Zone-12
Zone-13 Zone-14
Zone-15 Zone-16
Figure 7.4 (cont). b-values from ISC catalogue for the 19 zones of the study region

83
Figure 7.4 (cont). b-values from ISC catalogue for the 19 zones of the study region
Figure 7.4 (cont). b-values from ISC catalogue for the 19 zones of the study region
Zone-17 Zone-18
Zone-19
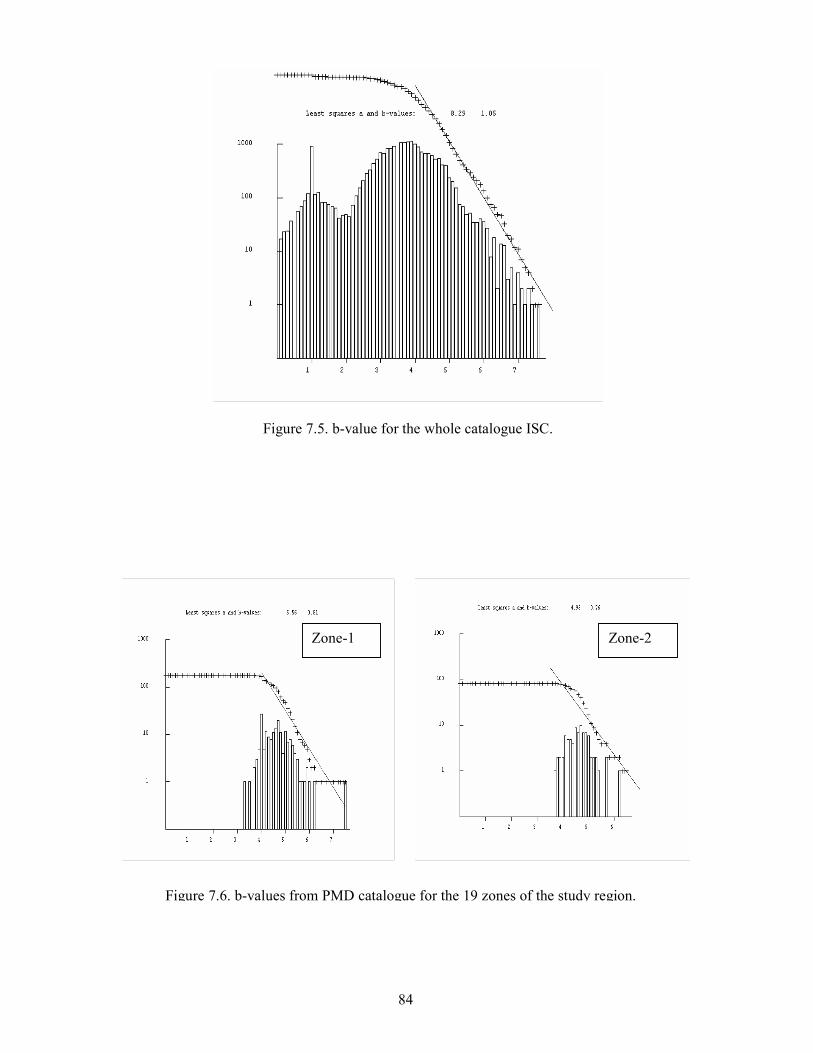
84
Figure 7.5. b-value for the whole catalogue ISC.
Zone-1 Zone-2
Figure 7.6. b-values from PMD catalogue for the 19 zones of the study region.
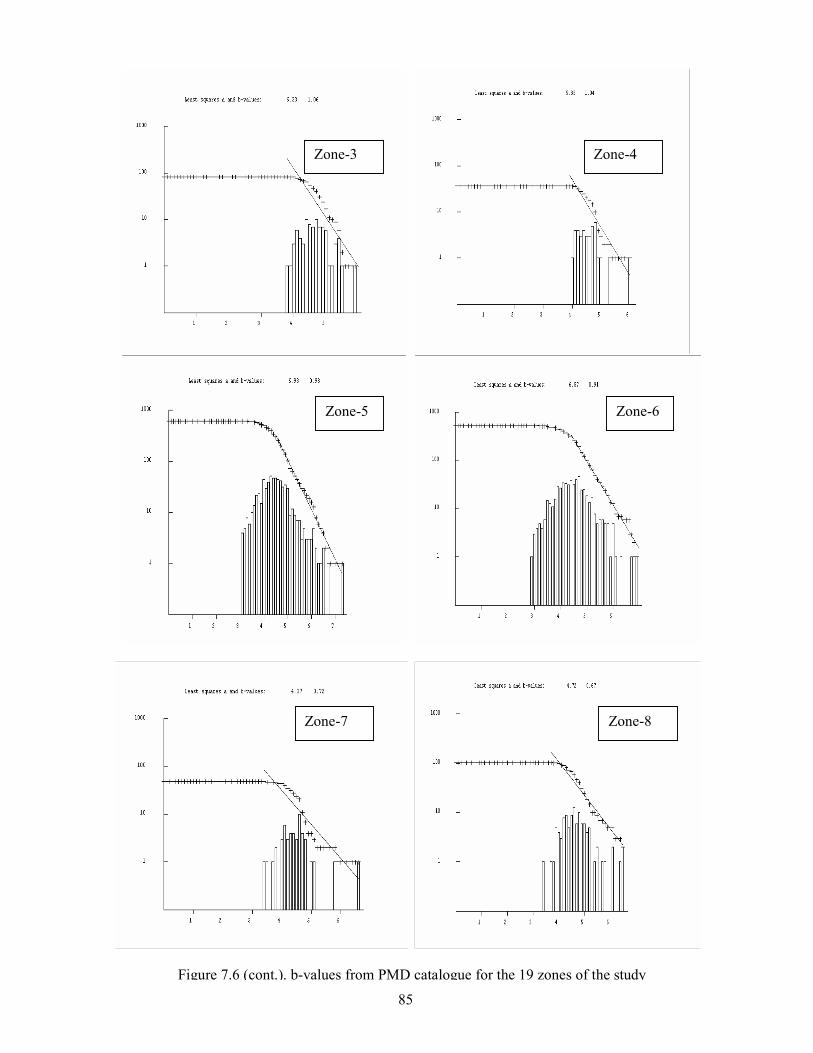
85
Zone-3 Zone-4
Zone-5 Zone-6
Zone-7 Zone-8
Figure 7.6 (cont.). b-values from PMD catalogue for the 19 zones of the study

86
Zone-9 Zone-10
Zone-11 Zone-12
Zone-13 Zone-14
Figure 7.6 (cont.). b-values from PMD catalogue for the 19 zones of the study

87
Figure 7.6 (cont.). b-values from PMD catalogue for the 19 zones of the study region.
Zone-15 Zone-16
Zone-17 Zone-18

88
Figure 7.7. b-value for the whole catalogue PMD.
Table 7.1.Summary of a- and b-values. Average normalized a-value for all zones (Zone 0)
is 6.15 when the b-value is fixed to 0.95. This corresponds to an average return
period of about 1 year for M≥6.5 for the larger area.
Zone b value for ISC b value for
PMD
b value for PDE b value
Average
a-value from PDE with
fixed b-value=0.95
(normalized)
1 0.92 (N=2308) 0.81 (N=181) 0.90 (N=1015) 0.88 6.66 (5.13)
2 0.95 (N=225) 0.76 (N=84) 1.23 (N=106) 0.98 6.07 (4.54)
3 0.78 (N=594) 1.06 (N=470) 1.06 (N=432) 0.97 6.45 (4.92)
4 1.04 (N=193) 1.04 (N=37) 0.92 (N=138) 1.00 6.23 (4.70)
5 1.24 (N=5559) 0.93 (N=627) 1.21 (N=2490) 1.13 7.03 (5.50)
6 0.79 (N=3118) 0.91 (N=545) 0.84 (N=1653) 0.85 7.17 (5.64)
7 0.86 (N=3210) 0.72 (N=49) 0.93 (N=416) 0.84 6.29 (4.76)
8 1.07 (N=738) 0.67 (N=40) 1.25 (N=362) 1.00 6.34 (4.81)
9 0.65 (N=97) 0.62 (N=18) 1.19 (N=69) 0.82 5.86 (4.33)
10 0.82 (N=2298) 0.60 (N=33) 0.92 (N=145) 0.78 6.20 (4.67)
11 0.72 (N=94) 0.53 (N=15) 0.96 (N=39) 0.74 5.62 (4.09)
12 0.82 (N=216) 0.48 (N=7) 1.08 (N=73) 0.79 5.65 (4.12)
13 1.20 (N=418) 0.50 (N=20) 1.31 (N=121) 1.00 5.71 (4.18)
14 1.43 (N=277) 0.73 (N=46) 1.70 (N=96) 1.29 5.74 (4.21)
15 1.14 (N=661) 1.03 (N=127) 1.05 (N=161) 1.07 5.41 (3.88)
16 0.95 (N=156) 0.69 (N=28) 1.04 (N=83) 0.89 5.75 (4.22)
17 0.82 (N=88) 0.95 (N=28) 0.82 (N=56) 0.86 6.00 (4.47)
18 0.68 (N=79) 0.14 (N=3) 1.22 (N=13) 0.95 6.18 (4.65)
19 1.26 (N=29) 0.0 (N=1) 0.0 (N=0) 1.26 4.85 (3.32)
Total average 0.95 6.15 (normalized)
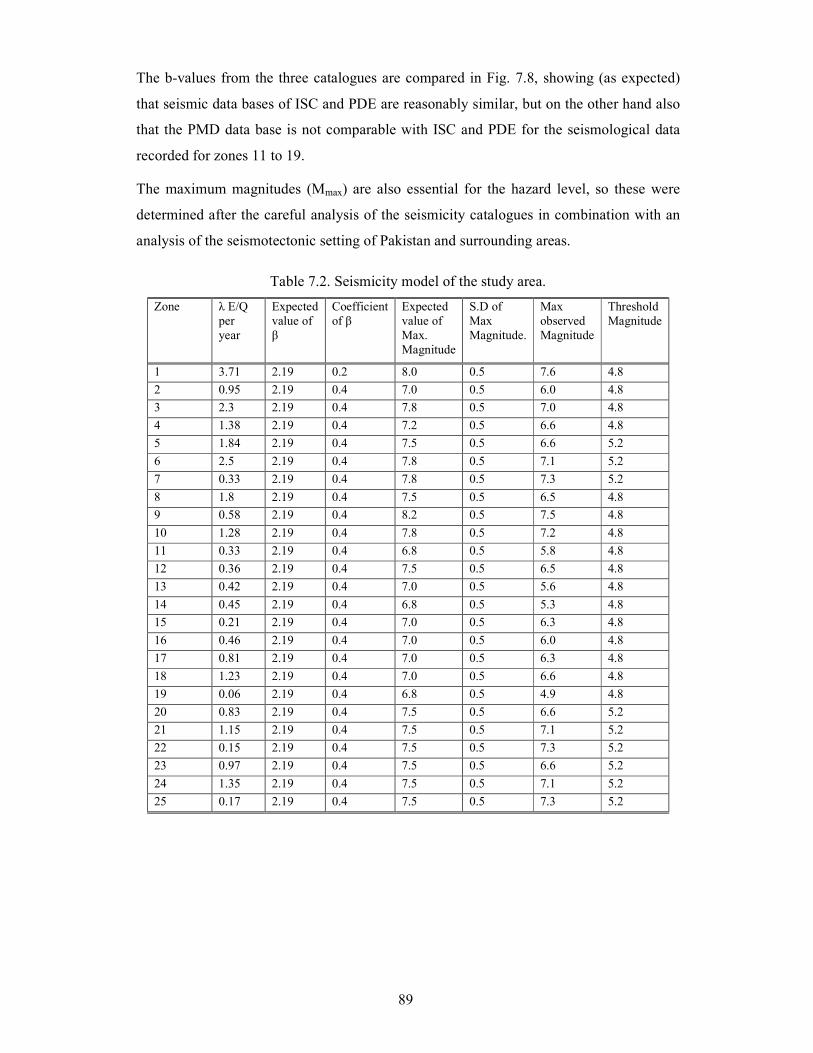
89
The b-values from the three catalogues are compared in Fig. 7.8, showing (as expected)
that seismic data bases of ISC and PDE are reasonably similar, but on the other hand also
that the PMD data base is not comparable with ISC and PDE for the seismological data
recorded for zones 11 to 19.
The maximum magnitudes (Mmax) are also essential for the hazard level, so these were
determined after the careful analysis of the seismicity catalogues in combination with an
analysis of the seismotectonic setting of Pakistan and surrounding areas.
Table 7.2. Seismicity model of the study area.
Zone λ E/Q
per
year
Expected
value of
β
Coefficient
of β
Expected
value of
Max.
Magnitude
S.D of
Max
Magnitude.
Max
observed
Magnitude
Threshold
Magnitude
1 3.71 2.19 0.2 8.0 0.5 7.6 4.8
2 0.95 2.19 0.4 7.0 0.5 6.0 4.8
3 2.3 2.19 0.4 7.8 0.5 7.0 4.8
4 1.38 2.19 0.4 7.2 0.5 6.6 4.8
5 1.84 2.19 0.4 7.5 0.5 6.6 5.2
6 2.5 2.19 0.4 7.8 0.5 7.1 5.2
7 0.33 2.19 0.4 7.8 0.5 7.3 5.2
8 1.8 2.19 0.4 7.5 0.5 6.5 4.8
9 0.58 2.19 0.4 8.2 0.5 7.5 4.8
10 1.28 2.19 0.4 7.8 0.5 7.2 4.8
11 0.33 2.19 0.4 6.8 0.5 5.8 4.8
12 0.36 2.19 0.4 7.5 0.5 6.5 4.8
13 0.42 2.19 0.4 7.0 0.5 5.6 4.8
14 0.45 2.19 0.4 6.8 0.5 5.3 4.8
15 0.21 2.19 0.4 7.0 0.5 6.3 4.8
16 0.46 2.19 0.4 7.0 0.5 6.0 4.8
17 0.81 2.19 0.4 7.0 0.5 6.3 4.8
18 1.23 2.19 0.4 7.0 0.5 6.6 4.8
19 0.06 2.19 0.4 6.8 0.5 4.9 4.8
20 0.83 2.19 0.4 7.5 0.5 6.6 5.2
21 1.15 2.19 0.4 7.5 0.5 7.1 5.2
22 0.15 2.19 0.4 7.5 0.5 7.3 5.2
23 0.97 2.19 0.4 7.5 0.5 6.6 5.2
24 1.35 2.19 0.4 7.5 0.5 7.1 5.2
25 0.17 2.19 0.4 7.5 0.5 7.3 5.2

90
0.4
0.6
0.8
1
1.2
1.4
1.6
1.8
0 5 10 15 20
Zone number
b-values
PMD catalog
PDE catalog
ISC catalog
Figure 7.8. Comparison of b-values from catalogues: ISC, PMD and PDE.
7.2.2 Additional parameters for hazard calculations
Total Number of Spectral Ordinates = 8
Actual Spectral Ordinate = 1
= 0.025s
= 0.1s
= 0.2s
Structural Period of = 0.5s
Actual Spectral Ordinates = 1.0s
= 1.5s
= 2.0s
= 2.5s
Lower Limit of Intensity Level = 0.001
Upper Limit of Intensity Level = 12
Unit for the Calculation of Ground Acceleration = m/s2
Number of Levels of Intensity for which
Seismic Hazard was Computed = 12
Control Parameters
Maximum distance = 300 km
Minimum Triangle Size = 11 km
Minimum Distance / Triangle Size Ratio = 3
Return Period
First Return Period = 50 Years
Second Return Period = 100 Years
Third Return Period = 200 Years
Fourth Return Period = 500 Years
Fifth Return Period = 1000 Years

91
8 Seismic Hazard Results
The methodology for the earthquake hazard estimation as conducted in this study is
outlined in detail in Section 2. The most useful way of presenting the result are in terms of
hazard and intensity maps for different return periods, i.e. for 50, 100 and 500 years,
relating estimated ground motion to annual exceedance probabilities which are the inverse
of return periods in years.
The results are presented in terms of peak ground acceleration (PGA) and equal
probability spectra. All results were computed by using Ambraseys et al. (2005) ground-
motion model, as a basis and CRISIS 2003-CL, ver, 3.0.2 (Ordaz et al., 2003). All ground
motions are computed for hard rocks. For any given site the local soil condition (type and
thickness) will modify the ground motions predicted herein.
Hazard curves in terms of PGA values are shown below in Figs. 8.1 to 8.4, for return
periods of 50, 100 and 500 years, respectively. The hazard due to tsunami in the Arabian
sea, is not related to the ground shaking hazard as shown in the rest of the hazard map
shown in fig 8.4. The contours patterns are consistent with the geological and
seismotectonic characteristics of the study region. The contours passing through the
Kashmir and Northern areas are parallel to the geological structure. Similarly, the
contours in the southern Pakistan are parallel to the Suleiman and Kirthur ranges,
decreasing with distance from these structures. Thus these maps indicate that the Kashmir,
Hazara and Quetta regions have a relatively high seismic potential. A high hazard level in
the north-west, north and north-east and south-west of Pakistan reflects of course the fact
that many significant earthquakes have taken place there earlier, therefore more damaging
earthquakes should also be expected in these regions.
In general, the highest seismic hazard values in Pakistan and surrounding areas are found
near the main plate boundaries.
Table 8.1 shows the peak ground acceleration values in m/s2 for different annual
exceedance levels and for different cities, as shown also graphically in Fig. 8.5. Table 8.2
shows the ground acceleration in m/s2 for different cities of Pakistan on different
frequencies for the annual exceedance rate of 0.002, which in this case is shown
graphically in Fig. 8.6.

92
Table 8.1. Expected Peak Ground Acceleration (PGA) in [m/s2] for the different cities
against annual exceedance probabilities and return periods.
Expected PGA (m/s2) for the cities of:
Annual exceedance
probability
Return period (years)
Islamabad
Peshaw
ar
Quetta
Karachi
Gwadar
Muzaffarabad
Gilgit
Lahore
Multan
Khuzdar
0.02 50 1.50 1.35 1.91 0.54 0.53 2.04 2.93 0.97 0.71 1.34
0.01 100 2.25 2.40 2.90 0.95 0.88 3.23 4.42 1.69 1.22 2.26
0.005 200 3.33 3.19 3.59 1.28 1.15 4.02 5.28 2.24 1.61 2.96
0.002 500 3.65 3.49 3.85 1.42 1.25 4.31 5.55 2.46 1.78 3.24
0.001 1000 3.71 3.55 3.90 1.45 1.28 4.36 5.60 2.51 1.81 3.30
Table 8.2. Expected spectral acceleration [m/s2] for different cities for an annual
exceedance rate of 0.002.
Period
T (s) Islamabad Peshawar Quetta Karachi Gwadar
Muzaffara-
bad
PGA 3.65 3.49 3.85 1.42 1.25 4.31
0.1 5.07 5.59 14.28 2.86 5.75 7.03
0.2 5.57 6.11 15.75 3.54 6.35 8.06
0.5 3.12 3.32 9.17 2.57 3.48 4.75
1.0 1.42 1.45 4.37 1.08 1.37 2.24
1.5 0.84 0.84 5.56 0.64 0.75 1.31
2.0 0.75 0.75 2.20 0.57 0.65 1.15
2.5 0.45 0.45 1.67 0.34 0.43 0.75
All of the derived expected ground acceleration values for the complete grid (one degree
spacing) are listed in the Appendix. For each location eight different values are given (for
PGA and the seven periods as listed in Table 8.2).

93
Figure 8.1. Earthquake hazard for Pakistan in terms of PGA [m/s2] for the 0.02 annual
exceedance probabilities (50 year recurrence).
Figure 8.2. Earthquake hazard for Pakistan in terms of PGA [m/s2] for the 0.01 annual
exceedance probabilities (100 year recurrence).

94
Figure 8.3. Earthquake hazard for Pakistan in terms of PGA [m/s2] for the 0.002 annual
exceedance probabilities (500 year recurrence).
Figure 8.4. Seismic hazard map of Pakistan prepared for PGA for 500 years return period.

95
1.E-03
1.E-02
1.E-01
1.E+00
1.E+01
0.01 0.10 1.00 10.00
Ground motion (m/ss)
Annual Exceedance Rate
Islamabad
Karachi
Peshawar
Lahore
Quetta
Gilgit
Gwadar
Turbat
Muzaffarabad
Multan
Khuzdar
Figure 8.5. PGA hazard curves for different cities of Pakistan (500 years).
0.00
2.00
4.00
6.00
8.00
10.00
12.00
14.00
16.00
0.00 0.50 1.00 1.50 2.00 2.50
Period (seconds)
Spectral acceleration (m/ss)
Islamabad
Gwadar
Muzaffarabad
Gilgit
Karachi
Peshawar
Quetta
Multan
Khuzdar
Lahore
Figure 8.6. Hazard spectrum for different cities of Pakistan.
8.1 Deaggregation results
Probabilistic seismic hazard assessment (PSHA) integrates ground motion contributions
from all the seismic sources. PSHA is the preferred way of computing seismic hazard,
because of the consistent way of uncertainties are carried out through computation.
However, it is sometimes difficult to reveal the relative contribution in the distance-
magnitude space for the computed hazard. Deaggregation of the hazard results has

96
therefore become important for an improved understanding of the results.
Fig. 8.7 shows the deaggregation results for Islamabad, Peshawar, Karachi, Gwadar,
Quetta and Muzaffarabad. The deaggregation is done for ground motion levels that are
close to the 500 years PGA levels. The aim of deaggregation is to visualize the relative
contributions to the hazard in the magnitude-distance space.
The deaggregation results for ground acceleration levels at 3.65 m/s2 for Islamabad, 3.49
m/s2 for Peshawar,1.42 m/s
2 for Karachi, 1.25 m/s
2 for Gwadar, 3.85 m/s
2 for Quetta and
4.31 m/s2 for Muzaffarabad corresponds to the return period of 500 years.
The result in Figs. 8.8 to 8.13 even more clearly exhibits the great importance of near
field earthquakes, for different magnitude levels. It should be kept in mind here that
lower-frequency ground motions from large earthquakes indeed can propagate
damagingly over quite long distances, as often evidenced historically.

97
Figure 8.7. Deaggregation results for different cities at Peak Ground Acceleration.
Exceedance level: 3.65 m/s2 Exceedance
level: 3.49 m/s2
Exceedance level: 3.85 m/s2
Exceedance level: 1.25 m/s2 Exceedance level: 4.31 m/s
2
Exceedance
level: 1.42m/s2

98
15
45
75
10
5
13
5
16
5
19
5
22
5
25
5
28
5
4.8
7.2
0.00E+00
1.00E-04
2.00E-04
3.00E-04
4.00E-04
5.00E-04
6.00E-04
7.00E-04
Distance (km)
Mw
Deaggregation in terms of Probability Density Function
(PDF) for Islamabad
4.8
5.4
6
6.6
7.2
7.8
8.4
Figure 8.8.Probability Density Function (PDF) of Peak Ground Acceleration (PGA) for
ground motion level at 2.27 m/s2 for Islamabad.
15
45
75
10
5
13
5
16
5
19
5
22
5
25
5
28
5
4.8
7.80.00E+00
1.00E-03
2.00E-03
3.00E-03
4.00E-03
5.00E-03
6.00E-03
7.00E-03
Distance (km )
Mw
Deaggregation in terms of Probability Density
Functions (PDF) for Peshawar
4.8
5.4
6
6.6
7.2
7.8
8.4
Figure 8.9. Probability Density Function (PDF) of Peak Ground Acceleration (PGA) for
ground motion level at 2.49 m/s2 for Peshawar.

99
15
45
75
10
5
13
5
16
5
19
5
22
5
25
5
28
5
4.8
7.2
0.00E+00
1.00E-04
2.00E-04
3.00E-04
4.00E-04
5.00E-04
6.00E-04
7.00E-04
8.00E-04
9.00E-04
1.00E-03
Distance (km)
Mw
Deaggregation in terms of Probability Density Functions (PDF)
for Quetta
4.8
5.4
6
6.6
7.2
7.8
8.4
Figure 8.10. Probability Density Function (PDF) of Peak Ground Acceleration (PGA) for
ground motion level at 6.14 m/s2 for Quetta.
15
45
75
105
135
165
195
225
255
285
4.8
7.2
0.00E+00
5.00E-05
1.00E-04
1.50E-04
2.00E-04
2.50E-04
3.00E-04
3.50E-04
Distance (km )
Mw
Deaggregation in terms of Probability Density Functions
(PDF) for Karachi
4.8
5.4
6
6.6
7.2
7.8
8.4
Figure 8.11. Probability Density Function (PDF) of Peak Ground Acceleration (PGA) for
ground motion level at 1.40 m/s2 for Karachi.
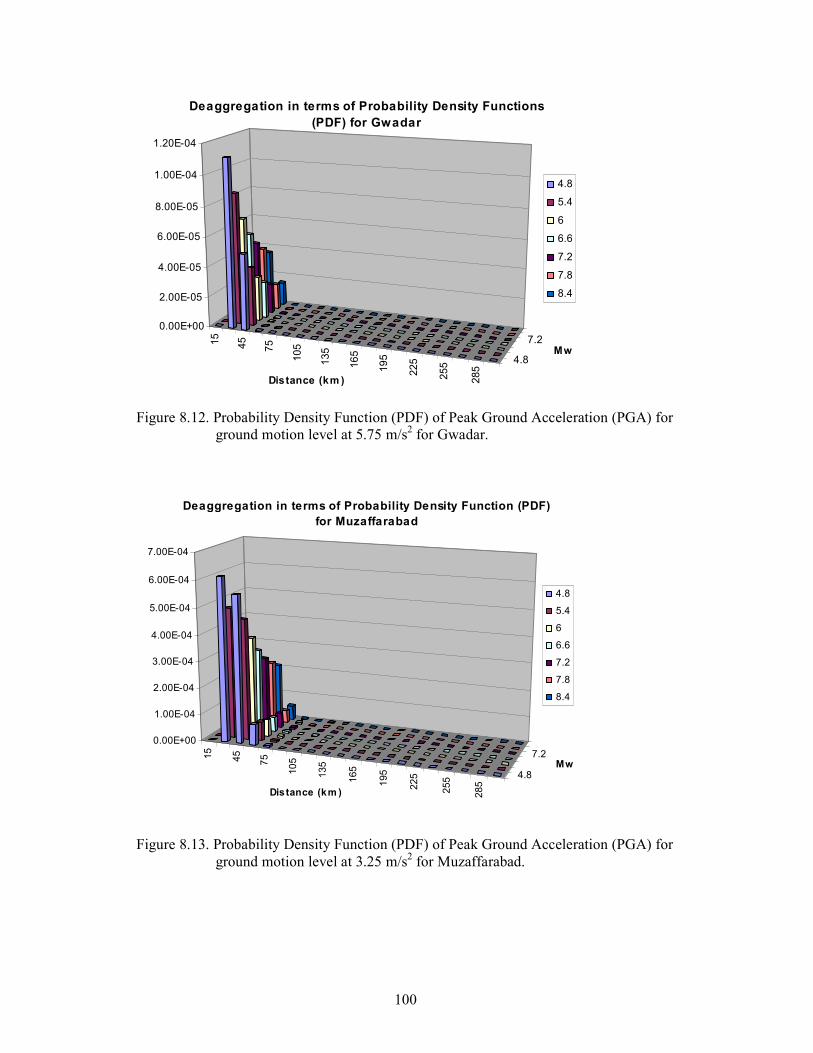
100
15
45
75
105
135
16
5
19
5
225
255
285
4.8
7.2
0.00E+00
2.00E-05
4.00E-05
6.00E-05
8.00E-05
1.00E-04
1.20E-04
Distance (km )
Mw
Deaggregation in terms of Probability Density Functions
(PDF) for Gwadar
4.8
5.4
6
6.6
7.2
7.8
8.4
Figure 8.12. Probability Density Function (PDF) of Peak Ground Acceleration (PGA) for
ground motion level at 5.75 m/s2 for Gwadar.
15
45
75
10
5
135
165
195
225
255
285
4.8
7.2
0.00E+00
1.00E-04
2.00E-04
3.00E-04
4.00E-04
5.00E-04
6.00E-04
7.00E-04
Distance (km )
Mw
Deaggregation in terms of Probability Density Function (PDF)
for Muzaffarabad
4.8
5.4
6
6.6
7.2
7.8
8.4
Figure 8.13. Probability Density Function (PDF) of Peak Ground Acceleration (PGA) for
ground motion level at 3.25 m/s2 for Muzaffarabad.

101
9 References
Akkar, S. and J.J. Bommer (2007): Empirical prediction equations for peak ground
velocity derived from strong motion records from Europe and Middle East. Bull.
Seism. Soc. Am. 97(2), 511–530.
Akkar, S. and J.J. Bommer (2007): Prediction of Elastic Displacement Response Spectra
in Europe and the Middle East. Earthq. Eng. Struct. Dyn., in press.
Ambraseys, N.N., J. Douglas, S.K. Sarma, and P.M. Smit. (2005): Equations for the
Estimation of Strong Ground Motions from Shallow Crustal Earthquakes Using
Data from Europe and the Middle East: Horizontal Peak Ground Acceleration and
Spectral Acceleration. Bulletin of Earthquake Engineering 3, 1–53.
Ambraseys, N.N. and R. Bilham (2003): Earthquakes and Associated deformation in
Northern Baluchistan 1892-2001. Bull. Seism. Soc. Am. 93(4), 1573–1605.
Ambraseys, N.N. and R. Bilham (2000). A note on the Kangra MS = 7.8 earthquake of 4
April 1905. Current Science 79(1), 45–50.
Ambraseys, N.N. and R. Bilham (2003): Earthquakes in Afghanistan. Seism. Res. Lett.
74(2), 107–123.
Ambraseys, N.N. and J. Douglas (2004): Magnitude calibration of north Indian
earthquakes. Geophysical J. Int. 159, 165–206.
Ambraseys N.N., G. Lensen, and M. Moinfar (1975): The Pattan earthquake of 28 Dec.
1974. Reconnaissance report prepared for the Government of Pakistan and
UNESCO.
Ambraseys, N.N., G. Lensen, A. Moinfar, and W. Pennington (1981): The Pattan
(Pakistan) earthquake of 28 December 1974: field observations. Q. J. Eng. Geol.
London 14, 1–16.
Ambraseys, N.N., K.A. Simpson, and J.J. Bommer (1996): Prediction of horizontal
response spectra in Europe. Earth. Eng. Struct. Dyn. 25, 371–400.
Anderson, J.G. and J.E. Luco (1983): Consequences of slip rate constants on earthquake
occurrence relations. Bull. Seism. Soc. Am. 73, 471–496.
Armbruster, J., Seeber, L., and Jacob, K. (1978): The northern termination of the
Himalayan front: active tectonics from micro-earthquakes. J. Geophys. Res. 83,
269–282.
Atkinson, G.M. and D.M. Boore (1995): Ground-motion relations for Eastern North
America. Bull. Seism. Soc. Am. 85, 17–30.
Atkinson, G.M. and D.M. Boore (1997): Some comparisons between recent ground
motion relations. Seism. Res. Lett. 68, 24–40.

102
Avouac, J.-P., F. Ayoub, S. Leprince, O. Konca, and D.V. Helmberger (2006): The 2005,
Mw 7.6 Kashmir earthquake: Sub-pixel correlation of ASTER images and seismic
waveforms analysis. Earth Planet. Sci. Lett. 249, 514–528.
Bhatia S., M.R. Kumar, and H.K. Gupta (1999): A probabilistic seismic hazard map of
India and adjoining regions. Annali di Geofisica 42(6).
Bilham, R. (2001): Slow tilt reversal of the Lesser Himalaya between 1862 and 1992 at
78oN, and bounds to the southeast rupture of the 1905 Kangra earthquake.
Geophys. J. Int. 144, 713–728.
Bilham, R. (2006): Dangerous Tectonics, Fragile Buildings, and Tough Decisions.
Science 311, 1873–1875.
Bilham, R.V. and N.N. Ambraseys (2005): Apparent Himalayan slip deficit from the
summation of seismic moments for Himalayan earthquakes, 1500–2000. Current
Science 88(10), 1658–1663.
Bilham R., V. Gaur, and P. Molnar (2001): Himalayan seismic hazard. Science 293,
1442–1444.
Bollinger, L., J.P. Avouac, R. Calvin, and M.R. Pandey (2004): Stress buildup in the
Himalaya. J. Geophys. Res. 109, B11405, doi:10.1029/2003JB002911.
Bommer, J.J., F. Scherbaum, H. Bungum, F. Cotton, F. Sabetta, and N.A. Abrahamson
(2005): On the use of logic trees for ground-motion prediction equations in
seismic hazard analyses. Bull. Seism. Soc. Am. 95(2), 377–389.
Boore, D.M., W.B. Joyner, and T.E. Fumal (1997): Equations for estimating horizontal
response spectra and peak accelerations from western North American
earthquakes: A summary of recent work. Seism. Res. Lett. 68, 128–153.
Boore, D.M., W.B. Joyner, and T.E. Fumal (1993): Estimation of response spectra and
peak accelerations from western North American earthquakes: an interim report.
Open-File Report 93-509. U.S. Geological Survey, 70 pp.
Brady, A.G., M.D. Trifunac, and D.E. Hudson (1973): Analysis of strong motion
earthquake accelerograms – response spectra. Tech. Rept., Earthquake
Engineering Research Laboratory - California Institute of Technology.
Bungum H. (2006): Numerical modelling of fault activities. Computers and Geosciences
33, 808–820.
Caillot, V. and P.-Y. Bard (1993): Magnitude, distance and site dependent spectra from
Italian accelerometric data. Europ. Earthq. Eng. 1, 37–48.
Campbell, K.W. and Y. Bozorgnia (2003): Updated near source ground motion
(attenuation) relations for the horizontal and vertical components of peak ground

103
acceleration and acceleration response spectra. Bull. Seism. Soc. Am. 93(1), 314–
331.
Chander, R. (1988): Interpretation of observed ground level changes due to 1905 Kangra
earthquake, Northwest Himalaya. Tectonophysics 149, 289–298.
Climent, A., W. Taylor, M. Ciudad Real, W. Strauch, M. Villagran, A. Dahle, and H.
Bungum (1994): Spectral strong motion attenuation in Central America. NORSAR
Technical Report No. 2-17 under the project “Reduction of Natural Disasters in
Central America”. NORSAR, Kjeller, Norway.
Cornell, C.A. (1968): Engineering seismic risk analysis. Bull. Seism. Soc. Am. 58, 1583–
1606.
Converse, A.M. and A.G. Brady (1992): BAP basic strong motion accelerogram
processing software, version 1.0. Open-File Report 92-296A, U.S. Geological
Survey.
Crouse, C.B. (1991): Ground-motion attenuation equations for earthquakes on the
Cascadia subduction zone. Earthquake Spectra 7, 201–236.
Dahle, A., A. Climent, W. Taylor, H. Bungum, P. Santos, M. Ciudad-Real, C. Lindholm,
W. Strauch, and F. Segura (1995): New spectral strong-motion attenuation models
for Central America. Proc., 5th Int. Conf. on Seismic Zonation, Vol. II, pp. 1005–
1012.
Der Kiureghian, A. and A.H.-S. Ang (1977): A fault rupture model for seismic risk
analysis. Bull. Seism. Soc. Am. 67, 1173–1194.
Douglas, J. (2003): A note on the use of strong motion data from small magnitude
earthquakes for empirical ground motion estimation. In Skopje Earthquake 40
years of European Earthquake Engineering (SE-40EEE).
Douglas, J. (2004): Ground estimation equations 1964-2003; a comprehensive worldwide
summary of strong-motion attenuation relationships for peak ground acceleration
and spectral ordinates (1969 to 2000) with corrections and additions. Imperial
College Research Report No. 04-001-SM.
Dominey-Howes D., Cummins P., and Burbidge D., 2006. Historic records of teletsunami
in the Indian Ocean and insight from numerical modelling, Nat. Hazards, DOI
10.1007/s11069-006-9042-9
Gusiakov V.K., 2005. Tsunami generation potential of different tsunamigenic regions in
the Pacific, Marine Geology, 215: 3-9
Farhoudi, G. and D.E. Karig (1977). Makran of Iran and Pakistan as an active arc system.
Geology 5, 664–668.

104
Feldl, N. and R. Bilham (2006): Great Himalayan earthquakes and the Tibetan plateau.
Nature 444, 165–170, doi:10.1038/nature05199.
Frohlich, C. and K.D. Apperson (1992): Earthquake focal mechanisms, moment tensors,
and the consistency of seismic activity near plate boundaries. Tectonics 11(2),
279–296.
Fujiwara, S., M. Tobita, H.P Sato, S. Ozawa, H. Une, M. Korai, H. Nakai, M. Fujiwara,
H. Yarai, T. Nishimura, and F. Hayashi (2006): Satellite data gives snapshot of the
2005 Pakistan earthquake. EOS Transactions AGU 87(7), 73–77.
Gahalaut, V.K. (2006): 2005 Kashmir earthquake: not a Kashmir Himalaya seismic gap
event. Current Science 90(4), 507–508.
Gupta, I.D. (2002): The State of the Art in Seismic Hazard Analysis. ISET Journal of
Earthquake Technology 39(4), 311–346.
Hanks, T.C. and H. Kanamori (1977): A moment magnitude scale. J. Geophys. Res. 84,
2348–2350.
Hough, S.E., R. Bilham, N.N. Ambraseys, and N. Feldl (2005): Revising the 1897
Shillong and 1905 Kangra earthquakes in northern India: Site response, Moho
reflections and a triggered earthquake. Current Science 88(10).
International Conference of Building Officials ICBO (1997):
1997 Uniform Building Code. Vol. 2. Structural Engineering Design Provisions.
Whittier, California, United States.
Jain, S.K., A. Agarwal, and A.R. Hirani (2005): ‘An introduction to tsunami in the Indian
context’. Indian Concrete Journal, January 2005.
Jain, S.K., A. Roshan, J. Arlekar, and P. Basu (2000): Empirical attenuation relationships
for the Himalayan earthquakes based on Indian strong motion data. Proceedings of
the Sixth International Conference on seismic Zonation.
Joyner, W.B. and Boore, D.M. (1993): Methods for regression analysis of strong motion
data. Bull. Seism. Soc. Am. 83(2), 469–487.
Kanamori, H. (1977): The energy release in great earthquakes. J. Geophys. Res. 82(20),
2981–2987.
Khademi M.H. (2002): Attenuation of peak and spectral accelerations in the Persian
Plateau. Proceedings of the Twelfth European Conf. on Earthq. Eng., Paper No.
330.
Kulkarni, R.B., R.R. Young, and K.J. Coppersmith (1984): Assessment of confidence
intervals for results of seismic hazard analysis. Proc. Eighth World Conf. on
Earthq. Eng., San Francisco, Vol. 1, pp. 263-270.

105
Kumar, S. and A.K. Mahajan (2001): Seismotectonics of the Kangra region, Northwest
Himalaya. Tectonophysics 331, 359–371.
Kumar, S., S.G. Wesnouski, T.K. Rockwell, D. Ragona, V.K.Thakur, and G.G. Seitz
(2001): Earthquake recurrence and rupture dynamics of Himalayan Frontal Thrust,
India. Science 294, 2328–2331.
Kumar, S., S.G. Wesnousky, T.K. Rockwell, R.W. Briggs, V.C. Thakur, and R.
Jayangondaperumal, R. (2006): Paleoseismic evidence of great surface rupture
earthquakes along the Indian Himalaya, J. Geophys. Res., 111(B3), B03304,
10.1029/2004JB003309.
Lawrence, R.D., S.H Khan, and T. Tanaka (1992): Chaman Fault, Pakistan-Afghanistan,
in Majore Active Faults of the World, Results of IGCP project 206, R. Buckhan
and P. Hancock (Editor), Annales Tect. 6 (suppl.), 196–223.
McGuire, R.K. (1976): FORTRAN computer programs for seismic risk analysis. U.S.
Geol. Survey Open-File Report No 76-67.
McGuire, R.K. (1978): FRISK: Computer program for seismic risk analysis using faults
as earthquake sources. U.S. Geol. Survey Open File-Report No 78-1007.
Meltzer, A., G. Sarker, B. Beaudoin, L. Seeber, and J. Armbruster (2001): Seismic
characterization of an active metamorphic massif, Nanga Parbat, Pakistan
Himalaya. Geology 29(7), 651–654.
Menke, W.H. and K.H. Jacob (1976): Seismicity Pattern in Pakistan and northwestern
India associated with continental collision. Bull. Seism. Soc. Am. 66(5), 1695–
1711.
Middlemiss, C.S., (1910). The Kangra earthquake of 4 April 1905. Mem. Geol. Surv.
India 38, 405.
Molnar, P. and Taponnier, P. (1975): Cenozoic tectonics of Asia: effect of a continental
collision. Science 189, 419–426.
Mortgat, C.P. and H.C. Shah (1979): A Bayesian model for seismic hazard mapping. Bull.
Seism. Soc. Am. 69, 1237–1251.
Mokhtari, M. and A.M. Farahbod (2005): ‘Tsunami Occurrence in the Makran Region’,
Tsunami Seminar, International Institute of Earthquake Engineering and
Seismology, Tehran. 2005.
Murty T., and Rfiq M., 1991. Atenative list of tsunamis in the marginal seas of the north
Indian Ocean, Nat Hazards, 4: 81-83

106
Nakata, T., H. Tsutsumi, S. H. Khan, and R.D. Lawrence (1991): Active faults of
Pakistan, map sheets and inventories, Spec. Publ. 21, 141 pp., Hiroshima Univ.
Res. Cent. For Reg. Geogr., Hiroshima, Japan.
NORSAR and Risk Engineering, Inc. (1991): Ground motions from earthquakes on the
Norwegian Continental Shelf. Report for Operatørkomite Nord (OKN), Stavanger,
Norway.
Nowroozi, A.A. (1971): Seismo-tectonics of the Persian plateau, Eastern Turkey,
Caucasus, and Hindu-Kush regions. Bull. Seism. Soc. Am. 61(2), 317–341.
Ordaz, M., A. Aguilar, and J. Arboleda (2003): Crisis 2003. Program for computing
seismic Hazard, Ver. 3.01.
Parsons, T., R.S. Yeats, Y. Yagi, and A. Hussain (2006): Static stress change from the 8
October, 2005 M = 7.6 Kashmir earthquake. Geophys. Res. Lett. 33(6), L06304,
10.1029/2005GL025429.
Pathier, E., E.J. Fielding, T.J. Wright, R. Walker, B.E. Parsons, and S. Hensley (2006):
Displacement field and slip distribution of the 2005 Kashmir earthquake from
SAR imagery, Geophys. Res. Lett., 33, L20310, doi:10.1029/2006GL027193.
Quittmeyer, R.C., and K.H. Jacob (1979): Historical and modern seismicity of Pakistan,
Afghanistan, northwestern India, and southeastern Iran. Bull. Seism. Soc. Am.
69(3), 773–823.
Ramachandran, R. (2005): ‘Waves from the past’, Frontline 22(2).
Ramanathan, K.R. and S.M. Mukherji (1938): A Seismological Study of the Baluochistan
(Quetta) Earthquake of May 30, 1935, Geological Survey of India 73 (Part 4):
483–513.
Seeber, L. and J. Armbruster (1981): In Earthquake Prediction- An International Review
(eds. Simpson, D. W. and Richards, P. G,), Maurice Ewing Series, American
Geophys. Union 4, 259–277.
Schmidt, V., A. Dahle, and H. Bungum (1997): Costa Rican spectral strong motion
attenuation. Technical Report from the project 'Reduction Natural Disasters in
Central America, Phase II', NORSAR, Norway.
Sharma, M.L. (1998): Attenuation relationship for estimation of peak ground horizontal
acceleration using data from strong-motion arrays in India, Bull. Seism. Soc. Am.
88(4), 1063–1069.
Sharma, M. and H. Bungum (2006): New strong ground-motion spectral acceleration
relations for the Himalayan region. Proc., 1st European on Conf. Earthq. Eng. and
Seism., Geneva, 3-8 September 2006, Paper No. 1459, 8 pp.

107
Singh, D.D. and K.H. Gupta (1980): Source Dynamics of two Great earthquakes of the
Indian Subcontinent: the Bihar-Nepal Earthquake of January 15, 1934 and The
Quetta earthquake of May 30, 1935. Bull. Seis. Soc. Am. 70(3), 756–773.
Spudich, P., J.B. Fletcher, M. Hellweg, J. Boatwright, C. Sullivan, W.B. Joyner, T.C.
Hanks, D.M. Boore, A. McGarr, L.M. Baker, and A.G. Lindh (1997): SEA96 – A
new predictive relation for earthquake ground motions in extensional tectonic
regimes. Seism. Res. Lett. 68, 190–198.
Spudich, P., Joyner, W.B., Lindh, A.G., Boore, D.M., Margaris., B.M., and J.B. Fletcher
(1999): SEA99 – A revised groung motion prediction relation for use in
extensional tectonic regimes. Bull. Seis. Soc. Am. 89(5), 1156–1170.
Tandon, A.N. and H.N. Srivastava (1975): Focal mechanism of some recent Himalayan
earthquakes and regional plate tectonic. Bull. Seis. Soc. Am. 65, 963–969.
Thakur, V.C., V. Sharma, and A.K. Mundepi (2000): Seismicity of the great 1905 Kangra
earthquake meizoseismal region in Kangra-Chamba, NW Himalaya.
Tectonophysics 326, 289–298
Toro, G.R., N.A. Abrahamson, and J.F. Schneider (1997): Model of strong ground
motions from earthquakes in Central and Eastern North America: Best estimates
and uncertainties. Seism. Res. Lett. 68, 41–57.
Verma, R.K., M. Mukhopadhyay, and A.K. Bhanja (1979): Seismotectonics of the
Hidukush and Baluchistan Arc. Elsevier Scientific Publishing Company,
Amsterdam - Printed in the Netherlands.
Vernant Ph., Nilforoushan F., Hatzfeld D., Abbasi M.R., Vigny C., Masson F., Nankali
H., Martinod J., Ashtiani A., Bayer R., Tavakoli F., and Chery J., Present –Day
Crustal Deformation and Plate Kinematics in the Middle East Constrained by GPS
Measurement in Iran and Northern Oman, Geophys. J. Int., 157:38-398.
Wellman, H.W. (1966). Active wrench faults of Iran, Afghanistan and Pakistan, Geol.
Rundschau 55, 716.
West, W.D. (1934). The Balochistan earthquakes of August 25th and 27
th, 1931, Mem.
Geol. Surv. India 67, 1–82.
Woo, G. (1985): PRISK manual. Principia Mechanica Ltd., London.
Yeats, R., K. Sieh, and C. Allen (1997): The Geology of Earthquakes, Oxford Univ. Press,
New York.
Youngs, R.R. and K. Coppersmith (1985): Implications of fault slip rates and earthquake
recurrence models to probabilistic seismic hazard estimates. Bull. Seism. Soc. Am.
75, 939–964.

108
10 Glossary
Accelerogram - Time history of accelerations.
Active fault - (1) A fault that has had sufficiently recent displacements so that, in the
opinion of the user of the term, further displacements in the foreseeable future are
considered likely. (2) A fault that on the basis of historical, seismological, or
geological evidence has a high probability of producing an earthquake. (3) A fault
that may produce an earthquake within a specified exposure time, given the
assumptions adopted for a specific seismic-risk analysis.
Attenuation - The reduction in amplitude of a wave with time or distance travelled, most
often used for the decrease in amplitude of ground motion with increase in
distance from the source. This attenuation is due to two mechanisms, one is the
distribution of energy over a larger volume as the distance increases, the other is
the loss of energy due to internal damping. The latter effect is frequency
dependent and gives higher attenuation of the high frequency motion.
Attenuation law - A description of the behaviour of a characteristic of earthquake ground
motion as a function of the distance from the source of energy.
b-value - A parameter indicating the relative frequency of earthquakes of different sizes.
It is the slope of a straight line indicating absolute or relative frequency (plotted
logarithmically) versus earthquake magnitude (or meizoseismal intensity), often
shown to be stable over a wide range of magnitudes. The B-value indicates the
slope of the curve of the Gutenberg-Richter recurrence relationship.
Body waves - A seismic wave that travels through the interior of an elastic material.
These waves consist of compressional waves (P-waves) and shear waves (S-
waves). Near the source most of the energy carried is in the form of body waves.
Capable fault - A fault along which it is mechanically feasible for sudden slip to occur.
Evaluation of capability is based on geologic and/or seismic evidence. Capable is
used for faults where it is possible, but not certain, that earthquakes can occur,
often used synonymously with potentially active faults.
Continental plate - A large rigid part of the earth’s crust and upper mantle (lithosphere)
which moves relative to the other continental plates. The speed of movement may
be up to 15-20 cm/year. Scandinavia belongs to the Eurasian continental plate.
Crust - The outer major layer of the earth, separated from the underlying mantle by the
Moho discontinuity, and characterized by P-wave velocity less than 8 km/s. The
thickness of the crust in the Norwegian Continental Shelf in the range 15-25 km.

109
Damping - Loss of energy in wave motion due to transfer into heat by frictional forces. In
engineering often expressed relative to the critical damping, Ccr = 2(KM)1/2, where
K and M are stiffness and mass of the vibrating system, respectively.
Design acceleration - A specification of the ground acceleration at a site in terms of a
single value such as the peak or rms; used for the earthquake-resistant design of a
structure (or as a base for deriving a design spectrum). See Design time history.
Design earthquake - (1) A specification of a seismic ground motion at a site; used for the
earthquake-resistant design of a structure. (2) An earthquake event used the
earthquake-resistant design of structures, which may or may not be equivalent to
the maximum earthquake prescribed for the installation.
Design event (Design seismic event) - A specification of one or more earthquake source
parameters, and of the location of energy release with respect to the site of
interest; used for the earthquake-resistant design of structures.
Design ground motion - Description of ground shaking (e.g., time history, response
spectrum) at a given site used for the earthquake-resistant design of structures; in
modern hazard studies usually the result of contributions from all seismic sources
surrounding the site and not corresponding to any specific design earthquake. See
Design earthquake.
Design spectrum - A set of curves for design purposes that gives acceleration, velocity or
displacement (usually absolute acceleration, relative velocity, and relative
displacement of the vibrating mass) as a function of period of vibration and
damping.
Deterministic hazard assessment - An assessment that specifies single-valued
parameters such as maximum earthquake magnitude or peak ground acceleration
without consideration of likelihood.
Duration - A qualitative or quantitative description of the length of time during which
ground motion at a site shows certain characteristics (perceptibility, violent
shaking, etc.).
Earthquake - A sudden motion or vibration in the earth caused by the abrupt release of
energy in the earth’s lithosphere; shaking of the ground by different types of
waves generated by tectonic movements or volcanic activity. By far the largest
number of destructive earthquakes are caused by tectonic movements. An
earthquake is initiated when the accumulated tectonic stresses at any one point in
the ground become greater than the strength at this point. Release of stress at one
point may increase the stresses nearby, and result in a progressive rupture which

110
may propagate for several hundred kilometres. The rupture will almost invariably
occur along old zones of weakness (faults), and the wave motion may range from
violent at some locations to imperceptible at others.
Earthquake cycle - For a particular fault, fault segment, or region, a period of time that
encompasses an episode of strain accumulation and its subsequent seismic relief.
Epicentre - The point on the earth’s surface that is directly above the focus (hypocenter)
of an earthquake.
Equal hazard spectrum - Specifies ground motion (usually pseudo-relative velocity) as a
function of natural period and damping level for a given probability of occurrence.
The term is sometimes used synonymously with design spectrum or response
spectrum.
Deterministic hazard assessment - An assessment that specifies single-valued
parameters such as maximum earthquake magnitude or peak ground acceleration
without consideration of likelihood.
Fault - A fracture or a zone of fractures along which displacement has occurred parallel
to the fracture. Earthquakes are caused by a sudden rupture along a fault or fault
system; the ruptured area may be up to several thousand square kilometres.
Relative movements across a fault may typically be tens of centimetres for
magnitude 6.0-6.5 earthquakes, several meters for magnitude 7-8 earthquakes.
Fault slip rate - The rate of slip on a fault averaged over a time period involving several
large earthquakes. The term does not necessarily imply fault creep.
Geologic hazard – A geologic process (e.g., land sliding, soil liquefaction, active
faulting) that during an earthquake or other natural events may produce adverse
effects n structures.
Hypocenter - The point where the earthquake started, also called focus. Hypocenter
depths are typically 30 km and less for shallow earthquakes, several hundreds of
kilometres for earthquakes occurring in subduction zones. Most earthquakes in
Fennoscandia originate at depths between 10 and 30 km.
Intensity (of an earthquake) - A qualitative or quantitative measure of the severity of
ground shaking at a given site (e.g., MSK intensity, Modified Mercalli intensity,
Rossi-Forel intensity, Housner Spectral intensity, Arias intensity, peak
acceleration, etc.) based on effects of the earthquake such as how the earthquake
was felt, damage to structures, how people reacted, soil or rock slides, etc.

111
Interplate earthquake - An earthquake along a tectonic late boundary. Most earthquakes
are caused by the relative plate movements along plate margins, i.e., between
plates.
Intraplate earthquake - An earthquake within a tectonic plate. Scandinavia belongs to
the Eurasian plate and is well removed from the nearest plate boundary.
Isoseismal - Contour lines drawn to separate one level of seismic intensity from another.
Logic tree - A formalized decision flow path in which decisions are made sequentially at
a series of nodes, each of which generates branches flowing to subsequent nodes.
Macroseismic - Ground shaking which gives noticeable effects. See Intensity.
Magnitude - A measure of earthquake size at its source. Magnitude was defined by C.
Richter in 1935 as: “The logarithm to the trace amplitude in 0.001 mm on a
standard Wood-Anderson seismometer located 100 km from the epicentre” The
Wood-Anderson instrument measures the responses in the period range near 1 sec.
Other magnitude scales have later been devised based on the responses measured
in other period ranges, and on maximum amplitudes of specific wave forms Some
of the more commonly used magnitude scales are:
1. ML= local magnitude, similar to the original Richter magnitude. Usually
determined from shear wave response in the period range near 1 sec. at
relatively close distances from the epicentre (< 600 km).
2. mb= body wave magnitude is based on the largest amplitude of body waves,
usually the compressional component with period near 1 sec.
3. MS= surface wave magnitude is measured in the period range near 20 sec.
4. MW=moment magnitude is based on the seismic moment and be computed
directly from source parameters or from long period components in the
earthquake record. Symbol M is also used for this magnitude.
Magnitude scales are also based on other earthquake parameters such as felt area,
length of rupture and surface displacement, and area within different intensity
zones.
A large number of empiric relations between magnitude and other earthquake
parameters such as energy, fault movement, fault area, intensity, maximum
acceleration, etc., are available. Such relations may differ considerably from one
seismic region to another.
Maximum credible, expectable, expected, probable - These terms are used to specify
the largest value of a variable, for example, the magnitude of an earthquake that
might reasonable be expected to occur. In the view of the Earthquake Engineering
112
Research Institute, U.S (EERI) Committee on Seismic Risk (cf. Earthquake
Spectra, Vol. 1, pp. 33-40), these are misleading terms and their use is
discouraged.
Maximum credible earthquake - The maximum earthquake that is capable of occurring
in a given area or on a given fault during the current tectonic regime; the largest
earthquake that can be reasonably expected to occur (USGS); the earthquake that
would cause the most severe vibratory ground motion capable of being at the site
under the current known tectonic framework (US Bureau of Reclamation).
“Credibility” is in the eyes of the user of the term.
Maximum earthquake - The maximum earthquake that is thought, in the judgment of the
user, to be appropriate for consideration in the location and design of a specific
facility.
Maximum possible - The largest value possible for a variable. This follows from an
explicit assumption that larger values are not possible, or implicitly from
assumptions that related variables or functions are limited in range. The maximum
possible value may be expressed deterministically or probabilistically.
Maximum probable earthquake - The maximum earthquake that, in the judgment of the
user, is likely to occur in a given area or on a given fault during a specific time
period in the future.
Mean (average) recurrence interval - The mean (average) time between earthquakes or
faulting events with specific characteristics (e.g., magnitude ε5) in a specified
region or in a specific fault zone.
Mean (average) return period - The mean (average) time between occurrences of
ground motion with specified characteristics (e.g., peak horizontal acceleration
>0.1 g) at a site. Equal to the inverse of the annual probability of exceedance.
Moho - Mohorovicic discontinuity, a sharp discontinuity in seismic velocities separating
the earth’s crust from the underlying mantle, also called the crust-mantle
boundary. P wave speeds are typically 6.7-7.2 km/s in the lower crust and 7.6-8.6
km/s at the top of the upper mantle.
Neotectonics - (1) The study of post-Miocene structures and structural history of the
earth’s crust. (2) The study of recent deformation of the crust, generally Neogene
(post-Oligocene). (3) Tectonic processes now active, taken over the geologic time
span during which they have been acting in the presently observed sense, and the
resulting structures.

113
P wave - A seismic body wave with particle motion in the direction of propagation, also
called compressional wave even though the motion alternates between extension
and compressions.
Potentially active fault - A term used by different people in different ways, but
sometimes referring to a fault that has had displacements on it within the late
Quaternary period.
Pseudo acceleration (PSA) - See Response spectrum.
Pseudo velocity (PSV) - See Response spectrum.
Response spectrum - Describe the maximum response of single-degree-of-freedom
systems (linear oscillator) to given ground motions (e.g., an earthquake
accelerogram) as a function of the period and the damping of the system. The
responses may be pseudo acceleration, pseudo velocity or relative displacement.
Pseudo acceleration and pseudo velocity values may be expressed in an
approximate way from the relative displacement through the relation: where
PSA/ω2 = (PSV)/ω =RD is pseudo acceleration, PSV is pseudo velocity and RD
relative displacement, respectively, and ω is circular frequency. By using the
pseudo values, all three responses can be plotted together in a logarithmic,
tripartite nomogram.
Return period - Same as recurrence interval, average time period between earthquakes of
a given size in a particular region, cycle time.
S wave - A seismic body wave with particle motion perpendicular to the direction of
propagation, also called shear wave. The passage of an S-wave involves a pure
shear of the medium.
Secondary effects - Nontectonic surface processes that are directly related to earthquake
shaking or to tsunamis.
Seismic activity rate - The mean number per unit time of earthquakes with specific
characteristics (e.g., magnitude ε5) originating on a selected fault or in a selected
area.
Seismic design load effects - The actions (axial forces, shears, or bending moments) and
deformations induced in a structural system due to a specified representation (time
history, response spectrum, or base shear) of seismic design motion.
Seismic design loading - The prescribed representation (time history, response spectrum,
or equivalent static base shear) of seismic ground motion to be used for the design
of a structure.

114
Seismic event - The abrupt release of energy in the earth’s lithosphere, causing an
earthquake.
Seismic hazard - Any physical phenomenon or effect (e.g., ground shaking, ground
failure, landsliding, liquefaction) associated with an earthquake that may produce
adverse effects on human activities, representing the earthquake’s potential
danger. Specifically, the probability of occurrence over a given time period in a
given location of an earthquake with a given level of severity. Seismic exposure
may be used synonymously with seismic hazard.
Seismic moment - The area of a fault rupture multiplied by the average slip over the
rupture area and multiplied by the shear modulus (rigidity) of the affected rocks.
Seismic moment can be determined directly from the long period asymptote of
path corrected far field displacement spectra. Dimension dyne-cm or N-m.
Seismic moment rate - The long term rate at which seismic moment is being generated.
Seismic risk - The probability that social or economic consequences of earthquakes will
equal or exceed specified values at a site, at several sites, or in an area, during a
specified exposure time; the likelihood of human and property loss that can result
from the hazards of an earthquake. Often expressed as hazard times vulnerability.
Seismic zone - A generally large area within which seismic design requirements for
structures are constant. Some times used synonymously with Seismogenic zone.
Seismic zoning (zonation) - The process of determining seismic hazard at many sites for
the purpose of delineating seismic zones. Some times used synonymously with
Seismotectonic zoning.
Seismicity - The occurrence of earthquakes in space and time.
Seismogenic structure - A geologic structure that is capable of producing an earthquake.
Seismogenic zone (province) - A planar representation of a three-dimensional domain in
the earth’s lithosphere in which earthquakes are inferred to be of similar tectonic
origin; may also represent a fault. See Seismotectonic zone.
Seismotectonic zone (province) - A seismogenic zone in which the tectonic processes
causing earthquakes have been reasonably well identified; usually these zones are
fault zones. In seismic hazard analyses often used to describe a region (area)
within which the active geologic and seismic processes are considered to be
relatively uniform.
Seismotectonic - The study of the tectonic component represented by seismic activity a
subfield of active tectonics concentrating on the seismicity, both instrumental and
historical, and dealing with geological and other geophysical aspects of seismicity.

115
Strain - Change in the shape or volume of a body as a result of stress.
Stress - Force per unit area.
Stress drop - The sudden reduction in stress across the fault plane during rupture.
Intraplate earthquakes have in general higher stress drop than interpolate
earthquakes. Typical values are 1-10 MPa (10-100 bars).
Surface waves - Seismic waves travelling along the surface of the earth or along layers in
the earth’s crust, with a speed less than that of S waves. The two most common
types are Raleigh waves and Love waves.
Tectonics - A branch of geology dealing with the broad architecture of the outer part of
the earth, that is, the regional assembling of structural or deformational features, a
study of their mutual relations, origin, and historical evolution.
Vulnerability - (1) The degree of loss to a given element at risk, or set of such elements,
resulting from an earthquake of a given magnitude or intensity, usually expressed
on a scale from 0 (no loss) to 10 (total loss). (2) Degree of damage caused by
various levels of loading. The vulnerability may be calculated in a probabilistic or
deterministic way for a single structure or groups of structures.

116
11 Appendix
Expected Ground Acceleration in [m/s2]for different return periods and locations. For
each location eight values are given, for PGA and for periods of 0.025, 0.1, 0.2, 0.5, 1.0,
1.5, 2.0 and 2.5 s.
Long (E) Lat (N) 50 Years 100 Years 200 Years 500 Years 1000 Years
60 23 0.25 0.42 0.69 1.27 1.97
60 23 0.52 0.88 1.46 2.78 4.4
60 23 0.68 1.12 1.79 3.21 4.92
60 23 0.39 0.62 0.97 1.67 2.48
60 23 0.12 0.2 0.32 0.57 0.85
60 23 0.06 0.11 0.17 0.3 0.45
60 23 0.05 0.09 0.14 0.25 0.37
60 23 0.04 0.06 0.09 0.16 0.25
61 23 0.42 0.69 1.11 2 2.92
61 23 0.87 1.46 2.42 4.45 6.59
61 23 1.1 1.79 2.82 4.98 7.12
61 23 0.59 0.96 1.47 2.53 3.69
61 23 0.18 0.3 0.49 0.87 1.3
61 23 0.09 0.16 0.25 0.45 0.68
61 23 0.08 0.13 0.21 0.38 0.58
61 23 0.05 0.09 0.14 0.25 0.39
62 23 0.35 0.59 0.96 1.73 2.6
62 23 0.72 1.23 2.04 3.76 5.76
62 23 0.95 1.54 2.45 4.32 6.36
62 23 0.53 0.86 1.34 2.36 3.48
62 23 0.17 0.29 0.47 0.88 1.38
62 23 0.09 0.15 0.25 0.48 0.76
62 23 0.07 0.13 0.21 0.41 0.66
62 23 0.05 0.08 0.14 0.27 0.43
63 23 0.28 0.47 0.78 1.43 2.23
63 23 0.56 0.97 1.59 2.99 4.71
63 23 0.76 1.24 2.01 3.58 5.46
63 23 0.45 0.74 1.19 2.16 3.27
63 23 0.15 0.26 0.46 0.91 1.49
63 23 0.08 0.15 0.25 0.52 0.88
63 23 0.07 0.12 0.22 0.46 0.77
63 23 0.05 0.08 0.14 0.28 0.49
64 23 0.28 0.48 0.79 1.44 2.22
64 23 0.56 0.98 1.61 2.99 4.67
64 23 0.75 1.25 2.04 3.6 5.44
64 23 0.44 0.75 1.22 2.21 3.3
64 23 0.15 0.27 0.47 0.96 1.57
64 23 0.08 0.15 0.26 0.55 0.94
64 23 0.07 0.13 0.23 0.49 0.83
64 23 0.04 0.08 0.14 0.3 0.52
65 23 0.28 0.48 0.8 1.45 2.24
65 23 0.56 0.98 1.61 3.01 4.71
65 23 0.74 1.26 2.05 3.61 5.47
65 23 0.44 0.75 1.22 2.23 3.34
65 23 0.14 0.27 0.48 0.97 1.59
65 23 0.08 0.15 0.27 0.56 0.95
65 23 0.06 0.12 0.23 0.5 0.85
65 23 0.04 0.08 0.15 0.31 0.52

117
Long (E) Lat (N) 50 Years 100 Years 200 Years 500 Years 1000 Years
66 23 0.29 0.5 0.81 1.45 2.24
66 23 0.59 1 1.63 3.01 4.71
66 23 0.79 1.29 2.07 3.62 5.47
66 23 0.48 0.79 1.26 2.24 3.34
66 23 0.17 0.29 0.51 0.99 1.6
66 23 0.09 0.17 0.29 0.58 0.96
66 23 0.08 0.14 0.25 0.52 0.85
66 23 0.05 0.09 0.16 0.31 0.53
67 23 0.37 0.57 0.88 1.51 2.25
67 23 0.72 1.14 1.75 3.08 4.71
67 23 0.98 1.49 2.26 3.76 5.5
67 23 0.61 0.97 1.44 2.41 3.48
67 23 0.22 0.38 0.63 1.16 1.79
67 23 0.12 0.22 0.37 0.68 1.08
67 23 0.11 0.19 0.32 0.61 0.97
67 23 0.07 0.12 0.2 0.38 0.6
68 23 1.05 1.7 2.64 4.45 6.04
68 23 2.25 3.69 5.82 9.63 14.11
68 23 2.65 4.23 6.41 10.63 15.59
68 23 1.42 2.29 3.52 6.09 8.95
68 23 0.49 0.83 1.36 2.6 4.24
68 23 0.25 0.44 0.75 1.48 2.48
68 23 0.21 0.37 0.64 1.27 2.15
68 23 0.14 0.25 0.43 0.89 1.61
69 23 1.18 1.85 2.77 4.55 6.1
69 23 2.52 3.97 6.01 9.73 14
69 23 2.99 4.62 6.75 10.93 15.74
69 23 1.65 2.56 3.85 6.47 9.43
69 23 0.59 0.99 1.6 3 4.8
69 23 0.31 0.53 0.9 1.73 2.86
69 23 0.26 0.46 0.76 1.49 2.49
69 23 0.18 0.31 0.52 1.07 1.89
70 23 1.18 1.85 2.76 4.54 6.09
70 23 2.52 3.97 6 9.7 13.95
70 23 2.99 4.62 6.75 10.92 15.7
70 23 1.65 2.57 3.85 6.46 9.42
70 23 0.59 0.99 1.6 3 4.8
70 23 0.31 0.54 0.9 1.73 2.87
70 23 0.26 0.46 0.76 1.49 2.49
70 23 0.18 0.31 0.53 1.07 1.89
71 23 1.15 1.83 2.76 4.56 6.11
71 23 2.47 3.95 6.03 9.78 14.11
71 23 2.9 4.56 6.73 10.96 15.85
71 23 1.54 2.46 3.74 6.38 9.35
71 23 0.52 0.89 1.46 2.81 4.58
71 23 0.27 0.47 0.8 1.59 2.7
71 23 0.22 0.4 0.68 1.36 2.33
71 23 0.15 0.27 0.47 0.98 1.79
72 23 0.43 0.71 1.12 1.98 2.9
72 23 0.89 1.45 2.35 4.23 6.28
72 23 1.14 1.83 2.83 4.91 7.08
72 23 0.66 1.07 1.63 2.8 4.12
72 23 0.22 0.39 0.64 1.19 1.86
72 23 0.12 0.21 0.36 0.68 1.08
72 23 0.1 0.18 0.31 0.59 0.94
72 23 0.07 0.12 0.2 0.38 0.62
73 23 0.1 0.15 0.23 0.39 0.51

118
Long (E) Lat (N) 50 Years 100 Years 200 Years 500 Years 1000 Years
73 23 0.19 0.29 0.44 0.69 0.96
73 23 0.27 0.43 0.63 1.01 1.32
73 23 0.18 0.28 0.45 0.74 1.04
73 23 0.05 0.1 0.17 0.34 0.52
73 23 0.03 0.06 0.1 0.21 0.32
73 23 0.03 0.05 0.09 0.19 0.29
73 23 0.02 0.03 0.06 0.11 0.17
60 24 0.42 0.69 1.1 2 2.92
60 24 0.87 1.46 2.41 4.46 6.62
60 24 1.11 1.79 2.81 4.98 7.13
60 24 0.6 0.96 1.46 2.51 3.67
60 24 0.19 0.31 0.48 0.85 1.25
60 24 0.1 0.16 0.25 0.44 0.65
60 24 0.08 0.13 0.21 0.36 0.54
60 24 0.05 0.09 0.14 0.24 0.37
61 24 0.68 1.11 1.73 2.92 4.2
61 24 1.45 2.41 3.83 6.6 9.51
61 24 1.77 2.81 4.33 7.12 10.14
61 24 0.94 1.45 2.23 3.68 5.34
61 24 0.28 0.47 0.73 1.27 1.89
61 24 0.14 0.23 0.37 0.66 1
61 24 0.12 0.19 0.31 0.55 0.84
61 24 0.08 0.13 0.21 0.37 0.57
62 24 0.57 0.95 1.49 2.6 3.76
62 24 1.2 2.02 3.23 5.75 8.27
62 24 1.5 2.42 3.74 6.35 9.1
62 24 0.82 1.3 2.02 3.44 5.12
62 24 0.26 0.44 0.72 1.32 2.07
62 24 0.14 0.23 0.38 0.72 1.16
62 24 0.11 0.19 0.32 0.61 1
62 24 0.08 0.13 0.21 0.41 0.67
63 24 0.45 0.75 1.22 2.21 3.26
63 24 0.93 1.55 2.55 4.69 6.88
63 24 1.19 1.95 3.06 5.43 7.9
63 24 0.68 1.12 1.78 3.17 4.83
63 24 0.23 0.41 0.69 1.38 2.31
63 24 0.12 0.22 0.39 0.79 1.36
63 24 0.1 0.19 0.33 0.69 1.2
63 24 0.07 0.12 0.21 0.45 0.8
64 24 0.46 0.77 1.23 2.24 3.31
64 24 0.94 1.57 2.58 4.72 6.97
64 24 1.19 1.98 3.1 5.47 8
64 24 0.69 1.14 1.84 3.26 4.97
64 24 0.23 0.42 0.73 1.46 2.43
64 24 0.13 0.23 0.41 0.85 1.45
64 24 0.11 0.2 0.36 0.75 1.28
64 24 0.07 0.13 0.23 0.48 0.84
65 24 0.45 0.76 1.22 2.22 3.29
65 24 0.93 1.56 2.56 4.69 6.94
65 24 1.18 1.96 3.08 5.44 7.96
65 24 0.67 1.13 1.81 3.23 4.93
65 24 0.23 0.41 0.71 1.43 2.4
65 24 0.12 0.22 0.4 0.83 1.42
65 24 0.1 0.19 0.35 0.73 1.26
65 24 0.07 0.12 0.22 0.47 0.83
66 24 0.45 0.75 1.21 2.2 3.22
66 24 0.93 1.55 2.54 4.65 6.79
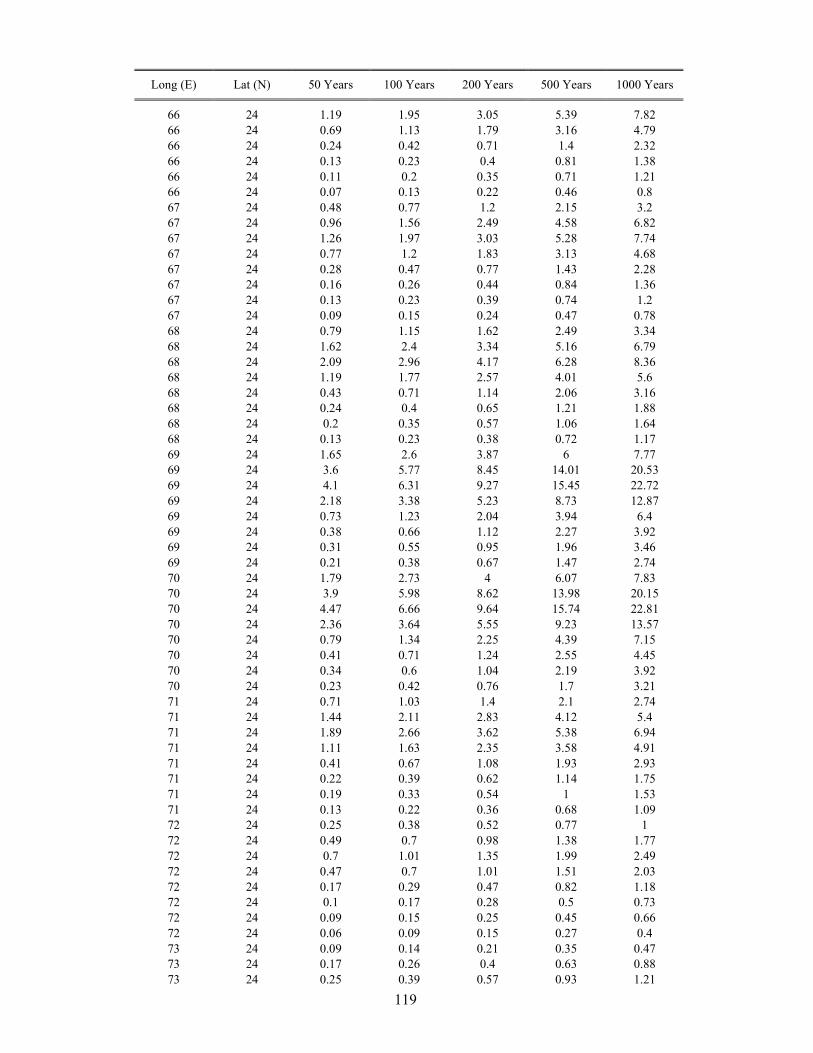
119
Long (E) Lat (N) 50 Years 100 Years 200 Years 500 Years 1000 Years
66 24 1.19 1.95 3.05 5.39 7.82
66 24 0.69 1.13 1.79 3.16 4.79
66 24 0.24 0.42 0.71 1.4 2.32
66 24 0.13 0.23 0.4 0.81 1.38
66 24 0.11 0.2 0.35 0.71 1.21
66 24 0.07 0.13 0.22 0.46 0.8
67 24 0.48 0.77 1.2 2.15 3.2
67 24 0.96 1.56 2.49 4.58 6.82
67 24 1.26 1.97 3.03 5.28 7.74
67 24 0.77 1.2 1.83 3.13 4.68
67 24 0.28 0.47 0.77 1.43 2.28
67 24 0.16 0.26 0.44 0.84 1.36
67 24 0.13 0.23 0.39 0.74 1.2
67 24 0.09 0.15 0.24 0.47 0.78
68 24 0.79 1.15 1.62 2.49 3.34
68 24 1.62 2.4 3.34 5.16 6.79
68 24 2.09 2.96 4.17 6.28 8.36
68 24 1.19 1.77 2.57 4.01 5.6
68 24 0.43 0.71 1.14 2.06 3.16
68 24 0.24 0.4 0.65 1.21 1.88
68 24 0.2 0.35 0.57 1.06 1.64
68 24 0.13 0.23 0.38 0.72 1.17
69 24 1.65 2.6 3.87 6 7.77
69 24 3.6 5.77 8.45 14.01 20.53
69 24 4.1 6.31 9.27 15.45 22.72
69 24 2.18 3.38 5.23 8.73 12.87
69 24 0.73 1.23 2.04 3.94 6.4
69 24 0.38 0.66 1.12 2.27 3.92
69 24 0.31 0.55 0.95 1.96 3.46
69 24 0.21 0.38 0.67 1.47 2.74
70 24 1.79 2.73 4 6.07 7.83
70 24 3.9 5.98 8.62 13.98 20.15
70 24 4.47 6.66 9.64 15.74 22.81
70 24 2.36 3.64 5.55 9.23 13.57
70 24 0.79 1.34 2.25 4.39 7.15
70 24 0.41 0.71 1.24 2.55 4.45
70 24 0.34 0.6 1.04 2.19 3.92
70 24 0.23 0.42 0.76 1.7 3.21
71 24 0.71 1.03 1.4 2.1 2.74
71 24 1.44 2.11 2.83 4.12 5.4
71 24 1.89 2.66 3.62 5.38 6.94
71 24 1.11 1.63 2.35 3.58 4.91
71 24 0.41 0.67 1.08 1.93 2.93
71 24 0.22 0.39 0.62 1.14 1.75
71 24 0.19 0.33 0.54 1 1.53
71 24 0.13 0.22 0.36 0.68 1.09
72 24 0.25 0.38 0.52 0.77 1
72 24 0.49 0.7 0.98 1.38 1.77
72 24 0.7 1.01 1.35 1.99 2.49
72 24 0.47 0.7 1.01 1.51 2.03
72 24 0.17 0.29 0.47 0.82 1.18
72 24 0.1 0.17 0.28 0.5 0.73
72 24 0.09 0.15 0.25 0.45 0.66
72 24 0.06 0.09 0.15 0.27 0.4
73 24 0.09 0.14 0.21 0.35 0.47
73 24 0.17 0.26 0.4 0.63 0.88
73 24 0.25 0.39 0.57 0.93 1.21

120
Long (E) Lat (N) 50 Years 100 Years 200 Years 500 Years 1000 Years
73 24 0.16 0.26 0.41 0.68 0.97
73 24 0.05 0.09 0.16 0.31 0.48
73 24 0.03 0.05 0.1 0.19 0.3
73 24 0.02 0.05 0.09 0.18 0.27
73 24 0.02 0.03 0.05 0.1 0.16
60 25 0.43 0.69 1.11 2 2.91
60 25 0.88 1.47 2.41 4.45 6.59
60 25 1.13 1.8 2.82 4.97 7.11
60 25 0.62 0.98 1.47 2.51 3.65
60 25 0.2 0.32 0.5 0.86 1.26
60 25 0.1 0.17 0.26 0.45 0.66
60 25 0.09 0.14 0.22 0.37 0.55
60 25 0.06 0.09 0.14 0.25 0.37
61 25 0.69 1.11 1.74 2.93 4.2
61 25 1.47 2.43 3.85 6.62 9.51
61 25 1.8 2.83 4.35 7.14 10.16
61 25 0.96 1.47 2.25 3.7 5.34
61 25 0.3 0.48 0.75 1.29 1.92
61 25 0.16 0.25 0.39 0.68 1.02
61 25 0.13 0.21 0.32 0.57 0.86
61 25 0.09 0.14 0.22 0.38 0.59
62 25 0.59 0.96 1.49 2.6 3.77
62 25 1.22 2.03 3.23 5.75 8.28
62 25 1.53 2.44 3.75 6.35 9.12
62 25 0.86 1.33 2.06 3.48 5.15
62 25 0.28 0.47 0.75 1.37 2.13
62 25 0.15 0.25 0.41 0.75 1.21
62 25 0.13 0.21 0.34 0.65 1.05
62 25 0.08 0.14 0.22 0.43 0.7
63 25 0.47 0.77 1.23 2.22 3.26
63 25 0.95 1.58 2.57 4.69 6.87
63 25 1.23 1.98 3.09 5.43 7.9
63 25 0.73 1.16 1.83 3.21 4.88
63 25 0.26 0.44 0.73 1.44 2.38
63 25 0.14 0.24 0.41 0.83 1.41
63 25 0.12 0.21 0.36 0.73 1.25
63 25 0.08 0.13 0.23 0.47 0.83
64 25 0.47 0.78 1.24 2.23 3.29
64 25 0.96 1.59 2.59 4.71 6.92
64 25 1.24 2.01 3.12 5.47 7.96
64 25 0.74 1.19 1.87 3.28 4.96
64 25 0.26 0.46 0.77 1.5 2.47
64 25 0.15 0.25 0.44 0.88 1.48
64 25 0.12 0.22 0.38 0.77 1.31
64 25 0.08 0.14 0.24 0.49 0.86
65 25 0.48 0.78 1.24 2.23 3.29
65 25 0.97 1.6 2.58 4.7 6.92
65 25 1.26 2.01 3.11 5.45 7.95
65 25 0.75 1.2 1.86 3.25 4.92
65 25 0.27 0.46 0.77 1.48 2.43
65 25 0.15 0.26 0.44 0.87 1.45
65 25 0.13 0.22 0.38 0.76 1.29
65 25 0.08 0.14 0.24 0.48 0.84
66 25 0.51 0.8 1.24 2.19 3.22
66 25 1.03 1.64 2.59 4.66 6.84
66 25 1.33 2.07 3.14 5.39 7.83
66 25 0.79 1.22 1.86 3.17 4.73
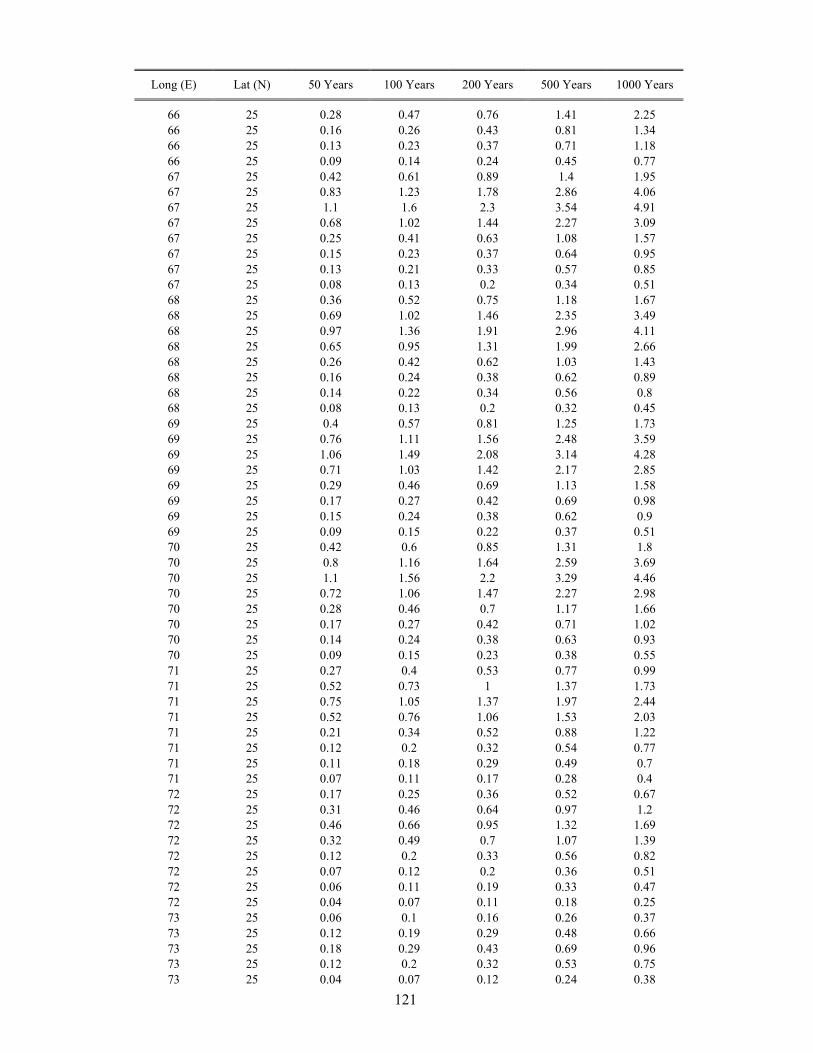
121
Long (E) Lat (N) 50 Years 100 Years 200 Years 500 Years 1000 Years
66 25 0.28 0.47 0.76 1.41 2.25
66 25 0.16 0.26 0.43 0.81 1.34
66 25 0.13 0.23 0.37 0.71 1.18
66 25 0.09 0.14 0.24 0.45 0.77
67 25 0.42 0.61 0.89 1.4 1.95
67 25 0.83 1.23 1.78 2.86 4.06
67 25 1.1 1.6 2.3 3.54 4.91
67 25 0.68 1.02 1.44 2.27 3.09
67 25 0.25 0.41 0.63 1.08 1.57
67 25 0.15 0.23 0.37 0.64 0.95
67 25 0.13 0.21 0.33 0.57 0.85
67 25 0.08 0.13 0.2 0.34 0.51
68 25 0.36 0.52 0.75 1.18 1.67
68 25 0.69 1.02 1.46 2.35 3.49
68 25 0.97 1.36 1.91 2.96 4.11
68 25 0.65 0.95 1.31 1.99 2.66
68 25 0.26 0.42 0.62 1.03 1.43
68 25 0.16 0.24 0.38 0.62 0.89
68 25 0.14 0.22 0.34 0.56 0.8
68 25 0.08 0.13 0.2 0.32 0.45
69 25 0.4 0.57 0.81 1.25 1.73
69 25 0.76 1.11 1.56 2.48 3.59
69 25 1.06 1.49 2.08 3.14 4.28
69 25 0.71 1.03 1.42 2.17 2.85
69 25 0.29 0.46 0.69 1.13 1.58
69 25 0.17 0.27 0.42 0.69 0.98
69 25 0.15 0.24 0.38 0.62 0.9
69 25 0.09 0.15 0.22 0.37 0.51
70 25 0.42 0.6 0.85 1.31 1.8
70 25 0.8 1.16 1.64 2.59 3.69
70 25 1.1 1.56 2.2 3.29 4.46
70 25 0.72 1.06 1.47 2.27 2.98
70 25 0.28 0.46 0.7 1.17 1.66
70 25 0.17 0.27 0.42 0.71 1.02
70 25 0.14 0.24 0.38 0.63 0.93
70 25 0.09 0.15 0.23 0.38 0.55
71 25 0.27 0.4 0.53 0.77 0.99
71 25 0.52 0.73 1 1.37 1.73
71 25 0.75 1.05 1.37 1.97 2.44
71 25 0.52 0.76 1.06 1.53 2.03
71 25 0.21 0.34 0.52 0.88 1.22
71 25 0.12 0.2 0.32 0.54 0.77
71 25 0.11 0.18 0.29 0.49 0.7
71 25 0.07 0.11 0.17 0.28 0.4
72 25 0.17 0.25 0.36 0.52 0.67
72 25 0.31 0.46 0.64 0.97 1.2
72 25 0.46 0.66 0.95 1.32 1.69
72 25 0.32 0.49 0.7 1.07 1.39
72 25 0.12 0.2 0.33 0.56 0.82
72 25 0.07 0.12 0.2 0.36 0.51
72 25 0.06 0.11 0.19 0.33 0.47
72 25 0.04 0.07 0.11 0.18 0.25
73 25 0.06 0.1 0.16 0.26 0.37
73 25 0.12 0.19 0.29 0.48 0.66
73 25 0.18 0.29 0.43 0.69 0.96
73 25 0.12 0.2 0.32 0.53 0.75
73 25 0.04 0.07 0.12 0.24 0.38

122
Long (E) Lat (N) 50 Years 100 Years 200 Years 500 Years 1000 Years
73 25 0.02 0.04 0.08 0.15 0.23
73 25 0.02 0.04 0.07 0.14 0.21
73 25 0.01 0.02 0.04 0.08 0.12
60 26 0.43 0.69 1.11 2 2.92
60 26 0.88 1.47 2.41 4.46 6.62
60 26 1.13 1.8 2.82 4.98 7.13
60 26 0.62 0.98 1.47 2.51 3.66
60 26 0.2 0.32 0.5 0.86 1.26
60 26 0.11 0.17 0.26 0.45 0.66
60 26 0.09 0.14 0.22 0.37 0.55
60 26 0.06 0.09 0.14 0.25 0.37
61 26 0.69 1.11 1.74 2.93 4.22
61 26 1.46 2.42 3.85 6.62 9.55
61 26 1.79 2.82 4.34 7.14 10.18
61 26 0.96 1.47 2.24 3.7 5.36
61 26 0.31 0.49 0.75 1.28 1.9
61 26 0.16 0.25 0.39 0.67 1.01
61 26 0.13 0.21 0.32 0.56 0.85
61 26 0.09 0.14 0.22 0.38 0.58
62 26 0.61 0.99 1.55 2.68 3.87
62 26 1.28 2.12 3.38 5.96 8.57
62 26 1.6 2.53 3.89 6.54 9.37
62 26 0.89 1.37 2.1 3.52 5.18
62 26 0.3 0.48 0.75 1.34 2.06
62 26 0.16 0.25 0.41 0.73 1.15
62 26 0.13 0.21 0.34 0.63 0.99
62 26 0.09 0.14 0.22 0.41 0.67
63 26 0.47 0.76 1.19 2.14 3.14
63 26 0.95 1.55 2.5 4.52 6.62
63 26 1.24 1.95 3.02 5.29 7.66
63 26 0.74 1.15 1.77 3.09 4.68
63 26 0.27 0.44 0.71 1.35 2.22
63 26 0.15 0.24 0.4 0.77 1.31
63 26 0.13 0.21 0.34 0.68 1.15
63 26 0.08 0.13 0.22 0.44 0.77
64 26 0.5 0.78 1.22 2.16 3.18
64 26 1 1.6 2.54 4.55 6.7
64 26 1.31 2.03 3.08 5.32 7.72
64 26 0.79 1.21 1.84 3.16 4.74
64 26 0.29 0.47 0.76 1.42 2.29
64 26 0.16 0.26 0.43 0.82 1.36
64 26 0.14 0.23 0.37 0.72 1.2
64 26 0.09 0.14 0.24 0.46 0.79
65 26 0.67 1.07 1.66 2.82 4.09
65 26 1.39 2.28 3.57 6.2 8.93
65 26 1.74 2.72 4.15 6.89 9.87
65 26 0.99 1.51 2.3 3.85 5.64
65 26 0.35 0.56 0.89 1.59 2.46
65 26 0.19 0.3 0.49 0.89 1.41
65 26 0.16 0.26 0.42 0.77 1.22
65 26 0.1 0.17 0.27 0.5 0.82
66 26 0.84 1.34 2.1 3.45 5
66 26 1.79 2.91 4.62 7.7 11.15
66 26 2.18 3.37 5.19 8.34 11.94
66 26 1.15 1.79 2.7 4.53 6.45
66 26 0.39 0.62 0.98 1.71 2.57
66 26 0.2 0.33 0.52 0.93 1.42

123
Long (E) Lat (N) 50 Years 100 Years 200 Years 500 Years 1000 Years
66 26 0.17 0.27 0.44 0.79 1.22
66 26 0.11 0.18 0.29 0.53 0.84
67 26 0.79 1.28 2.04 3.37 4.88
67 26 1.68 2.8 4.53 7.57 10.93
67 26 2.03 3.22 5.05 8.16 11.71
67 26 1.08 1.68 2.56 4.31 6.18
67 26 0.37 0.58 0.91 1.56 2.35
67 26 0.19 0.31 0.48 0.84 1.28
67 26 0.16 0.26 0.41 0.71 1.09
67 26 0.1 0.17 0.26 0.47 0.74
68 26 0.34 0.5 0.7 1.12 1.6
68 26 0.67 0.98 1.4 2.27 3.41
68 26 0.93 1.3 1.82 2.85 4.01
68 26 0.59 0.86 1.19 1.78 2.41
68 26 0.23 0.36 0.52 0.85 1.17
68 26 0.13 0.21 0.31 0.5 0.69
68 26 0.12 0.18 0.27 0.45 0.62
68 26 0.07 0.11 0.16 0.26 0.36
69 26 0.3 0.44 0.64 1.04 1.53
69 26 0.57 0.85 1.27 2.14 3.3
69 26 0.79 1.15 1.63 2.62 3.82
69 26 0.53 0.77 1.09 1.64 2.24
69 26 0.21 0.33 0.49 0.78 1.09
69 26 0.12 0.19 0.29 0.47 0.65
69 26 0.11 0.17 0.26 0.43 0.59
69 26 0.07 0.1 0.15 0.23 0.32
70 26 0.25 0.39 0.59 1 1.5
70 26 0.49 0.77 1.19 2.09 3.26
70 26 0.68 1.03 1.52 2.53 3.75
70 26 0.44 0.66 0.97 1.52 2.13
70 26 0.16 0.26 0.41 0.67 0.96
70 26 0.09 0.15 0.23 0.4 0.56
70 26 0.08 0.13 0.21 0.36 0.51
70 26 0.05 0.08 0.12 0.2 0.28
71 26 0.18 0.3 0.48 0.87 1.36
71 26 0.36 0.58 0.95 1.83 2.98
71 26 0.5 0.79 1.24 2.19 3.39
71 26 0.32 0.5 0.76 1.28 1.85
71 26 0.11 0.19 0.3 0.52 0.76
71 26 0.06 0.1 0.17 0.3 0.44
71 26 0.05 0.09 0.15 0.27 0.4
71 26 0.03 0.06 0.09 0.15 0.22
72 26 0.09 0.14 0.2 0.31 0.42
72 26 0.17 0.26 0.39 0.58 0.78
72 26 0.25 0.39 0.54 0.85 1.09
72 26 0.17 0.25 0.39 0.6 0.83
72 26 0.05 0.09 0.15 0.26 0.4
72 26 0.03 0.05 0.09 0.16 0.24
72 26 0.03 0.05 0.08 0.15 0.22
72 26 0.02 0.03 0.05 0.08 0.12
73 26 0.02 0.04 0.07 0.11 0.15
73 26 0.04 0.08 0.13 0.2 0.28
73 26 0.07 0.12 0.19 0.31 0.42
73 26 0.04 0.08 0.12 0.2 0.28
73 26 0.01 0.02 0.04 0.07 0.1
73 26 0.01 0.01 0.02 0.04 0.06
73 26 0.01 0.01 0.02 0.03 0.05

124
Long (E) Lat (N) 50 Years 100 Years 200 Years 500 Years 1000 Years
73 26 0 0.01 0.01 0.02 0.03
74 26 0 0.01 0.02 0.04 0.07
74 26 0 0.02 0.04 0.08 0.12
74 26 0 0.03 0.07 0.13 0.19
74 26 0 0.02 0.04 0.08 0.13
74 26 0 0.01 0.01 0.02 0.04
74 26 0 0 0.01 0.01 0.02
74 26 0 0 0.01 0.01 0.02
74 26 0 0 0 0.01 0.01
60 27 0.42 0.69 1.1 2 2.92
60 27 0.88 1.46 2.41 4.46 6.62
60 27 1.13 1.8 2.81 4.98 7.13
60 27 0.62 0.97 1.46 2.49 3.66
60 27 0.2 0.32 0.49 0.84 1.24
60 27 0.11 0.17 0.25 0.43 0.64
60 27 0.09 0.14 0.21 0.36 0.53
60 27 0.06 0.09 0.14 0.24 0.36
61 27 0.69 1.11 1.73 2.9 4.13
61 27 1.46 2.42 3.84 6.56 9.34
61 27 1.79 2.81 4.33 7.08 10.03
61 27 0.95 1.45 2.21 3.62 5.24
61 27 0.3 0.48 0.72 1.23 1.81
61 27 0.16 0.24 0.37 0.64 0.95
61 27 0.13 0.2 0.31 0.53 0.79
61 27 0.09 0.14 0.21 0.36 0.55
62 27 0.7 1.12 1.75 2.97 4.29
62 27 1.48 2.44 3.88 6.7 9.71
62 27 1.82 2.85 4.38 7.22 10.32
62 27 0.98 1.5 2.27 3.77 5.45
62 27 0.33 0.51 0.78 1.34 1.98
62 27 0.17 0.27 0.41 0.71 1.06
62 27 0.14 0.22 0.34 0.6 0.9
62 27 0.09 0.15 0.23 0.4 0.61
63 27 0.6 0.92 1.37 2.29 3.25
63 27 1.24 1.94 2.93 5 7.04
63 27 1.57 2.38 3.5 5.71 8.01
63 27 0.9 1.33 1.96 3.19 4.59
63 27 0.31 0.49 0.75 1.31 1.98
63 27 0.17 0.26 0.41 0.72 1.12
63 27 0.14 0.22 0.35 0.62 0.96
63 27 0.09 0.15 0.23 0.41 0.66
64 27 0.83 1.33 2.09 3.4 4.88
64 27 1.76 2.89 4.61 7.6 10.87
64 27 2.14 3.34 5.17 8.26 11.78
64 27 1.14 1.77 2.67 4.45 6.32
64 27 0.39 0.61 0.96 1.68 2.54
64 27 0.2 0.32 0.51 0.91 1.41
64 27 0.17 0.27 0.43 0.77 1.2
64 27 0.11 0.18 0.28 0.53 0.84
65 27 0.85 1.34 2.09 3.39 4.86
65 27 1.81 2.91 4.61 7.58 10.87
65 27 2.2 3.38 5.17 8.24 11.72
65 27 1.19 1.81 2.69 4.42 6.26
65 27 0.41 0.64 0.99 1.68 2.5
65 27 0.22 0.34 0.53 0.92 1.38
65 27 0.18 0.29 0.45 0.78 1.18
65 27 0.12 0.19 0.29 0.52 0.81

125
Long (E) Lat (N) 50 Years 100 Years 200 Years 500 Years 1000 Years
66 27 0.86 1.34 2.09 3.44 5
66 27 1.81 2.91 4.61 7.7 11.18
66 27 2.21 3.38 5.17 8.32 11.93
66 27 1.21 1.83 2.71 4.48 6.39
66 27 0.44 0.67 1.02 1.71 2.52
66 27 0.23 0.37 0.55 0.94 1.39
66 27 0.2 0.31 0.48 0.81 1.2
66 27 0.13 0.2 0.3 0.53 0.8
67 27 0.86 1.34 2.08 3.42 4.95
67 27 1.81 2.9 4.59 7.64 11.07
67 27 2.21 3.37 5.15 8.27 11.85
67 27 1.21 1.83 2.7 4.46 6.34
67 27 0.44 0.67 1.03 1.72 2.52
67 27 0.23 0.37 0.56 0.95 1.4
67 27 0.2 0.31 0.48 0.81 1.21
67 27 0.13 0.2 0.31 0.53 0.81
68 27 0.63 0.98 1.5 2.56 3.69
68 27 1.29 2.05 3.23 5.72 8.27
68 27 1.64 2.5 3.75 6.25 8.92
68 27 0.98 1.43 2.11 3.39 4.85
68 27 0.36 0.56 0.85 1.4 2.04
68 27 0.2 0.31 0.47 0.79 1.16
68 27 0.17 0.27 0.41 0.69 1.01
68 27 0.11 0.17 0.26 0.44 0.65
69 27 0.36 0.52 0.73 1.16 1.65
69 27 0.69 1.01 1.44 2.32 3.49
69 27 0.97 1.35 1.89 2.94 4.11
69 27 0.63 0.92 1.26 1.91 2.58
69 27 0.25 0.39 0.57 0.95 1.31
69 27 0.15 0.23 0.34 0.56 0.79
69 27 0.13 0.2 0.3 0.5 0.71
69 27 0.08 0.12 0.18 0.29 0.42
70 27 0.27 0.41 0.6 1.01 1.5
70 27 0.52 0.8 1.21 2.1 3.25
70 27 0.72 1.08 1.56 2.57 3.76
70 27 0.47 0.69 1 1.55 2.16
70 27 0.17 0.27 0.41 0.68 0.97
70 27 0.1 0.16 0.24 0.4 0.56
70 27 0.08 0.14 0.21 0.35 0.51
70 27 0.05 0.08 0.13 0.21 0.29
71 27 0.2 0.32 0.51 0.93 1.44
71 27 0.39 0.64 1.05 2 3.18
71 27 0.54 0.86 1.34 2.37 3.62
71 27 0.33 0.51 0.77 1.3 1.89
71 27 0.11 0.18 0.28 0.48 0.7
71 27 0.06 0.1 0.15 0.26 0.39
71 27 0.05 0.08 0.13 0.23 0.34
71 27 0.03 0.05 0.08 0.14 0.2
72 27 0.09 0.17 0.28 0.55 0.9
72 27 0.19 0.34 0.59 1.18 1.98
72 27 0.26 0.46 0.77 1.46 2.33
72 27 0.15 0.25 0.42 0.77 1.18
72 27 0.04 0.08 0.13 0.23 0.36
72 27 0.02 0.04 0.07 0.12 0.18
72 27 0.02 0.03 0.05 0.1 0.15
72 27 0.01 0.02 0.04 0.07 0.1
73 27 0.05 0.08 0.11 0.18 0.23

126
Long (E) Lat (N) 50 Years 100 Years 200 Years 500 Years 1000 Years
73 27 0.09 0.15 0.22 0.34 0.46
73 27 0.13 0.21 0.32 0.49 0.66
73 27 0.08 0.13 0.2 0.32 0.44
73 27 0.02 0.04 0.06 0.11 0.16
73 27 0.01 0.02 0.04 0.06 0.09
73 27 0.01 0.02 0.03 0.05 0.08
73 27 0.01 0.01 0.02 0.04 0.05
74 27 0.02 0.04 0.06 0.09 0.13
74 27 0.04 0.07 0.11 0.18 0.24
74 27 0.06 0.1 0.17 0.26 0.37
74 27 0.03 0.06 0.1 0.18 0.25
74 27 0.01 0.02 0.03 0.06 0.09
74 27 0.01 0.01 0.02 0.03 0.05
74 27 0 0.01 0.01 0.03 0.04
74 27 0 0.01 0.01 0.02 0.03
75 27 0 0 0.01 0.03 0.04
75 27 0 0 0.02 0.05 0.08
75 27 0 0 0.03 0.08 0.12
75 27 0 0 0.02 0.05 0.08
75 27 0 0 0.01 0.01 0.02
75 27 0 0 0 0.01 0.01
75 27 0 0 0 0.01 0.01
75 27 0 0 0 0.01 0.01
60 28 0.43 0.7 1.11 2 2.87
60 28 0.89 1.48 2.43 4.46 6.51
60 28 1.14 1.81 2.83 4.99 7.05
60 28 0.62 0.97 1.46 2.48 3.58
60 28 0.2 0.32 0.49 0.83 1.22
60 28 0.11 0.17 0.25 0.43 0.63
60 28 0.09 0.14 0.21 0.35 0.52
60 28 0.06 0.09 0.14 0.24 0.36
61 28 0.7 1.12 1.76 2.97 4.28
61 28 1.49 2.46 3.92 6.73 9.7
61 28 1.82 2.86 4.42 7.25 10.33
61 28 0.96 1.47 2.24 3.71 5.39
61 28 0.3 0.48 0.73 1.24 1.83
61 28 0.16 0.24 0.37 0.64 0.95
61 28 0.13 0.2 0.31 0.53 0.78
61 28 0.09 0.14 0.21 0.36 0.55
62 28 0.71 1.14 1.78 2.98 4.28
62 28 1.51 2.48 3.95 6.75 9.7
62 28 1.85 2.89 4.44 7.27 10.35
62 28 1 1.51 2.27 3.73 5.39
62 28 0.33 0.51 0.76 1.28 1.88
62 28 0.17 0.26 0.4 0.67 0.99
62 28 0.14 0.22 0.33 0.56 0.82
62 28 0.09 0.15 0.22 0.38 0.57
63 28 0.72 1.15 1.78 2.98 4.28
63 28 1.53 2.49 3.94 6.73 9.69
63 28 1.89 2.91 4.45 7.26 10.34
63 28 1.03 1.54 2.31 3.78 5.43
63 28 0.35 0.53 0.81 1.35 1.97
63 28 0.18 0.28 0.43 0.71 1.05
63 28 0.15 0.24 0.36 0.6 0.88
63 28 0.1 0.16 0.24 0.4 0.61
64 28 0.83 1.32 2.07 3.39 4.9
64 28 1.78 2.88 4.6 7.62 10.96

127
Long (E) Lat (N) 50 Years 100 Years 200 Years 500 Years 1000 Years
64 28 2.16 3.34 5.14 8.24 11.78
64 28 1.15 1.76 2.63 4.38 6.24
64 28 0.4 0.61 0.94 1.59 2.37
64 28 0.21 0.32 0.49 0.85 1.28
64 28 0.17 0.27 0.42 0.72 1.08
64 28 0.11 0.18 0.28 0.49 0.76
65 28 0.86 1.34 2.08 3.39 4.88
65 28 1.82 2.91 4.61 7.6 10.92
65 28 2.21 3.38 5.16 8.25 11.76
65 28 1.22 1.83 2.69 4.42 6.26
65 28 0.44 0.67 1.02 1.69 2.49
65 28 0.24 0.37 0.55 0.93 1.37
65 28 0.2 0.31 0.47 0.79 1.18
65 28 0.13 0.2 0.3 0.53 0.8
66 28 0.88 1.35 2.08 3.38 4.85
66 28 1.84 2.91 4.58 7.56 10.86
66 28 2.26 3.41 5.14 8.21 11.68
66 28 1.29 1.9 2.75 4.44 6.24
66 28 0.49 0.74 1.11 1.81 2.62
66 28 0.27 0.42 0.61 1.02 1.48
66 28 0.23 0.36 0.53 0.89 1.29
66 28 0.15 0.22 0.34 0.57 0.85
67 28 0.94 1.42 2.14 3.46 4.96
67 28 1.94 3.01 4.66 7.67 11.06
67 28 2.41 3.57 5.28 8.37 11.88
67 28 1.41 2.07 2.95 4.7 6.54
67 28 0.55 0.85 1.26 2.09 3
67 28 0.31 0.48 0.71 1.19 1.74
67 28 0.26 0.42 0.62 1.05 1.52
67 28 0.17 0.26 0.4 0.68 1.02
68 28 1.56 2.46 3.63 5.72 7.4
68 28 3.4 5.46 7.99 13.2 19.3
68 28 3.89 5.98 8.73 14.4 21.03
68 28 2.08 3.18 4.84 7.99 11.62
68 28 0.73 1.17 1.87 3.47 5.53
68 28 0.38 0.63 1.02 1.97 3.29
68 28 0.32 0.53 0.87 1.7 2.88
68 28 0.21 0.36 0.6 1.24 2.21
69 28 1.38 2.27 3.42 5.6 7.33
69 28 3.01 5.06 7.56 12.83 19.15
69 28 3.46 5.51 8.18 13.8 20.49
69 28 1.83 2.88 4.48 7.61 11.22
69 28 0.63 1.03 1.66 3.13 5.06
69 28 0.33 0.54 0.89 1.76 2.97
69 28 0.27 0.46 0.76 1.51 2.59
69 28 0.18 0.3 0.52 1.09 1.97
70 28 0.42 0.59 0.82 1.27 1.75
70 28 0.83 1.17 1.62 2.54 3.63
70 28 1.13 1.56 2.16 3.22 4.37
70 28 0.73 1.04 1.42 2.14 2.82
70 28 0.28 0.44 0.64 1.05 1.47
70 28 0.16 0.25 0.38 0.62 0.9
70 28 0.14 0.22 0.34 0.55 0.8
70 28 0.09 0.14 0.21 0.34 0.48
71 28 0.26 0.39 0.58 0.98 1.48
71 28 0.51 0.77 1.18 2.07 3.23
71 28 0.71 1.05 1.52 2.51 3.72

128
Long (E) Lat (N) 50 Years 100 Years 200 Years 500 Years 1000 Years
71 28 0.45 0.66 0.96 1.49 2.08
71 28 0.16 0.25 0.39 0.63 0.9
71 28 0.09 0.15 0.22 0.37 0.52
71 28 0.08 0.13 0.19 0.32 0.46
71 28 0.05 0.08 0.12 0.19 0.27
72 28 0.17 0.29 0.47 0.9 1.42
72 28 0.34 0.58 0.99 1.97 3.17
72 28 0.47 0.77 1.25 2.31 3.58
72 28 0.28 0.45 0.69 1.2 1.79
72 28 0.09 0.15 0.23 0.4 0.59
72 28 0.05 0.08 0.12 0.21 0.31
72 28 0.04 0.07 0.1 0.18 0.26
72 28 0.03 0.04 0.07 0.11 0.17
73 28 0.08 0.13 0.21 0.37 0.53
73 28 0.16 0.27 0.44 0.76 1.1
73 28 0.22 0.38 0.59 1 1.41
73 28 0.13 0.22 0.34 0.56 0.81
73 28 0.04 0.07 0.1 0.18 0.26
73 28 0.02 0.03 0.06 0.1 0.14
73 28 0.02 0.03 0.05 0.08 0.12
73 28 0.01 0.02 0.03 0.06 0.08
74 28 0.04 0.06 0.09 0.15 0.2
74 28 0.08 0.12 0.19 0.29 0.4
74 28 0.11 0.18 0.27 0.43 0.57
74 28 0.07 0.11 0.18 0.28 0.4
74 28 0.02 0.03 0.05 0.09 0.14
74 28 0.01 0.02 0.03 0.05 0.08
74 28 0.01 0.02 0.03 0.05 0.07
74 28 0.01 0.01 0.02 0.03 0.04
75 28 0.01 0.03 0.05 0.08 0.11
75 28 0.03 0.05 0.09 0.15 0.21
75 28 0.04 0.08 0.14 0.23 0.32
75 28 0.02 0.05 0.09 0.16 0.22
75 28 0.01 0.02 0.03 0.05 0.07
75 28 0 0.01 0.02 0.03 0.04
75 28 0 0.01 0.01 0.02 0.04
75 28 0 0.01 0.01 0.02 0.03
60 29 0.44 0.71 1.14 2.05 2.96
60 29 0.91 1.51 2.49 4.6 6.7
60 29 1.16 1.85 2.89 5.12 7.24
60 29 0.63 0.99 1.49 2.53 3.68
60 29 0.2 0.32 0.5 0.84 1.24
60 29 0.11 0.17 0.26 0.43 0.64
60 29 0.09 0.14 0.21 0.36 0.53
60 29 0.06 0.09 0.14 0.24 0.36
61 29 0.7 1.13 1.78 3 4.33
61 29 1.5 2.48 3.95 6.79 9.82
61 29 1.83 2.88 4.45 7.31 10.44
61 29 0.96 1.47 2.24 3.74 5.44
61 29 0.3 0.48 0.72 1.23 1.82
61 29 0.16 0.24 0.37 0.63 0.93
61 29 0.13 0.2 0.3 0.52 0.77
61 29 0.09 0.13 0.21 0.36 0.55
62 29 0.71 1.14 1.78 2.98 4.27
62 29 1.51 2.49 3.96 6.75 9.67
62 29 1.85 2.89 4.45 7.27 10.34
62 29 0.99 1.49 2.25 3.71 5.37

129
Long (E) Lat (N) 50 Years 100 Years 200 Years 500 Years 1000 Years
62 29 0.32 0.5 0.74 1.25 1.83
62 29 0.17 0.25 0.38 0.64 0.94
62 29 0.14 0.21 0.32 0.53 0.78
62 29 0.09 0.14 0.21 0.37 0.55
63 29 0.71 1.13 1.77 2.98 4.28
63 29 1.51 2.47 3.93 6.74 9.7
63 29 1.85 2.88 4.43 7.26 10.34
63 29 1 1.51 2.26 3.72 5.39
63 29 0.34 0.51 0.77 1.28 1.86
63 29 0.18 0.27 0.4 0.67 0.98
63 29 0.15 0.22 0.34 0.56 0.81
63 29 0.1 0.15 0.22 0.38 0.57
64 29 0.75 1.17 1.81 3.01 4.33
64 29 1.58 2.54 3.99 6.79 9.78
64 29 1.95 2.98 4.52 7.34 10.44
64 29 1.08 1.6 2.37 3.85 5.52
64 29 0.38 0.58 0.87 1.42 2.06
64 29 0.2 0.31 0.46 0.77 1.11
64 29 0.17 0.26 0.4 0.65 0.95
64 29 0.11 0.17 0.25 0.43 0.64
65 29 0.88 1.36 2.09 3.42 4.95
65 29 1.84 2.93 4.62 7.66 11.06
65 29 2.25 3.42 5.18 8.3 11.85
65 29 1.26 1.88 2.76 4.5 6.36
65 29 0.47 0.71 1.08 1.79 2.62
65 29 0.25 0.4 0.59 1 1.47
65 29 0.22 0.34 0.51 0.86 1.27
65 29 0.14 0.22 0.33 0.57 0.85
66 29 1.01 1.5 2.22 3.52 4.99
66 29 2.09 3.17 4.81 7.73 11
66 29 2.58 3.78 5.49 8.57 12.02
66 29 1.51 2.21 3.13 4.95 6.82
66 29 0.59 0.92 1.37 2.3 3.33
66 29 0.33 0.52 0.78 1.32 1.95
66 29 0.29 0.45 0.68 1.15 1.7
66 29 0.18 0.29 0.44 0.77 1.18
67 29 1.75 2.67 3.92 6.01 7.77
67 29 3.81 5.88 8.53 13.93 20.2
67 29 4.37 6.51 9.44 15.42 22.37
67 29 2.35 3.56 5.36 8.84 12.9
67 29 0.86 1.38 2.2 4.09 6.52
67 29 0.46 0.75 1.23 2.36 4
67 29 0.39 0.64 1.05 2.04 3.53
67 29 0.26 0.43 0.73 1.53 2.78
68 29 1.8 2.71 3.94 5.99 7.7
68 29 3.89 5.93 8.54 13.82 19.91
68 29 4.5 6.61 9.52 15.4 22.16
68 29 2.45 3.68 5.48 8.95 12.96
68 29 0.91 1.46 2.33 4.33 6.88
68 29 0.49 0.8 1.31 2.54 4.26
68 29 0.41 0.68 1.12 2.19 3.76
68 29 0.28 0.47 0.79 1.66 3
69 29 1.71 2.61 3.85 5.98 7.82
69 29 3.72 5.78 8.45 13.96 20.42
69 29 4.26 6.37 9.25 15.15 22
69 29 2.28 3.44 5.18 8.52 12.43
69 29 0.8 1.28 2.02 3.7 5.85
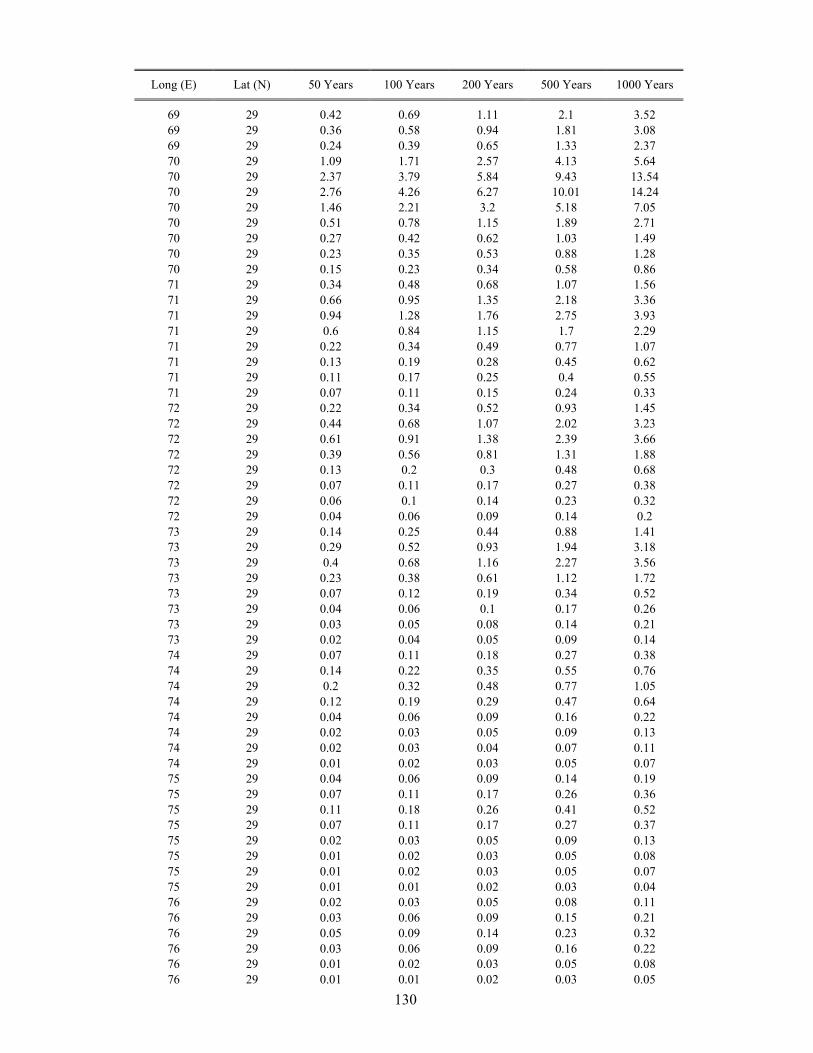
130
Long (E) Lat (N) 50 Years 100 Years 200 Years 500 Years 1000 Years
69 29 0.42 0.69 1.11 2.1 3.52
69 29 0.36 0.58 0.94 1.81 3.08
69 29 0.24 0.39 0.65 1.33 2.37
70 29 1.09 1.71 2.57 4.13 5.64
70 29 2.37 3.79 5.84 9.43 13.54
70 29 2.76 4.26 6.27 10.01 14.24
70 29 1.46 2.21 3.2 5.18 7.05
70 29 0.51 0.78 1.15 1.89 2.71
70 29 0.27 0.42 0.62 1.03 1.49
70 29 0.23 0.35 0.53 0.88 1.28
70 29 0.15 0.23 0.34 0.58 0.86
71 29 0.34 0.48 0.68 1.07 1.56
71 29 0.66 0.95 1.35 2.18 3.36
71 29 0.94 1.28 1.76 2.75 3.93
71 29 0.6 0.84 1.15 1.7 2.29
71 29 0.22 0.34 0.49 0.77 1.07
71 29 0.13 0.19 0.28 0.45 0.62
71 29 0.11 0.17 0.25 0.4 0.55
71 29 0.07 0.11 0.15 0.24 0.33
72 29 0.22 0.34 0.52 0.93 1.45
72 29 0.44 0.68 1.07 2.02 3.23
72 29 0.61 0.91 1.38 2.39 3.66
72 29 0.39 0.56 0.81 1.31 1.88
72 29 0.13 0.2 0.3 0.48 0.68
72 29 0.07 0.11 0.17 0.27 0.38
72 29 0.06 0.1 0.14 0.23 0.32
72 29 0.04 0.06 0.09 0.14 0.2
73 29 0.14 0.25 0.44 0.88 1.41
73 29 0.29 0.52 0.93 1.94 3.18
73 29 0.4 0.68 1.16 2.27 3.56
73 29 0.23 0.38 0.61 1.12 1.72
73 29 0.07 0.12 0.19 0.34 0.52
73 29 0.04 0.06 0.1 0.17 0.26
73 29 0.03 0.05 0.08 0.14 0.21
73 29 0.02 0.04 0.05 0.09 0.14
74 29 0.07 0.11 0.18 0.27 0.38
74 29 0.14 0.22 0.35 0.55 0.76
74 29 0.2 0.32 0.48 0.77 1.05
74 29 0.12 0.19 0.29 0.47 0.64
74 29 0.04 0.06 0.09 0.16 0.22
74 29 0.02 0.03 0.05 0.09 0.13
74 29 0.02 0.03 0.04 0.07 0.11
74 29 0.01 0.02 0.03 0.05 0.07
75 29 0.04 0.06 0.09 0.14 0.19
75 29 0.07 0.11 0.17 0.26 0.36
75 29 0.11 0.18 0.26 0.41 0.52
75 29 0.07 0.11 0.17 0.27 0.37
75 29 0.02 0.03 0.05 0.09 0.13
75 29 0.01 0.02 0.03 0.05 0.08
75 29 0.01 0.02 0.03 0.05 0.07
75 29 0.01 0.01 0.02 0.03 0.04
76 29 0.02 0.03 0.05 0.08 0.11
76 29 0.03 0.06 0.09 0.15 0.21
76 29 0.05 0.09 0.14 0.23 0.32
76 29 0.03 0.06 0.09 0.16 0.22
76 29 0.01 0.02 0.03 0.05 0.08
76 29 0.01 0.01 0.02 0.03 0.05
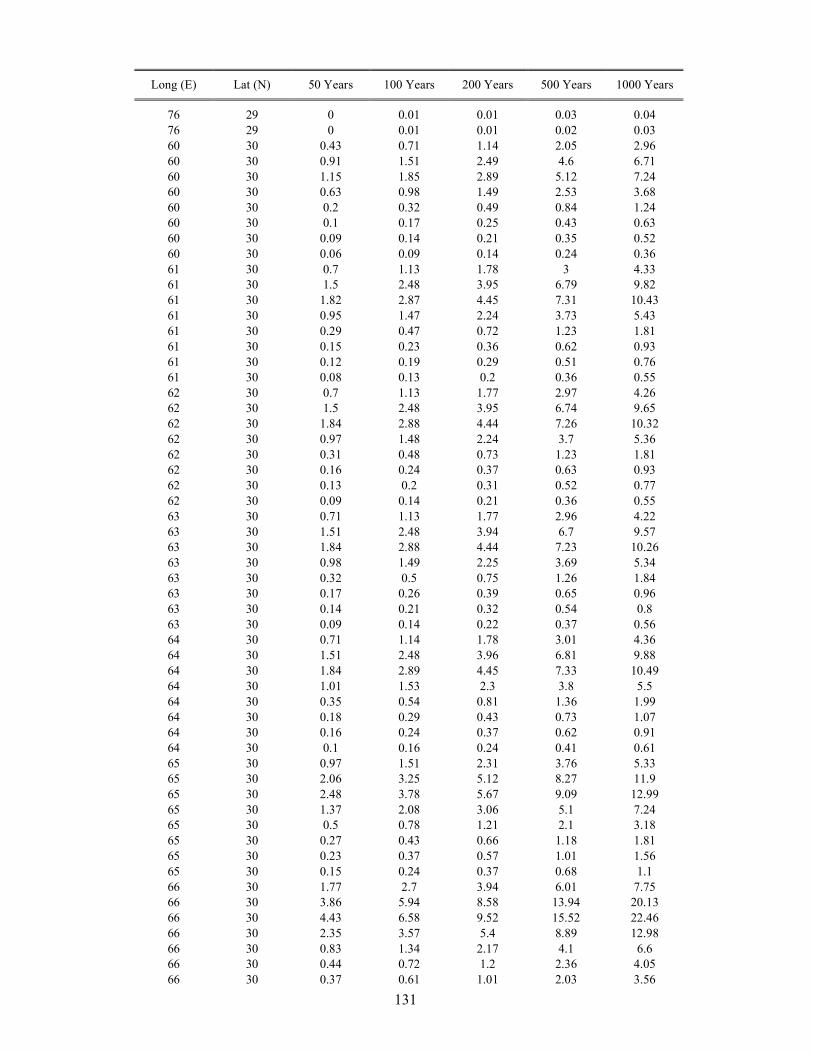
131
Long (E) Lat (N) 50 Years 100 Years 200 Years 500 Years 1000 Years
76 29 0 0.01 0.01 0.03 0.04
76 29 0 0.01 0.01 0.02 0.03
60 30 0.43 0.71 1.14 2.05 2.96
60 30 0.91 1.51 2.49 4.6 6.71
60 30 1.15 1.85 2.89 5.12 7.24
60 30 0.63 0.98 1.49 2.53 3.68
60 30 0.2 0.32 0.49 0.84 1.24
60 30 0.1 0.17 0.25 0.43 0.63
60 30 0.09 0.14 0.21 0.35 0.52
60 30 0.06 0.09 0.14 0.24 0.36
61 30 0.7 1.13 1.78 3 4.33
61 30 1.5 2.48 3.95 6.79 9.82
61 30 1.82 2.87 4.45 7.31 10.43
61 30 0.95 1.47 2.24 3.73 5.43
61 30 0.29 0.47 0.72 1.23 1.81
61 30 0.15 0.23 0.36 0.62 0.93
61 30 0.12 0.19 0.29 0.51 0.76
61 30 0.08 0.13 0.2 0.36 0.55
62 30 0.7 1.13 1.77 2.97 4.26
62 30 1.5 2.48 3.95 6.74 9.65
62 30 1.84 2.88 4.44 7.26 10.32
62 30 0.97 1.48 2.24 3.7 5.36
62 30 0.31 0.48 0.73 1.23 1.81
62 30 0.16 0.24 0.37 0.63 0.93
62 30 0.13 0.2 0.31 0.52 0.77
62 30 0.09 0.14 0.21 0.36 0.55
63 30 0.71 1.13 1.77 2.96 4.22
63 30 1.51 2.48 3.94 6.7 9.57
63 30 1.84 2.88 4.44 7.23 10.26
63 30 0.98 1.49 2.25 3.69 5.34
63 30 0.32 0.5 0.75 1.26 1.84
63 30 0.17 0.26 0.39 0.65 0.96
63 30 0.14 0.21 0.32 0.54 0.8
63 30 0.09 0.14 0.22 0.37 0.56
64 30 0.71 1.14 1.78 3.01 4.36
64 30 1.51 2.48 3.96 6.81 9.88
64 30 1.84 2.89 4.45 7.33 10.49
64 30 1.01 1.53 2.3 3.8 5.5
64 30 0.35 0.54 0.81 1.36 1.99
64 30 0.18 0.29 0.43 0.73 1.07
64 30 0.16 0.24 0.37 0.62 0.91
64 30 0.1 0.16 0.24 0.41 0.61
65 30 0.97 1.51 2.31 3.76 5.33
65 30 2.06 3.25 5.12 8.27 11.9
65 30 2.48 3.78 5.67 9.09 12.99
65 30 1.37 2.08 3.06 5.1 7.24
65 30 0.5 0.78 1.21 2.1 3.18
65 30 0.27 0.43 0.66 1.18 1.81
65 30 0.23 0.37 0.57 1.01 1.56
65 30 0.15 0.24 0.37 0.68 1.1
66 30 1.77 2.7 3.94 6.01 7.75
66 30 3.86 5.94 8.58 13.94 20.13
66 30 4.43 6.58 9.52 15.52 22.46
66 30 2.35 3.57 5.4 8.89 12.98
66 30 0.83 1.34 2.17 4.1 6.6
66 30 0.44 0.72 1.2 2.36 4.05
66 30 0.37 0.61 1.01 2.03 3.56

132
Long (E) Lat (N) 50 Years 100 Years 200 Years 500 Years 1000 Years
66 30 0.25 0.42 0.72 1.54 2.85
67 30 1.82 2.74 4.02 6.14 7.99
67 30 3.92 6 8.71 14.28 20.76
67 30 4.52 6.68 9.66 15.75 22.79
67 30 2.47 3.73 5.58 9.17 13.37
67 30 0.92 1.48 2.36 4.37 6.92
67 30 0.49 0.81 1.33 2.56 4.28
67 30 0.42 0.69 1.14 2.2 3.78
67 30 0.28 0.47 0.8 1.67 3.01
68 30 1.8 2.7 3.91 5.93 7.6
68 30 3.89 5.92 8.48 13.63 19.52
68 30 4.48 6.59 9.47 15.29 21.96
68 30 2.42 3.64 5.42 8.85 12.82
68 30 0.89 1.43 2.29 4.26 6.8
68 30 0.48 0.78 1.28 2.49 4.2
68 30 0.4 0.66 1.1 2.14 3.7
68 30 0.27 0.46 0.77 1.63 2.96
69 30 1.65 2.47 3.39 5.13 6.3
69 30 3.67 5.6 7.63 11.49 15.66
69 30 4.13 6.06 8.38 12.89 17.85
69 30 2.13 3.07 4.41 6.67 8.93
69 30 0.73 1.11 1.65 2.76 4
69 30 0.39 0.59 0.9 1.53 2.27
69 30 0.32 0.5 0.76 1.31 1.94
69 30 0.21 0.33 0.52 0.91 1.42
70 30 1.37 2.02 2.73 3.97 5.22
70 30 3.03 4.48 6.14 8.85 11.67
70 30 3.49 5.15 6.87 10.07 13.45
70 30 1.79 2.57 3.56 5.42 7.09
70 30 0.59 0.89 1.28 2.08 2.94
70 30 0.31 0.46 0.68 1.12 1.6
70 30 0.25 0.39 0.57 0.95 1.36
70 30 0.17 0.26 0.39 0.65 0.96
71 30 0.53 0.74 1.02 1.5 2.01
71 30 1.09 1.52 2.11 3.18 4.33
71 30 1.41 1.98 2.67 3.91 5.21
71 30 0.85 1.17 1.57 2.32 3.02
71 30 0.3 0.44 0.63 0.99 1.33
71 30 0.17 0.24 0.35 0.55 0.76
71 30 0.14 0.21 0.3 0.48 0.66
71 30 0.09 0.13 0.19 0.3 0.42
72 30 0.26 0.38 0.56 0.94 1.45
72 30 0.52 0.76 1.14 2.03 3.21
72 30 0.72 1.03 1.49 2.45 3.68
72 30 0.45 0.64 0.9 1.39 1.94
72 30 0.16 0.23 0.34 0.53 0.74
72 30 0.09 0.13 0.19 0.29 0.41
72 30 0.07 0.11 0.16 0.25 0.35
72 30 0.05 0.07 0.1 0.16 0.22
73 30 0.2 0.32 0.5 0.92 1.44
73 30 0.4 0.64 1.04 2 3.21
73 30 0.55 0.85 1.32 2.36 3.64
73 30 0.33 0.51 0.75 1.26 1.85
73 30 0.11 0.17 0.26 0.44 0.63
73 30 0.06 0.09 0.14 0.23 0.34
73 30 0.05 0.08 0.12 0.2 0.29
73 30 0.03 0.05 0.08 0.13 0.18

133
Long (E) Lat (N) 50 Years 100 Years 200 Years 500 Years 1000 Years
74 30 0.17 0.28 0.46 0.87 1.39
74 30 0.34 0.56 0.93 1.87 3.07
74 30 0.48 0.76 1.21 2.22 3.46
74 30 0.3 0.47 0.72 1.23 1.82
74 30 0.1 0.16 0.26 0.46 0.68
74 30 0.05 0.09 0.14 0.25 0.38
74 30 0.05 0.08 0.12 0.22 0.33
74 30 0.03 0.05 0.08 0.13 0.2
75 30 0.17 0.23 0.33 0.49 0.64
75 30 0.31 0.45 0.61 0.93 1.16
75 30 0.46 0.64 0.9 1.26 1.62
75 30 0.31 0.46 0.65 1 1.3
75 30 0.11 0.18 0.29 0.5 0.72
75 30 0.07 0.11 0.18 0.31 0.46
75 30 0.06 0.1 0.16 0.28 0.42
75 30 0.04 0.06 0.09 0.16 0.22
76 30 0.16 0.23 0.33 0.49 0.64
76 30 0.29 0.43 0.6 0.92 1.16
76 30 0.44 0.62 0.88 1.25 1.62
76 30 0.3 0.45 0.65 1.01 1.32
76 30 0.11 0.18 0.29 0.51 0.75
76 30 0.07 0.11 0.18 0.32 0.47
76 30 0.06 0.1 0.16 0.29 0.44
76 30 0.04 0.06 0.09 0.16 0.23
77 30 0.15 0.22 0.31 0.47 0.62
77 30 0.27 0.41 0.57 0.88 1.12
77 30 0.41 0.59 0.83 1.2 1.55
77 30 0.29 0.44 0.63 0.98 1.28
77 30 0.11 0.18 0.29 0.5 0.74
77 30 0.06 0.11 0.18 0.32 0.47
77 30 0.06 0.1 0.17 0.29 0.44
77 30 0.04 0.06 0.09 0.16 0.23
78 30 0.09 0.14 0.2 0.33 0.45
78 30 0.17 0.25 0.38 0.59 0.82
78 30 0.25 0.38 0.54 0.87 1.13
78 30 0.18 0.27 0.41 0.66 0.94
78 30 0.06 0.1 0.17 0.31 0.48
78 30 0.03 0.06 0.1 0.2 0.3
78 30 0.03 0.05 0.09 0.18 0.28
78 30 0.02 0.03 0.06 0.1 0.15
60 31 0.42 0.7 1.13 2.05 2.96
60 31 0.89 1.5 2.49 4.6 6.71
60 31 1.12 1.82 2.88 5.12 7.24
60 31 0.59 0.95 1.46 2.52 3.67
60 31 0.18 0.3 0.47 0.81 1.21
60 31 0.09 0.15 0.24 0.41 0.61
60 31 0.08 0.12 0.19 0.34 0.5
60 31 0.05 0.08 0.13 0.23 0.35
61 31 0.68 1.12 1.77 3 4.33
61 31 1.46 2.47 3.94 6.79 9.81
61 31 1.77 2.84 4.43 7.3 10.42
61 31 0.91 1.42 2.21 3.71 5.42
61 31 0.27 0.44 0.68 1.19 1.78
61 31 0.13 0.22 0.34 0.59 0.9
61 31 0.11 0.18 0.27 0.48 0.73
61 31 0.08 0.12 0.19 0.34 0.53
62 31 0.62 1.05 1.7 2.93 4.23

134
Long (E) Lat (N) 50 Years 100 Years 200 Years 500 Years 1000 Years
62 31 1.32 2.33 3.82 6.67 9.61
62 31 1.6 2.66 4.24 7.13 10.22
62 31 0.83 1.32 2.08 3.56 5.27
62 31 0.25 0.41 0.64 1.12 1.68
62 31 0.13 0.2 0.32 0.56 0.84
62 31 0.1 0.17 0.26 0.45 0.69
62 31 0.07 0.11 0.18 0.32 0.49
63 31 0.36 0.54 0.78 1.23 1.69
63 31 0.73 1.11 1.64 2.63 3.63
63 31 0.97 1.42 2.07 3.19 4.39
63 31 0.56 0.82 1.16 1.79 2.43
63 31 0.19 0.28 0.42 0.68 0.96
63 31 0.1 0.16 0.23 0.37 0.52
63 31 0.09 0.13 0.2 0.32 0.45
63 31 0.06 0.09 0.13 0.21 0.29
64 31 0.28 0.4 0.54 0.79 1.05
64 31 0.55 0.77 1.05 1.53 2.03
64 31 0.78 1.08 1.42 2.06 2.71
64 31 0.51 0.72 1 1.41 1.84
64 31 0.2 0.3 0.44 0.69 0.96
64 31 0.11 0.18 0.26 0.42 0.57
64 31 0.1 0.15 0.23 0.37 0.51
64 31 0.06 0.09 0.14 0.22 0.3
65 31 0.45 0.61 0.83 1.19 1.54
65 31 0.88 1.19 1.6 2.34 3.03
65 31 1.18 1.61 2.19 3.05 3.93
65 31 0.78 1.09 1.47 2.18 2.78
65 31 0.31 0.48 0.71 1.15 1.6
65 31 0.18 0.28 0.43 0.69 0.98
65 31 0.16 0.25 0.38 0.61 0.88
65 31 0.1 0.15 0.23 0.37 0.53
66 31 1.02 1.56 2.35 3.83 5.42
66 31 2.14 3.32 5.14 8.42 12.23
66 31 2.61 3.91 5.77 9.23 13.18
66 31 1.48 2.23 3.24 5.28 7.42
66 31 0.56 0.89 1.35 2.33 3.48
66 31 0.31 0.49 0.76 1.33 2.02
66 31 0.26 0.42 0.65 1.16 1.76
66 31 0.17 0.27 0.43 0.78 1.24
67 31 1.34 2.07 3.03 4.97 6.54
67 31 2.87 4.46 6.59 10.74 15.53
67 31 3.39 5.15 7.38 11.87 17
67 31 1.89 2.84 4.2 6.91 9.97
67 31 0.71 1.12 1.76 3.14 4.86
67 31 0.39 0.62 0.98 1.8 2.88
67 31 0.33 0.53 0.84 1.56 2.49
67 31 0.21 0.35 0.57 1.11 1.87
68 31 1.29 2.03 2.97 4.84 6.29
68 31 2.77 4.43 6.56 10.53 15.07
68 31 3.25 5.03 7.24 11.68 16.78
68 31 1.78 2.69 3.98 6.57 9.45
68 31 0.66 1.04 1.61 2.9 4.54
68 31 0.36 0.57 0.9 1.65 2.67
68 31 0.31 0.49 0.77 1.43 2.3
68 31 0.2 0.32 0.52 0.99 1.73
69 31 0.69 1.02 1.51 2.5 3.56
69 31 1.41 2.11 3.23 5.59 8.04
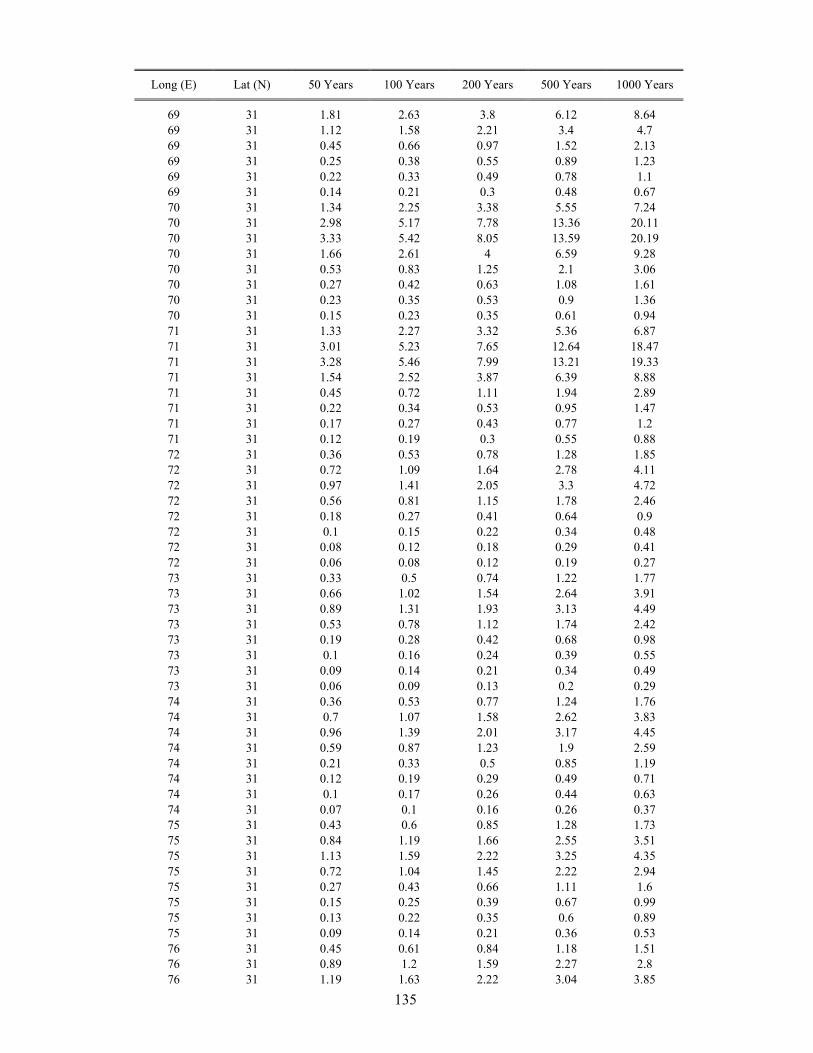
135
Long (E) Lat (N) 50 Years 100 Years 200 Years 500 Years 1000 Years
69 31 1.81 2.63 3.8 6.12 8.64
69 31 1.12 1.58 2.21 3.4 4.7
69 31 0.45 0.66 0.97 1.52 2.13
69 31 0.25 0.38 0.55 0.89 1.23
69 31 0.22 0.33 0.49 0.78 1.1
69 31 0.14 0.21 0.3 0.48 0.67
70 31 1.34 2.25 3.38 5.55 7.24
70 31 2.98 5.17 7.78 13.36 20.11
70 31 3.33 5.42 8.05 13.59 20.19
70 31 1.66 2.61 4 6.59 9.28
70 31 0.53 0.83 1.25 2.1 3.06
70 31 0.27 0.42 0.63 1.08 1.61
70 31 0.23 0.35 0.53 0.9 1.36
70 31 0.15 0.23 0.35 0.61 0.94
71 31 1.33 2.27 3.32 5.36 6.87
71 31 3.01 5.23 7.65 12.64 18.47
71 31 3.28 5.46 7.99 13.21 19.33
71 31 1.54 2.52 3.87 6.39 8.88
71 31 0.45 0.72 1.11 1.94 2.89
71 31 0.22 0.34 0.53 0.95 1.47
71 31 0.17 0.27 0.43 0.77 1.2
71 31 0.12 0.19 0.3 0.55 0.88
72 31 0.36 0.53 0.78 1.28 1.85
72 31 0.72 1.09 1.64 2.78 4.11
72 31 0.97 1.41 2.05 3.3 4.72
72 31 0.56 0.81 1.15 1.78 2.46
72 31 0.18 0.27 0.41 0.64 0.9
72 31 0.1 0.15 0.22 0.34 0.48
72 31 0.08 0.12 0.18 0.29 0.41
72 31 0.06 0.08 0.12 0.19 0.27
73 31 0.33 0.5 0.74 1.22 1.77
73 31 0.66 1.02 1.54 2.64 3.91
73 31 0.89 1.31 1.93 3.13 4.49
73 31 0.53 0.78 1.12 1.74 2.42
73 31 0.19 0.28 0.42 0.68 0.98
73 31 0.1 0.16 0.24 0.39 0.55
73 31 0.09 0.14 0.21 0.34 0.49
73 31 0.06 0.09 0.13 0.2 0.29
74 31 0.36 0.53 0.77 1.24 1.76
74 31 0.7 1.07 1.58 2.62 3.83
74 31 0.96 1.39 2.01 3.17 4.45
74 31 0.59 0.87 1.23 1.9 2.59
74 31 0.21 0.33 0.5 0.85 1.19
74 31 0.12 0.19 0.29 0.49 0.71
74 31 0.1 0.17 0.26 0.44 0.63
74 31 0.07 0.1 0.16 0.26 0.37
75 31 0.43 0.6 0.85 1.28 1.73
75 31 0.84 1.19 1.66 2.55 3.51
75 31 1.13 1.59 2.22 3.25 4.35
75 31 0.72 1.04 1.45 2.22 2.94
75 31 0.27 0.43 0.66 1.11 1.6
75 31 0.15 0.25 0.39 0.67 0.99
75 31 0.13 0.22 0.35 0.6 0.89
75 31 0.09 0.14 0.21 0.36 0.53
76 31 0.45 0.61 0.84 1.18 1.51
76 31 0.89 1.2 1.59 2.27 2.8
76 31 1.19 1.63 2.22 3.04 3.85

136
Long (E) Lat (N) 50 Years 100 Years 200 Years 500 Years 1000 Years
76 31 0.77 1.1 1.52 2.29 2.97
76 31 0.29 0.47 0.73 1.24 1.82
76 31 0.17 0.28 0.44 0.76 1.13
76 31 0.15 0.24 0.39 0.68 1.02
76 31 0.09 0.15 0.24 0.42 0.62
77 31 0.31 0.44 0.59 0.87 1.09
77 31 0.59 0.83 1.1 1.54 1.98
77 31 0.86 1.16 1.54 2.22 2.72
77 31 0.57 0.84 1.15 1.72 2.29
77 31 0.22 0.36 0.56 0.97 1.38
77 31 0.13 0.21 0.34 0.59 0.87
77 31 0.11 0.19 0.3 0.53 0.79
77 31 0.07 0.12 0.18 0.31 0.46
78 31 0.21 0.3 0.42 0.61 0.81
78 31 0.4 0.56 0.77 1.12 1.42
78 31 0.57 0.81 1.1 1.57 2.06
78 31 0.4 0.58 0.84 1.24 1.65
78 31 0.15 0.24 0.39 0.66 0.98
78 31 0.09 0.15 0.23 0.42 0.61
78 31 0.08 0.13 0.21 0.39 0.56
78 31 0.05 0.08 0.12 0.21 0.31
60 32 0.21 0.36 0.59 1.1 1.72
60 32 0.43 0.74 1.24 2.41 3.84
60 32 0.58 0.96 1.54 2.8 4.32
60 32 0.33 0.53 0.83 1.45 2.18
60 32 0.1 0.17 0.27 0.48 0.72
60 32 0.05 0.09 0.14 0.25 0.37
60 32 0.04 0.08 0.12 0.21 0.31
60 32 0.03 0.05 0.08 0.14 0.21
61 32 0.23 0.34 0.49 0.75 1.03
61 32 0.46 0.68 1 1.54 2.12
61 32 0.62 0.94 1.31 2.02 2.73
61 32 0.37 0.54 0.78 1.2 1.62
61 32 0.11 0.18 0.27 0.45 0.64
61 32 0.06 0.1 0.15 0.25 0.36
61 32 0.05 0.08 0.13 0.21 0.3
61 32 0.04 0.06 0.09 0.14 0.2
62 32 0.18 0.26 0.37 0.57 0.8
62 32 0.36 0.51 0.72 1.15 1.65
62 32 0.5 0.72 1.01 1.53 2.09
62 32 0.31 0.46 0.64 0.98 1.3
62 32 0.1 0.16 0.24 0.39 0.54
62 32 0.06 0.09 0.14 0.22 0.3
62 32 0.05 0.08 0.12 0.19 0.26
62 32 0.03 0.05 0.08 0.12 0.17
63 32 0.16 0.23 0.32 0.51 0.74
63 32 0.3 0.44 0.63 1.01 1.52
63 32 0.44 0.62 0.87 1.36 1.91
63 32 0.28 0.42 0.57 0.87 1.18
63 32 0.1 0.15 0.22 0.36 0.5
63 32 0.06 0.09 0.13 0.21 0.28
63 32 0.05 0.08 0.11 0.18 0.25
63 32 0.03 0.05 0.07 0.11 0.15
64 32 0.18 0.26 0.37 0.58 0.81
64 32 0.34 0.5 0.71 1.13 1.64
64 32 0.49 0.7 0.99 1.5 2.06
64 32 0.33 0.48 0.68 1.03 1.38

137
Long (E) Lat (N) 50 Years 100 Years 200 Years 500 Years 1000 Years
64 32 0.12 0.19 0.29 0.47 0.66
64 32 0.07 0.11 0.17 0.28 0.4
64 32 0.06 0.1 0.15 0.25 0.36
64 32 0.04 0.06 0.09 0.15 0.2
65 32 0.31 0.43 0.58 0.85 1.13
65 32 0.58 0.82 1.11 1.62 2.15
65 32 0.83 1.14 1.51 2.2 2.87
65 32 0.56 0.8 1.09 1.56 2.06
65 32 0.22 0.35 0.51 0.82 1.14
65 32 0.13 0.21 0.31 0.5 0.69
65 32 0.12 0.18 0.27 0.45 0.62
65 32 0.07 0.11 0.16 0.26 0.36
66 32 0.9 1.44 2.27 3.77 5.4
66 32 1.91 3.13 5.06 8.38 12.26
66 32 2.29 3.59 5.54 9.06 13.14
66 32 1.24 1.92 2.91 4.94 7.08
66 32 0.44 0.7 1.09 1.9 2.89
66 32 0.23 0.38 0.59 1.04 1.62
66 32 0.2 0.32 0.5 0.89 1.39
66 32 0.13 0.21 0.33 0.6 0.96
67 32 0.98 1.52 2.33 3.87 5.51
67 32 2.07 3.27 5.13 8.54 12.54
67 32 2.51 3.81 5.71 9.27 13.38
67 32 1.4 2.12 3.13 5.21 7.44
67 32 0.52 0.81 1.24 2.15 3.21
67 32 0.28 0.45 0.69 1.21 1.83
67 32 0.24 0.38 0.59 1.04 1.59
67 32 0.16 0.25 0.39 0.7 1.1
68 32 0.97 1.54 2.41 4.12 5.83
68 32 2.06 3.35 5.38 9.15 13.68
68 32 2.47 3.85 5.88 9.77 14.35
68 32 1.37 2.1 3.16 5.39 7.81
68 32 0.5 0.79 1.21 2.11 3.18
68 32 0.27 0.43 0.67 1.17 1.8
68 32 0.23 0.37 0.57 1.01 1.56
68 32 0.15 0.24 0.37 0.67 1.07
69 32 0.65 0.99 1.49 2.5 3.55
69 32 1.34 2.08 3.22 5.61 8.03
69 32 1.7 2.54 3.75 6.14 8.65
69 32 1.01 1.45 2.09 3.29 4.63
69 32 0.38 0.57 0.85 1.35 1.92
69 32 0.21 0.32 0.47 0.76 1.09
69 32 0.18 0.28 0.41 0.66 0.95
69 32 0.12 0.18 0.26 0.42 0.6
70 32 0.59 0.91 1.41 2.45 3.52
70 32 1.21 1.95 3.1 5.56 8
70 32 1.53 2.34 3.56 6 8.54
70 32 0.89 1.3 1.89 3.07 4.42
70 32 0.32 0.48 0.71 1.14 1.62
70 32 0.18 0.26 0.39 0.62 0.88
70 32 0.15 0.23 0.33 0.54 0.76
70 32 0.1 0.14 0.21 0.34 0.49
71 32 0.55 0.88 1.39 2.44 3.51
71 32 1.15 1.91 3.07 5.56 7.99
71 32 1.45 2.27 3.51 5.99 8.53
71 32 0.8 1.2 1.8 2.99 4.35
71 32 0.26 0.41 0.61 1.01 1.45

138
Long (E) Lat (N) 50 Years 100 Years 200 Years 500 Years 1000 Years
71 32 0.14 0.21 0.32 0.52 0.76
71 32 0.12 0.18 0.27 0.44 0.63
71 32 0.08 0.12 0.18 0.29 0.43
72 32 0.5 0.79 1.24 2.21 3.16
72 32 1.04 1.7 2.73 5.03 7.26
72 32 1.31 2.05 3.14 5.43 7.71
72 32 0.73 1.11 1.63 2.69 3.87
72 32 0.25 0.38 0.56 0.93 1.32
72 32 0.13 0.2 0.3 0.49 0.7
72 32 0.11 0.17 0.26 0.42 0.6
72 32 0.07 0.11 0.16 0.26 0.38
73 32 0.52 0.82 1.27 2.22 3.16
73 32 1.08 1.74 2.76 5.03 7.25
73 32 1.37 2.12 3.2 5.44 7.71
73 32 0.8 1.19 1.74 2.8 3.96
73 32 0.28 0.44 0.66 1.09 1.53
73 32 0.16 0.24 0.37 0.61 0.87
73 32 0.13 0.21 0.32 0.53 0.77
73 32 0.09 0.13 0.2 0.32 0.46
74 32 0.63 0.94 1.38 2.29 3.23
74 32 1.27 1.93 2.93 5.09 7.27
74 32 1.64 2.41 3.48 5.62 7.86
74 32 1.01 1.45 2.08 3.19 4.38
74 32 0.39 0.59 0.91 1.46 2.1
74 32 0.22 0.34 0.52 0.87 1.24
74 32 0.19 0.3 0.46 0.77 1.11
74 32 0.12 0.18 0.28 0.47 0.67
75 32 1.6 2.51 3.7 5.8 7.49
75 32 3.53 5.66 8.27 13.67 19.98
75 32 3.97 6.1 8.91 14.69 21.46
75 32 2.07 3.16 4.81 7.91 11.46
75 32 0.69 1.12 1.78 3.3 5.27
75 32 0.36 0.59 0.97 1.87 3.15
75 32 0.3 0.5 0.83 1.62 2.76
75 32 0.2 0.33 0.56 1.15 2.07
76 32 1.79 2.71 3.95 6.01 7.75
76 32 3.94 6.03 8.7 14.13 20.39
76 32 4.47 6.61 9.53 15.45 22.27
76 32 2.34 3.53 5.31 8.67 12.56
76 32 0.78 1.27 2.05 3.89 6.3
76 32 0.4 0.68 1.13 2.24 3.87
76 32 0.33 0.57 0.96 1.94 3.41
76 32 0.23 0.39 0.67 1.45 2.68
77 32 1.73 2.68 3.96 6.1 7.95
77 32 3.83 6 8.79 14.56 21.33
77 32 4.29 6.5 9.5 15.68 22.91
77 32 2.2 3.38 5.19 8.59 12.57
77 32 0.7 1.15 1.87 3.56 5.8
77 32 0.35 0.6 1 2.01 3.49
77 32 0.29 0.5 0.85 1.74 3.07
77 32 0.2 0.34 0.59 1.27 2.37
78 32 0.59 0.9 1.28 2.03 2.73
78 32 1.22 1.87 2.71 4.28 5.8
78 32 1.54 2.32 3.28 5.18 6.88
78 32 0.9 1.32 1.93 3.02 4.19
78 32 0.31 0.5 0.79 1.39 2.12
78 32 0.17 0.28 0.45 0.81 1.26
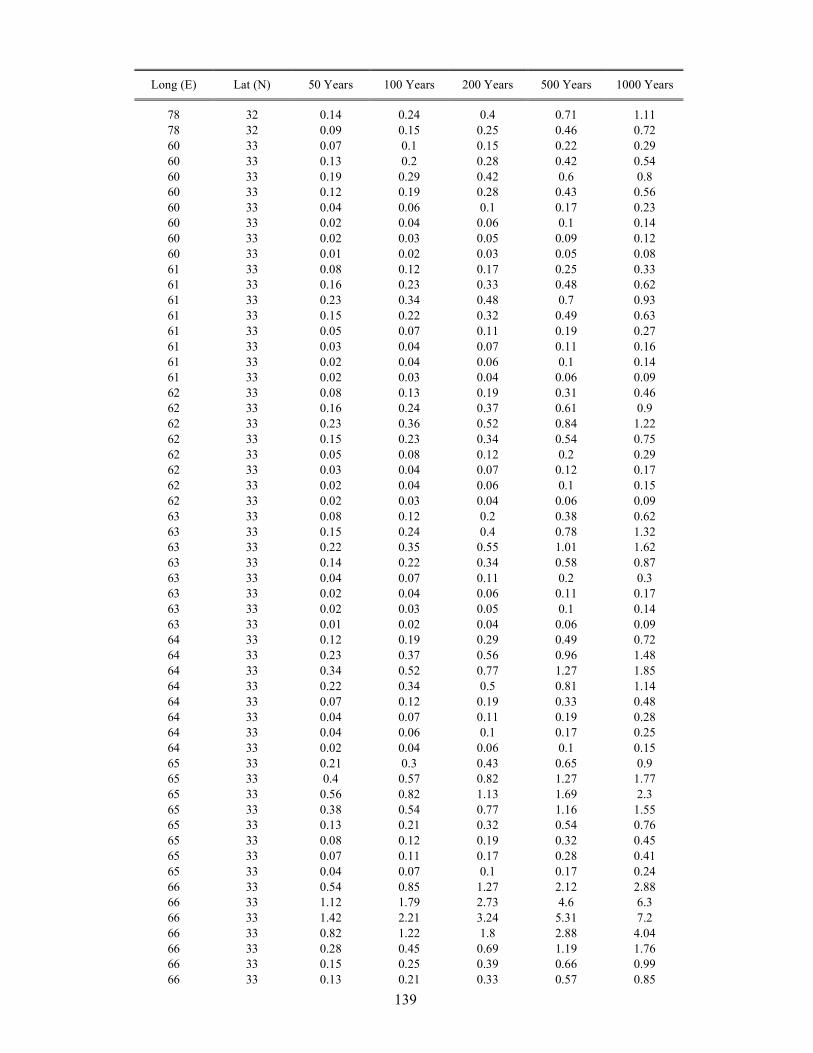
139
Long (E) Lat (N) 50 Years 100 Years 200 Years 500 Years 1000 Years
78 32 0.14 0.24 0.4 0.71 1.11
78 32 0.09 0.15 0.25 0.46 0.72
60 33 0.07 0.1 0.15 0.22 0.29
60 33 0.13 0.2 0.28 0.42 0.54
60 33 0.19 0.29 0.42 0.6 0.8
60 33 0.12 0.19 0.28 0.43 0.56
60 33 0.04 0.06 0.1 0.17 0.23
60 33 0.02 0.04 0.06 0.1 0.14
60 33 0.02 0.03 0.05 0.09 0.12
60 33 0.01 0.02 0.03 0.05 0.08
61 33 0.08 0.12 0.17 0.25 0.33
61 33 0.16 0.23 0.33 0.48 0.62
61 33 0.23 0.34 0.48 0.7 0.93
61 33 0.15 0.22 0.32 0.49 0.63
61 33 0.05 0.07 0.11 0.19 0.27
61 33 0.03 0.04 0.07 0.11 0.16
61 33 0.02 0.04 0.06 0.1 0.14
61 33 0.02 0.03 0.04 0.06 0.09
62 33 0.08 0.13 0.19 0.31 0.46
62 33 0.16 0.24 0.37 0.61 0.9
62 33 0.23 0.36 0.52 0.84 1.22
62 33 0.15 0.23 0.34 0.54 0.75
62 33 0.05 0.08 0.12 0.2 0.29
62 33 0.03 0.04 0.07 0.12 0.17
62 33 0.02 0.04 0.06 0.1 0.15
62 33 0.02 0.03 0.04 0.06 0.09
63 33 0.08 0.12 0.2 0.38 0.62
63 33 0.15 0.24 0.4 0.78 1.32
63 33 0.22 0.35 0.55 1.01 1.62
63 33 0.14 0.22 0.34 0.58 0.87
63 33 0.04 0.07 0.11 0.2 0.3
63 33 0.02 0.04 0.06 0.11 0.17
63 33 0.02 0.03 0.05 0.1 0.14
63 33 0.01 0.02 0.04 0.06 0.09
64 33 0.12 0.19 0.29 0.49 0.72
64 33 0.23 0.37 0.56 0.96 1.48
64 33 0.34 0.52 0.77 1.27 1.85
64 33 0.22 0.34 0.5 0.81 1.14
64 33 0.07 0.12 0.19 0.33 0.48
64 33 0.04 0.07 0.11 0.19 0.28
64 33 0.04 0.06 0.1 0.17 0.25
64 33 0.02 0.04 0.06 0.1 0.15
65 33 0.21 0.3 0.43 0.65 0.9
65 33 0.4 0.57 0.82 1.27 1.77
65 33 0.56 0.82 1.13 1.69 2.3
65 33 0.38 0.54 0.77 1.16 1.55
65 33 0.13 0.21 0.32 0.54 0.76
65 33 0.08 0.12 0.19 0.32 0.45
65 33 0.07 0.11 0.17 0.28 0.41
65 33 0.04 0.07 0.1 0.17 0.24
66 33 0.54 0.85 1.27 2.12 2.88
66 33 1.12 1.79 2.73 4.6 6.3
66 33 1.42 2.21 3.24 5.31 7.2
66 33 0.82 1.22 1.8 2.88 4.04
66 33 0.28 0.45 0.69 1.19 1.76
66 33 0.15 0.25 0.39 0.66 0.99
66 33 0.13 0.21 0.33 0.57 0.85

140
Long (E) Lat (N) 50 Years 100 Years 200 Years 500 Years 1000 Years
66 33 0.09 0.14 0.21 0.37 0.58
67 33 0.97 1.54 2.41 4.13 5.9
67 33 2.06 3.33 5.34 9.17 13.79
67 33 2.47 3.85 5.87 9.77 14.38
67 33 1.36 2.09 3.17 5.44 7.94
67 33 0.49 0.78 1.21 2.11 3.17
67 33 0.26 0.43 0.66 1.16 1.77
67 33 0.23 0.37 0.57 1 1.53
67 33 0.14 0.23 0.36 0.66 1.06
68 33 0.97 1.5 2.29 3.64 5.16
68 33 2.06 3.25 5.09 8.03 11.33
68 33 2.47 3.77 5.63 8.89 12.57
68 33 1.33 2.03 2.99 4.93 6.95
68 33 0.47 0.73 1.13 1.97 3
68 33 0.25 0.39 0.61 1.09 1.68
68 33 0.21 0.33 0.52 0.92 1.43
68 33 0.14 0.22 0.35 0.64 1.03
69 33 0.96 1.56 2.45 4.08 5.67
69 33 2.06 3.41 5.5 9.12 13.36
69 33 2.45 3.88 5.95 9.79 14.26
69 33 1.3 2.03 3.07 5.25 7.47
69 33 0.44 0.7 1.1 1.94 2.98
69 33 0.23 0.37 0.58 1.04 1.64
69 33 0.19 0.31 0.49 0.88 1.4
69 33 0.13 0.21 0.33 0.61 1
70 33 0.62 0.96 1.47 2.5 3.58
70 33 1.29 2.05 3.19 5.61 8.09
70 33 1.63 2.48 3.71 6.13 8.68
70 33 0.94 1.37 2.01 3.24 4.63
70 33 0.33 0.5 0.75 1.24 1.78
70 33 0.18 0.27 0.41 0.68 0.98
70 33 0.15 0.23 0.35 0.58 0.84
70 33 0.1 0.15 0.23 0.38 0.56
71 33 0.56 0.9 1.39 2.43 3.49
71 33 1.18 1.92 3.07 5.53 7.96
71 33 1.48 2.3 3.52 5.97 8.49
71 33 0.84 1.25 1.85 3.03 4.37
71 33 0.29 0.45 0.66 1.1 1.57
71 33 0.16 0.24 0.36 0.59 0.85
71 33 0.13 0.21 0.31 0.51 0.73
71 33 0.09 0.13 0.19 0.32 0.47
72 33 0.53 0.82 1.27 2.21 3.18
72 33 1.09 1.74 2.76 5.01 7.28
72 33 1.39 2.12 3.2 5.44 7.73
72 33 0.82 1.21 1.75 2.81 3.98
72 33 0.3 0.46 0.67 1.09 1.54
72 33 0.17 0.25 0.38 0.61 0.88
72 33 0.14 0.22 0.33 0.54 0.77
72 33 0.09 0.13 0.2 0.32 0.46
73 33 0.61 0.92 1.36 2.27 3.22
73 33 1.24 1.89 2.88 5.07 7.3
73 33 1.6 2.35 3.42 5.57 7.83
73 33 0.99 1.42 2.03 3.12 4.31
73 33 0.39 0.59 0.89 1.42 2.02
73 33 0.22 0.34 0.51 0.84 1.19
73 33 0.19 0.3 0.45 0.75 1.07
73 33 0.12 0.18 0.27 0.45 0.63
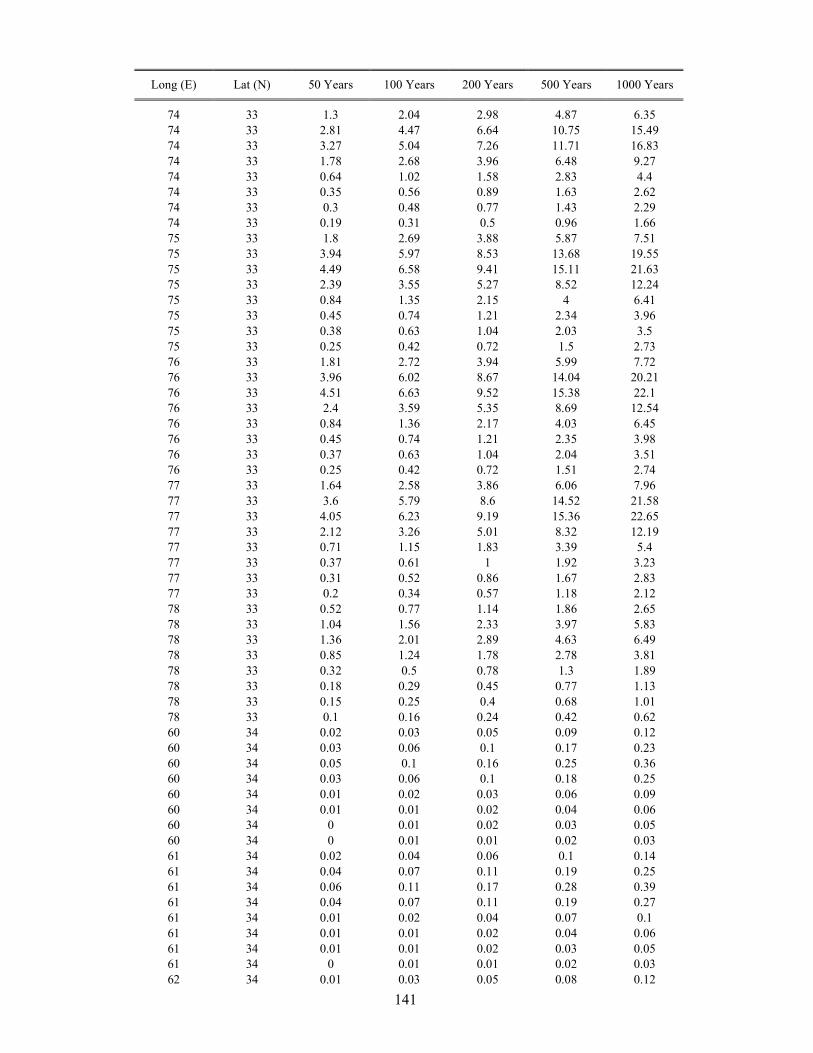
141
Long (E) Lat (N) 50 Years 100 Years 200 Years 500 Years 1000 Years
74 33 1.3 2.04 2.98 4.87 6.35
74 33 2.81 4.47 6.64 10.75 15.49
74 33 3.27 5.04 7.26 11.71 16.83
74 33 1.78 2.68 3.96 6.48 9.27
74 33 0.64 1.02 1.58 2.83 4.4
74 33 0.35 0.56 0.89 1.63 2.62
74 33 0.3 0.48 0.77 1.43 2.29
74 33 0.19 0.31 0.5 0.96 1.66
75 33 1.8 2.69 3.88 5.87 7.51
75 33 3.94 5.97 8.53 13.68 19.55
75 33 4.49 6.58 9.41 15.11 21.63
75 33 2.39 3.55 5.27 8.52 12.24
75 33 0.84 1.35 2.15 4 6.41
75 33 0.45 0.74 1.21 2.34 3.96
75 33 0.38 0.63 1.04 2.03 3.5
75 33 0.25 0.42 0.72 1.5 2.73
76 33 1.81 2.72 3.94 5.99 7.72
76 33 3.96 6.02 8.67 14.04 20.21
76 33 4.51 6.63 9.52 15.38 22.1
76 33 2.4 3.59 5.35 8.69 12.54
76 33 0.84 1.36 2.17 4.03 6.45
76 33 0.45 0.74 1.21 2.35 3.98
76 33 0.37 0.63 1.04 2.04 3.51
76 33 0.25 0.42 0.72 1.51 2.74
77 33 1.64 2.58 3.86 6.06 7.96
77 33 3.6 5.79 8.6 14.52 21.58
77 33 4.05 6.23 9.19 15.36 22.65
77 33 2.12 3.26 5.01 8.32 12.19
77 33 0.71 1.15 1.83 3.39 5.4
77 33 0.37 0.61 1 1.92 3.23
77 33 0.31 0.52 0.86 1.67 2.83
77 33 0.2 0.34 0.57 1.18 2.12
78 33 0.52 0.77 1.14 1.86 2.65
78 33 1.04 1.56 2.33 3.97 5.83
78 33 1.36 2.01 2.89 4.63 6.49
78 33 0.85 1.24 1.78 2.78 3.81
78 33 0.32 0.5 0.78 1.3 1.89
78 33 0.18 0.29 0.45 0.77 1.13
78 33 0.15 0.25 0.4 0.68 1.01
78 33 0.1 0.16 0.24 0.42 0.62
60 34 0.02 0.03 0.05 0.09 0.12
60 34 0.03 0.06 0.1 0.17 0.23
60 34 0.05 0.1 0.16 0.25 0.36
60 34 0.03 0.06 0.1 0.18 0.25
60 34 0.01 0.02 0.03 0.06 0.09
60 34 0.01 0.01 0.02 0.04 0.06
60 34 0 0.01 0.02 0.03 0.05
60 34 0 0.01 0.01 0.02 0.03
61 34 0.02 0.04 0.06 0.1 0.14
61 34 0.04 0.07 0.11 0.19 0.25
61 34 0.06 0.11 0.17 0.28 0.39
61 34 0.04 0.07 0.11 0.19 0.27
61 34 0.01 0.02 0.04 0.07 0.1
61 34 0.01 0.01 0.02 0.04 0.06
61 34 0.01 0.01 0.02 0.03 0.05
61 34 0 0.01 0.01 0.02 0.03
62 34 0.01 0.03 0.05 0.08 0.12

142
Long (E) Lat (N) 50 Years 100 Years 200 Years 500 Years 1000 Years
62 34 0.02 0.05 0.09 0.17 0.23
62 34 0.03 0.07 0.13 0.24 0.35
62 34 0.01 0.04 0.08 0.15 0.22
62 34 0.01 0.01 0.02 0.05 0.07
62 34 0 0.01 0.01 0.03 0.04
62 34 0 0.01 0.01 0.02 0.03
62 34 0 0 0.01 0.02 0.02
63 34 0.02 0.04 0.07 0.13 0.19
63 34 0.03 0.08 0.14 0.25 0.38
63 34 0.05 0.11 0.2 0.37 0.52
63 34 0.03 0.06 0.11 0.22 0.32
63 34 0.01 0.02 0.03 0.07 0.1
63 34 0 0.01 0.02 0.04 0.06
63 34 0 0.01 0.02 0.03 0.05
63 34 0 0.01 0.01 0.02 0.03
64 34 0.07 0.12 0.18 0.32 0.48
64 34 0.14 0.22 0.35 0.62 0.94
64 34 0.2 0.33 0.5 0.85 1.25
64 34 0.13 0.21 0.33 0.55 0.79
64 34 0.04 0.07 0.12 0.21 0.32
64 34 0.02 0.04 0.07 0.12 0.19
64 34 0.02 0.03 0.06 0.11 0.17
64 34 0.01 0.02 0.04 0.07 0.1
65 34 0.26 0.38 0.51 0.76 1.02
65 34 0.49 0.69 0.97 1.43 1.92
65 34 0.7 0.99 1.32 1.91 2.54
65 34 0.51 0.73 1.01 1.44 1.88
65 34 0.21 0.33 0.49 0.79 1.09
65 34 0.13 0.2 0.3 0.49 0.67
65 34 0.11 0.18 0.27 0.45 0.62
65 34 0.07 0.11 0.16 0.25 0.34
66 34 0.45 0.59 0.78 1.09 1.37
66 34 0.83 1.1 1.41 1.97 2.56
66 34 1.15 1.51 1.98 2.69 3.36
66 34 0.88 1.17 1.53 2.17 2.68
66 34 0.41 0.6 0.87 1.31 1.78
66 34 0.25 0.38 0.53 0.83 1.12
66 34 0.23 0.34 0.49 0.76 1.04
66 34 0.13 0.19 0.27 0.42 0.56
67 34 0.79 1.18 1.76 2.86 4.05
67 34 1.59 2.42 3.77 6.35 8.94
67 34 2.02 2.96 4.36 7 9.89
67 34 1.31 1.85 2.58 3.98 5.53
67 34 0.59 0.87 1.25 1.99 2.81
67 34 0.35 0.52 0.75 1.19 1.68
67 34 0.31 0.47 0.67 1.07 1.51
67 34 0.19 0.27 0.4 0.64 0.92
68 34 1.03 1.56 2.34 3.75 5.27
68 34 2.14 3.35 5.21 8.29 11.79
68 34 2.61 3.9 5.74 9.13 12.97
68 34 1.57 2.26 3.21 5.09 7.12
68 34 0.68 1.02 1.46 2.37 3.44
68 34 0.41 0.59 0.86 1.4 2.01
68 34 0.36 0.53 0.77 1.24 1.79
68 34 0.21 0.31 0.46 0.77 1.17
69 34 1.01 1.52 2.26 3.5 4.87
69 34 2.12 3.26 4.99 7.68 10.59

143
Long (E) Lat (N) 50 Years 100 Years 200 Years 500 Years 1000 Years
69 34 2.56 3.81 5.57 8.63 12
69 34 1.49 2.16 3.06 4.85 6.75
69 34 0.61 0.93 1.35 2.22 3.25
69 34 0.36 0.53 0.78 1.29 1.88
69 34 0.31 0.47 0.69 1.14 1.66
69 34 0.19 0.28 0.42 0.72 1.11
70 34 0.97 1.48 2.25 3.51 4.92
70 34 2.06 3.22 5 7.73 10.71
70 34 2.45 3.73 5.55 8.64 12.09
70 34 1.37 2.03 2.95 4.78 6.7
70 34 0.53 0.8 1.2 2.01 3
70 34 0.29 0.45 0.67 1.14 1.71
70 34 0.25 0.39 0.59 0.99 1.49
70 34 0.16 0.24 0.37 0.65 1.01
71 34 0.66 0.99 1.49 2.49 3.55
71 34 1.35 2.07 3.2 5.59 8.03
71 34 1.71 2.53 3.74 6.11 8.63
71 34 1.05 1.49 2.13 3.32 4.65
71 34 0.42 0.62 0.92 1.45 2.04
71 34 0.24 0.36 0.52 0.84 1.18
71 34 0.21 0.32 0.47 0.75 1.05
71 34 0.13 0.19 0.28 0.45 0.63
72 34 0.6 0.89 1.31 2.18 3
72 34 1.2 1.84 2.81 4.87 6.82
72 34 1.55 2.28 3.32 5.38 7.41
72 34 0.97 1.37 1.93 2.94 4
72 34 0.38 0.56 0.83 1.31 1.84
72 34 0.21 0.33 0.48 0.77 1.08
72 34 0.19 0.29 0.43 0.69 0.97
72 34 0.12 0.17 0.25 0.41 0.58
73 34 1 1.46 2.12 3.25 4.48
73 34 2.11 3.11 4.55 7.03 9.61
73 34 2.56 3.71 5.32 8.06 11.03
73 34 1.45 2.13 3.01 4.75 6.62
73 34 0.54 0.84 1.29 2.24 3.39
73 34 0.3 0.47 0.74 1.31 2
73 34 0.26 0.41 0.64 1.15 1.76
73 34 0.17 0.26 0.41 0.76 1.22
74 34 1.78 2.68 3.86 5.86 7.49
74 34 3.9 5.94 8.5 13.65 19.52
74 34 4.45 6.54 9.37 15.07 21.6
74 34 2.36 3.52 5.24 8.47 12.19
74 34 0.83 1.32 2.11 3.94 6.32
74 34 0.44 0.72 1.18 2.29 3.9
74 34 0.37 0.61 1.01 1.99 3.44
74 34 0.25 0.41 0.7 1.47 2.69
75 34 1.81 2.7 3.89 5.88 7.51
75 34 3.96 5.99 8.56 13.71 19.57
75 34 4.51 6.6 9.44 15.15 21.66
75 34 2.41 3.58 5.29 8.53 12.23
75 34 0.86 1.37 2.18 4.03 6.46
75 34 0.46 0.75 1.23 2.36 3.99
75 34 0.39 0.64 1.06 2.05 3.53
75 34 0.26 0.43 0.73 1.52 2.75
76 34 1.71 2.62 3.82 5.87 7.55
76 34 3.76 5.87 8.48 13.8 19.95
76 34 4.24 6.37 9.22 15.04 21.78
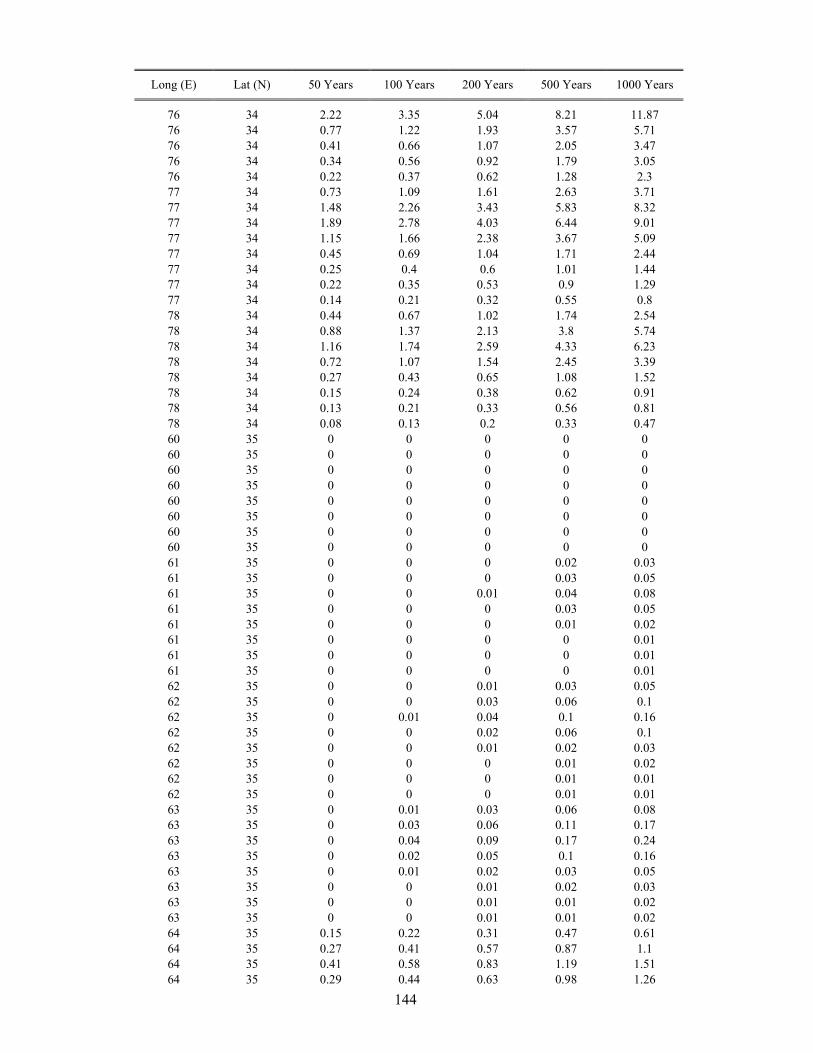
144
Long (E) Lat (N) 50 Years 100 Years 200 Years 500 Years 1000 Years
76 34 2.22 3.35 5.04 8.21 11.87
76 34 0.77 1.22 1.93 3.57 5.71
76 34 0.41 0.66 1.07 2.05 3.47
76 34 0.34 0.56 0.92 1.79 3.05
76 34 0.22 0.37 0.62 1.28 2.3
77 34 0.73 1.09 1.61 2.63 3.71
77 34 1.48 2.26 3.43 5.83 8.32
77 34 1.89 2.78 4.03 6.44 9.01
77 34 1.15 1.66 2.38 3.67 5.09
77 34 0.45 0.69 1.04 1.71 2.44
77 34 0.25 0.4 0.6 1.01 1.44
77 34 0.22 0.35 0.53 0.9 1.29
77 34 0.14 0.21 0.32 0.55 0.8
78 34 0.44 0.67 1.02 1.74 2.54
78 34 0.88 1.37 2.13 3.8 5.74
78 34 1.16 1.74 2.59 4.33 6.23
78 34 0.72 1.07 1.54 2.45 3.39
78 34 0.27 0.43 0.65 1.08 1.52
78 34 0.15 0.24 0.38 0.62 0.91
78 34 0.13 0.21 0.33 0.56 0.81
78 34 0.08 0.13 0.2 0.33 0.47
60 35 0 0 0 0 0
60 35 0 0 0 0 0
60 35 0 0 0 0 0
60 35 0 0 0 0 0
60 35 0 0 0 0 0
60 35 0 0 0 0 0
60 35 0 0 0 0 0
60 35 0 0 0 0 0
61 35 0 0 0 0.02 0.03
61 35 0 0 0 0.03 0.05
61 35 0 0 0.01 0.04 0.08
61 35 0 0 0 0.03 0.05
61 35 0 0 0 0.01 0.02
61 35 0 0 0 0 0.01
61 35 0 0 0 0 0.01
61 35 0 0 0 0 0.01
62 35 0 0 0.01 0.03 0.05
62 35 0 0 0.03 0.06 0.1
62 35 0 0.01 0.04 0.1 0.16
62 35 0 0 0.02 0.06 0.1
62 35 0 0 0.01 0.02 0.03
62 35 0 0 0 0.01 0.02
62 35 0 0 0 0.01 0.01
62 35 0 0 0 0.01 0.01
63 35 0 0.01 0.03 0.06 0.08
63 35 0 0.03 0.06 0.11 0.17
63 35 0 0.04 0.09 0.17 0.24
63 35 0 0.02 0.05 0.1 0.16
63 35 0 0.01 0.02 0.03 0.05
63 35 0 0 0.01 0.02 0.03
63 35 0 0 0.01 0.01 0.02
63 35 0 0 0.01 0.01 0.02
64 35 0.15 0.22 0.31 0.47 0.61
64 35 0.27 0.41 0.57 0.87 1.1
64 35 0.41 0.58 0.83 1.19 1.51
64 35 0.29 0.44 0.63 0.98 1.26

145
Long (E) Lat (N) 50 Years 100 Years 200 Years 500 Years 1000 Years
64 35 0.11 0.19 0.3 0.51 0.73
64 35 0.07 0.11 0.19 0.32 0.47
64 35 0.06 0.1 0.17 0.3 0.44
64 35 0.04 0.06 0.09 0.16 0.22
65 35 0.42 0.55 0.71 0.98 1.17
65 35 0.76 1.01 1.27 1.7 2.13
65 35 1.08 1.4 1.8 2.4 2.85
65 35 0.84 1.12 1.46 2.07 2.53
65 35 0.4 0.58 0.85 1.29 1.75
65 35 0.24 0.37 0.53 0.83 1.12
65 35 0.22 0.34 0.49 0.76 1.04
65 35 0.13 0.19 0.27 0.42 0.56
66 35 1.06 1.48 2.08 3.07 4.11
66 35 2.11 2.96 4.11 6.05 7.8
66 35 2.69 3.77 5.26 7.7 10.28
66 35 1.8 2.54 3.5 5.37 7.52
66 35 0.83 1.26 1.88 3.2 4.78
66 35 0.49 0.75 1.14 1.93 2.97
66 35 0.44 0.67 1.01 1.72 2.63
66 35 0.27 0.42 0.65 1.17 1.88
67 35 1.16 1.54 2.04 2.87 3.7
67 35 2.26 2.94 3.83 5.38 6.74
67 35 2.96 3.92 5.19 7.18 9.19
67 35 2.14 2.85 3.8 5.55 7.43
67 35 1.05 1.56 2.29 3.73 5.41
67 35 0.63 0.96 1.4 2.32 3.42
67 35 0.56 0.85 1.25 2.06 3.05
67 35 0.36 0.54 0.82 1.42 2.16
68 35 1.16 1.62 2.29 3.82 5.49
68 35 2.22 3.23 4.69 8.15 12.49
68 35 2.93 4.02 5.58 8.97 12.84
68 35 2.07 2.81 3.82 5.76 7.98
68 35 1.04 1.51 2.17 3.37 4.7
68 35 0.63 0.93 1.32 2.08 2.93
68 35 0.56 0.83 1.19 1.88 2.65
68 35 0.34 0.51 0.73 1.2 1.74
69 35 1.22 1.78 2.59 4.25 5.82
69 35 2.43 3.72 5.62 9.37 13.79
69 35 3.07 4.38 6.28 10.12 14.52
69 35 2.02 2.8 3.84 5.88 8.16
69 35 1 1.42 2.03 3.19 4.47
69 35 0.59 0.87 1.23 1.94 2.76
69 35 0.53 0.77 1.11 1.75 2.48
69 35 0.32 0.47 0.67 1.1 1.62
70 35 1.14 1.72 2.54 4.16 5.73
70 35 2.32 3.64 5.6 9.23 13.47
70 35 2.88 4.24 6.16 9.98 14.37
70 35 1.82 2.57 3.6 5.62 7.86
70 35 0.84 1.23 1.76 2.82 4
70 35 0.5 0.73 1.06 1.69 2.42
70 35 0.44 0.65 0.95 1.51 2.15
70 35 0.27 0.39 0.57 0.94 1.42
71 35 1.03 1.6 2.44 4.09 5.7
71 35 2.11 3.42 5.47 9.17 13.54
71 35 2.61 3.95 5.91 9.77 14.28
71 35 1.62 2.31 3.31 5.31 7.5
71 35 0.72 1.06 1.51 2.43 3.47

146
Long (E) Lat (N) 50 Years 100 Years 200 Years 500 Years 1000 Years
71 35 0.43 0.62 0.9 1.44 2.05
71 35 0.38 0.55 0.8 1.29 1.83
71 35 0.22 0.33 0.48 0.78 1.17
72 35 0.86 1.25 1.84 2.98 4.26
72 35 1.73 2.59 3.95 6.63 9.57
72 35 2.19 3.16 4.56 7.26 10.27
72 35 1.41 1.95 2.7 4.13 5.68
72 35 0.63 0.93 1.3 2.03 2.81
72 35 0.38 0.55 0.78 1.22 1.68
72 35 0.34 0.49 0.7 1.1 1.52
72 35 0.2 0.28 0.41 0.64 0.91
73 35 1.75 2.66 3.86 5.9 7.57
73 35 3.86 5.94 8.55 13.83 19.89
73 35 4.35 6.48 9.34 15.17 21.88
73 35 2.27 3.41 5.11 8.35 12.1
73 35 0.81 1.26 1.96 3.64 5.87
73 35 0.44 0.69 1.09 2.07 3.56
73 35 0.38 0.59 0.94 1.81 3.12
73 35 0.24 0.38 0.63 1.31 2.41
74 35 1.8 2.7 3.92 5.96 7.68
74 35 3.92 5.98 8.63 13.99 20.17
74 35 4.48 6.58 9.47 15.31 22.02
74 35 2.4 3.57 5.3 8.62 12.44
74 35 0.89 1.39 2.17 4 6.39
74 35 0.48 0.77 1.23 2.33 3.94
74 35 0.41 0.66 1.06 2.03 3.48
74 35 0.27 0.43 0.72 1.49 2.71
75 35 1.74 2.64 3.82 5.82 7.44
75 35 3.84 5.91 8.46 13.59 19.46
75 35 4.34 6.44 9.26 14.97 21.53
75 35 2.29 3.41 5.09 8.25 11.89
75 35 0.83 1.3 2.01 3.71 5.92
75 35 0.45 0.71 1.13 2.13 3.62
75 35 0.39 0.61 0.98 1.86 3.19
75 35 0.25 0.4 0.66 1.34 2.43
76 35 0.78 1.14 1.66 2.67 3.76
76 35 1.57 2.34 3.5 5.87 8.39
76 35 2.02 2.9 4.15 6.54 9.13
76 35 1.27 1.79 2.51 3.82 5.24
76 35 0.53 0.8 1.17 1.89 2.66
76 35 0.31 0.47 0.69 1.12 1.59
76 35 0.27 0.42 0.61 1.01 1.42
76 35 0.17 0.25 0.37 0.61 0.88
77 35 0.65 1 1.51 2.54 3.63
77 35 1.33 2.09 3.27 5.75 8.25
77 35 1.68 2.53 3.77 6.22 8.82
77 35 1.02 1.47 2.12 3.33 4.68
77 35 0.4 0.6 0.9 1.42 2.01
77 35 0.23 0.35 0.51 0.83 1.16
77 35 0.2 0.3 0.46 0.73 1.04
77 35 0.12 0.18 0.27 0.44 0.62
78 35 0.41 0.63 0.97 1.7 2.52
78 35 0.81 1.3 2.06 3.75 5.72
78 35 1.07 1.63 2.48 4.25 6.18
78 35 0.64 0.98 1.41 2.29 3.23
78 35 0.23 0.37 0.56 0.93 1.32
78 35 0.13 0.21 0.32 0.53 0.75

147
Long (E) Lat (N) 50 Years 100 Years 200 Years 500 Years 1000 Years
78 35 0.11 0.18 0.28 0.47 0.67
78 35 0.07 0.11 0.17 0.27 0.39
63 36 0 0 0 0.02 0.03
63 36 0 0 0 0.03 0.05
63 36 0 0 0.01 0.04 0.08
63 36 0 0 0 0.03 0.05
63 36 0 0 0 0.01 0.02
63 36 0 0 0 0 0.01
63 36 0 0 0 0 0.01
63 36 0 0 0 0 0.01
64 36 0.14 0.21 0.31 0.47 0.6
64 36 0.26 0.41 0.56 0.86 1.09
64 36 0.4 0.57 0.82 1.18 1.5
64 36 0.28 0.44 0.62 0.98 1.25
64 36 0.11 0.19 0.3 0.51 0.73
64 36 0.07 0.11 0.19 0.32 0.47
64 36 0.06 0.1 0.17 0.3 0.44
64 36 0.04 0.06 0.09 0.16 0.22
65 36 0.47 0.62 0.8 1.07 1.27
65 36 0.88 1.12 1.4 1.88 2.29
65 36 1.21 1.57 2.03 2.59 3.07
65 36 0.97 1.27 1.65 2.29 2.76
65 36 0.47 0.69 0.99 1.49 2.02
65 36 0.29 0.44 0.62 0.96 1.27
65 36 0.27 0.4 0.57 0.89 1.18
65 36 0.16 0.22 0.32 0.48 0.64
66 36 1.03 1.34 1.73 2.41 3.03
66 36 1.96 2.54 3.2 4.34 5.42
66 36 2.63 3.41 4.42 6.04 7.53
66 36 1.91 2.57 3.38 4.85 6.33
66 36 0.95 1.4 2.06 3.3 4.7
66 36 0.57 0.87 1.26 2.06 2.97
66 36 0.51 0.77 1.13 1.84 2.66
66 36 0.32 0.49 0.73 1.24 1.84
67 36 3.4 5.21 6.89 9.95 13.15
67 36 6.99 10.65 16.23 28.33 43.17
67 36 8.14 12.27 18.5 31.83 47.98
67 36 5.17 7.82 11.82 20.41 30.86
67 36 2.25 3.62 5.79 10.59 16.72
67 36 1.28 2.11 3.51 6.85 11.28
67 36 1.11 1.85 3.12 6.24 10.55
67 36 0.77 1.34 2.37 5.25 9.52
68 36 2.6 3.56 4.88 6.55 8.1
68 36 5.33 7.03 9.26 13.35 17.6
68 36 6.51 8.89 12.14 18.34 25.06
68 36 4.2 6.03 8.63 13.86 19.84
68 36 2.04 3.24 5.12 9.63 15.53
68 36 1.2 1.91 3.14 6.23 10.7
68 36 1.05 1.67 2.74 5.55 9.96
68 36 0.72 1.22 2.1 4.8 9.15
69 36 3.58 5.38 7.06 10.1 13.25
69 36 7.44 11.26 17.07 29.56 44.78
69 36 8.54 12.98 19.74 34.34 52.2
69 36 5.3 8.05 12.22 21.24 32.25
69 36 2.29 3.68 5.92 10.98 17.53
69 36 1.3 2.14 3.62 7.19 11.94
69 36 1.13 1.88 3.24 6.67 11.36

148
Long (E) Lat (N) 50 Years 100 Years 200 Years 500 Years 1000 Years
69 36 0.77 1.35 2.43 5.59 10.05
70 36 3.09 4.7 6.25 8.7 11.18
70 36 6.53 9.69 14.38 24.22 35.93
70 36 7.42 11.21 16.93 29.19 44.08
70 36 4.49 6.78 10.11 17.15 25.58
70 36 1.91 3.05 4.9 8.98 14.18
70 36 1.08 1.76 2.92 5.79 9.33
70 36 0.93 1.54 2.58 5.32 8.73
70 36 0.63 1.07 1.92 4.29 7.47
71 36 1.45 2.03 2.76 4.12 5.45
71 36 2.93 4.1 5.66 8.42 11.37
71 36 3.7 5.14 6.88 10.11 13.53
71 36 2.44 3.33 4.55 6.81 9.21
71 36 1.14 1.7 2.5 4.11 6.03
71 36 0.67 1.02 1.5 2.51 3.74
71 36 0.59 0.9 1.33 2.21 3.31
71 36 0.38 0.59 0.89 1.58 2.47
72 36 1.23 1.73 2.42 3.66 5.01
72 36 2.49 3.58 5.14 7.81 10.71
72 36 3.11 4.36 6.02 9.02 12.24
72 36 2.01 2.75 3.72 5.54 7.44
72 36 0.94 1.33 1.9 2.97 4.15
72 36 0.55 0.8 1.14 1.78 2.51
72 36 0.49 0.71 1.02 1.59 2.23
72 36 0.3 0.44 0.63 1.03 1.51
73 36 1.23 1.76 2.48 3.78 5.17
73 36 2.51 3.66 5.3 8.07 11.09
73 36 3.12 4.44 6.15 9.29 12.69
73 36 1.99 2.75 3.76 5.67 7.66
73 36 0.9 1.29 1.86 2.95 4.17
73 36 0.52 0.76 1.1 1.76 2.51
73 36 0.46 0.68 0.98 1.56 2.22
73 36 0.29 0.42 0.62 1.03 1.53
74 36 1.34 1.9 2.63 3.98 5.36
74 36 2.78 3.96 5.57 8.39 11.43
74 36 3.42 4.83 6.57 9.8 13.25
74 36 2.12 2.93 4.03 6.13 8.41
74 36 0.92 1.35 1.97 3.25 4.75
74 36 0.53 0.79 1.16 1.93 2.89
74 36 0.46 0.69 1.03 1.7 2.54
74 36 0.29 0.45 0.67 1.17 1.83
75 36 1.2 1.72 2.42 3.65 4.97
75 36 2.46 3.56 5.14 7.68 10.41
75 36 3.07 4.36 6.03 9.02 12.22
75 36 1.94 2.7 3.71 5.62 7.61
75 36 0.84 1.24 1.8 2.93 4.21
75 36 0.48 0.72 1.06 1.74 2.53
75 36 0.43 0.63 0.94 1.53 2.22
75 36 0.27 0.41 0.61 1.03 1.57
76 36 0.94 1.33 1.88 2.91 4.03
76 36 1.88 2.74 3.95 6.29 8.78
76 36 2.4 3.37 4.74 7.2 9.83
76 36 1.5 2.12 2.88 4.32 5.84
76 36 0.63 0.95 1.35 2.16 3.02
76 36 0.37 0.55 0.8 1.27 1.8
76 36 0.32 0.48 0.7 1.13 1.59
76 36 0.2 0.3 0.44 0.72 1.05
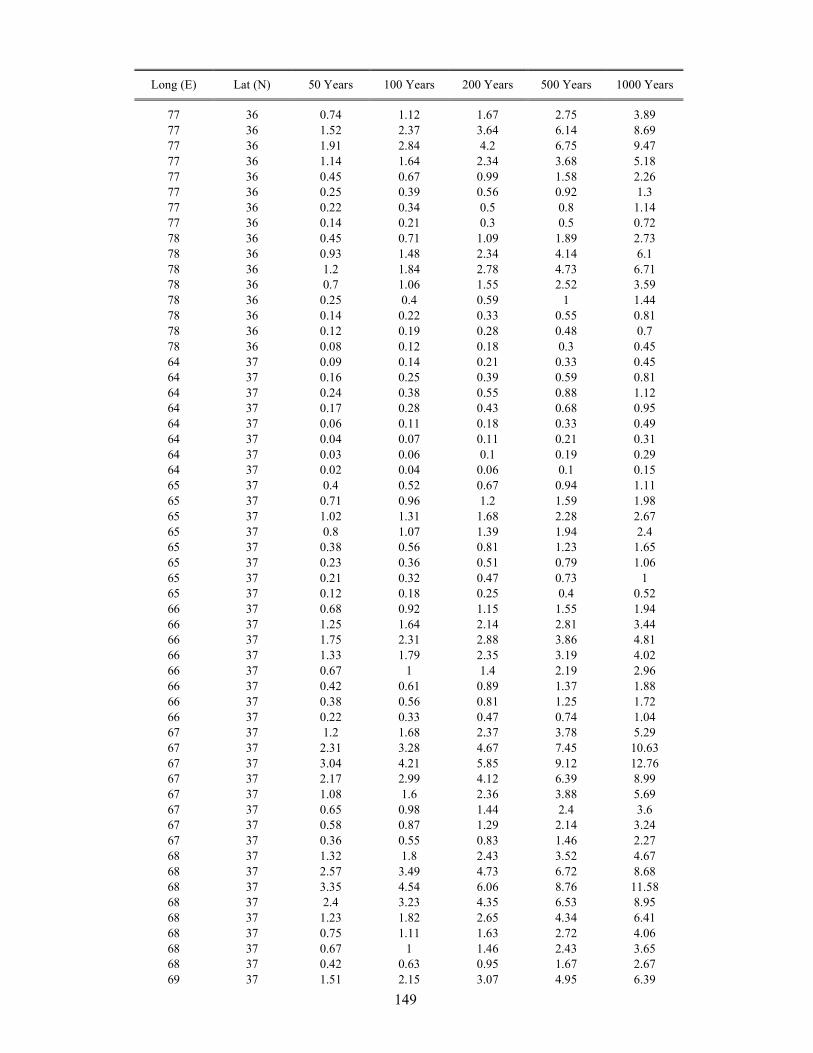
149
Long (E) Lat (N) 50 Years 100 Years 200 Years 500 Years 1000 Years
77 36 0.74 1.12 1.67 2.75 3.89
77 36 1.52 2.37 3.64 6.14 8.69
77 36 1.91 2.84 4.2 6.75 9.47
77 36 1.14 1.64 2.34 3.68 5.18
77 36 0.45 0.67 0.99 1.58 2.26
77 36 0.25 0.39 0.56 0.92 1.3
77 36 0.22 0.34 0.5 0.8 1.14
77 36 0.14 0.21 0.3 0.5 0.72
78 36 0.45 0.71 1.09 1.89 2.73
78 36 0.93 1.48 2.34 4.14 6.1
78 36 1.2 1.84 2.78 4.73 6.71
78 36 0.7 1.06 1.55 2.52 3.59
78 36 0.25 0.4 0.59 1 1.44
78 36 0.14 0.22 0.33 0.55 0.81
78 36 0.12 0.19 0.28 0.48 0.7
78 36 0.08 0.12 0.18 0.3 0.45
64 37 0.09 0.14 0.21 0.33 0.45
64 37 0.16 0.25 0.39 0.59 0.81
64 37 0.24 0.38 0.55 0.88 1.12
64 37 0.17 0.28 0.43 0.68 0.95
64 37 0.06 0.11 0.18 0.33 0.49
64 37 0.04 0.07 0.11 0.21 0.31
64 37 0.03 0.06 0.1 0.19 0.29
64 37 0.02 0.04 0.06 0.1 0.15
65 37 0.4 0.52 0.67 0.94 1.11
65 37 0.71 0.96 1.2 1.59 1.98
65 37 1.02 1.31 1.68 2.28 2.67
65 37 0.8 1.07 1.39 1.94 2.4
65 37 0.38 0.56 0.81 1.23 1.65
65 37 0.23 0.36 0.51 0.79 1.06
65 37 0.21 0.32 0.47 0.73 1
65 37 0.12 0.18 0.25 0.4 0.52
66 37 0.68 0.92 1.15 1.55 1.94
66 37 1.25 1.64 2.14 2.81 3.44
66 37 1.75 2.31 2.88 3.86 4.81
66 37 1.33 1.79 2.35 3.19 4.02
66 37 0.67 1 1.4 2.19 2.96
66 37 0.42 0.61 0.89 1.37 1.88
66 37 0.38 0.56 0.81 1.25 1.72
66 37 0.22 0.33 0.47 0.74 1.04
67 37 1.2 1.68 2.37 3.78 5.29
67 37 2.31 3.28 4.67 7.45 10.63
67 37 3.04 4.21 5.85 9.12 12.76
67 37 2.17 2.99 4.12 6.39 8.99
67 37 1.08 1.6 2.36 3.88 5.69
67 37 0.65 0.98 1.44 2.4 3.6
67 37 0.58 0.87 1.29 2.14 3.24
67 37 0.36 0.55 0.83 1.46 2.27
68 37 1.32 1.8 2.43 3.52 4.67
68 37 2.57 3.49 4.73 6.72 8.68
68 37 3.35 4.54 6.06 8.76 11.58
68 37 2.4 3.23 4.35 6.53 8.95
68 37 1.23 1.82 2.65 4.34 6.41
68 37 0.75 1.11 1.63 2.72 4.06
68 37 0.67 1 1.46 2.43 3.65
68 37 0.42 0.63 0.95 1.67 2.67
69 37 1.51 2.15 3.07 4.95 6.39

150
Long (E) Lat (N) 50 Years 100 Years 200 Years 500 Years 1000 Years
69 37 2.94 4.23 6.09 9.88 14.23
69 37 3.8 5.31 7.48 11.77 16.58
69 37 2.67 3.71 5.17 8.12 11.41
69 37 1.35 2.02 2.98 4.96 7.41
69 37 0.82 1.22 1.81 3.1 4.68
69 37 0.72 1.09 1.62 2.77 4.23
69 37 0.46 0.7 1.08 1.95 3.2
70 37 1.42 1.9 2.51 3.53 4.57
70 37 2.76 3.62 4.76 6.46 8.06
70 37 3.63 4.87 6.32 8.82 11.35
70 37 2.58 3.48 4.69 6.99 9.48
70 37 1.31 1.97 2.9 4.83 7.22
70 37 0.79 1.19 1.78 3.03 4.57
70 37 0.7 1.07 1.58 2.69 4.07
70 37 0.46 0.7 1.08 1.94 3.18
71 37 1.52 2.08 2.72 3.83 4.96
71 37 3.03 4.07 5.39 7.25 9.08
71 37 3.91 5.32 6.87 9.64 12.46
71 37 2.62 3.56 4.82 7.15 9.62
71 37 1.25 1.87 2.76 4.59 6.83
71 37 0.74 1.12 1.66 2.83 4.26
71 37 0.65 0.99 1.47 2.49 3.77
71 37 0.43 0.66 1.01 1.82 2.95
72 37 2.16 3.37 5.2 7.52 9.96
72 37 4.53 7.13 11.01 19.56 30.22
72 37 5.26 7.99 12.15 21.15 32.17
72 37 3.17 4.84 7.19 12.08 17.89
72 37 1.34 2.05 3.09 5.28 7.76
72 37 0.76 1.16 1.77 3.12 4.81
72 37 0.66 1.01 1.56 2.78 4.35
72 37 0.42 0.66 1.04 1.98 3.28
73 37 1.75 2.49 3.41 5.14 6.32
73 37 3.6 5.28 7.06 10.38 13.89
73 37 4.41 6.2 8.48 12.85 17.6
73 37 2.68 3.78 5.31 8.11 11.16
73 37 1.17 1.73 2.57 4.3 6.38
73 37 0.67 1 1.49 2.54 3.88
73 37 0.58 0.87 1.3 2.2 3.41
73 37 0.38 0.58 0.89 1.63 2.64
74 37 1.84 2.75 4.06 6.14 7.9
74 37 3.8 5.79 8.48 14.06 20.61
74 37 4.58 6.71 9.73 15.92 23.09
74 37 2.8 4.1 5.94 9.5 13.56
74 37 1.19 1.8 2.69 4.57 6.77
74 37 0.67 1.02 1.54 2.69 4.14
74 37 0.58 0.89 1.35 2.35 3.69
74 37 0.38 0.59 0.92 1.72 2.81
75 37 2.02 2.91 4.11 5.93 7.35
75 37 4.24 6.2 8.55 13.09 18.05
75 37 5.02 7.14 10.12 16.04 22.73
75 37 2.89 4.23 6.07 9.5 13.33
75 37 1.17 1.79 2.72 4.72 7.12
75 37 0.65 1 1.54 2.76 4.36
75 37 0.56 0.86 1.33 2.39 3.84
75 37 0.37 0.59 0.93 1.81 3.06
76 37 1.32 1.92 2.66 3.99 5.33
76 37 2.74 3.98 5.63 8.29 11.12

151
Long (E) Lat (N) 50 Years 100 Years 200 Years 500 Years 1000 Years
76 37 3.37 4.87 6.64 9.91 13.41
76 37 2.06 2.89 4.03 6.2 8.49
76 37 0.83 1.25 1.85 3.11 4.59
76 37 0.47 0.71 1.07 1.81 2.74
76 37 0.41 0.62 0.93 1.58 2.37
76 37 0.26 0.41 0.63 1.12 1.77
77 37 0.93 1.43 2.21 3.6 5.18
77 37 1.94 3.08 4.87 7.97 11.49
77 37 2.37 3.6 5.43 8.72 12.49
77 37 1.36 2.01 2.94 4.83 6.87
77 37 0.52 0.79 1.19 2.01 2.99
77 37 0.29 0.45 0.67 1.14 1.71
77 37 0.25 0.39 0.58 0.99 1.48
77 37 0.16 0.24 0.37 0.65 1.01
78 37 0.56 0.91 1.42 2.49 3.6
78 37 1.17 1.92 3.07 5.53 7.97
78 37 1.47 2.32 3.57 6.08 8.72
78 37 0.85 1.3 1.95 3.27 4.81
78 37 0.31 0.48 0.74 1.28 1.92
78 37 0.17 0.27 0.41 0.71 1.07
78 37 0.14 0.23 0.35 0.61 0.92
78 37 0.09 0.14 0.22 0.39 0.62
64 38 0.05 0.09 0.14 0.24 0.34
64 38 0.09 0.16 0.26 0.44 0.61
64 38 0.14 0.24 0.39 0.63 0.91
64 38 0.09 0.17 0.27 0.48 0.69
64 38 0.03 0.06 0.1 0.2 0.33
64 38 0.02 0.03 0.06 0.13 0.2
64 38 0.01 0.03 0.05 0.11 0.19
64 38 0.01 0.02 0.03 0.07 0.11
65 38 0.23 0.33 0.46 0.65 0.84
65 38 0.43 0.6 0.84 1.17 1.45
65 38 0.61 0.89 1.16 1.63 2.1
65 38 0.45 0.66 0.95 1.34 1.73
65 38 0.19 0.3 0.47 0.77 1.08
65 38 0.11 0.19 0.29 0.49 0.68
65 38 0.1 0.17 0.27 0.45 0.63
65 38 0.06 0.1 0.15 0.24 0.34
66 38 0.51 0.75 1.12 1.92 2.78
66 38 0.96 1.45 2.18 3.9 5.81
66 38 1.3 1.9 2.81 4.71 6.8
66 38 0.94 1.35 1.93 3.07 4.36
66 38 0.42 0.64 0.97 1.59 2.33
66 38 0.25 0.39 0.58 0.97 1.42
66 38 0.22 0.35 0.52 0.88 1.29
66 38 0.13 0.2 0.31 0.52 0.78
67 38 0.71 1.03 1.49 2.38 3.32
67 38 1.36 1.99 2.94 4.91 6.71
67 38 1.8 2.59 3.71 5.88 8.2
67 38 1.28 1.81 2.54 3.91 5.44
67 38 0.6 0.91 1.33 2.18 3.2
67 38 0.37 0.55 0.81 1.34 1.95
67 38 0.33 0.5 0.73 1.21 1.76
67 38 0.19 0.29 0.44 0.74 1.12
68 38 0.77 1.12 1.64 2.8 4.27
68 38 1.46 2.08 3.22 5.77 8.77
68 38 1.95 2.79 4.02 6.7 10.08

152
Long (E) Lat (N) 50 Years 100 Years 200 Years 500 Years 1000 Years
68 38 1.45 2.02 2.84 4.46 6.42
68 38 0.73 1.08 1.55 2.51 3.6
68 38 0.45 0.66 0.96 1.54 2.2
68 38 0.41 0.6 0.87 1.4 2
68 38 0.23 0.34 0.5 0.82 1.25
69 38 0.78 1.08 1.48 2.23 3.04
69 38 1.46 2.05 2.86 4.45 6.03
69 38 1.97 2.7 3.68 5.53 7.52
69 38 1.45 1.99 2.67 3.91 5.23
69 38 0.73 1.07 1.53 2.42 3.43
69 38 0.45 0.66 0.96 1.5 2.12
69 38 0.41 0.6 0.87 1.37 1.93
69 38 0.24 0.35 0.5 0.81 1.2
70 38 0.8 1.16 1.71 2.93 4.46
70 38 1.51 2.15 3.37 6.05 9.16
70 38 2.02 2.9 4.17 7 10.52
70 38 1.49 2.08 2.93 4.61 6.67
70 38 0.74 1.1 1.58 2.57 3.7
70 38 0.45 0.67 0.97 1.57 2.26
70 38 0.41 0.6 0.88 1.42 2.05
70 38 0.24 0.35 0.52 0.85 1.31
71 38 0.93 1.24 1.66 2.38 3.05
71 38 1.79 2.46 3.26 4.73 5.97
71 38 2.36 3.16 4.23 6.03 7.7
71 38 1.61 2.22 2.92 4.2 5.52
71 38 0.77 1.12 1.59 2.52 3.52
71 38 0.46 0.68 0.98 1.54 2.16
71 38 0.42 0.61 0.88 1.38 1.94
71 38 0.25 0.37 0.54 0.87 1.28
72 38 1.39 2.25 3.39 5.52 7.04
72 38 2.83 4.81 7.23 12.15 17.99
72 38 3.47 5.44 8.12 13.82 20.65
72 38 2.14 3.21 4.8 7.83 11.29
72 38 0.92 1.38 2.06 3.51 5.24
72 38 0.52 0.78 1.17 2.01 3.11
72 38 0.45 0.68 1.03 1.77 2.75
72 38 0.28 0.44 0.67 1.22 2
73 38 1.15 1.63 2.27 3.27 4.3
73 38 2.35 3.31 4.67 6.64 8.52
73 38 2.94 4.15 5.71 8.24 10.88
73 38 1.88 2.62 3.57 5.38 7.27
73 38 0.82 1.2 1.74 2.85 4.13
73 38 0.47 0.7 1.03 1.68 2.47
73 38 0.42 0.62 0.91 1.48 2.14
73 38 0.26 0.4 0.59 1.01 1.56
74 38 1.28 1.98 2.91 4.76 6.16
74 38 2.59 4.12 6.19 9.91 14.16
74 38 3.22 4.88 7.09 11.52 16.63
74 38 2.02 2.94 4.27 6.85 9.71
74 38 0.87 1.29 1.91 3.22 4.78
74 38 0.49 0.74 1.1 1.86 2.84
74 38 0.43 0.64 0.96 1.63 2.49
74 38 0.27 0.42 0.63 1.13 1.82
75 38 1.26 1.89 2.66 4.01 5.34
75 38 2.59 3.92 5.66 8.23 10.93
75 38 3.18 4.74 6.61 10.04 13.77
75 38 1.96 2.81 3.98 6.21 8.59

153
Long (E) Lat (N) 50 Years 100 Years 200 Years 500 Years 1000 Years
75 38 0.81 1.21 1.8 3.04 4.53
75 38 0.46 0.69 1.04 1.76 2.68
75 38 0.4 0.6 0.9 1.54 2.31
75 38 0.26 0.39 0.6 1.08 1.73
76 38 0.96 1.4 2.03 3.07 4.15
76 38 1.95 2.9 4.24 6.46 8.58
76 38 2.45 3.55 5.14 7.67 10.37
76 38 1.51 2.18 3.04 4.7 6.46
76 38 0.61 0.93 1.37 2.26 3.32
76 38 0.35 0.53 0.79 1.32 1.93
76 38 0.3 0.46 0.69 1.15 1.69
76 38 0.2 0.3 0.45 0.77 1.19
77 38 0.62 0.95 1.46 2.5 3.59
77 38 1.26 1.98 3.12 5.55 7.95
77 38 1.62 2.43 3.66 6.11 8.72
77 38 1.01 1.45 2.09 3.37 4.83
77 38 0.4 0.6 0.9 1.47 2.12
77 38 0.23 0.35 0.51 0.84 1.23
77 38 0.2 0.3 0.45 0.74 1.08
77 38 0.12 0.19 0.28 0.47 0.69
78 38 0.38 0.6 0.94 1.68 2.53
78 38 0.75 1.22 1.97 3.64 5.64
78 38 1 1.55 2.39 4.18 6.19
78 38 0.61 0.93 1.38 2.3 3.36
78 38 0.22 0.35 0.54 0.94 1.38
78 38 0.12 0.2 0.31 0.52 0.78
78 38 0.11 0.17 0.27 0.46 0.68
78 38 0.07 0.11 0.17 0.28 0.43