continuous application performance for enterprise...
TRANSCRIPT

Continuous Application Performance for Enterprise .NET Systems Implementing Application Performance Management in Development, Continuous Integration, Test and Production
>> rapidly resolve performance problems in distributed java & .net applications 1
ContentsContentsContentsContents
EXECUTIVE SUMMARY..................................................................................................... 1
CONTINUOUS APPLICATION PERFORMANCE MANAGEMENT.......................................... 2
THE DYNATRACE CONTINUOUS APM INFRASTRUCTURE.................................................. 3
WHY PERFORMANCE PROBLEMS LEAVE DEVELOPMENT?.................................................. 4
EXTENDING VISUAL STUDIO WITH DEEP CROSS-TIER TRANSACTION TRACING................. 5
WHY PERFORMANCE PROBLEMS LEAVE CONTINUOUS INTEGRATION UNDETECTED?...... 7
EXTENDING CI TESTS WITH CODE-LEVEL DIAGNOSTICS .................................................. 8
WHY IS PERFORMANCE TESTING COSTLY AND PAINFUL? .............................................. 10
EXTENDING LOAD TESTS WITH CODE-LEVEL DIAGNOSTICS........................................... 11
WHY DOES PROBLEM RESOLUTION IN PRODUCTION TAKE SO LONG?......................... 14
EXTENDING MONITORING WITH CODE-LEVEL TRANSACTION TRACING........................ 15
CONCLUSION ............................................................................................................. 18

Continuous Application Performance for Enterprise .NET Systems 1
Executive SummaryExecutive SummaryExecutive SummaryExecutive Summary
As businesses depend more and more on applications, as the economic climate becomes harsher demanding companies to do more with less, and as the technological environment rapidly changes, IT is continuously forced to deliver high application performance with only minimal resources.
The rise of .NET has further added to this pressure on IT by creating a framework and environment for rapid application development that is not fully transparent to the developer writing code upon it. ASP.NET and SharePoint enable the speedy development of web-based applications, but contain inherent performance limitations if code is not carefully architected with these limitations in mind. Technologies such as .NET Remoting and Web Services allow for highly-distributed application designs, but can result in significant performance degradation when released “into the wild” of a distributed production environment. Finally, while individual databases may be tuned perfectly, improperly constructed statements and calls via ADO.NET and SharePoint can result in sluggish performance as multiple redundant calls are repeatedly made to the database.
As business stakeholders depend more and more on applications, and development is pulled in more frequently to firefight complex application issues, they also require insight into application performance from live production environments. Additionally, numerous studies have demonstrated that software defects found later in the application lifecycle are exponentially more expensive than those found earlier. Finding such defects earlier in the lifecycle and resolving them quickly when they do appear in production, however, is easier said than done.
To master these challenges, IT needs a way to strategically implement Application Performance Management across the entire software lifecycle, while providing each stakeholder in development, test, production and the business with the information they need for efficient collaboration to proactively prevent performance issues and quickly resolve those issues that do occur later.
This is the premise of dynaTrace’s system for Continuous Application Performance Management. It is a single solution that works across the entire application lifecycle uniting production and staging to development and test with common data – the “PurePath” – that can be easily understood and shared by all. Just as important, it can be used at whatever granularity of detail most appropriate to each specific lifecycle stakeholder: whether high-level business-transaction dashboards for business and production or deep-dive code-level detail for architects and developers. Finally, dynaTrace integrates with Microsoft technologies in every stage of the lifecycle, enabling enterprises to leverage existing investments and enhance them to make performance an essential part of the application lifecycle.

Continuous Application Performance for Enterprise .NET Systems 2
Continuous Application Performance Management IT staff face unprecedented pressure from all sides: the business depends more and more on the applications they produce; the current economy dictates that they must find a way to continuously improve those applications while at the same time reduce costs; and to top it off, the application landscape is in a period of rapid change, with increasing complexity as infrastructures become more dynamic through virtualization, and globally-distributed through service-oriented architectures.
Application Performance Management has for years been viewed simply as monitoring production applications through providing statistical/aggregated performance metrics. In today’s complex environment, however, this traditional view no longer suffices. As business stakeholders depend more and more on applications, and development is pulled in more frequently to firefight complex application issues, both require insights into application performance from live production environments. Also, as software projects involve more and more complex technologies, and defects found later in the application lifecycle are exponentially more expensive than those found earlier, it is also critical to find and resolve them as early as possible to keep projects
within time and budget constraints. As traditional APM only targets production operations teams, it is not able to satisfy the new requirements of stakeholders across the lifecycle.
Traditional APM provides limited visibility into the business impact of performance issues that root from inside the application. It just shows the symptoms surfacing on end-user level, or may point out a problem in an application component, but it can’t connect the two. This lack of visibility gave rise to business management solutions; however, such solutions are not integrated with traditional monitoring, and thus fail to provide management with a holistic view of their applications.
Further, traditional APM has also failed to provide accurate insight into the dynamic behavior of production applications – insight that is vital so development gets what they need to fix issues quickly. Production monitoring rarely delivered the required deep insight into application performance and transaction processing to resolve performance problems that occurred in production. Due to lack of proper diagnosis data, trial-and-error-based reconstruction of production problems was necessary to gather the data required for root cause analysis back in development. This not only led to a lot of guesswork, but to high costs, wasted time and inefficient performance management.
Finally, traditional APM tools are not designed to support performance management early in the application lifecycle. Development and test teams have been left without proper tool support to strategically implement application performance management. This leads to only tactical usage of performance tools such as code profilers in development. Many problems that could have been found early stay undiscovered and iterations between QA and development increase, because it was difficult to precisely track down problems encountered in load testing.
The intense pressures facing IT, combined with the limitations of traditional APM necessitated a new approach to overcome its limitations. The major characteristics of this new paradigm – what refer to as Continuous Application Performance Management – are:
• Provide an integrated lifecycle approach that supports strategic performance management in all phases of the application lifecycle.
• Trace individual transactions down to code level across server boundaries, rather than providing aggregated values.
• Stakeholder-driven visualization of data, according to their specific information needs.
• Integration interface automate performance management processes across the lifecycle.
• Dynamic runtime detection, application discovery, and mapping of application dependencies for managing virtualized, complex infrastructures.
Continuous APM is a unique, new approach to performance management, fulfilling these requirements and supporting a wide variety of usage scenarios in development, test and production.

Continuous Application Performance for Enterprise .NET Systems 3
The dynaTrace Continuous APM Infrastructure The dynaTrace infrastructure fulfills the new requirements of this shift to more proactive performance management across the application lifecycle. It is the core enabling technology for Continuous Application Performance Management, and provides the following two unique characteristics which are possible with its unique architecture:
• Patent-pending PurePath technology – global end to end transaction tracing at code-level
• Single integrated system supporting the entire lifecycle – custom views for all stakeholders
PurePath TechnologyPurePath TechnologyPurePath TechnologyPurePath Technology PurePath globally traces business transactions end-to-end, down to code-level and back. It makes transparent the inner workings of.Net and Java applications, visualizing application dependencies and models, automating issue documentation and isolation, eliminating the need for issue reproduction, as well as reducing problem diagnostics and resolution times to minutes. Its unique characteristics are:
• Tracing individual transactions
• Business-level to code-level drill-down
• End-to-end across globally distributed tiers
• Low overhead, small footprint on target servers
• Real-time and offline root-cause analysis
Integrated lifecycle system with custom views for all stakeholdersIntegrated lifecycle system with custom views for all stakeholdersIntegrated lifecycle system with custom views for all stakeholdersIntegrated lifecycle system with custom views for all stakeholders dynaTrace provides custom views for all lifecycle stakeholders against a common dataset (PurePath) and enables the reuse of common working assets (e.g., instrumentation profiles for PurePath transaction tracing or dashboards to quickly provide reporting a problem back to development) across the lifecycle. This way, dynaTrace enables cooperation instead of blame-storming between development, test and production teams. Also, dynaTrace provides APM not only for 24x7 production operations, but also enables you to efficiently manage application performance early on in development and test, where problems are much less expensive to fix than in production.
dynaTrace dynaTrace dynaTrace dynaTrace aaaarchitecture enabling Continuous APMrchitecture enabling Continuous APMrchitecture enabling Continuous APMrchitecture enabling Continuous APM dynaTrace, built on a scalable and extensible architecture, enables global PurePath transaction tracing to be alwaysalwaysalwaysalways----onononon – whether during continuous integration, high-scale load testing or 24x7 production operations.
Lightweight agents are used to collect data from within the application through IL Code Sensors. The dynaTrace Agents do not accumulate any data, but instead all diagnosis data is sent asynchronously and in real-time to the dynaTrace Server, which constructs the distributed PurePaths. The dynaTrace Collector is optional and removes instrumentation burden from the dynaTrace Server, providing high-scalability, and enabling dynaTrace to trace transactions even globally across WAN environments.
Open interfaces allow easy integrations into existing environments, such as Continuous Integration, load testing, or enterprise management systems. Plus, you can easily extend dynaTrace with custom instrumentation sensors and OSGi-based open source plugins, such as monitors, actions or notifications which you can share and download from the dynaTrace Community Portal. Simply customize and deploy them using the Rapid Plugin Development Environment and you’re at a new level of monitoring.
InternetInternetInternetInternet
InternetInternetInternetInternet
ClientsClientsClientsClients
Application ServersApplication ServersApplication ServersApplication Servers
Web ServicesWeb ServicesWeb ServicesWeb Services
Database Database Database Database SystemsSystemsSystemsSystems
MainframeMainframeMainframeMainframe
Web ServersWeb ServersWeb ServersWeb Servers
InternetInternetInternetInternet
dynaTracedynaTracedynaTracedynaTraceAgentAgentAgentAgent
dynaTracedynaTracedynaTracedynaTraceCollectorCollectorCollectorCollector
dynaTrace Clients with Custom DashboardsdynaTrace Clients with Custom DashboardsdynaTrace Clients with Custom DashboardsdynaTrace Clients with Custom Dashboards
PurePath PurePath PurePath PurePath ®®®®
dynaTracedynaTracedynaTracedynaTraceServerServerServerServer
IL Code Sensors IL Code Sensors IL Code Sensors IL Code Sensors

Continuous Application Performance for Enterprise .NET Systems 4
Why Performance Problems Leave Development? We’ve already come a long way on our journey to make software development an engineering discipline. Thanks to recent adoptions of agile development principles we find more and more development teams doing Test Driven Development, Pair Programming, Daily Stand-ups, and Continuous Integration …
The missing focus on performance during the development phase of a software project, however, leads to software that is more often delivered on time (thanks to agile development) – but that does not always fulfill the performance requirements that “should” have been set and monitored throughout each iteration.
When confronting the development team with the first results of load and performance tests it’s very likely to get the following feedback:
• “Our Unit Tests were all green and we executed them on every build”
• “Everything ran perfectly fine on my local machine – I even executed some load”
• “Everybody on the Online-Forums of the 3rd Party Framework we use seemed to have good experience with performance”
Status quo in development Unit TestsUnit TestsUnit TestsUnit Tests only verify the functionality of the tested code but do not take performance, scalability or architecture into account. Tests do not have the visibility into the used frameworks or external services and therefore lack in verifying architectural correctness.
Local Performance TestsLocal Performance TestsLocal Performance TestsLocal Performance Tests on the developer’s machine are either not done at all or done within an unrealistic environment. Sample data, locally deployed components or mocked services are not enough to find performance problems with the tools that are available on the developer’s desktop.
Free or commercially available 3333rdrdrdrd party frameworks party frameworks party frameworks party frameworks for data access, caching or rendering are most often not correctly used or do not fulfill performance requirements. Due to the lack of visibility into the frameworks and the lack of knowledge of these frameworks, performance problems get into the application through the back door.
Accessing DataAccessing DataAccessing DataAccessing Data – either from a database or via remoting protocols – is often done inefficiently without knowing about it. Requesting too much data or too often is a problem that usually does not manifest itself on the local developers machine as e.g.: latency on the network is not going to be an issue.
What we require in development Getting Insight into Application or 3Getting Insight into Application or 3Getting Insight into Application or 3Getting Insight into Application or 3rdrdrdrd Party FrameworksParty FrameworksParty FrameworksParty Frameworks like ASP.NET, SharePoint, ASP.NET MVC or NHibernate is essential in order to use these frameworks in the most efficient and high-performing way. Otherwise it would be like driving a Porsche in 1st gear because you don’t know that there are 5 more.
With gained insight into the application it’s possible to verifyverifyverifyverify architecturearchitecturearchitecturearchitecture and analyze dynamics such as
• Database Access: which, how often and with which parameters are SQL statements executed?
• Remoting: which, how often and how much data is transferred when executing remoting calls?
• Memory Usage: which, how many instances and how much memory is used by critical objects?
Automating the diagnostic steps and integrating it into the development process enables
• Unit Tests not only to test functionality but also verify the underlying architecture
• Local Performance tests to reveal architectural and scalability issues even in a limited environment
• Better understanding and usage of application and 3rd party frameworks
The more visibility gained in development to verify architecture before moving on to test, the fewer the errors passed on – reducing costly iterations, and making the entire development process more efficient.

Continuous Application Performance for Enterprise .NET Systems 5
Launch from VSTS and get Execution Path with Context Information for every requestLaunch from VSTS and get Execution Path with Context Information for every request
Dynamically analyze Database and Remoting Activity
Runtime Models visualized in UML
Extending Visual Studio with Deep Cross-Tier Transaction Tracing The Visual Studio Suite for Developers offers a great set of features to support developers in writing code, designing UI’s, writing Unit and Integration Tests, doing refactoring, debugging and profiling.
Automate performance analysis Visual Studio comes with a great debugger to debug both managed and unmanaged code. The profiler is able to provide instrumented data (= transaction traces) or sampling based profiling information of local applications within a single CLR. Debugging and profiling can be used to analyze performance but both come with a price. Debugging impacts the execution behavior of your application – threads are synchronized and it is not possible to debug through 3rd party code unless you have the debugging information and symbols. Due to the high overhead of instrumentation-based profiling caused by its deep granularity, the application execution behavior changes dramatically and therefore is often not showing the performance issues that are buried in the application. Sampling-based profiling on the other hand gives average values and is much less heavy, but often misses the essential pieces of information.
dynaTrace seamlessly integrates into Visual Studio – providing diagnostics information not only for a single process but enables cross tier and cross runtime tracing of transactions. Due to its rule-based instrumentation and its unique architecture, dynaTrace is able to collect granular information for each individual transaction instead of averages providing deep diagnostic information without impacting application execution behavior.
Dynamic code analysis and architecture validation Microsoft offers FxCop which can be used as a standalone application or integrated into Visual Studio. FxCop offers static code analysis based on compiled assemblies. It verifies code based on pre-defined rules which can be extended with additional rule sets. With the trend towards loosely coupled components and service oriented architectures – static code analysis is only one part of ensuring proper coding.
dynaTrace enables dynamic code analysis and runtime modeling across runtime and service boundaries. With this ability, application and service architectures can be verified based on real time execution rather than static analysis.
Dynamic analysis also enables capturing database, web service and remoting activity. SQL Statements including bind variables, Web Service endpoints including HTTP headers and message context, remoting calls over TCP/IP, Named Pipes or Shared Memory can be analyzed while executing requests against the implemented code.
Runtime error analysis Visual Studio enables you to break into code execution once certain exceptions are thrown and debug exception handling from the current execution stack. Most often exceptions are handled internally by frameworks and either never bubble up (thus you can’t debug the exception handling) or bubble up without the context information about the actual problem that originally caused the exception.

Continuous Application Performance for Enterprise .NET Systems 6
dynaTrace enables tracing every exception – whether caught or not caught, handled or rethrown. This enables developers to better understand why certain errors happen or how certain situations are handled by the frameworks used.
Example: ASP.NET data bound controls The ASP.NET Framework, Microsoft SharePoint and other 3rd party frameworks provide a huge set of data bound GUI controls. The integration of these frameworks into Visual Studio makes it easy for developers to leverage the WYSIWYG approach by dropping controls on the HTML page and binding it to a SQL, LINQ or Data Service source. MSUnit or NUnit tests can be developed to verify that the data source in fact returns the correct data and that any on-top service is doing the right job for e.g.: calculated result columns.
However, as the dynamic behavior of the used frameworks underneath those GUI controls is unknown to the developer, improper configuration or misuse is a very common source for performance problems.
First performance results not promising The most confident developers that finished all their user stories in time where taken by surprise as the first load test results showed that the new feature hosting a 3rd party Data Grid control that consumed a remote ADO.NET Data Source did not scale with only a small to medium user load.
Symptoms of the performance issue:
CPU consumption on the database, frontend and application server climbed, network soon became a bottleneck and the frontend server ran low on memory. SQL Server log showed many “SELECT * FROM PRODUCTS” table queries without a WHERE or ORDER BY clause, but don’t give a clear indication about the origination of the calls.
Diagnosing the problem and verifying its resolution requires additional resources from both development and testing, which otherwise could be spent on developing new functionality and increasing test coverage to improve quality.
Could this problem already have been identified during development?
• Debugging wouldn’t be possible as the symbol information for the 3rd party control is not available
• Adding custom instrumentation code to the Data Grid control is not possible as its source code is not available – and also would be too much effort to use it for proactive performance diagnostics
• Visual Studio’s built-in profiler is not able to trace across distributed CLRs and thus can’t be applied to this scenario either
None of these steps would enable developers to prevent the problem that happened under load.
How to identify the problem already during development? Getting insight into the frameworks used helps to understand what is going on under the hood based on how the framework components are used and configured. Only code-level diagnostics tools that can trace transactions in 3rd party frameworks across distributed CLRs to analyze their database and remoting activities provide this kind of visibility in specific use case scenarios. This way, developers can see how custom code or configuration changes impact the dynamic behavior of the used frameworks on their local workstation. Thus, it would have been possible to detect the “SELECT * FROM PRODUCTS” statement causing the application to stall under load during development, which would proactively avoid additional fix-test cycles later on.

Continuous Application Performance for Enterprise .NET Systems 7
ASP.NET data bound problem explained The ASP.NET Data Grid configured with a standard SQL Server Database Connection does not leverage SQL to page or sort the result set that is displayed. Instead, all items are retrieved from the table and sorting and paging happens in memory on the Application Server. This behavior results in higher load on both database and application server, as well as more traffic on the network.
The used 3rd party Data Grid Control extended the base ASP.NET Data Grid control by retrieving the data via a remote interface – inheriting the problem of always requesting all data.
Why Performance Problems Leave Continuous Integration Undetected? The .NET world offers different build server options to choose from when implementing Continuous Integration (CI). Microsoft’s Team Foundation Server and CruiseControl.NET are the most well known solutions on the market. These solutions execute builds on an hourly, daily or weekly basis: Unit and Integration Tests get executed to verify functional correctness; Code Coverage and Static Code Analysis make sure that code is property developed and well tested.
Continuous Integration and Agile Development allow task tracking by following the “Burn-Down-Chart” – unfortunately, performance and scalability are most often not part of user stories or are not automatically verified by the automated CI tasks.
When confronting Product Owners with the first results of load and performance tests or the first negative feedback from customers using the latest “Sprint” in production their answers are likely to be
• “We implemented all user stories that we had planned for this iteration”
• “We achieved 90% code coverage with our unit tests”
• “All our tests on our build server didn’t show any problems”
Status quo in Continuous Integration Unit and Integration TestsUnit and Integration TestsUnit and Integration TestsUnit and Integration Tests only verify functional correctness of the tested code. Failed tests on the build machine indicate functional regressions but must be manually analyzed by developers who often need to re-run the tests locally on their machines in order to analyze the problem.
LoadLoadLoadLoad---- and Performance Tests and Performance Tests and Performance Tests and Performance Tests are most often not part of the CI process. Developers that are responsible for test creation are not experts in load test scripting. The build server also should not be used for load testing as it would disrupt continuous build and unit test execution. Additional equipment or tools to execute load tests are often not available.
Long running testsLong running testsLong running testsLong running tests not only negatively impact the overall duration of a build cycle, but also lead to extended idle time for developers when they wait for their local tests to complete before they can check-in their code changes. Thus, their productivity is decreased.
What we require in Continuous Integration Integrating performance diagnostics solutions into the CI process extends the benefit of Unit Tests from only identifying functional regressions to also iiiidentify dentify dentify dentify performance regressionsperformance regressionsperformance regressionsperformance regressions across individual builds. This is done by analyzing the execution times of individual methods, classes, packages or frameworks per test case (transaction trace).
Recording the transaction executions of unit- and integration tests at code-level and providing the data for offline analysis also irons out irons out irons out irons out the need to rethe need to rethe need to rethe need to re----run failed testsrun failed testsrun failed testsrun failed tests – whether it uncovered a functional or a
Continuous Application Performance for Enterprise .NET Systems 8
Identify Performance Regressions on Method Level
Analyze Database Performance across builds
Impact Analysis on Component level between builds
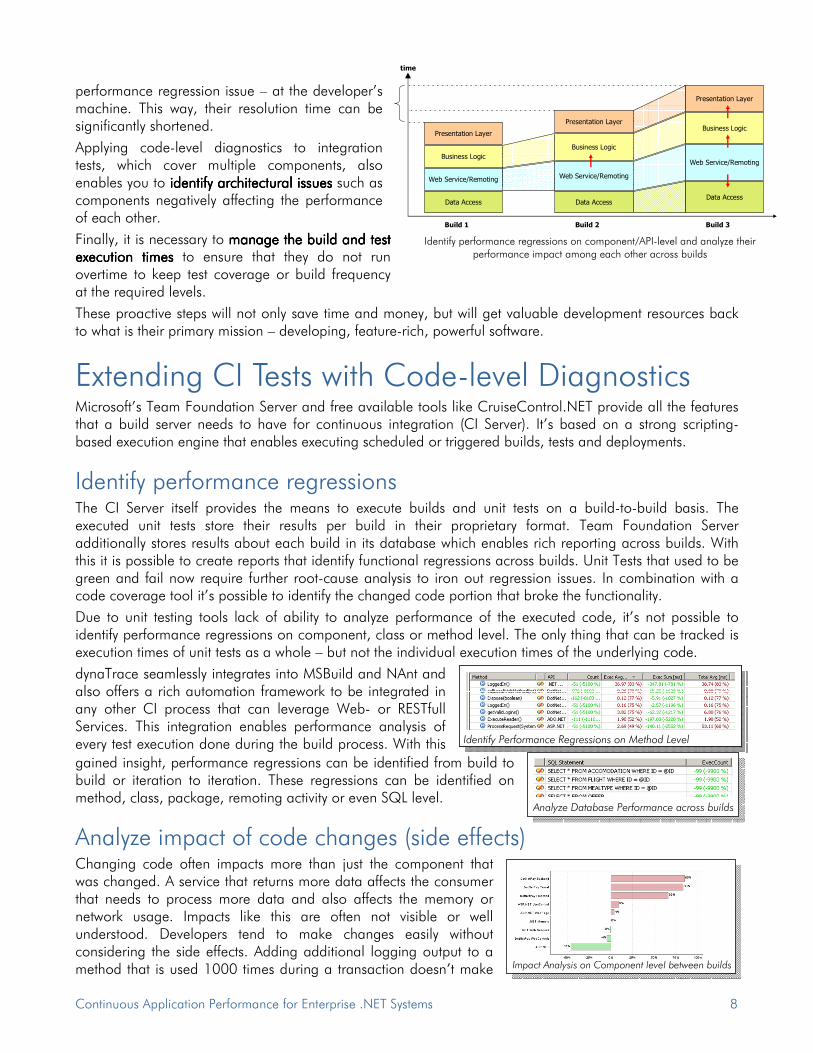
performance regression issue – at the developer’s machine. This way, their resolution time can be significantly shortened.
Applying code-level diagnostics to integration tests, which cover multiple components, also enables you to identify architectural issuesidentify architectural issuesidentify architectural issuesidentify architectural issues such as components negatively affecting the performance of each other.
Finally, it is necessary to managemanagemanagemanage the build and test the build and test the build and test the build and test execution timesexecution timesexecution timesexecution times to ensure that they do not run overtime to keep test coverage or build frequency at the required levels.
These proactive steps will not only save time and money, but will get valuable development resources back to what is their primary mission – developing, feature-rich, powerful software.
Extending CI Tests with Code-level Diagnostics Microsoft’s Team Foundation Server and free available tools like CruiseControl.NET provide all the features that a build server needs to have for continuous integration (CI Server). It’s based on a strong scripting-based execution engine that enables executing scheduled or triggered builds, tests and deployments.
Identify performance regressions The CI Server itself provides the means to execute builds and unit tests on a build-to-build basis. The executed unit tests store their results per build in their proprietary format. Team Foundation Server additionally stores results about each build in its database which enables rich reporting across builds. With this it is possible to create reports that identify functional regressions across builds. Unit Tests that used to be green and fail now require further root-cause analysis to iron out regression issues. In combination with a code coverage tool it’s possible to identify the changed code portion that broke the functionality.
Due to unit testing tools lack of ability to analyze performance of the executed code, it’s not possible to identify performance regressions on component, class or method level. The only thing that can be tracked is execution times of unit tests as a whole – but not the individual execution times of the underlying code.
dynaTrace seamlessly integrates into MSBuild and NAnt and also offers a rich automation framework to be integrated in any other CI process that can leverage Web- or RESTfull Services. This integration enables performance analysis of every test execution done during the build process. With this
gained insight, performance regressions can be identified from build to build or iteration to iteration. These regressions can be identified on method, class, package, remoting activity or even SQL level.
Analyze impact of code changes (side effects) Changing code often impacts more than just the component that was changed. A service that returns more data affects the consumer that needs to process more data and also affects the memory or network usage. Impacts like this are often not visible or well understood. Developers tend to make changes easily without considering the side effects. Adding additional logging output to a method that is used 1000 times during a transaction doesn’t make
Data Access
Web Service/Remoting
Business Logic
Presentation Layer
Data Access
Web Service/Remoting
Business Logic
Presentation Layer
Data Access
Web Service/Remoting
Business Logic
Presentation Layer
Build 1 Build 2 Build 3
time
Identify performance regressions on component/API-level and analyze their performance impact among each other across builds

Continuous Application Performance for Enterprise .NET Systems 9
the individual method significantly slower – but has a huge impact on the performance of the entire transaction.
With dynaTrace’s comparison abilities between methods, classes, components and even frameworks – it’s possible to identify the performance impact of code changes introduced with a new build from one component to the other – helping the developers to better understand the implications of code changes.
Manage test execution times Unit test frameworks provide information about individual test execution times. When tests start taking longer and longer – and thus exceed the available time for completing all CI-tests – it’s often not obvious what is the cause. It could be that the tests just test more functionality, or –more likely– that the tested code has decreasing performance. Identifying the slow running methods delaying test execution while tracking code coverage of all test executions enables you to optimize test cases to keep test execution at an acceptable level. E.g., if a slow running method is executed by too many tests its better to verify if it is really necessary or if all necessary use-case scenarios are already covered by a smaller set of tests.
Example: Testing Web services in a CI-scenario Unit testing a Web service locally on a developer’s workstation is important to catch first issues early on, but also provides only very limited test coverage. Web service consumers and any other accessed services need to be mocked – e.g., with frameworks like Moq.Net or NMock. Also, performance overhead of SOAP calls is tremendously different when the call needs to go over the wire as opposed to a call between two CLRs on the local machine.
However, most problems with Web services actually involve the integration of clients and other services, which is why integration testing early on is quite important to keep costs of defects low.
Performance Problems with Web Service After completing the development iteration, both user stories – the Web Service and the Consumer – have been integrated into the daily build and continuous integration test cycles. It turned out that the Web service took extremely long to execute during integration testing, which not only meant that performance goals were missed, but also that the overall build schedule was negatively impacted. Instead of running twice a day, a full build could only be executed once a day or the build was executed with a limited set of tests in order to keep the predefined schedule, which however led to decreased quality.
Symptoms of the performance issue:
SQL Server log showed many duplicated SQL Statements and high memory consumption of the Web Service. The Web Service developer could not see the duplicated statements on his local machine.
Which would be the next possible steps to analyze and resolve the problem?
• Using a profiler would have only allowed profiling the two components separately without having a real trace from the consumer to the web service
• The developer of the Consumer User Story could not debug the problem because the Web Service was not accessible from his machine
• Adding custom instrumentation code was only limited because a 3rd party OR Mapper was used to access the data from the database
None of these steps allowed the developer to analyze the problem that happened in the CI Environment.
How to identify the problem? Applying a diagnostics solution, which can trace transaction executions at code-level across tiers, to a Continuous Integration environment enables you to understand the dynamic behavior of central application

Continuous Application Performance for Enterprise .NET Systems 10
Standard Lost Test Report with Performance Indicators
components such as Web services as they are used by their consumers. Additionally, you also see how the components affect each other depending on their implementation and deployment configuration. Duplicated SQL queries are often caused by incorrect configuration of frameworks or because too many developers worked on the same features over time not knowing what data had already been requested. What makes it difficult is that those problems may only surface with certain deployment configurations and in certain use-case scenarios and test data. Although developers may already catch such problems on the their local machines they likely miss most of them as they simply show not up when using different input data, local configurations or mock-up services instead of real-ones.
Problems with OR Mappers As with any framework that offers a broad range of features, OR-Mappers give you the flexibility to configure their data fetch, update and caching behavior. Common options for data access are lazy vs. eager loading. Caching allows retrieved objects to be kept in memory to avoid roundtrips to the database. In the example above, in contrast to the developer’s local workstation environment, caching has been disabled in the web.config file of the Web Service container that was deployed on the CI system, causing multiple requests to the same data in the database.
Why Is Performance Testing Costly and Painful? Performance Testing has often been neglected in the past in order to save time and costs. Nowadays, companies are more aware of its necessity. Therefore, development organizations may already test each build with small loads to uncover performance issues early on, and either build their own test labs or outsource testing to Test Centers to run the final staging tests with large user loads. For load testing during development, organizations often don’t buy expensive enterprise-class load testing solutions, but rather use free available tools like OpenSTA, or affordable solutions like Visual Studio Team System for Testers.
In the first test iterations, core application performance problems are often found with limited hardware resources and low load. After these “bumps” have been found, however, large scale load tests are a necessity to verify performance and scalability under production like conditions. When tests get executed against the current “Drop Build”, development most likely comes up with the following questions
• “How can I reproduce the problem that happened under load on my local machine?”
• “Can we re-run the tests with the following debug dlls that will provide additional log information?”
• “Can we install a remote debugger on the lab machines and can I connect to it?”
Status quo in test centers The problem with traditional performance diagnostics tools on the market is that they do not provide the do not provide the do not provide the do not provide the information developers needinformation developers needinformation developers needinformation developers need in order to quickly find, analyze and fix the problem. The problem of not having the right data therefore results in expensive test reexpensive test reexpensive test reexpensive test re----runsrunsrunsruns with special “debug” builds or having the developers occupying test hardware to debug through problems. This means that the Test Team cannot continue with other tests, or that additional hours need to be bought from the external Test Center.
Debug builds or higher log levels also impact the execution behavior of the application. It’s not guaranteed that the same problems not guaranteed that the same problems not guaranteed that the same problems not guaranteed that the same problems will will will will occuroccuroccuroccur againagainagainagain. It’s most likely that the system will only sustain lower load due to the additional overhead. The problems that are found and fixed might not be the problems seen in a release build.

Continuous Application Performance for Enterprise .NET Systems 11
WebTest Plugin enables analyze requests over time individuals down to codeWebTest Plugin enables analyze requests over time individuals down to code
Relying on external or off-facility test centers also introduces additional communication overhead between the additional communication overhead between the additional communication overhead between the additional communication overhead between the testers and developertesters and developertesters and developertesters and developerssss. The so called “Ping-Pong” effect is often tedious, expensive, and does not provide the desired result – getting the information developers need to find the root cause of the identified problems.
What we require in test centers To support the resolution process of performance problems uncovered in load tests efficiently, test engineers need to automatically document all the infoautomatically document all the infoautomatically document all the infoautomatically document all the inforrrrmationmationmationmation developers needdevelopers needdevelopers needdevelopers need to diagnose the problem’s root-cause. This means collecting code-level transaction traces for every single request the load testing tool executes, that not only include performance information, but also rich context information (e.g., method arguments, memory allocations, sync events, SQL-bind data, exceptions/logs).
Having such detailed information at hand entirely eliminates the need for developers to reproduce problems eliminates the need for developers to reproduce problems eliminates the need for developers to reproduce problems eliminates the need for developers to reproduce problems in their local environment. Developers can quickly diagnose the rootdiagnose the rootdiagnose the rootdiagnose the root----cause of problems offlinecause of problems offlinecause of problems offlinecause of problems offline, giving them more time to focus on developing new functionality. It also saves time spent in Test Centers and gives testers more time to focus on test creation and execution, thus increasing their test coverage.
Having code level information for each test iteration also enables performance regression analysis on a performance regression analysis on a performance regression analysis on a performance regression analysis on a componentcomponentcomponentcomponent----levellevellevellevel rather than per feature or Web page. This way, testers may find performance issues deep inside the application that are otherwise invisible to them, but will eventually surface under real production conditions and 24x7 usage. The more granular information that can be analyzed, the easier it is for developers to fix regressions.
Extending Load Tests with Code-level Diagnostics Commercial tools like Microsoft Visual Studio Team System for Testers, HP’s LoadRunner, Borland’s SilkPerformer or even free tools like OpenSTA provide good load testing capabilities of Web applications, Web services or even other protocols.
Going beyond load test reports Load testing tools provide useful reports on user load, transaction throughput, and application response times to uncover application performance issues under load. They usually can also correlate these client-side metrics with system metrics they monitor from application servers or the underlying systems such as CPU, Network and memory usage to provide information on how to tune those systems to optimize performance and alleviate bottlenecks.
However, load testing tools generally treat applications as a black-box. If the root-cause of the performance problems is located within the application, as opposed to the underlying server system, load testing tools do not deliver the information developers need to quickly diagnose and resolve the performance issue in the application’s code.
DevelopmentDevelopmentDevelopmentDevelopment
TestingTestingTestingTesting
ReproductionReproductionReproductionReproduction
Problem AnalysisProblem AnalysisProblem AnalysisProblem Analysis
Problem Problem Problem Problem ResolutonResolutonResolutonResoluton
TimeTimeTimeTime
DevelopmentDevelopmentDevelopmentDevelopment
TestingTestingTestingTesting
ReproductionReproductionReproductionReproduction
ProProProProblem Analysisblem Analysisblem Analysisblem Analysis
TimeTimeTimeTime
Time SavingTime SavingTime SavingTime SavingProblem Problem Problem Problem ResolutonResolutonResolutonResoluton
Accelerate issue resolving process with dynaTrace
DevelopmentDevelopmentDevelopmentDevelopment
TestingTestingTestingTesting
ReproductionReproductionReproductionReproduction
Problem AnalysisProblem AnalysisProblem AnalysisProblem Analysis
Problem Problem Problem Problem ResolutonResolutonResolutonResoluton
TimeTimeTimeTime
DevelopmentDevelopmentDevelopmentDevelopment
TestingTestingTestingTesting
ReproductionReproductionReproductionReproduction
ProProProProblem Analysisblem Analysisblem Analysisblem Analysis
TimeTimeTimeTime
Time SavingTime SavingTime SavingTime SavingProblem Problem Problem Problem ResolutonResolutonResolutonResoluton
DevelopmentDevelopmentDevelopmentDevelopment
TestingTestingTestingTesting
ReproductionReproductionReproductionReproduction
Problem AnalysisProblem AnalysisProblem AnalysisProblem Analysis
Problem Problem Problem Problem ResolutonResolutonResolutonResoluton
TimeTimeTimeTime
DevelopmentDevelopmentDevelopmentDevelopment
TestingTestingTestingTesting
ReproductionReproductionReproductionReproduction
ProProProProblem Analysisblem Analysisblem Analysisblem Analysis
TimeTimeTimeTime
Time SavingTime SavingTime SavingTime SavingProblem Problem Problem Problem ResolutonResolutonResolutonResoluton
Accelerate issue resolving process with dynaTrace

Continuous Application Performance for Enterprise .NET Systems 12
Analyze the context of each individual request that caused a problemAnalyze the context of each individual request that caused a problem
Export to fileExport to file
Compare load tests down to the the code levelCompare load tests down to the the code level
dynaTrace overcomes this problem as it integrates with load testing tools such as Visual Studio Team System for Testers to provide code level diagnostics information for every single request executed by the load testing tool. With dynaTrace, developers and test professionals can now automate and accelerate the process of documenting, diagnosing and resolving performance issues in .NET applications, allowing more time to be spent on strategic development and test activities. As dynaTrace automatically collects all the information developers require for root-cause analysis with every test run, the need for additional test runs with additional log/debug-options to drill down into certain problem areas goes away. Also, developers can now simply pick a spike in the load test results graph and isolate the application component causing a long running page request and diagnose its root-cause down to code-level.
Facilitate communications Every load testing tool has its own set of result files and viewers that allows analysis of the captured results. In addition to these results, the result package also includes application and web server logs, Windows event logs, application specific logs, memory snapshots, etc. All this information is handed back to Development who needs to analyze all different types of data sources – trying to manually correlate the logged information to identify the performance problems shown in the load testing report produced by the load testing tool.
dynaTrace combines all this information with its in-depth transaction tracing information (PurePaths) into one single source. Simply export PurePaths into a single dynaTrace session file. Besides pure performance metrics (response times, CPU usage) for each recorded method, PurePaths also contain all necessary contextual information about each single Web request (e.g., method arguments, memory allocations, network utilization, SQL bind data, sync events, exceptions/logs) necessary to quickly diagnose performance issues down to their root cause. This file – similar to a PDF document - can be shared and distributed to development. The dynaTrace Client or Viewer enables Development to analyze all the data automatically collected during the load test, eliminating tedious manual work to accelerate problem diagnosis and resolution.
Identify performance regression Load Testing tools provide the ability to compare load test results across tests. These comparisons are done based on the information collected by the tool – which are response times of tested pages and resource consumption based in infrastructure performance counters.
dynaTrace extends this comparison down to component, class and method level. With this you can identify performance regressions on component-level deep inside the application and analyze their impact on other depending components or the entire system. With dynaTrace, testers also find performance issues buried deep inside the application that are invisible to load testing tools, but will eventually surface under real production conditions and 24x7 usages. Thus, dynaTrace increases test coverage resulting in less performance problems in production.

Continuous Application Performance for Enterprise .NET Systems 13
One single AJAX Handler request executed 101 WCF CallsOne single AJAX Handler request executed 101 WCF Calls
Example: Remoting under load Microsoft Windows Communication Foundation (WCF) has joined the .NET Framework in release 3.0, providing a communication platform that can be used on top of different protocols (SOAP, XML, Binary, …) and transport channels (HTTP, TCP/IP, Named Pipes, …). Implementing a remotable interface has become as easy as implementing a local interface. Consuming and using a remote interface is no longer different than working with a local object. The magic happens behind the scenes and is configurable in the application configuration file.
However, a remote method call comes with a lot more performance overhead than a local call. Also, the different protocols and transport channels have their specific advantages and disadvantages, which make them better suited for certain use-case scenarios than others. If these issues are not taken into consideration, performance problems become inevitable once the system is put into a production-load environment.
Network problems when using WCF service under load The feature that was load tested by an external Test Center provides an AJAX enabled Web user interface that allows querying stock ticker information from a web server. The web server in fact just forwards the requests to a WCF service which is also used by other internal applications that feed the ticker service.
Symptoms of the performance issue:
The results provided by the Test Center were standard load test reports showing that the page time got slower with only a fraction of the full load that was intended. The database was not busy. The bottleneck seemed to be the network between the Application Server hosting the WCF service and IIS hosting the Web UI.
What would be the next possible steps to analyze the problem?
• Changing the WCF configuration to enable logging of every WCF call and re-run the whole test? Would that have impacted performance even more due to higher logging I/O activity?
• Remote debugging was not an option as the Test Center did not allow external access
• Adding custom instrumentation code was only limited because WCF is doing all network related activity internally
None of these steps allowed the developers to analyze the exact problem. Each required a costly re-run of the test.
How to identify the problem? Using transactional tracing under load that collects all relevant code level, network and database-specific context information integrated in the load testing environment enables analyzing problems that occur in distributed systems under load. Extensive network traffic can be a result of wrong configuration, wrong deployment or wrong usage patterns of remoting technologies.
Problems with remote communication No matter which type of communication is used – may it be on the local machine, to a machine in the same network or to a machine somewhere on the internet – roundtrips need to be avoided as much as possible. Every call to a remote service requires
• Marshalling the data that is sent between client and server. Depending on the protocol this can mean serializing and de-serializing object graphs to XML or SOAP

Continuous Application Performance for Enterprise .NET Systems 14
• A connection needs to be established which binds valuable system resources. Depending on the distance between the two endpoints – latency may become an important factor
• Data must be sent. The chosen protocol and bandwidth determine the transmission speed
Modern development environments and frameworks like Visual Studio and .NET make the use of remote interfaces and protocols completely transparent. The above explained example shows a typical problem where a remoting interface was not designed for remotable usage. 101 roundtrips (N+1 problem pattern) were necessary to retrieve the information that was returned to the AJAX request.
Why Does Problem Resolution in Production Take So Long? Production monitoring has evolved over the years. Not only does it monitor infrastructure metrics like network utilization, CPU, Memory and I/O on the servers, but also aggregated in-depth .NET application metrics through IL-code instrumentation or through application-specific counters that development has added manually.
Despite the amount of data collected – in case of an alert – it is hard to figure out the cause of a slow running web page or why the network bandwidth between two servers is suddenly not large enough.
When using a monitoring solution like Microsoft System Center Operations Manager (SCOM) to monitor servers, network and applications, alerts are generated in case pre-defined performance thresholds are exceeded. E-mails will go out to the responsible Operators, Administrators and System Architects who will then struggle with the following questions
• “Is it an infrastructure or is it an application specific problem?”
• “Can we turn on additional logging and wait till the problem happens again?”
• “What kind of information can you give me in order to reproduce the problem?”
Status quo in production EndEndEndEnd----user user user user monitoringmonitoringmonitoringmonitoring provides instant feedback of application response times and availability as your end user would experience them. Synthetic monitors are well suited for proactive availability monitoring from various remote locations as well as for standardized service-level monitoring of certain business processes. Monitoring real end-user traffic provides instant feedback of application performance issues that directly affect end-users.
.NET .NET .NET .NET ddddeepeepeepeep----ddddiveiveiveive monitoring monitoring monitoring monitoring helps to analyze the application’s dynamic behavior. Traditional deep-dive solutions instrument the application’s IL-code and log files and provide aggregated performance information down to class and method level. This way, system architects can get enough information to isolate a problematic component causing a service disruption. However, they do not provide enough level of detail to allow developers to quickly analyze the problem’s root cause. Consequently, developers need to recreate the reported problems in their environment for further analysis, which not only takes a lot of time, but also is impossible in many situations. Thus, problem diagnostics often becomes pure guesswork rather than empirical analysis, resulting in many fix-test cycles and long repair times.
System monitoringSystem monitoringSystem monitoringSystem monitoring pinpoints the root-cause of performance problems in the applications infrastructure (e.g., configuration issues of an application server or database, etc.). A high CPU or low memory measure on an application server alone, however, does not tell whether it is an application-specific problem or whether other tasks running on the same box consume the needed computation power.

Continuous Application Performance for Enterprise .NET Systems 15
Application Dependency Mapping visualized in UML
SCOM Alerts on infrastructure or high level app
What we require in production If an application issue is causing downtime of a business-critical application, it is imperative that development quickly gets all the information they need to rapidly diagnose the issues underlying root-cause in order to minimize the impact of the problem.
BusinessBusinessBusinessBusiness Transaction Management coupl Transaction Management coupl Transaction Management coupl Transaction Management coupled with deeped with deeped with deeped with deep----dive codedive codedive codedive code----level diagnostics level diagnostics level diagnostics level diagnostics enables you to quickly assess the impact of performance issues to the business, while providing the visibility developers need to quickly diagnose and resolve application issues that occur in production. Being able to globally trace and globally trace and globally trace and globally trace and record transactions endrecord transactions endrecord transactions endrecord transactions end----totototo----end at codeend at codeend at codeend at code----level level level level enables developers to analyze production problems offline on their local workstations deep within the .NET application code even if the application is deployed over multiple locations connected via Web Services or other remoting technologies.
Analyzing application dependenciesapplication dependenciesapplication dependenciesapplication dependencies in real life deployments is important for System Architects to understand the impact of changing instances in server clusters to the transaction routes, service updates or configuration changes to other applications, or of problems in central application components and services to business services. Especially with global SOA applications it is more necessary than ever to understand the individual transaction flows across all the SOA components. For example, the configuration of Enterprise Service Buses (ESB) like BizTalk determines orchestration of decoupled SOA services. This not only allows app dev teams to more independently update them, but also architects to quickly adapt SOA applications to changing business processes through simply updating ESB configuration. As both activities may have critical side effects, it is important to understand the application dependencies as they are in place in the production environment.
To reduce hardware and software purchase and maintenance costs and to foster Green IT you also need to efficiently tune the scalability of your application components and servers. To optimize their deployment, IT not only needs to understand the dependencies between application components, but also their communication behaviorcommunication behaviorcommunication behaviorcommunication behavior and sssscalability characteristicscalability characteristicscalability characteristicscalability characteristics.
Extending Monitoring with Code-level Transaction Tracing Monitoring Solutions like System Center Operations Manager (SCOM) allow monitoring of the complete infrastructures including servers, network components and even applications.
Alert on business transactions SCOM can monitor different types of objects in the infrastructure. All objects - like server instances, network components or web applications hosted in IIS - provide properties that represent their status. This can be the current memory usage of processes on a machine, the used bandwidth of a network switch, the I/O activity on SQL Server, or the response times and status of a certain ASP.NET Web page. Based on those properties alerts can be triggered when certain thresholds are exceeded or exceptions occur. But what is the exact root cause of issues, such as high CPU usage on the Application Server or why is the internal network congested?

Continuous Application Performance for Enterprise .NET Systems 16
Monitor on Business Transactions -> Identify root cause down tn Code LevelMonitor on Business Transactions -> Identify root cause down tn Code Level
Analyze each single transaction with all required context informationAnalyze each single transaction with all required context information
dynaTrace extends the monitoring capabilities of SCOM by providing code-level transaction tracing of every single activity in the monitored application. This extends the type of alerting granularity from infrastructure and high level application metrics to individual business transactions and their supporting services such ASP.NET or WCF components. High CPU utilization can now be directly related to individual business transactions executing certain code segments. These individual transactions can be analyzed including all relevant context information that System Architects and Developers need to understand the root cause of the problem - and therefore eliminate collecting and correlating different types of data to understand the problem.
Shorten resolution time dynaTrace automatically records failed transactions into a dynaTrace session, which includes the PurePath data for offline root-cause analysis of performance issues as they occur in production. The PurePath data contains all the contextual information that is needed to diagnose a problem’s root cause deep down within the application’s code. Thus, developers do not need to access the production environment to instrument the application with additional logging code. Developers do not need access to the production environment to analyze server logs and there is no need to debug or profile the deployed application, whose tremendously high overhead would not only very negatively affect end-user experience, but also complicate root-cause analysis to a great extent.
Optimizing service deployment to improve application scalability Monitoring performance on a service or component level, seeing the real-life dependencies between those components, and understanding their communication behavior provides all the data needed to ensure proper configuration and distribution of these components and services. Individual services that are overloaded can be scaled up by adding additional servers that host those services. Under-utilized services can be combined with other services on the same hardware to save costs. Impacts of deployment configuration changes can immediately be monitored and corrected when they impact the overall system performance.
Example: Customized SharePoint List gone wild Microsoft Windows SharePoint Services (WSS) and Microsoft Office SharePoint Server (MOSS) provide a feature-rich and highly-customizable Collaboration and Content Management Platform based on ASP.NET. Visual Studio, SharePoint Designer and the Customization Features via the Web browser allow Developers, Designers and Users to customize SharePoint to their individual need.
However, those customizations are usually the source for performance problems, because best-practices have not been taken into consideration.

Continuous Application Performance for Enterprise .NET Systems 17
Customized SharePoint View queries ALL list items resulting in large HTML page
Effects of customization A customized SharePoint installation to track support tickets has recently been released. It’s used both externally by customers to create and follow support tickets and internally by the support team to handle and respond to ticket requests.
Symptoms of the performance issue:
A few support engineers complained about very slow ticket list access. SCOM reported no problems in the infrastructure – all average values were far below defined SLA’s.
What would be next possible steps to analyze the problem?
• Manually analyze SQL, IIS and SharePoint logs and try to relate log entries with individual requests from particular users
• Turn up log level details on all application servers to gather additional information
• Backup SharePoint Content Database and try to reproduce and debug problem on developer machine
None of these steps allowed the SharePoint Administrator to quickly resolve the problem.
How to identify the problem? With code-level transaction tracing in the production environment turned on 24x7, it is possible to analyze each individual request executed by customers and support engineers. Analyzing problems on a transaction level takes away the guesswork of interpreting and correlating system and application metrics. With recording not just the pure performance data, but also all the contextual information like method arguments, memory allocations, sync events, SQL-bind data exceptions/logs, etc. you can easily diagnose the root cause of slow Web page requests or pages that failed. Aggregated application metrics usually don’t provide the required granularity to identify what led to the problem. Through persisting the data for offline analysis you even eliminate the need for developers to reproduce the behavior in the local environment.
Customized SharePoint Views causing problems When allowing users to customize their SharePoint portal and also allowing them to create their own SharePoint views it’s possible that a user decides to create a view without using an appropriate filter or row limit. Much has been said in Blogs, Best Practices and Knowledge Base entries about SharePoint Lists exceeding the 2000 item limit. This limit only becomes a problem if the views are going to show more than 2000 items at a time. The key to high performance SharePoint Lists and Views is to define filters which are based on indexed columns and limit the number of items that are shown on a single page. This limits the number of items retrieved from the database, minimizes the generated HTML and increases overall end-to-end request performance.
Continuous Application Performance for Enterprise .NET Systems 18
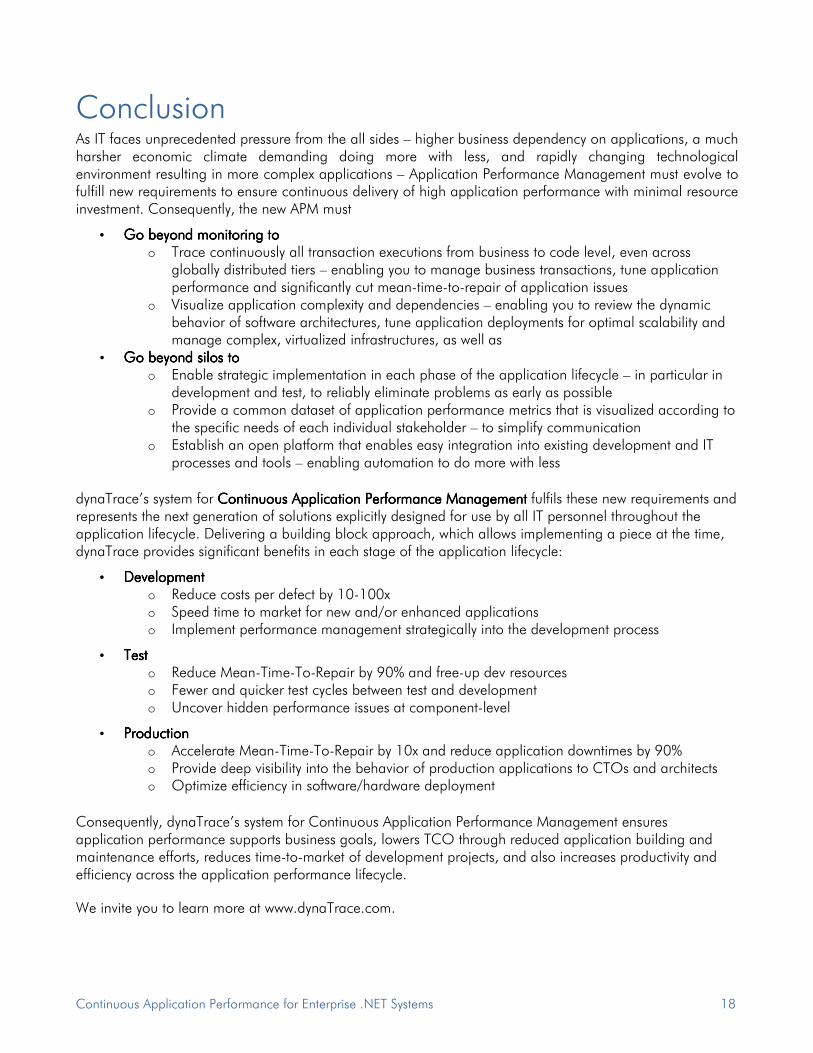
Conclusion As IT faces unprecedented pressure from the all sides – higher business dependency on applications, a much harsher economic climate demanding doing more with less, and rapidly changing technological environment resulting in more complex applications – Application Performance Management must evolve to fulfill new requirements to ensure continuous delivery of high application performance with minimal resource investment. Consequently, the new APM must
• Go beyond monitoringGo beyond monitoringGo beyond monitoringGo beyond monitoring to to to to o Trace continuously all transaction executions from business to code level, even across globally distributed tiers – enabling you to manage business transactions, tune application performance and significantly cut mean-time-to-repair of application issues
o Visualize application complexity and dependencies – enabling you to review the dynamic behavior of software architectures, tune application deployments for optimal scalability and manage complex, virtualized infrastructures, as well as
• Go beyond silosGo beyond silosGo beyond silosGo beyond silos to to to to o Enable strategic implementation in each phase of the application lifecycle – in particular in development and test, to reliably eliminate problems as early as possible
o Provide a common dataset of application performance metrics that is visualized according to the specific needs of each individual stakeholder – to simplify communication
o Establish an open platform that enables easy integration into existing development and IT processes and tools – enabling automation to do more with less
dynaTrace’s system for CCCContinuous Application Performance Managementontinuous Application Performance Managementontinuous Application Performance Managementontinuous Application Performance Management fulfils these new requirements and represents the next generation of solutions explicitly designed for use by all IT personnel throughout the application lifecycle. Delivering a building block approach, which allows implementing a piece at the time, dynaTrace provides significant benefits in each stage of the application lifecycle:
• DevelopmentDevelopmentDevelopmentDevelopment o Reduce costs per defect by 10-100x o Speed time to market for new and/or enhanced applications o Implement performance management strategically into the development process
• TestTestTestTest o Reduce Mean-Time-To-Repair by 90% and free-up dev resources o Fewer and quicker test cycles between test and development o Uncover hidden performance issues at component-level
• ProductionProductionProductionProduction o Accelerate Mean-Time-To-Repair by 10x and reduce application downtimes by 90% o Provide deep visibility into the behavior of production applications to CTOs and architects o Optimize efficiency in software/hardware deployment
Consequently, dynaTrace’s system for Continuous Application Performance Management ensures application performance supports business goals, lowers TCO through reduced application building and maintenance efforts, reduces time-to-market of development projects, and also increases productivity and efficiency across the application performance lifecycle.
We invite you to learn more at www.dynaTrace.com.

Continuous Application Performance for Enterprise .NET Systems 19
Headquarter EMEA: dynaTrace software GmbHHeadquarter EMEA: dynaTrace software GmbHHeadquarter EMEA: dynaTrace software GmbHHeadquarter EMEA: dynaTrace software GmbH
Freistädter Str. 313, 4040 Linz, Austria/Europe, T+ 43 (732) 908208, F +43 (732) 210100.008
Headquarter North AmerHeadquarter North AmerHeadquarter North AmerHeadquarter North America: dynaTrace software Inc.ica: dynaTrace software Inc.ica: dynaTrace software Inc.ica: dynaTrace software Inc.
West Street 200, Waltham, MA 02451, USA, T +1 (339) 9330317 F +1 (781) 2075365 E: [email protected]
All rights reservedAll rights reservedAll rights reservedAll rights reserved
dynaTrace software is a registered trademark of dynaTrace software GmbH. All other marks and names mentioned herein may be trademarks of other respective companies. (090226)