contents - massmart · regional store map northern cape free state gauteng north west limp western...
TRANSCRIPT

INTEGRATED ANNUAL REPORT DECEMBER 2012
Financial Highlights 1Our Business Model 2The Massmart Vision and Mission 3Massmart Investment Proposition 3Regional Store Map 4African Store Map 6Massmart Group Objectives 7Massdiscounters Divisional Review 8Masswarehouse Divisional Review 10Massbuild Divisional Review 12Masscash Divisional Review 14Corporate Accountability Highlights 16Value Added Statement 18Executive Directors 19Non-Executive Directors 20Executive Committee 22Letter to Stakeholders 26Approval of the Abridged Annual Financial Statements 31Independent Auditor’s Report on the Abridged AFS 32Directors’ Report 33Audit and Risk Committee Report 37Social and Ethics Committee Report 38Financial Director’s Review (including the Audited Abridged Annual Financial Statements)
39
Defi nitions and Formulas 66Exceptions to King III 68Board and Committee Attendance 72Board Committees 73Group Risk Landscape 74Interest of Directors in The Company Share Scheme 80Directors’ Emoluments 82Investor Relations 85
Shareholder Analysis 86
Notice of Annual General Meeting 88Summary of the Principle Terms of the Massmart Holdings Limited 2013 Share Plan
96
Form of Proxy 99
CONTENTS
READ MORE
FORMULA
DEFINITION
INSIGHT
REFER TO WEB
Register documenting the assessment of all 75 principles of King IIIThe BoardCompany SecretaryAudit and Risk CommitteeNomination and Remuneration CommitteesSocial and Ethics CommitteeExecutive CommitteeCompliance, Transparency and AccountabilityApproval of the Audited Annual Financial Statements (including the Auditors' Report)Group Annual Financial StatementsNotes to Group Annual Financial StatementsCompany Annual Financial StatementsNotes to Company Annual Financial Statements
REPORTS TO STAKEHOLDERS
CORPORATE GOVERNANCE
SHAREHOLDER INFORMATION
MASSMART AT A GLANCE
The Stakeholders’ Guide can be found on the inside back cover of this reportSTAKEHOLDERS’
GUIDE

FINANCIAL HIGHLIGHTS
R1,407.0mOPERATING PROFIT*
2011: R1,325.6m
UP BY 6.1%
READ MORE: PAGE 66 REPORTS TO STAKEHOLDERSMore detail on defi nitions and formulas
275.0c DIVIDENDS
2011: 252.0 cents
PER SHARE PERFORMANCE
2,185.1c NET ASSET VALUE
2011: 2,158.0 cents
UP BY 1.3%
423.5c HEADLINE EARNINGS ADJUSTED*
2011: 402.3 cents
UP BY 5.3%
UP BY 9.1%
31.2%RETURN ON EQUITY*
2011: 32.3%
DOWN BY 3.4%
FINANCIAL STATISTICS
14.2% DEBT: EQUITY
2011: 8.1%
38.4% RETURN ON
CAPITAL EMPLOYED*†
2011: 47.7%
4.0% TRADING PROFIT BEFORE
INTEREST AND TAXATION MARGIN*2011: 4.2%
* Excluding effect of Walmart costs and foreign exchange movements† Annualised
R2,817.5m CASH GENERATED
FROM OPERATIONS
2011: R3,579.7m
DOWN BY 21.3%
R705.5m HEADLINE EARNINGS
2011: R895.2m
DOWN BY 21.2%
R916.5m HEADLINE EARNINGS ADJUSTED*
2011: R865.9m
UP BY 5.8%
R36,122.6mTOTAL SALES
2011: R31,492.2m
UP BY 14.7%
17.8%RETURN ON
INVESTED CAPITAL†
In order to align the Group better with Wal-Mart Stores, Inc. (Massmart’s ultimate holding
company), Massmart’s year-end has changed from the end of June to the end of December.
The change in year-end means that Massmart’s December 2012 Integrated Annual Report
contains results for the 26 weeks ended 23 December 2012. The below highlights use the
26 weeks ended 25 December 2011 as the comparative period.
REFER TO WEBGROUP FINANCIAL STATEMENTSMore detail on headline earnings
per share can be found in note 11
http://www.massmart.co.za/invest_
profi le/fi nancial_results/2013/
massmart_ar2013/fi nancials/group/
approval_afs.asp
1Massmart Integrated Annual Report December 2012

OUR BUSINESS MODEL
Massmart is a managed portfolio of four divisions, each focused on high-volume,
low-margin, low-cost distribution of mainly branded consumer goods for cash,
through 359 stores in 12 countries
in sub-Saharan Africa.
MASSMART HOLDINGSOVERALL GROUP STRATEGY AND PERFORMANCE
MANAGEMENT
MASSWAREHOUSE
WAREHOUSE CLUB
MASSBUILD
HOME IMPROVEMENT RETAILER AND BUILDING MATERIALS SUPPLIER
MAS
SDIS
COUN
TERS
GENE
RAL M
ERCH
ANDI
SE D
ISCO
UNTE
R AN
D FO
OD R
ETAI
LER M
ASSCASH
FOOD WHOLESALER, RETAILER
AND BUYING ASSOCIATION
SELLBUY
BUYSELL
SELLBUYSE
LLBU
Y
CHANNEL AND SHARED SERVICES
MASSMART GROUP Massmart has evolved into a business model that empowers its Divisions to take trading decisions suited to their individual operating needs but within a strategic operating and fi nancial framework set by the Group. This has several advantages. The framework guarantees consistent compliance with the best governance standards and national legislative requirements. It commits each Division to implementing Massmart’s core strategy of being a
high-volume, low-margin distributor
of quality branded consumer goods
for cash, and ensures expansion
plans add net value to the Group.
MASSMART HOLDINGS
Massmart Holdings performs
the Group management role
and defi nes the strategic and
broad operating principles that
guide the Group’s activities. Its
functions include budget approval
and capital allocation, store site
location, executive appointments,
development and retention,
corporate affairs, human capital
and internal audit.
A business intelligence unit collates
and analyses Divisional data
to inform Group strategy and
decision-making.
MASSMART SHARED
SERVICES
Massmart Shared Services
implements collaborative
agreements reached by Channel.
The most important are Group
supplier negotiations for all products
sold across the Group.
2 Massmart at a Glance

Massmart is a South African-based, globally competitive, regional management group, invested in a portfolio of differentiated, complementary, focused wholesale and retail formats, each reliant on high volumes and operational excellence as the foundation of price leadership, in the distribution of mainly branded consumer goods for cash. The Group actively seeks the continual improvement of performance in the portfolio and its parts, through strategic and structural clarity, high market shares, excellent management, principle-driven ethical leadership, cost-effective technology and the sharing or agglomeration of capabilities, knowledge, resources, infl uence and information.
To this end, thought leadership, individual and collective performance, and collaboration throughout the Group are appropriately rewarded, with executive management incentivised predominantly on Group performance.
Massmart is a South
African retail and
wholesale distributor,
with 331 stores in South
Africa and 28 stores
in sub-Saharan Africa.
Will regard Massmart as a valued partner in accessing and understanding their end-consumers.
OUR SUPPLIERS
Will regard Massmart as the preferred employer in the distribution industry.
CAREER RETAILERS
Including Government, will regard Massmart as a socially accountable corporation.
OUR COMMUNITY
Will regard Massmart as a portfolio rendering superior returns relative to the JSE ‘Retail’ sector.
OUR INVESTORS
Will regard Massmart’s wholesale and retail formats as their fi rst choice when buying those categories of merchandise offered by the formats.
OUR CUSTOMERS
STRATEGIC AND STRUCTURAL CLARITY
MANAGEMENT DEPTH, QUALITY AND DIVERSITYDIVERSIFICATIONGROWTH
GOOD GOVERNANCE
LOW RISK
THE MASSMART VISION THE MASSMART MISSION
OUR INVESTMENT PROPOSITION
Shared Services also handles the
Group’s Payroll functions, the
Shipping and associated Treasury
functions for direct imports, and
managing private or exclusive
brands shared across Massmart’s
trading Divisions.
MASSMART CHANNELMassmart Channel consists of formal trading and functional forums where ideas on collaboration across Divisions are shared. Trading forums cover Food and Liquor, General Merchandise,
and Cellular. Functional forums include Technology, Information and Process (TIP), Operations, Supply Chain and Human Resources. Trading forums are headed by Divisional CEOs and functional forums are headed by Group Executives. Directors and Executives from the Divisions attend forums in their specifi c areas of competence. Once consensus is reached on a collaborative proposal, the Executive Committee approves whether it should be rolled out across the Group.
MASSMART DIVISIONSMassmart’s Divisions comprise Massdiscounters, Masswarehouse, Massbuild and Masscash. Each has a dedicated management team focusing on a particular retail or wholesale format, merchandise proposition and customer base, and is empowered to take trading decisions within a strategic framework and governance structure defi ned by the Group.
THE MASSMART VISION AND MISSION3Massmart Integrated Annual Report December 2012

REGIONAL STORE MAP
NORTHERNCAPE
FREESTATE
GAUTENGNORTH WEST
LIMP
WESTERNCAPE
EASTERNCAPE
E MAP
11
11
NORTH WEST
KLERKSDORPVRYBURG
POTCHEFSTROOM
RUSTENBURGBRITS
MAFIKENG
LICHTENBURG
1 11
1
1
1
1
2
1
VRYBURG
1
1
NORTHERNCAPE
KIMBERLEYUPINGTON
SPRINGBOK
1
111
N
WESTERNCAPE
1 9
3
1
1
1
2
21
2
2
1
1
11
1
13
11
1 1
LUSIKISIKI
WILLOWVALE
MTHATA
QUEENSTOWN
BIZANA
BUTTERWORTH
GONUBIEEAST LONDON
PORT ELIZABETHJEFFREYS BAY
UITENHAGE
KING WILLIAM’S TOWNEASTERNCAPE 1
1
1MDANTSANE 1
1
11 1
W
EASTECAP
W
TE
11
1
2
21
1
1
1
1
11
5
13
HERMANUS
STELLENBOSCHMONTAGU
WORCESTER
VREDENBURG
CAPE TOWN SOMERSET WESTZEVENSWACHT MOSSEL BAY GEORGE
PAARL
KNYSNA
WESTERNCAPE 1
11
1 1
1
92
1
1
1
1
1
1
1
1
GAUTEGGAUTGAGNORTH WEST
1
T
KLERKSDORP
HEFSTROOMCHPOTCH
STSBRITSMAFIKENG
LICHTENBURG
1
11
ENNNN
T
11 6
4
1
1
1
6
1
11
1
8
1
1
1
1
4
3 5
91
6
1
GAUTENG
MIDRAND OLIFANTSFONTEIN
JOHANNESBURGKRUGERSDORP
VANDERBIJLPARK VEREENIGING
PRETORIA
20
HAMMANSKRAAL
2
1
4 Massmart at a Glance

1
6
2
1
1
1
1
1
1
12
3
2
1
1
11
1
1
25
1
1
1
1
2
1
1
1
1
2
1
11 3
1
1
1KWAZULU-NATAL
LADYSMITH
RICHARDS BAY
ULUNDI
MTUBATUBA
NONGOMA
MKUZEMANGUZI
EMPANGENI
BALLITO
1
UMHLANGA
DURBAN
ISIPINGO
MARGATESHELLEY BEACH
PORT SHEPSTONE
HARDING
PIETERMARITZBURG
NEWCASTLE
DUNDEE
ESHOWE
VRYHEID
UMZIMKULU
KOKSTAD
UMLAZI
AMANZIMTOTI
UMZINTOPARK RYNIE
1
1
1
2
1
1
1 1
1 1
1
1
11
1
KWAZULU-NATAL
MPUMALANGANG
LIMPOPO
1111
1
1 1
2 1
LIMPOPO
TZANEENPOLOKWANELEPHELALE
MOKOPANE
THOHOYANDOUMAKHADO1
1 1
1
1
12MANGUZIMANGUZIANGU
1
1
1
1
MPUMALANGASECUNDA
WITBANKMIDDELBURG
GROBLERSDAL
ERMELO
PIET RETIEF
1
HAZYVIEW
NELSPRUIT1
11
111
1
1
11
1
1
KOKOKSTOKSTA1
D
1
1
1
1
1
1
FREESTATE
QWA QWA
FICKSBURG
LADYBRANDBLOEMFONTEIN
WELKOM
11
1
THABA NCHU
12 1
BOTSHABELO
1
PHUTHADITJHABA
1
NNNN
44 CAMBRIDGE
100 GAME61 CBW
19 DIONWIRED
18 MAKRO
29 BUILDERS TRADE DEPOT
27 BUILDERS WAREHOUSE
28 BUILDERS EXPRESS
5 JUMBO
SOUTH AFRICAA TOTAL OF 331 STORES
5Massmart Integrated Annual Report December 2012

SOUTHAFRICA
BOTSWANA
ZAMBIA
NIGERIAGHANA
TANZANIA
UGANDA
MALAWI
MOZAMBIQUE
LESOTHO
SWAZILAND
NAMIBIA
ANAAA
NIGERIA
1
LAGOS
1
ENUGU
GERIA
TANZANIA1
DAR ES SALAAM
AFRICAN STORE MAP
A
SWAZILAND
MANZINI1
LESOTHOMASERU
21
ERIA
UGANDA1
KAMPALA
MALAWI
1
BLANTYRE
1
LILONGWE
14 GAME
13 CBW1 BUILDERS WAREHOUSE
INTERNATIONALA TOTAL OF 28 STORES
GHAAA
1
ACCRA
GHANA
SOUTHAFRICA
BOTSW
ZA
UGAND
NANAMIBIA
AFRICA
NAMIBIA
OSHAKATI1
1
WINDHOEK1
SW
MANZIN
NAMIBIA
BOTSWANA
FRANCISTOWN
1
MAHALAPYE 1
1MAUN
3
PALAPYE1
SELEBI PHIKWE
1
GABORONE
12 1
MOZAMBIQUE
1
MAPUTO
NZANIAIA
MALAAWIIALALAA
MOZAMO
LILANA
MAMMBIQBB QQUEUE
DMOZAMBIQUE
ZAMBIALUSAKA
1
6 Massmart at a Glance

MASSMART GROUP OBJECTIVES
STRATEGIC PROGRESS: PERFORMANCE AGAINST TRANSACTION COMMITMENTS
COUNTRIES
STORES
SOUTH AFRICAAFRICA
359
33128
SUPPLY CHAIN INVESTMENT FOOD RETAIL R R3-4 billion investments in
systems and Distribution Centres
(DCs). Currently:
– 3 MDD Regional DCs
– 3 Makro Regional Warehouses
– 1 Cambridge DC
– 1 Massbuild Central DC
– Several meat, fruit, and
vegetable supply facilities
R Focus on attracting returns and
improving effi ciencies
R Completed an initial investment in
food retail (estimated R10 billion
business). Currently, a four format
approach:
– Cambridge/Rhino (44)
– Foodco (27)
– Makro Retail (13)
– Saverite (112)
R Massfresh is focused on improving
our offerings in meat, fruit,
vegetables, deli and bakery
AFRICA EXPANSION LEADERSHIP AND TRANSFORMATION
R 3 Component Strategy:
R Long-term potential in Africa
R Level 4 BBBEE
R 54 New Graduates
R Continued investment in Executive
Development
R Established CEO Women’s Advisory
Council
R Leverage Walmart global talent pool
OUR GROUP STRATEGY HAS BEEN TO: R Focus on Core Trading R Complete Acquisition
and Integration R Continue Supply Chain
Investment R Grow Food Retail R Expand Into Africa R Invest in Leadership,
Transformation and Sustainability
R Total of 237 retrenched employees have accepted reinstatement; 73 took voluntary packages, 6 have retired or passed away and 187 did not present themselves for reinstatement.
R Investment in new stores and infrastructure has led to the creation of 8,324 Full Time Equivalent (FTE) positions since the Walmart transaction, in line with the estimated creation of 15,000 new direct and indirect positions within a fi ve-year period.
R Food, Liquor and FMCG procurement has grown by R7 billion against an estimated increase of cumulative R60 billion also within fi ve years, indicating we are on plan.
R Massmart has established appropriate governance relating to the operations of the R240 million Supplier Development Fund (SDF), including the appointment of Executive Managers, an operational committee, an advisory committee consisting of Government, Trade Union, Trade Association and Company stakeholders, and an external auditor.
REVISED MEDIUM-TERM OBJECTIVES DEC 2012
MAJOR POTENTIAL RISK AREAS
R Above market comparable sales
R Extract return from investment in Food Retail
R Extract returns from investment in supply chain
R Implementation of Africa Food Retail strategy
R Drive Supplier Development Fund investment in Manufacturing
R Invest in Leadership depth
R Labour unrest R Insuffi cient progress
with transformation at an Executive level
R Economic volatility R Acquisition risk R Competitive intensity R Customer safety
– City strategy – Game/
Builders Warehouse
– Country strategy – South,
West and East Africa
– South African Development
Community (SADC) strategy –
new stores in Mozambique,
Botswana and Zambia
SOUTH AFRICABOTSWANA GHANA LESOTHOMALAWIMOZAMBIQUE
NAMIBIA NIGERIA SWAZILAND TANZANIA UGANDA ZAMBIA
7Massmart Integrated Annual Report December 2012

MASSDISCOUNTERS DIVISIONAL REVIEW
R 20 Dion stores acquired 31 May 1993
R Dion stores rebranded to Game stores
in 2000
R Launched greenfi eld DionWired
concept stores in 2006
R Now 19 stores
R Operating in SA
R General merchandise
R LSM 8-10
R 26 stores acquired 1 July 1998
R Now 114 stores
R Operating in: South Africa, Botswana,
Ghana, Lesotho, Malawi, Mozambique,
Namibia, Nigeria, Tanzania, Uganda,
Zambia
R General merchandise, Food Retail and
FMCG
R LSM 5-10
The Massdiscounters brandsMassdiscounters operates two retail formats: Game and DionWired. Game is a discount retailer of General Merchandise and predominantly non-perishable groceries for home, leisure and business use, operating throughout South Africa and in 13 major cities in sub-Saharan Africa. Traditionally Game has been a discounter of General Merchandise, but our format renewal, with the introduction of Foodco, has pushed the brand towards a multi-category format. We now have 100 Game stores in South Africa and 14 in Africa, bringing our total footprint to 114. We also have 19 DionWired stores, which sell middle- to upper-end electronics and appliances across South Africa.
At Game our positioning offers customers the widest range of branded products, at the best price, for a given set of product specifi cations. We ensure that customers are assured of the best value at every logical price point. The Game trading model is promotionally-driven, with fi ve million copies of our weekly promotional leafl ets distributed in South Africa. By working closely with our suppliers and benchmarking ourselves against competitors, we are able to offer our customers well-priced products representing great value.
Currently 27 Game stores provide a food offering under the Foodco sub-brand, providing further everyday value to our customers. Over the next few years, we intend to roll out Foodco to most Game stores.
GENERAL MERCHANDISE DISCOUNTER AND FOOD RETAILER
HIGHLIGHTS R Sales growth of 7.7%
R Game Africa and DionWired profi ts increasing well ahead
of sales in both businesses
R Increased Foodco stores to 27
KEY SALES DRIVERS R Product defl ation
R Price perception
R Interest rates
R Consumer confi dence and disposable income
R New stores
R African economic recovery
MASSDISCOUNTERSSTORE PROGRESS
OPENING BALANCE
GAME
STORES OPENED GROBLERSDAL KING WILLIAM’S TOWN LEPHELALE LICHTENBURG MASERU QUEENSTOWN STELLENBOSCH
TOTAL STORES DECEMBER 2012
OPENING BALANCE
DIONWIRED
STORE OPENED RUSTENBURG
TOTAL STORES DECEMBER 2012
7
107
18
19
114
1
Trading space m2 441,382
DC space m2 178,488
DEFINITIONLIVING STANDARDS MEASURE (LSM)The South African Advertising Research
Foundation (SAARF) Living Standards
Measure (LSM) has become the most
widely used segmentation tool in South
Africa. It is a means of segmenting the
South African market that cuts across
race, gender, age or any other variable
used to categorise people. Instead, it
groups people according to their living
standards.
8 Massmart at a Glance

Financial performance
Improving effi ciencies
Investing in our community
Investing in our human resources
Improve business effi ciencies
Improve in-stock levels
Reduce costsREGIONAL DISTRIBUTION
CENTRES
SUPPLY CHAIN DEVELOPMENT:
Grant Pattison Chairman, Robin Wright Acting Managing Director, Norman Drieselmann Chief Financial Offi cer, Richard Fuller Store Operations Director, John Hart IT Director and
Logistics Director, Guy Hayward Non-executive Director, Richard Millson Marketing Director,
Rogany Ramiah Human Resources Director, Mike Spivey Non-executive Director, Mark Turner Africa Director, Tyrone Vieira Merchandise Director, Ilan Zwarenstein Non-executive Director
MASSDISCOUNTERS DIRECTORATE
37
15
36
27
Trading profit before taxation
(30%)
30
23
Sales(23%)
13
19
Trading profit before taxR449.6 million
SalesR8,422.1 million
LiquorMart was included with the Foodco format renewal to complete our offering and increase foot traffi c to our general merchandise stores. We now have 18 LiquorMart stores, which are performing in line with expectations.
DionWired’s product displays create an easy, exciting and interactive shopping experience, offering the latest in-home entertainment, computing, video and digital photographic equipment and appliances. DionWired sells complete technological solutions, often demonstrating the interconnectivity of the latest innovations and products in-store. The Tech experts manning our in-store Tech Smart service centres are on hand to offer the best advice and onsite repairs and services.
Although all our products are competitively priced, DionWired’s proposition is not founded on price alone. Our main proposition is to offer the widest range of some of the world’s leading and discerning brands such as Apple, Smeg, Miele, Marantz, Bose and Onkyo to the South African higher- end consumer.
Future outlookOver the next fi nancial year, Massdiscounters will focus on bedding down many of the changes implemented over the past three years. With seven Game stores to open in South Africa and three new DionWired stores, we expect our aggressive growth strategy to continue to take market share and deliver our low-cost, low-margin, high-volume business model to more customers in a highly competitive retail sector.
At DionWired our focus on a unique customer experience, as well as our extensive bouquet of services, will differentiate the brand on a national basis as discerning customers seek value and solutions in their purchases.
At Game we will continue to seek out and introduce the world’s leading consumer brands alongside our aggressive roll-out of Private Label to ensure that we offer the range of products required to retain our customers in this challenging market.
The evolution of the Foodco brand will follow three phases as we grow scale and volumes and continue to seek opportunities in the planning, sourcing and distribution of fresh produce. We plan to open or convert 11 more Foodco stores in the next 12 months, bringing the total to 38 Foodco stores by December 2013.
BBBEE
LEVEL 3READ MORE More information on the divisional fi nancial
performance can be found in:
LETTER TO STAKEHOLDERS page 26
FINANCIAL DIRECTOR’S REVIEW pages 39 – 65
R
R
R
Now in its sixth year, Amalunchbox was
born from the belief that "you cant teach a
hungry child", and we work together with the
Department of Education to make their national
School Nutrition Programme more effective.
9Massmart Integrated Annual Report December 2012
MASSWAREHOUSE DIVISIONAL REVIEWWAREHOUSE CLUB
MASSWAREHOUSESTORE PROGRESS
OPENING BALANCE
MAKRO
STORES OPENED BLOEMFONTEIN CAPE GATE
TOTAL STORES DECEMBER 2012
2
16
18
R Now 18 stores
R Operating in SA
R Food, Liquor, General merchandise
R LSM 6-10 and Food LSM 2-6
Trading space m2 179,202
DC space m2 51,300
The Makro brand
The Makro model is unusual in that it sells General Merchandise to retail customers while much of its Food and Liquor is sold to wholesale customers. This blend gives the brand a robustness that enables it to trade comfortably through most economic cycles. The big-box warehouse club format with our no-frills approach keeps costs down and provides the platform for our high- volume, low-margin sales offering of quality branded merchandise. Our customer database of Makro store cards used at the point of purchase helps us to keep track of the spending patterns of our 2.1 million active members and we communicate regularly with them through targeted promotional material.
Makro’s offerings are tailor-made to fi t a variety of customer needs across all our merchandising categories.
Our food offering caters to wholesale shoppers ranging from informal traders and grocery store owners to hoteliers, restaurateurs, offi ces and schools. Wholesalers account for up to 80% of Makro’s food sales and most shop during the week for the convenience of our wide range of good-value, quality consumables. At weekends, our focus shifts to promoting good buys for retail food and grocery shoppers who can achieve substantial savings on their monthly household basket compared with other mass retail outlets.
Our liquor offering also caters to both the retail and wholesale customer. Makro’s liquor outlets, immediately adjacent to our main outlets, continue to increase their range of premium brands especially in wine and whisky. These products are sold at a low margin to maintain and grow our share of the market. At the same time we have maintained a strong presence of beer and budget brands for liquor wholesalers looking for good value.
HIGHLIGHTS R Sales growth of 23.5%
R Trading profi t before tax increased by 12.7%
KEY SALES DRIVERS R Product defl ation
R Price perception
R Interest rates
R Consumer confi dence and disposable income
R New stores
DEFINITIONTRADING SPACE (M2)Trading space excludes parking, yard,
warehouse space, offi ce space and
receiving areas.
10 Massmart at a Glance

Financial performance
Investing in our human resources
Grant Pattison Chairman, Doug Jones Divisional Managing Director, Bruce Cayzer Food Director, Guy Hayward Non-executive Director, Garry Hendry Liquor Director, Derick Kalan General
Merchandise Director, Gert Lourens Operations Director, Chris Nezar Marketing Director, Pieter Schoeman IT Director, Mike Spivey Non-executive Director, Llewellyn Steeneveldt Non-executive Director, Julie Wilford Financial Director, Donovan Wright HR Director, Ilan Zwarenstein Non-executive Director
MASSWAREHOUSE DIRECTORATE
37
15
36
27
Trading profit before taxation
(36%)
30
23
Sales(27%)
13
19
Trading profit before taxR535.1 million
SalesR9,630.2 million
BBBEE
LEVEL 4Investing in our community
Investing in our environment
FOREFRONT OF ENERGY EFFICIENCY IN THE RETAIL ENVIRONMENT:
Future outlook
We plan to open two Makro stores per year until 2015, giving us a footprint of 23 stores in South Africa.
Initiatives for the year ahead include rolling out our Food Retail offering and new butchery design across all Makro stores. We also plan to complete the integration of Fruitspot and drive growth and cross-selling opportunities across the business.
Our e-commerce plan is expected to be fi nalised shortly and we aim to create an online retail store by mid-2013. This will also enable us to enhance the use of social media and digital direct marketing vehicles to drive footfall into both our online and bricks and mortar stores, as well as better align our product marketing to consumer needs. We plan to implement a mobile solution to facilitate sales, team operations as well as improve customer service to resale traders.
The integration of Masswarehouse into the Walmart family has been positive, with the projects related to culture, governance and value completed. The resultant positive impacts include leverage through the global organisations resources, processes and merchandise availability; culture alignment as well as enhanced cooperation with other divisions in the Massmart Group. We will continue to work closely with the integration team to leverage further synergies.
In the year ahead, Masswarehouse will continue to build momentum and maximise operating income, exploring new business areas, new categories of customer and optimising the returns on the trading space in our stores.
READ MORE More information on the divisional fi nancial
performance can be found in:
LETTER TO STAKEHOLDERS page 26
FINANCIAL DIRECTOR’S REVIEW pages 39 – 65
700,000KWh
SAVING +\-
ACROSS NEW STORES
The SUCCEED (Supporting Caregivers and
Centres in Early Childhood Development)
Project as a collaboration between Makro and
Hope Worldwide, and has as its objective the
building of a capacity of ECD Centres that serve
vulnerable children, so that the children in
their care receive the stimulation, education,
protection, development and nutrition to
fulfi ll their potential.
11Massmart Integrated Annual Report December 2012

MASSBUILD DIVISIONAL REVIEW
MASSBUILDSTORE PROGRESS
OPENING BALANCE
BUILDERS WAREHOUSE
TOTAL STORES DECEMBER 2012
OPENING BALANCE
BUILDERS EXPRESS
STORE OPENED MIDDELBURG
TOTAL STORES DECEMBER 2012
OPENING BALANCE
BUILDERS TRADE DEPOT
TOTAL STORES DECEMBER 2012
28
27
29
29
28
28
1
HOME IMPROVEMENT RETAILER AND BUILDING MATERIALS SUPPLIER
R 14 Servistar stores acquired in June 2005, rebranded to Builders Express
R Now 28 stores R Operating in SA R Home improvement
supplies/tools/building materials
R LSM 5-10
R Five Builders Warehouse stores acquired in February 2003
R Three De La Rey stores acquired in June 2005, rebranded to Builders Warehouse
R Now 28 stores R Operating in SA
and Botswana R Home improvement
supplies/tools/building materials
R LSM 5-10
R 34 Federated Timbers stores acquired in June 2005, rebranded to Builders Trade Depot
R Now 29 stores R Operating in SA R Tools/building materials R LSM 4-8
The Massbuild brands
Massbuild operates three main complementary brands: Builders Warehouse, which operates large home improvement stores in major urban areas; Builders Express, a chain of smaller neighbourhood home improvement stores; and Builders Trade Depot, focusing on delivering the core range for all phases of building projects, focusing on contractors.
Massmart acquired fi ve Builders Warehouse stores operating in Johannesburg and Pretoria in 2003, bought and rebranded three De La Rey stores in the Western Cape in 2005 and now operates 27 Builders Warehouse stores in eight provinces in South Africa and one in Gaborone, Botswana. Builders Warehouse follows the big-box or warehouse retail format, offering home owners, DIY enthusiasts and building and maintenance contractors a comprehensive range of competitively priced products under one roof, with a large garden centre display and a builders’ supplies yard. The brand is unique in that it is the only home improvement warehouse in South Africa.
HIGHLIGHTS R Sales growth of 10.0% R BWH and BEX expense growth lower than sales growth R Botswana sales and trading margin percentages exceeded budget R Trading profi t before tax increased by 23.6%
KEY SALES DRIVERS R Interest rates R Residential property prices and housing growth R Consumer confi dence and disposable income R Price perception R New stores
Trading space m2 395,871
DC space m2 29,624
12 Massmart at a Glance

Financial performance
Improving effi ciencies
Investing in our human resources
Grant Pattison Chairman, Llewellyn Walters Chief Executive, Thashmi Doorasamy HR Director, Neville Hatfi eld Merchandise Director, Guy Hayward Non-executive Director, Chris Lourens Operations Director, Zandile Manana Marketing Director, Alex Rymaszewski Store Development
Director, Michael Spivey Non-executive Director, Andre Steyn Builders Express and Builders
Trade Depot Director, Chris Tugman IT Director, Simon White Financial Director, Ilan Zwarenstein Non-executive Director
MASSBUILD DIRECTORATE
37
27
23
Sales(13%)
13
15
36
Trading profit before taxation
(20%)
3019
Trading profit before taxR292.6 million
SalesR4,663.1 million
Builders Express was formed in 2005 when Massmart bought and rebranded 14 Servistar stores operating in the Eastern Cape and KwaZulu-Natal. Massbuild now operates 28 home and garden Builders Express stores in fi ve provinces that cater to home owners and provide a “fi ller strategy” for the Group – situated in convenient locations with aesthetically pleasing displays, customer-friendly store layouts and offering personalised service and advice.
Builders Trade Depot was formed when 34 Federated Timber stores were acquired and rebranded in 2005. Seven smaller stores have since been closed and after some conversions and acquisitions, Builders Trade Depot now operates 29 stores catering mostly for medium- to large-sized contractors and tradesmen engaged in building, maintenance and renovation projects. It also focuses on servicing the needs of construction entrepreneurs who need trade credit, telephonic ordering and want bulk goods delivered from low-cost outlets.
The Company acquired Kangela in Mozambique in 2010, and this represents our fourth brand. There are 13 Kangela outlets in Mozambique, with cement and construction materials making up a higher proportion of sales than in South Africa.
Future outlook
Massbuild’s fi ve-year plan includes roll-out of new stores, revamping or relocating others and aligning our brands to service key markets.
There are opportunities for Massbuild to benefi t from the experience of Walmart and our staff will look to share knowledge and experience with the world- recognised retailer.
As Massbuild seeks to fi nd innovative ways to meet our customers’ needs, we will look to increase the convenience factor for our contractor customers by offering online catalogue services. Good progress has been made around the development of an e-commerce strategy to provide customers with more choice and advice, a development which will be a fi rst for the hardware sector.
BBBEE
LEVEL 5Investing in our community
READ MORE More information on the divisional fi nancial
performance can be found in:
LETTER TO STAKEHOLDERS page 26
FINANCIAL DIRECTOR’S REVIEW pages 39 – 65
REGIONAL DISTRIBUTION
CENTRES
SUPPLY CHAIN DEVELOPMENT:
Improve business effi ciencies
Improve in-stock levels
Reduce costs
R
R
R
In 2011, Massbuild met the passionate and
inspiring Maria Botha, of Ripples For Good, and
the journey to make a meaningful difference in
the lives in people in need began. Maria and her
two Jack Russels are the ambassadors of this
project and have traveled around South Africa
where, in 2012, 36 schools were assisted.
13Massmart Integrated Annual Report December 2012

MASSCASHSTORE PROGRESS
OPENING BALANCE
MASSCASH WHOLESALE
STORES ACQUIRED KIMBERLEY SUPERBLOEM UPINGTON
STORE CONVERTED RAHME GUYS
STORES CLOSED BARA RANK, DIEPKLOOF BLOEMFONTEIN CASH AND CARRY JUMBO BLOEMFONTEIN KIMBERLEY CASH AND CARRY LIQUORLAND EXPRESS, DIEPKLOOF
TOTAL STORES DECEMBER 2012
OPENING BALANCE
CAMBRIDGE FOOD
STORES OPENED EAST LONDON MDANTSAME
STORE ACQUIRED TEMBA
STORE CONVERTED RAHME GUYS
STORE CLOSED NEWTOWN
TOTAL STORES DECEMBER 2012
80
43
44
79
2
1
-1
-1
3
1
-5
MASSCASH DIVISIONAL REVIEWFOOD WHOLESALER, RETAILER AND BUYING ASSOCIATION
R 15 Rhino Cash and Carry Group stores
acquired March 2012
R Now 44 stores
R Operating in SA
R Food/groceries
R LSM 2-5
R 378 members acquired March 1992
R Now 434 members and 487 outlets
R Operating in South Africa, Botswana,
Swaziland
R Food/groceries
R LSM 2-6
The Masscash brands
Masscash consists of a Wholesale Division with cash and carry food and
cosmetics businesses and Retail food outlets which target the lower LSM groups.
Our Wholesale Division consists of CBW Holdings, Jumbo Cash and Carry,
Trident, Cellshack and Shield whilst our Retail Division is consolidated under the
Cambridge Food banner and the Rhino Cash and Carry Group.
CBW and Trident wholesale food, liquor, groceries and cosmetics in bulk to
independent dealers, Government feeding schemes, franchise members, small
traders and hawkers in peri-urban and rural areas within southern Africa.
Jumbo sells mainly cosmetics, toiletries and hair-care products to individual
customers and independent general dealers. Shield is a voluntary buying
association that buys products in bulk on behalf of 434 members who own
wholesale or retail food businesses in South Africa, Botswana and Swaziland.
HIGHLIGHTS R Sales growth of 15.3% R Trading profi t before tax increased by 19.4%
KEY SALES DRIVERS R Food infl ation, particularly commodities R Social grants R New stores R Retail food acquisitions
Trading space m2 397,118
DC space m2 31,292
R 14 CCW stores acquired in June 1998
R 6 Jumbo stores acquired in April 2001
R 22 Brown and Weirs stores acquired in July 2010
R Two chains combined under CBW format from July 2001
R Now 79 stores
R Operating in SA, Botswana, Lesotho, Namibia, Swaziland
R Food/liquor/groceries/ethnic cosmetics
R LSM 2-6
14 Massmart at a Glance

Financial performance
Investing in our community
Investing in our human resources
Improving effi ciencies
Grant Pattison Chairman, Neville Dunn Divisional Managing Director of Masscash Wholesale, Kevin Vyvyan-Day Divisional Chief Executive of Cambridge Foods, Jane Bruyns HR Director, Guy Hayward Non-executive Director, Dino Holmes Financial Director of Masscash Wholesale, Pearl Maphoshe Non-executive Director, Eben Mare Financial Director of Cambridge Foods, Mike Marshall Business Systems and Process Director, Jon Martinek Merchandise Director, Mike Spivey Non-executive director, Llewellyn Steeneveldt Non-executive Director, Robin Wright Group Food Executive, Ilan Zwarenstein Non-executive Director
MASSCASH DIRECTORATE
37
27
23
Sales(37%)
13
15
36
Trading profit before taxation
(15%)
3019
Trading profit before taxR221.2 million
SalesR13,407.2 million
We offer wholesale customers with formal operations the ability to trade under national retail brands such as Saverite, Multisave, Powersave and Liquorland. Our marketing team offers support to these supermarkets and bottle stores, assisting owners with marketing initiatives such as designing of leafl ets, signage and implementing national television and radio advertising campaigns.
On the retail side, all our outlets are consolidated under the Cambridge Food brand. Cambridge Food’s mission is to help its customers save money every day so that they can live better. Food Retail service departments, consisting of an on-site bakery, butchery and fresh fruit and vegetable offering form an important component of our Cambridge Food retail offering.
Future outlook
We anticipate a continuation of the aggressive trading amongst the corporate food retailers serving the low-income customer. However, we are cautiously optimistic about our growth over the next year. The LSM 2 – 6 market remains highly fragmented, and Masscash is well-positioned to offer new retail formats and to expand our current footprint to better supply food, cosmetics, liquor, cigarettes and cellular to lower-end consumers.
To ensure future growth, Masscash will focus on building its Retail Division, expanding the wholesale range to include meat as well as fruit and vegetables, growing the franchise formats and expanding into Africa. Our strategy is to open 10 more stores through our Rhino acquisition each year as we seek to grow our footprint nationally. The Company will also seek to develop the quality and depth of its new store pipeline and the speedy conclusion of binding agreements to secure approved sites. BBBEE
LEVEL 5
INTEGRATED STOCK
SYSTEM:
READ MORE More information on the divisional fi nancial
performance can be found in:
LETTER TO STAKEHOLDERS page 26
FINANCIAL DIRECTOR’S REVIEW pages 39 – 65
R Improve invoicing accuracy
R Remove manual interfaces
R Save costs
Thousands of children continue to receive a
balanced meal at a container kitchen sponsored
by Masscash. Each container costs about
R67,000 to convert and a Masscash store
then ‘adopts’ a container and provides a safe
and hygienic food preparation environment for
volunteers to prepare and distribute food to
hungry school children.
15Massmart Integrated Annual Report December 2012

JSE LIMITED SOCIALLY RESPONSIBLE INVESTMENT (SRI) INDEX
BEST PERFORMEROn 28 November 2012 the JSE SRI Index recognised Massmart, for the second year running, as one of the 10 Best Performers in the medium environmental impact category. The index, which takes into account a wide variety of social, environmental and governance dimensions, is a useful indicator of Massmart’s accountability performance.
CORPORATE ACCOUNTABILITY HIGHLIGHTS
This is a brief update of Massmart’s corporate accountability highlights
for the 26 weeks ended 23 December 2012. These initiatives fall under our
three accountability themes which are: enable sustainable supply and
consumerism; minimise the Group environmental footprint; and champion
social equality initiatives.
ECO-WISE PRODUCT OFFERING
Eco-wise branded product sales increased by an estimated 30% for the reporting period. In addition, Builders Warehouse together with Ellies sold 225,000 LEDs and 22,000 water effi cient shower heads through their “Green Stand Partnership”.
DIRECT FARM
A total of 514 tons of fresh produce was sold to our Massfresh division through procurement from our Direct Farm Programme, Ezemvelo, equating to a value of R2.6 million. In addition, 67 farmers, 36 being female, were trained through the programme.
ENABLE SUSTAINABLE SUPPLY AND CONSUMERISM
514 TONS
POST-CONSUMER E-WASTE RECYCLING
Makro, in partnership with Desco, facilitated the collection of 55 tons of post-consumer e-waste during the reporting period.
PACKAGING RATIONALISATION
M HOUSEHOLD CLEANING RANGE LAUNCHED Makro has launched a new private label household cleaning product range called "M". The new range of M cleaning products incorporates more environmentally sensitive packaging, which excludes PVC and has been designed to promote improved sorting, separation and recycling. The new range includes a concentrated fabric softener which makes use of a much smaller bottle and requires less plastic to manufacture.
30% INCREASE
55TONS
16 Massmart at a Glance

For further information
on Massmart's Corporate
Accountability, please visit
www.massmart.co.za
* Energy consumption data is annualised and normalised (outlying data is excluded). Municipal data is used where check meter data
is unavailable. Estimated margin of error is considered to be between 10% and 15%
CARBON DISCLOSURE PROJECT
In 2012 Massmart achieved a Carbon Disclosure Project score of 79% which represents a 7% improvement over 2011. 2012 also marked the fi rst year that Massmart verifi ed a portion of its Scope 2 electricity data.
ENERGY EFFICIENCY
Massmart’s kwh/m2 energy intensity increased by 10.8% due to additional refrigeration in Game Foodco and Jumbo stores, and cyclical increases related to air-conditioning and refrigeration demands peaking over the summer months. Electricity data accuracy and consistency improved signifi cantly as a result of greater emphasis being placed on the use of independent check meter data.*
CORPORATE SOCIAL INVESTMENT
Massmart spent R10.2m in CSI over the 26 weeks ended 23 December 2012 equating to 1.4% of net profi t after tax. The majority of our CSI contributions continue to be invested in school nutrition, early childhood development and school infrastructure and maintenance projects.
WOMEN’S EMPOWERMENT
A total of 1,409 women were invited to complete “The Women Empowerment” survey with the top barrier being identifi ed as a “lack of female role models in the business”. As a response, the CEO’s Council of Women Leaders has been established.
The Massmart CEO’s Council of Women Leaders was formed with the objective of providing women-to-women mentoring. Sixty women in the business attended the inaugural council meeting.
BBBEE
LEVEL 4 Massmart has successfully maintained its level 4 contributor status, according to the BBBEE Codes of Good Practice. Pleasingly, Massdiscounters has maintained its level 3 status.
MINIMISE THE GROUP ENVIRONMENT FOOTPRINT
CHAMPION SOCIAL EQUALITY INITIATIVES
THE WOMEN EMPOWERMENT SURVEY
204.9KWH/(GLA)M2
79%R10.2m WOMEN’S
COUNCIL
17Massmart Integrated Annual Report December 2012

VALUE ADDED STATEMENT
VALUE ADDED APPLIED
AS FOLLOWS (Rm):
TO SHAREHOLDERS AS DIVIDENDS
317.0
TO GOVERNMENT AS TAXATION
6,583.5
TO LENDERS AS INTEREST
106.0
DEPRECIATION AND AMORTISATION
342.6
MINORITIES
29.2
NET EARNINGS RETAINED
376.1
TO EMPLOYEES AS SALARIES, WAGES AND OTHER BENEFITS
2,536.6
R42,447.9mSALES, ROYALTIES, FRANCHISE FEES, RENTALS AND MANAGEMENT AND ADMINISTRATION FEES (INCLUSIVE OF VAT)
R10,291.0mVALUE ADDED
JUNE 2011: R69,167.1m
JUNE 2011: R14,886.5m
(R29,523.2m) COST OF SALES
JUNE 2011: (R49,957.1m)
(R2,707.0m) NET COSTS OF SERVICES AND OTHER OPERATING EXPENSES
JUNE 2011: (R4,405.3m)
R73.3mINTEREST AND INVESTMENT INCOME
JUNE 2011: R81.8m
When it comes to sustainability, we believe that we are ultimately measured by our
ability to add economic value in a way that is responsive to social, environmental
and governance imperatives.
Our Group value added statement is an indicator
of the economic value that we add. . .
18 Massmart at a Glance

EXECUTIVE DIRECTORS
GRANT PATTISON (42) BSC (ENG) (HONS) (UCT)
Chief Executive Offi cer and member of the Social and Ethics CommitteeAppointed 7 December 2004
Grant graduated from the University of Cape Town as an electrical engineer. After four years with the Anglo American group and two years consulting with The Monitor Group, Grant joined Massmart as Executive Assistant to the Executive Chairman in 1998. He has since held various positions within the Group, including Managing Director of Massdiscounters and Group Commercial Executive. He joined the Executive Committee in 2000 and the Board in 2004, becoming Deputy Chief Executive Offi cer in 2005, Chief Executive Offi cer Designate in 2006 and Chief Executive Offi cer on 1 July 2007.
GUY HAYWARD (47)BCOM, CTA (UCT), CA(SA)
Chief Operating Offi cerAppointed 15 May 2001
Guy graduated from the University of Cape Town in 1986 and, after serving articles with Deloitte Haskins & Sells, qualifi ed as a Chartered Accountant in 1989. During the 1990s he held fi nancial roles at Malbak and CNA Gallo in South Africa and at Goldman Sachs in London. He joined Massmart as Group Financial Executive in 2000 and was appointed Chief Financial Offi cer in 2001. In May 2012 he was appointed Chief Operating Offi cer. Guy is also a Governor of Hilton College.
ILAN ZWARENSTEIN (38)BCOM BACC, CA(SA)
Financial DirectorAppointed 7 May 2012
Ilan graduated from the University of the Witwatersrand in 1997. After completing his articles in 2000, he remained with Grant Thornton where he served as a manager in Corporate Finance and in Audit. In February 2003, Ilan was appointed as a partner at Grant Thornton. He joined Massmart at the end of 2005 as Group Finance Executive and was appointed Company Secretary in 2006. In May 2012 Ilan was appointed as Financial Director.
19Massmart Integrated Annual Report December 2012

NON-EXECUTIVE DIRECTORS
MARK J LAMBERTI (62) BCOM, MBA (WITS), PPL (HARVARD)
Chairman of the Board, Chairman of the Nomination Committee, a member of the Remuneration Committee and a member of the Audit and Risk CommitteeAppointed 30 August 1990
Following progress through a multi-functional retail career that began in 1975, Mark was appointed Managing Director of the ailing six-store Makro chain in 1988. After successful repositioning of the chain, he initiated the concept of Massmart as a holding company which owned Makro in 1990, to pursue an aggressive growth strategy in high-volume, low-gross margin, low-expense retailing and wholesaling.
In 1996, he was appointed Executive Chairman of Massmart and from July 2003 CEO and Deputy Chairman of the Board. At the end of June 2007 he relinquished his executive role to become non-executive Chairman. His role as architect and leader of Massmart has been widely recognised with numerous awards including that of the Ernst & Young South African Entrepreneur of the Year in 2001. In 2012 he received the prestigious Wits Business School Management Excellence Award for demonstrating ethical leadership, managerial excellence and societal relevance throughout a distinguished career. Mark currently serves as Chief Executive Offi cer of Transaction Capital Limited and a director and executive committee member of Business Leadership South Africa.
His commitment to education has led to his involvement as a benefactor, director or adviser to a number of educational institutions, including the Wits Business School where he is an Honorary Professor.
CHRIS SEABROOKE (60)BCOM, BACC, MBA, FCMA
Deputy Chairman of the Board and Lead Independent Director, Chairman of the Audit and Risk Committee, Chairman of the Remuneration Committee and a member of the Nomination CommitteeAppointed 1 February 2000
Chris has been a director of over 20 stock exchange-listed companies. He is currently CEO of Sabvest Limited, Chairman of Metrofi le Holdings Limited and Transaction Capital Limited and a director of Datatec Limited, Chrometco Limited, Net1 UEPS Technologies Inc (Nasdaq/JSE) and Brait S.E. (Luxembourg/JSE). He is also a director of a number of unlisted companies including Mineworkers Investment Company Proprietary Limited.
He is a former Chairman of the South African State Theatre and former Deputy Chairman of the inaugural National Arts Council of South Africa. He is a member of the Institute of Directors.
DAVID CHEESEWRIGHT (50)BSC (1ST CLASS) MATHEMATICS AND SPORTS SCIENCE, LOUGHBOROUGH UNIVERSITY (UK)
President and Chief Executive Offi cer - Walmart EMEA, a member of the Nomination Committee and a member of the Remuneration CommitteeAppointed 23 November 2011
David is the President and Chief Executive Offi cer for Walmart EMEA. He leads Walmart’s retail operations and oversees business development in Europe, the Middle East, Africa and Canada.
David’s career spans more than 20 years across the international retail and manufacturing sectors. Prior to his current role, he was President and Chief Executive Offi cer of Walmart’s Canadian operation, and previously Chief Operating Offi cer of ASDA, Walmart’s operation in the United Kingdom. He joined ASDA in 1999, holding senior positions over a nine-year period.
Before his careers with ASDA and Walmart, David held a range of leadership positions in the United Kingdom with Mars Confectionery, the world’s leading confectionery company.
20 Massmart at a Glance

JEFFREY DAVIS (50)BS ACCOUNTING (PENNSYLVANIA STATE UNIVERSITY), EMBA (UNIVERSITY OF PITTSBURGH)
Wal-Mart Stores, Inc.’s Executive Vice-President Finance and Treasurer Appointed 20 June 2011
Jeff is Wal-Mart Stores, Inc.’s Executive Vice-President Finance and Treasurer and has responsibility for treasury operations, capital markets, investor relations, risk management and US M&A. Jeffrey was previously Senior Vice President of Finance and Strategy, Operations, for Walmart U.S. He joined Walmart in 2006 as Vice President of Finance for the Walmart U.S. health and wellness merchandise unit.
Previously, he served as Chief Financial Offi cer for Lakeland Tours, LLC, where he led its acquisition growth strategy and was responsible for all accounting, fi nancial reporting treasury and capital structuring, and strategic planning functions.
Prior to that, Jeffrey was Chief Financial Offi cer for McKesson General Medical and he held a number of fi nancial leadership roles at the Hillman Co, a private investment holding company. He also spent four years at KPMG Peat Marwick as an audit supervisor.
DR NOLULAMO (‘LULU’) GWAGWA (53)MSC (KZN), MSC (LSE), PHD (UCL)
Member of the Audit and Risk Committee Appointed 1 November 2006
Lulu is Chief Operating Offi cer of Lereko Investments Proprietary Limited. She was Deputy Director General in the National Department of Public Works, responsible for establishing the national public works programme, and completed a fi ve-year term as the CEO of the Independent Development Trust. She has served on various Government commissions, is the CEO of Lereko, and is a non-executive director of FirstRand Limited and Sun International Limited.
PHUMZILE LANGENI (38)BCOM (NATAL), BCOM HONS (UNISA)
Chairperson of the Social and Ethics Committee and a member of the Audit and Risk Committee Appointed 25 August 2004
Phumzile is the Executive Chairperson of Afropulse Group Proprietary Limited, a women-led investment, investor relations and corporate advisory house. She is a stock broker by training and was previously the economic adviser to the
Minister of Minerals and Energy, and an executive director of dual-listed junior platinum miner, Anooraq Resources. Phumzile is the non-executive chairman of Astrapak Limited, a non-executive director of Imperial Holdings Limited, Peermont Global Proprietary Limited, the Mineworkers Investment Company Proprietary Limited, Primedia Proprietary Limited, Transaction Capital Limited, Metrofi le Holdings Limited and a member of the Port Regulator.
JOHN PETER (JP) SUAREZ (49)BA (HONS) (TUFTS UNIVERSITY) JD (UNIVERSITY OF PENNSYLVANIA)
Senior Vice President of International Business Development for Walmart International and a member of the Social and Ethics Committee Appointed 20 June 2011
JP is the Senior Vice President of International Business Development for Walmart International. JP is responsible for leading Walmart’s international merger and acquisition activities, international real estate and construction activities, and global format development efforts. Prior to being named to his current position in 2011, JP was Senior Vice President and General Counsel for Walmart International. He joined the company in 2004 as Vice President and General Counsel for Sam’s Club. JP also serves as a board member on the University Of Pennsylvania Law School Board Of Overseers. His previous experience includes serving as the United States’ EPA Assistant Administrator for Enforcement and Compliance, acting as a federal and state prosecutor, and working as Chief Enforcement Offi cer over New Jersey’s gaming industry.
21Massmart Integrated Annual Report December 2012
EXECUTIVE COMMITTEE
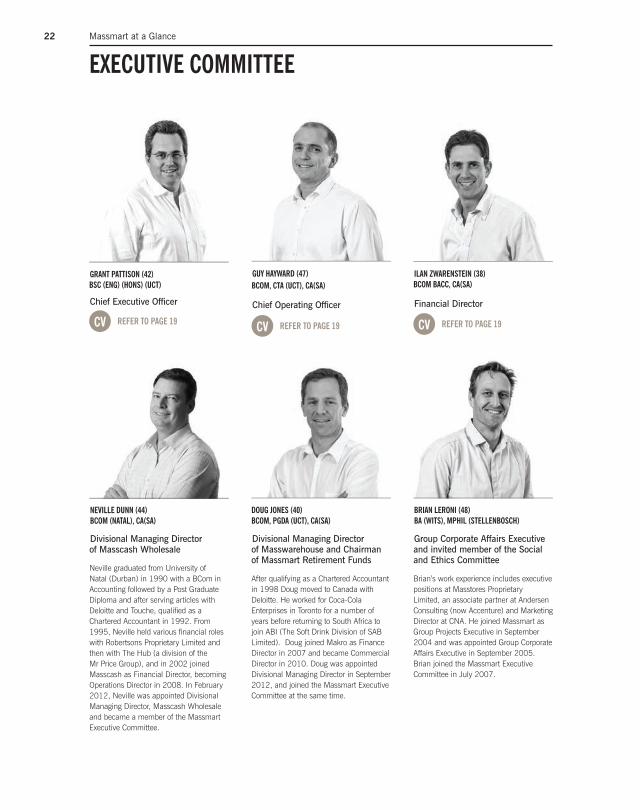
DOUG JONES (40)BCOM, PGDA (UCT), CA(SA)
Divisional Managing Director of Masswarehouse and Chairman of Massmart Retirement Funds
After qualifying as a Chartered Accountant in 1998 Doug moved to Canada with Deloitte. He worked for Coca-Cola Enterprises in Toronto for a number of years before returning to South Africa to join ABI (The Soft Drink Division of SAB Limited). Doug joined Makro as Finance Director in 2007 and became Commercial Director in 2010. Doug was appointed Divisional Managing Director in September 2012, and joined the Massmart Executive Committee at the same time.
NEVILLE DUNN (44)BCOM (NATAL), CA(SA)
Divisional Managing Director of Masscash Wholesale
Neville graduated from University of Natal (Durban) in 1990 with a BCom in Accounting followed by a Post Graduate Diploma and after serving articles with Deloitte and Touche, qualifi ed as a Chartered Accountant in 1992. From 1995, Neville held various fi nancial roles with Robertsons Proprietary Limited and then with The Hub (a division of the Mr Price Group), and in 2002 joined Masscash as Financial Director, becoming Operations Director in 2008. In February 2012, Neville was appointed Divisional Managing Director, Masscash Wholesale and became a member of the Massmart Executive Committee.
ILAN ZWARENSTEIN (38)BCOM BACC, CA(SA)
Financial Director
REFER TO PAGE 19CV
GUY HAYWARD (47)BCOM, CTA (UCT), CA(SA)
Chief Operating Offi cer
REFER TO PAGE 19CV
GRANT PATTISON (42)BSC (ENG) (HONS) (UCT)
Chief Executive Offi cer
REFER TO PAGE 19CV
BRIAN LERONI (48) BA (WITS), MPHIL (STELLENBOSCH)
Group Corporate Affairs Executive and invited member of the Social and Ethics Committee
Brian’s work experience includes executive positions at Masstores Proprietary Limited, an associate partner at Andersen Consulting (now Accenture) and Marketing Director at CNA. He joined Massmart as Group Projects Executive in September 2004 and was appointed Group Corporate Affairs Executive in September 2005. Brian joined the Massmart Executive Committee in July 2007.
22 Massmart at a Glance

PEARL MAPHOSHE (44) BA (HONS), HDIPED (DURBAN-WESTVILLE), MA (LONDON)
Group Human Capital Executive, Chairperson of the HR Forum and member of the Social and Ethics Committee
Prior to joining Massdiscounters Pearl worked for Telkom and Old Mutual and for Umgeni Water as General Manager: Corporate Services. Prior to assuming responsibility for Human Capital on the Massmart Executive Committee from August 2007, Pearl was Director of Human Resources at Massdiscounters. Pearl is also a guest lecturer and external examiner on the MBA programme at the University of Kwazulu Natal. She brings broad experience in managing and developing human capital to the Group.
MNCANE MTHUNZI (41)BCOM (ECONOMICS), PMD, GEDP (GIBS)
Group Supplier Development Executive
Mncane is the former CEO of the Consumer Goods Council of South Africa (CGCSA), an industry association for the retailers, manufactures and service providers. He has been the Managing Director of the Black Management Forum (BMF) for a period of three years. Prior to joining the BMF he worked for Microsoft as an Enterprise Strategy Consultant and later in a Sales Executive role within Microsoft. He was also a Senior Manager at PricewaterhouseCoopers. Mncane started his career at Accenture, where he worked in a number of industries both locally and internationally handling large-scale systems integrations and business solutions for a number of clients.
His leadership and stakeholder involvement includes being a member of Board of Trustees of Accenture’s Akha Trust and Independent Non-executive Director of Adcorp Holdings Ltd. Mncane’s career span is across a number of industries which include Transport, Industrial Products, Retail, Telecommunications, Broadcasting, Information Technology and the Government. Mncane joined the Massmart Executive Committee in October 2011.
MICHAEL SPIVEY (49)BSC (UNIVERSITY OF ARKANSAS), MASTER’S IN LAW IN INTERNATIONAL BANKING AND FINANCE (BOSTON UNIVERSITY), JURIS DOCTORATE (JD)
Massmart General Counsel and Chief Compliance Offi cer
Mike joined Massmart in 2011 following the Walmart transaction. He has a multi-faceted 20 year global business career that includes transactional, regulatory, fi nance and business development experiences. At Walmart, Mike provided legal and regulatory compliance counsel to numerous segments of the business. As a leader at the Export-Import Bank of the United States, Mike served as a senior attorney focusing on cross-border trade and structured transactions, and later led the Bank’s sales, marketing and product development operations.
Early in his career, Mike lived in Budapest, Hungary and worked as an associate with an international law fi rm and a foreign trade bank where he specialized in cross-border merger and acquisition transactions. At Massmart, Mike directs the company’s legal, regulatory and ethics affairs and serves on the Massmart Executive Committee.
23Massmart Integrated Annual Report December 2012

LLEWELLYN STEENEVELDT (44) BSC ENG (PHYS MET), GDE (INDUSTRIAL), MBA
Group Commercial Executive and Chairman of the Real Estate and Operations Forums
Llewellyn graduated from the University of the Witwatersrand in 1991 as a Physical Metallurgist. After seven years with Tongaat-Hulett group and three years with the Industrial Development Corporation, Llewellyn joined Massmart as Business Analyst in 2002. He has since held various positions within the Group, including Executive Assistant to the CEO and Managing Director of Builders Express. Llewellyn was appointed Group Commercial Executive and joined the Massmart Executive Committee in July 2009.
ROBIN WRIGHT (57)BCOM (NATAL), CA(SA)
Group Food Executive and Chairman of the Food and Liquor Forum
After graduating from Natal University with a BCom degree and qualifying with his CA (SA) in 1978, Robin spent six years in retailing and wholesaling at WG Brown before founding CCW in 1985. In 1998, he sold a controlling interest in CCW to Massmart and was appointed to the Massmart Executive Committee. He led the acquisition and integration of Browns and Weirs, and has spearheaded the growth of the Division to become South Africa’s leading food wholesaler. In February 2012, Robin was appointed Group Food Executive and he remains a member of the Massmart Executive Committee.
KEVIN VYVYAN-DAY (48)BCOM, BACC (WITS), CA(SA)
Divisional Chief Executive of Cambridge Food, member of the Risk Committee and Chairman of the General Merchandise Forum
After qualifying as a Chartered Accountant in 1989, Kevin consulted at both the Strategy Group (Deloitte) and Gemini Consulting.
Kevin joined UPD as Group Operations and Systems Director in 1995 and became Group Chief Executive Offi cer in 1996. Kevin joined Massmart as Divisional Chief Executive responsible for Makro and as a member of the Massmart Executive Committee in 2005. In September 2012, Kevin was appointed Divisional Chief Executive responsible for Cambridge Food.
LLEWELLYN WALTERS (49)BA, LLB (WITS)
Divisional Chief Executive of Massbuild and Chairman of the Supply Chain Forum
Llewellyn spent thirteen years in the banking industry where he held senior positions in a number of specialist fi nancial institutions before joining ABSA. In June 2003, Llewellyn joined Super Group, a JSE-listed supply chain and logistics company where his last position was Divisional MD responsible for the group’s African operations. He joined Massmart in November 2008 as Divisional Chief Executive for Builders Warehouse, later becoming responsible for the whole division, and was appointed to the Massmart Executive Committee upon joining.
EXECUTIVE COMMITTEE CONTINUED
24 Massmart at a Glance

CONTENTS R LETTER TO STAKEHOLDERS 26
R APPROVAL OF THE ABRIDGED
ANNUAL FINANCIAL STATEMENTS 31
R INDEPENDENT AUDITOR’S REPORT 32
R DIRECTORS’ REPORT 33
R AUDIT AND RISK COMMITTEE REPORT 37
R SOCIAL AND ETHICS COMMITTEE REPORT 38
R FINANCIAL DIRECTOR’S REVIEW
(INCLUDING THE AUDITED ABRIDGED
ANNUAL FINANCIAL STATEMENTS) 39
R DEFINITIONS AND FORMULAS 66
REPORT TO STAKEHOLDERS
MAKRO, MONTAGUE GARDENS

GRANT PATTISON (42) BSC (ENG) (HONS) (UCT)
GUY HAYWARD (47)BCOM, CTA (UCT), CA(SA)
MARK J LAMBERTI (62) BCOM, MBA (WITS), PPL (HARVARD)
LETTER TO STAKEHOLDERS
Introduction Most will be aware that Massmart has changed its fi nancial year-end to the end of December with effect from December 2012, being this reporting cycle. This means that this report comments on a six-month period, being the 26 weeks ended 23 December 2012.
Due to this report following so closely after the release of Massmart’s June 2012 integrated annual report in October 2012, it is necessarily brief. The next integrated annual report for the year ended December 2013 will be at Massmart’s usual high standards, with complete and useful disclosure. Included in this report is fi nancial information for Massmart’s 26 week reporting periods to December 2011 and December 2012, and the comparative period used in the Group and Company annual fi nancial statements is the audited fi nancial results for the 52 weeks ended 24 June 2012.
It is also our fi rst report to shareholders in a new format, where some of the sections including the Group annual fi nancial statements, the Company annual fi nancial statements and further information relating to Corporate Governance are now only included on our website (www.massmart.co.za) and not in the body of this report.
OverviewFor the 26 weeks ended 23 December 2012, Massmart’s total sales increased by 14.7% over the prior comparative period, while operating profi t and headline earnings declined by 17.7% and 21.2% respectively. However, excluding costs relating to the Walmart transaction and integration, which include the additional R140 million related to the October 2012 Competition Appeal Court ruling, and foreign exchange movements, operating profi t increased by 6.1% and headline earnings by 5.8%.
Comparable sales increased by 7.3% and period-weighted product infl ation was 3.7% refl ecting positive volume growth for the Group. There was some evidence of slower growth amongst middle- and lower-income customers towards the end of the reporting period.
Massbuild and Masscash performed well, growing profi t ahead of sales growth; Masswarehouse increased profi ts, although at a rate below sales growth, as they absorbed the front-loaded costs of two new Makro stores; and Massdiscounters’ profi ts declined as comparable sales in Game SA increased by only 1.0%.
Cash fl ow generated from operations was strong at R2.8 billion, although following Christmas 2012 the Group is slightly over-stocked due to the sales slow-down in Massdiscounters.
With the Walmart transaction and integration now behind us, the Group is focused on operational disciplines, strategic implementation, and extracting returns from the capital investments made over several years in Supply Chain and Food Retail.
26 Reports to Stakeholders

EnvironmentDuring the third quarter of calendar 2012 we could only see the effect of the South African labour unrest in our sales in those affected towns. We did however notice a marked slow-down in sales from November, which was only interrupted for the last two weeks of Christmas trade. We assume therefore that the economic effect of that unrest started fl owing into the broader economy in the fourth quarter.
Offi cial South African infl ation remained relatively benign during our reporting period, despite large increases in fuel and energy costs, which will likely eventually result in higher levels of infl ation. In our product categories, infl ation remains low at 3.7%, suggesting that offi cial infl ation occurred at higher levels outside that for consumer goods. Our Food and Liquor infl ation increased to 6.8% but has since paused and may now possibly decline. The weaker Rand is likely to bring further infl ation in the General Merchandise and Home Improvement categories.
As consumer expenditure slowed, we saw increased discounting amongst most retailers and the inevitable fi ght to hold or gain market share, which was positive for consumers.
Examining both our own recent internal sales trends and other listed retailers sales updates issued in the fi rst quarter of 2013, it seems that upper-end consumers are in better shape than middle- and lower-end consumers. The middle-income consumers are impacted by infl ation and possibly over-extended credit, while lower-income consumers are affected by infl ation and possibly the labour unrest.
StrategyFollowing the October 2012 ruling of the Competition Appeal Court, the legal aspects of the Walmart transaction and the integration activities are complete and we are now able to focus on improving the operations and implementing our Strategic Agenda. We are focused on “Saving you money, so you can live better”, and becoming Africa’s most trusted retailer.
The primary phase of our Group-wide supply chain investments will be fi nished by the end of 2013, when we will have completed the network of three Massdiscounters’ RDC’s, three Makro Regional Warehouses, one Cambridge DC and one Massbuild Central DC. Alongside investments in skills and systems, this completes the re-engineering of Massmart’s supply chain. The benefi ts of the investment should be visible in the next fi ve to ten years as the network is optimised.
We have also completed the fi rst phase of our investments in Retail Food in Cambridge, Game Foodco, Makro Fresh and Saverite. We have successfully established ourselves in the South African Food Retail market with an estimated presence of R10 billion. From this base the Food Retail business should grow in size and profi tability, from organic growth and conversions.
We continue to expand Game and Builders Warehouse into Africa. Several new sites have been approved in our existing African markets and Game sites have also been approved in Angola and Kenya, both of which are new markets for Massmart. The Group’s Africa Food Retail strategy remains in the planning phase.
Despite the new targets in BBBEE Codes of Good Practice and the dilution of our BBBEE transaction as part of the Walmart transaction, we have still maintained a level 4 status.
Divisional operational review Massdiscounters
Comprises the 114-store General Merchandise discounter and Food retailer Game, which trades in South Africa, Botswana, Ghana, Lesotho, Malawi, Mozambique, Namibia, Nigeria, Tanzania, Uganda and Zambia; and the 19-store Hi-tech retailer DionWired trading in South Africa.
27Massmart Integrated Annual Report December 2012
LETTER TO STAKEHOLDERS CONTINUED
Divisional comparable sales for the 26 weeks ended 23 December 2012 increased by 2.6%, with product infl ation of 0.8% for the same period. Total sales increased by 7.7% but disappointingly trading profi t before tax decreased by 14.8% as Game South Africa’s comparable sales growth slowed to just 1.0%. Game South Africa’s core customer is middle-income and it is this customer group’s spending that is slowing as the adverse effects of infl ation and over-extended consumer-credit are felt. Game Africa and DionWired performed well however, with profi t increasing ahead of sales growth in both businesses. Game Africa’s total sales increased by 8.7% in Rands and by 9.2% in local currencies.
There are now 27 stores in the Foodco format (including fi ve in Africa), and this category is performing at or above expectations.
The fi nal and Durban-based Regional Distribution Centre (RDC) was commissioned at the start of the period which now completes the national network. Whilst these facilities are expensive in the short-term, and this RDC opening certainly impacted the period’s profi ts, they provide a signifi cant opportunity for positive operational and trading leverage in the medium- to long-term.
In January 2013, Massdiscounters’ CEO, Jan Potgieter, resigned. Jan was with Massdiscounters for eight years, six of them as CEO, and we thank him for his contribution to the growth and development of the business. Robin Wright, the former Masscash CEO, is acting CEO.
During the period seven Game stores and one DionWired store were opened, increasing net space by 23,952 m² (5.8%). In the 52 weeks ended December 2013, Massdiscounters will open seven Game stores and three DionWired stores in South Africa.
Masswarehouse
Comprises the 18-store Makro warehouse-club trading in Food, General Merchandise and Liquor in South Africa; and Fruitspot a Johannesburg-based distributor, processor and wholesaler of fresh Fruit and Vegetables.
Divisional comparable sales for the 26 weeks ended 23 December 2012 increased by 8.6% with product infl ation of 3.4%. Total sales grew by 23.5%, boosted by the fi ve new Makro store openings since September 2011, and trading profi t before tax increased by 12.7%. Despite the expected higher cost levels from the new stores, which includes pre-opening costs of R28.2 million (2011: R34.8 million), Makro is trading strongly and remains well managed. Growth in trading profi t before interest for Makro’s comparable stores was in line with the rate of comparable sales growth for the period.
In September 2012, Doug Jones became MD of Masswarehouse following Kevin Vyvyan-Day’s move to become CEO of Cambridge in Masscash.
During the period two Makro stores were opened, increasing net space by 24,847 m² (17.0%). In the 52 weeks ended December 2013, Makro will open two new stores in South Africa, but one of these is a relocation.
Massbuild
Comprises 85 stores, trading in DIY, Home Improvement and Builders Hardware, under the Builders Warehouse, Builders Express and Builders Trade Depot brands in South Africa and Botswana.
Divisional comparable sales for the 26 weeks ended 23 December 2012 increased by 9.7% with estimated product infl ation of 2.7%. Total sales increased by 10.0% and trading profi t before tax increased by 23.6%. The strong fi nancial performance refl ects the superb efforts of management and employees to: improve customer service; optimise merchandise levels; merchandise innovatively; and control expenses.
Builders Warehouse and Builders Express continue to transform the South African Home Improvement market. It seems likely that much of this division’s sales growth came from market-share gains. The Builders Trade Depot’s performance improved but sales remain soft given the tepid South African residential housing market.
28 Reports to Stakeholders

In its second year of operation, Builders Warehouse Gaborone is performing ahead of expectations. During 2013 and 2014, we hope to open two stores in Mozambique, one in Zambia and a second in Botswana. In April 2013 we will open our national Distribution Centre (DC) to the north of Johannesburg. As we have seen with other new DCs, in the fi rst year of operation there is a signifi cant adverse expense impact particularly from the lease-smoothing charge and consequently this division’s profi t growth for the year to December 2013 will be hampered.
One Builders Express store was opened resulting in net trading space increasing by 2,084 m² (0.5%). In the 52 weeks ended December 2013, Massbuild will open three and six new Builders Warehouse and Builders Express stores respectively in South Africa, and a Builders Warehouse store in each of Botswana and Mozambique.
Masscash
Comprises 79 Wholesale Cash and Carry and 44 Retail Cash and Carry stores trading in South Africa, Botswana, Lesotho, Namibia and Swaziland; and Shield, a voluntary buying association.
Divisional comparable sales for the 26 weeks ended 23 December 2012 increased by 8.6% with estimated product infl ation of 6.4%. Total sales increased by 15.3%, bolstered by the Rhino acquisition in March 2012, and trading profi t before tax increased by 19.4%. This Division traded hard in an increasingly competitive environment caused partly by lower-income consumers struggling with higher infl ation. Profi tability continues to improve in the Wholesale Division, and in the Retail Division we are beginning to see the positive results of our investments in the prior year in new stores, structures and DC capacity.
Rhino, acquired in March 2012 and now comprising 18 stores, continues to trade well.
In September 2012 Kevin Vyvyan-Day became CEO of Cambridge within Masscash.
One Retail store and three Wholesale stores were acquired and two new Retail stores were opened, whilst fi ve Wholesale stores and one Retail store were closed. Net trading space increased by 12,462 m² (3.3%). In the 52 weeks ended December 2013, one Wholesale store will be opened in Mozambique, and eight Retail stores will be opened.
Walmart transaction and integrationIn this period the Competition Appeal Court set down the fi nal ruling of the Walmart transaction. There were two material adjustments being: the increase in the Supplier Development Fund from R100 million to R240 million; and the re-employment of the 503 previously retrenched employees.
The employees impacted by the retrenchments during 2009 at Game were all offered re-instatement. Of the 316 employees who responded to this offer, 237 have been re-instated and the remaining 79 have received various benefi ts.
The Supplier Development Fund is operational and has already made signifi cant progress in suppliers or manufacturers of wine, paint and chemicals, and fresh produce.
The Walmart transaction costs are behind us and for the 2013 reporting period Integration costs will be included as normal operating costs.
GovernanceAs mentioned in the previous Integrated Report, the Board and its committees have adapted and where necessary introduced new practices and processes necessary to address the governance nuances related to a public company with a value adding controlling shareholder. Liaison at Board level between Walmart and Massmart has been constructive and respectful of both company’s governance responsibilities to shareholders.
The Board has adopted the necessary processed and practices in line with the Companies Act of South Africa, the King Report on Governance for South Africa and King Code of Governance Principles (King III) and the JSE Limited Listings Requirements.
29Massmart Integrated Annual Report December 2012

Corporate accountability reviewMassmart continues to implement a comprehensive Corporate Accountability programme and we were proud to again, be identifi ed as one of only ten best performers in the Johannesburg Stock Exchange Socially Responsible Investment (SRI) Index. Broad-based Black Economic Empowerment (BBBEE) remains a priority focus area and we were pleased to retain our level 4 BBBEE contributor status which was based on the new six to ten year Employment Equity and Preferential Procurement scorecard targets. Walmart’s positive sustainable development impact has been keenly felt, specifi cally in relation to new or re-invigorated interventions in areas that include energy effi ciency, waste management, packaging rationalisation, ethical sourcing and women’s empowerment. Summary highlights covering the Group’s corporate accountability performance for the 26 weeks ended 23 December 2013 are described on pages 16 and 17 of this report.
Prospects and appreciationFor the 14 weeks to 31 March 2013, total sales increased by 10.3% and comparable sales increased by 6.0%, continuing the slower sales trends experienced towards the close of the fi nancial year.
The South African consumer environment remains diffi cult and sales growth may be under some pressure for the remainder of the fi nancial year. If the current sales trends continue, it will be diffi cult to meet our objective which is to achieve trading profi t growth (excluding foreign exchange movements and Walmart transaction costs) equal to sales growth.
Value extracted from integration will be invested in price.
The fi nancial information on which this outlook statement is based has not been reviewed or reported on by the Company’s External Auditors.
The shortened period on which we now report marks the fi nal step in Massmart’s alignment with Walmart and concludes a longer than anticipated period of change and unavoidable diversion from the day to day imperatives of customer care and shop keeping.
Our appreciation and gratitude is due to all stakeholders for their contribution and commitment to Massmart during this period. Your support fuels our dedication to entrenching Massmart’s unique position and performance in the distribution of consumer goods on Africa.
On behalf of the Board
Mark J. Lamberti Grant Pattison Guy Hayward
Chairman Chief Executive Offi cer Chief Operating Offi cer
8 April 2013
LETTER TO STAKEHOLDERS CONTINUED
30 Reports to Stakeholders

APPROVAL OF THE ABRIDGED ANNUAL FINANCIAL STATEMENTSfor the year ended 23 December 2012
This Massmart Integrated Annual Report for December 2012 contains audited abridged annual fi nancial statements which comprise a summary of the audited annual fi nancial statements prepared by the Company for the year ended 23 December 2012. The preparation of the Group’s consolidated results, from which these summarised annual fi nancial statements were derived, was supervised by the Financial Director, Ilan Zwarenstein, BCom, CA(SA). These results have been audited in compliance with any applicable requirements of the Companies Act of South Africa and were prepared under s29(1) of this Act, requirements of the JSE Limited Listings Requirements for abridged reports, as well as the information required by IAS 34 Interim Financial Reporting.
The summarised annual fi nancial statements for the year ended 23 December 2012, as described above, were approved by the Board of Directors on 8 April 2013 and signed on its behalf by:
GM Pattison I Zwarenstein
Chief Executive Offi cer Financial Director
A full set of the Group’s annual fi nancial statements for the year ended 23 December 2012 can be found at:
http://www.massmart.co.za/invest_profi le/fi nancial_results/2013/massmart_ar2013/fi nancials/group/approval_afs.asp
The following audited abridged annual fi nancial statements can be found within the Financial Director’s Report:R Income statementR Statement of comprehensive incomeR Statement of fi nancial positionR Statement of changes in equityR Statement of cash fl owsR Selected explanatory notes to the abridged Group annual fi nancial statements
The Corporate Governance section includes the following notes derived from the Group’s consolidated results:R Directors’ emoluments noteR Interests of directors in the Company's share schemeR Shareholders’ analysis note
Company Secretary certifi cateI, Philip Sigsworth, the Company Secretary of Massmart Holdings Limited, certify that, to the best of my knowledge and belief, all returns required of a public company have, in respect of the year under review, been lodged with the Registrar of Companies and that all such returns are true, correct and up to date.
Philip Sigsworth
Company Secretary
Annual compliance certifi cate for issuers with a primary listing on the JSEI, the undersigned, Ilan Zwarenstein, being duly authorised hereto, certify to the JSE Limited (the JSE) that Massmart Holdings Limited and its directors have, during the 12 months ended 31 December 2012, complied with all Listings Requirements and every disclosure requirement for continued listing on the JSE imposed by the JSE during that period.
I Zwarenstein
Duly authorised hereto, for and on behalf of the Directors of the Company.
31Massmart Integrated Annual Report December 2012

To the shareholders of Massmart Holdings LimitedThe accompanying summary consolidated fi nancial statements of Massmart Holdings Limited, incorporated in the Financial Director’s review, which comprise the summary consolidated statement of fi nancial position as at 23 December 2012, the summary consolidated income statements, statements of comprehensive income, changes in equity and cash fl ows for the year then ended on pages 52, 44, 50, 59 and 60 respectively, related notes on pages 62 to 65 and the headline earnings table on page 51 are derived from the audited consolidated fi nancial statements of Massmart Holdings Limited for the year ended 23 December 2012. We expressed an unmodifi ed audit opinion on those consolidated fi nancial statements in our report dated 8 April 2013. Our auditor’s report on the audited consolidated fi nancial statements contained an Other Reports paragraph (see below).
The summary consolidated fi nancial statements do not contain all the disclosures required by International Financial Reporting Standards and the requirements of the Companies Act of South Africa as applicable to annual fi nancial statements. Reading the summary consolidated fi nancial statements, therefore, is not a substitute for reading the audited consolidated fi nancial statements of Massmart Holdings Limited.
Directors’ responsibility for the summary Consolidated Financial StatementsThe directors are responsible for the preparation of the summary consolidated fi nancial statements in accordance with the requirements of the JSE Limited Listings Requirements for abridged reports, set out in the approval of the abridged annual fi nancial statements on page 31, and the requirements of the Companies Act of South Africa as applicable to summary fi nancial statements, and for such internal control as the directors determine is necessary to enable the preparation of the summary consolidated fi nancial statements that are free from material misstatement, whether due to fraud or error.
Auditor’s responsibilityOur responsibility is to express an opinion on the summary consolidated fi nancial statements based on our procedures, which were conducted in accordance with International Standard on Auditing (ISA) 810, Engagements to Report on Summary Financial Statements.
OpinionIn our opinion, the summary consolidated fi nancial statements derived from the audited consolidated fi nancial statements of Massmart Holdings Limited for the year ended 23 December 2012 are consistent, in all material respects, with those consolidated fi nancial statements, in accordance with the requirements of the JSE Limited Listings Requirements for abridged reports, set out in the approval of the abridged annual fi nancial statements on page 31, and the requirements of the Companies Act of South Africa as applicable to summary fi nancial statements.
Other reports required by the Companies Act The “other reports required by the Companies Act” paragraph in our audit report dated 8 April 2013 states that, as part of our audit of the consolidated fi nancial statements for the year ended 23 December 2012, we have read the Directors’ Report, the Audit Committee’s Report and the Company Secretary’s Certifi cate for the purpose of identifying whether there are material inconsistencies between these reports and the audited consolidated fi nancial statements. These reports are the responsibility of the respective preparers. The paragraph also states that, based on reading these reports, we have not identifi ed material inconsistencies between these reports and the audited consolidated fi nancial statements. The paragraph furthermore states that we have not audited these reports and accordingly do not express an opinion on these reports. The paragraph does not have an effect on the summary consolidated fi nancial statements or our opinion thereon.
Registered Auditor
Per: Allister CarshagenDirector
8 April 2013
52 Corlett Drive, Johannesburg, Gauteng, South Africa
INDEPENDENT AUDITOR’S REPORT ON THE ABRIDGED ANNUAL FINANCIAL STATEMENTSfor the year ended 23 December 2012
32 Reports to Stakeholders

DIRECTORS’ REPORTfor the year ended 23 December 2012
Directors’ responsibilitiesThe Directors acknowledge responsibility for the preparation of the annual fi nancial statements which, in their opinion, fairly present the results and cash fl ows for the 26 weeks ended 23 December 2012 and the state of affairs of Massmart Holdings Limited and its subsidiaries at the end of the period. The external auditors are responsible for reporting on the fair presentation of these fi nancial statements.
The Company and its subsidiaries have maintained adequate accounting records and an effective system of internal controls to ensure the integrity of the underlying information. Appropriate accounting policies, supported by sound and prudent managerial judgments and estimates, have been consistently applied.
The Audit and Risk Committee of the Board reviews the fi nancial information presented and ensures that there has been adherence to International Financial Reporting Standards. Internal and External Auditors of Group companies have unrestricted access to the Committee.
Group fi nancial resultsThe fi nancial results of the Group are set out in the income statement, statement of comprehensive income, the statement of cash fl ows and the statement of changes in equity. The fi nancial position of the Group is set out in the statement of fi nancial position.
DividendIn light of the new South African Dividend Tax introduced with effect from 1 April 2012 (“Dividend Tax”), Massmart has adjusted the Company’s dividend policy, which is now to declare and pay an interim and fi nal cash dividend representing a 1.55 times dividend cover unless circumstances dictate otherwise (the policy was 1.7 times dividend cover prior to the introduction of the Dividend Tax). For the 26 weeks ended 23 December 2012, the Board has resolved to maintain the absolute value of the fi nal cash dividend in the prior fi nancial year, adjusted for the change in the Dividend Tax Legislation, notwithstanding the resultant lower dividend cover, due to the strong liquidity position of the Group and its growth prospects. The Group’s fi nal cash dividend has been adjusted to refl ect the benefi t to the Company of no longer paying the Secondary Tax on Companies (“STC”) on the net dividend.
With regard to the fi nal distribution to shareholders, the Directors resolved to distribute to shareholders registered in the books of the Company on 22 March 2013, a fi nal cash dividend of 275 cents (December 2011: 252 cents).
Shares in issuePlease fi nd the movement in ordinary and preference shares for the period under review below:
Ordinary sharesClosing balance June 2011 213,883,460Converted preference shares* 2,241,001
Closing balance June 2012 216,124,461Converted preference shares* 785,734
Closing balance December 2012 216,910,195
* The preference shares relate to Massmart’s Thuthukani Empowerment Trust and Black Scarce Skills Trust
Preference sharesClosing balance June 2011 15,488,410Converted to ordinary shares (2,241,001)
Closing balance June 2012 13,247,409Converted to ordinary shares (785,734)
Closing balance December 2012 12,461,675
33Massmart Integrated Annual Report December 2012

DIRECTORS’ REPORT CONTINUEDfor the year ended 23 December 2012
On 1 October 2012, the fi nal conversion of ‘A’ preference shares to ordinary shares through the Thuthukani Trust occurred. The participating employees had the option of converting their remaining share allocation into Massmart ordinary shares and continue to receive 100% of the dividend on their ordinary shares or they could sell their remaining share allocation and receive net proceeds after tax and selling expenses.
Directorate and secretaryThe current directorate of the Company is shown on pages 19 to 24. In line with the Walmart International regional reporting structure that was implemented post the Massmart-Walmart merger, Doug McMillon, who is the Chief Executive Offi cer and President of Walmart International Operations, resigned from the Massmart board of directors with effect from 20 August 2012. Doug was appointed to the Massmart board upon completion of the Massmart-Walmart transaction on 20 June 2011.
David Cheesewright, who is the Chief Executive Offi cer and President of Walmart’s Europe Middle East Africa (EMEA) region into which Massmart reports, has been appointed in Doug’s stead with effect from 20 August 2012. David was previously appointed as an alternate director on the Massmart board on 23 November 2011.
The Board now comprises ten directors of whom seven are non-executive and four are independent. In addition, each Board committee is chaired by an independent director.
The Company Secretary provides a central source of guidance and advice to the Board, and within the Company, on matters of ethics and good governance.
The Company Secretary is Philip Sigsworth, CA(SA), whose business and postal addresses are the same as that of the Company. Philip was appointed on 7 May 2012.
In accordance with the provisions of the Company’s Articles of Association, Messrs. MJ Lamberti, G Pattison and JP Suarez, and Ms. P Langeni will retire at the annual general meeting. Being eligible, they all offer themselves for re-election.
Interests of Directors in the Company’s sharesAt 23 December 2012, Directors owned ordinary shares in the Company, or options over ordinary shares in the Company, directly or indirectly, aggregated as to benefi cial and non-benefi cial ownership, as follows:
December 2012 June 2012
Shares Options Shares Options
Benefi cialNon-
benefi cial Benefi cialNon-
benefi cial Benefi cialNon-
benefi cial Benefi cialNon-
benefi cial
Non-executive directorsMJ Lamberti – – – – – – – –CS Seabrooke – – – – – – – –D Cheesewright – – – – – – – –JA Davis – – – – – – – –NN Gwagwa 9,800 – – – 9,800 – – –P Langeni 9,800 – – – 9,800 – – –CD McMillon – – – – 2,400 – – –JP Suarez – – – – – – – –Executive directorsGM Pattison 696,473 – 205,603 – 696,473 – 254,603 –GRC Hayward 222,894 – 270,529 – 394,394 – 270,529 –I Zwarenstein – – 182,659 – – – 202,659 –
34 Reports to Stakeholders

At the date of this report, the Directors’ holdings were as follows:
December 2012 June 2012
Shares Options Shares Options
Benefi cialNon-
benefi cial Benefi cialNon-
benefi cial Benefi cialNon-
benefi cial Benefi cialNon-
benefi cial
Non-executive directorsMJ Lamberti – – – – – – – –CS Seabrooke – – – – – – – –D Cheesewright – – – – – – – –JA Davis – – – – – – – –NN Gwagwa 9,800 – – – 9,800 – – –P Langeni 9,800 – – – 9,800 – – –JP Suarez – – – – – – – –Executive directorsGM Pattison 596,473 – 205,603 – 696,473 – 254,603 –GRC Hayward 222,894 – 270,529 – 222,894 – 270,529 –I Zwarenstein – – 182,659 – – – 202,659 –
SubsidiariesAs at the date hereof, the following companies are principal subsidiaries of the Company:
R Massbuild (Proprietary) Limited (previously Builders Trade Depot) 2004/035206/07
R Masscash Holdings (Proprietary) Limited 1997/014716/07
R Massmart International Holdings Limited (incorporated in Mauritius) 47902 C1/GBL
R Massmart Management & Finance Company (Proprietary) Limited 1992/004084/07
R Masstores (Proprietary) Limited 1991/006805/07
R Mystic Blue Trading 62 (Proprietary) Limited 2005/018657/07
Details of the Company’s interests in material subsidiaries are set out in note 36. http://www.massmart.co.za/invest_profi le/fi nancial_results/2013/massmart_ar2013/fi nancials/group/approval_afs.asp Total net profi t after tax for all subsidiaries for the 26 weeks ended 23 December 2012 amounted to R240.4 million (Dec 2011: R803.8 million/Jun 2012: R458.6 million).
Borrowing powersIn terms of the Memorandum of Incorporation, the Group has unlimited borrowing powers. At 23 December 2012, borrowings were R1.7 billion (June 2012: R2.1 billion).
Going concernThe Directors are of the opinion that the business will be a going concern in the year ahead. In reaching this opinion, the Directors considered the following factors:R strong positive cash fl ows from trading;R no recurring operating losses at Divisional and Group level;R well-controlled working capital and good quality inventory;R approved short- and long-term fi nancing, with suffi cient additional short-term borrowing capacity if required;R key executive management in place;R there have been no material changes that may affect the Group in any of our customer, product or geographic markets; andR budgets to December 2013 refl ect a continuation of the above positive issues.
35Massmart Integrated Annual Report December 2012

LitigationAs part of the litigation relating to the Walmart/Massmart merger, in March 2012, the Competition Appeals Court ordered Massmart to commission a study comprising experts appointed by Massmart and the two intervening parties to the litigation. The objective of the study was to determine the most appropriate means by which South African suppliers could be empowered to respond to the challenges posed by the merger. The commissioned study resulted in separate opinions offered by Massmart and the two intervening parties. In October 2012, the Court issued its ruling relating to the study by ordering Massmart to establish a supplier development fund (Fund) to minimise the risks to micro-, small- and medium-sized producers of South African products caused or potentially caused by the merger. The Court further ordered Massmart to contribute up to a maximum amount of R200 million to the Fund. This amount, in addition to the R40 million previously committed via the Fund, totals a Massmart commitment to supplier development initiatives of R240 million. Among other governance details related to the organisation of the Fund, the Court further ordered Massmart to report annually to the Competition Commission of South Africa details of its supplier development activities. Massmart is in the process of complying with the order.
There are no litigious cases or exposures.
Change in year-endIn order to align the Group better with Wal-Mart Stores, Inc. (Massmart’s ultimate holding company), Massmart’s year-end has changed from the end of June to the end of December.
The change in year-end means that Massmart will report audited results for the six months to 23 December 2012 in April 2013, and audited results for the twelve months to December 2013 in April 2014.
Direct and ultimate holding companiesThe Company’s direct holding company is Main Street 830 (Proprietary) Limited and the Company’s ultimate holding company is Wal-Mart Stores, Inc.
Subsequent eventsWith effect from the end of January 2013, Massmart acquired control of seven Makro stores that had previously been lease-held. The cash consideration paid for control amounted to R575 million.
On behalf of the Board
Philip Sigsworth
Company Secretary
8 April 2013
Massmart addressThe Company’s registered offi ce and postal address are as follows:Registered offi ce Postal address
Massmart House Private Bag X416 Peltier Drive SunninghillSunninghill Ext 6 2157Sandton South Africa2146South Africa
DIRECTORS’ REPORT CONTINUEDfor the year ended 23 December 2012
36 Reports to Stakeholders

The Audit and Risk Committee met twice during the 26 weeks ended 23 December 2012 and the Internal and External Auditors presented formal reports to the Committee and attended these meetings by invitation. In response to the requirements of the Companies Act, King III and in terms of its charter, the Committee can report as follows:
R The scope, independence and objectivity of the External Auditors was reviewed;R The audit fi rm Ernst & Young Inc., and audit partner Allister Carshagen are, in the Committee’s opinion, independent
of the Company and have been proposed to the shareholders for approval to be the Group’s auditor for the 2013 fi nancial year;
R On an on-going basis, the Committee reviews and approves the fees proposed by the External Auditors;R The appointment of the External Auditor complies with the Companies Act, as amended, and with all other legislation
relating to the appointment of External Auditors;R The nature and extent of non-audit services provided by the External Auditors has been reviewed to ensure that the fees
for such services do not become so signifi cant as to call into question their independence;R The nature and extent of future non-audit services have been defi ned and pre-approved;R No reportable irregularities were identifi ed and reported by the External Auditors to the Committee;R The Committee is satisfi ed that the internal fi nancial controls of the Divisions and Group operated effectively throughout
the 26 weeks ended 23 December 2012 and can be relied upon. In addition, the Committee is satisfi ed with the Group’s accounting policies and that these have been appropriately and consistently applied throughout the 26 weeks ended 23 December 2012;
R The Committee reviewed this integrated annual report and recommended it to the Board for approval;R As at the date of this report, no complaints have been received relating to accounting practices and internal audit of
the Company or to the content or auditing of the Company’s fi nancial statements, or to any related matter; andR The Massmart website (www.massmart.co.za) has a link enabling the general public to lodge complaints with the
Committee. Since establishing this functionality in 2009, no complaints have been received.
Chris Seabrooke
Chairperson of the Audit and Risk Committee
8 April 2013
AUDIT AND RISK COMMITTEE REPORTfor the year ended 23 December 2012
37Massmart Integrated Annual Report December 2012

SOCIAL AND ETHICS COMMITTEE REPORTfor the year ended 23 December 2012
The Massmart Social and Ethics Committee was constituted in June 2011 and comprises two non-executive Directors and the Massmart CEO. An independent external advisor, the Group General Counsel, the Group’s Human Resources Executive and the Group’s Corporate Affairs Executive attend meetings by invitation.
The Committee is governed by a charter and monitors Group performance in terms of defi ned Social and Ethics performance indicators that have been formulated with reference to Regulation 43(5) of the 2008 Companies Act.
These indicators, which include but are not limited to, OECD anti-corruption guidelines, United Nations Global Compact principles, the Employment Equity Act, Johannesburg Stock Exchange Socially Responsible Index criteria and Broad-based Black Economic Empowerment elements, are reviewed by the Committee, on a rotational or core agenda basis.
The Committee met once, on 20 November 2012, during the 26 weeks ended 23 December 2012, at which meeting, in response to the requirements of the Companies Act, performance in the following areas was reviewed:R JSE Socially Responsible Investment Index;R Anti-corruption Compliance;R Consumer & Product Safety;R Human capital management;R Stakeholder Relations;R Socio-Economic Development; andR Environmental Impact.
The Committee confi rms that no material issues were identifi ed during this review.
Phumzile Langeni
Chairperson of the Social and Ethics Committee
8 April 2013
38 Reports to Stakeholders
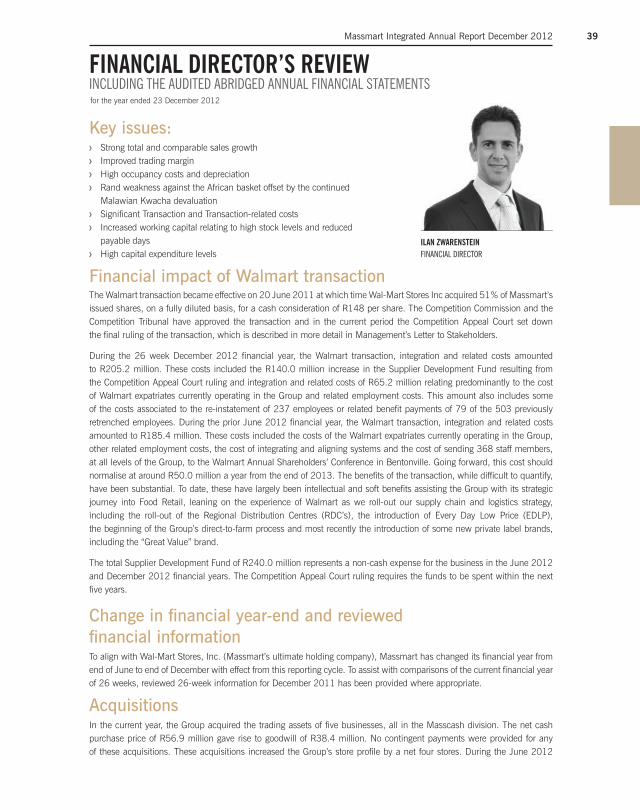
FINANCIAL DIRECTOR’S REVIEW INCLUDING THE AUDITED ABRIDGED ANNUAL FINANCIAL STATEMENTSfor the year ended 23 December 2012
Key issues:R Strong total and comparable sales growthR Improved trading marginR High occupancy costs and depreciationR Rand weakness against the African basket offset by the continued
Malawian Kwacha devaluationR Signifi cant Transaction and Transaction-related costsR Increased working capital relating to high stock levels and reduced
payable daysR High capital expenditure levels
Financial impact of Walmart transactionThe Walmart transaction became effective on 20 June 2011 at which time Wal-Mart Stores Inc acquired 51% of Massmart’s issued shares, on a fully diluted basis, for a cash consideration of R148 per share. The Competition Commission and the Competition Tribunal have approved the transaction and in the current period the Competition Appeal Court set down the fi nal ruling of the transaction, which is described in more detail in Management’s Letter to Stakeholders.
During the 26 week December 2012 fi nancial year, the Walmart transaction, integration and related costs amounted to R205.2 million. These costs included the R140.0 million increase in the Supplier Development Fund resulting from the Competition Appeal Court ruling and integration and related costs of R65.2 million relating predominantly to the cost of Walmart expatriates currently operating in the Group and related employment costs. This amount also includes some of the costs associated to the re-instatement of 237 employees or related benefi t payments of 79 of the 503 previously retrenched employees. During the prior June 2012 fi nancial year, the Walmart transaction, integration and related costs amounted to R185.4 million. These costs included the costs of the Walmart expatriates currently operating in the Group, other related employment costs, the cost of integrating and aligning systems and the cost of sending 368 staff members, at all levels of the Group, to the Walmart Annual Shareholders’ Conference in Bentonville. Going forward, this cost should normalise at around R50.0 million a year from the end of 2013. The benefi ts of the transaction, while diffi cult to quantify, have been substantial. To date, these have largely been intellectual and soft benefi ts assisting the Group with its strategic journey into Food Retail, leaning on the experience of Walmart as we roll-out our supply chain and logistics strategy, including the roll-out of the Regional Distribution Centres (RDC’s), the introduction of Every Day Low Price (EDLP), the beginning of the Group’s direct-to-farm process and most recently the introduction of some new private label brands, including the “Great Value” brand.
The total Supplier Development Fund of R240.0 million represents a non-cash expense for the business in the June 2012 and December 2012 fi nancial years. The Competition Appeal Court ruling requires the funds to be spent within the next fi ve years.
Change in fi nancial year-end and reviewed fi nancial information To align with Wal-Mart Stores, Inc. (Massmart’s ultimate holding company), Massmart has changed its fi nancial year from end of June to end of December with effect from this reporting cycle. To assist with comparisons of the current fi nancial year of 26 weeks, reviewed 26-week information for December 2011 has been provided where appropriate.
AcquisitionsIn the current year, the Group acquired the trading assets of fi ve businesses, all in the Masscash division. The net cash purchase price of R56.9 million gave rise to goodwill of R38.4 million. No contingent payments were provided for any of these acquisitions. These acquisitions increased the Group’s store profi le by a net four stores. During the June 2012
ILAN ZWARENSTEINFINANCIAL DIRECTOR
39Massmart Integrated Annual Report December 2012

year, the Group acquired two businesses, being Fruitspot and the Rhino Cash and Carry Group. Both of these acquisitions are aligned to the Group’s strategy of rolling out Food Retail. Makro acquired Fruitspot with effect from 2 January 2012 and Cambridge acquired the Rhino Cash and Carry Group with effect from 1 March 2012. Together these acquisitions amounted to a net cash purchase price of R326.7 million and gave rise to goodwill of R485.2 million. Liabilities raised on the business acquisitions of R182.3 million were dependent on these businesses achieving certain profi t hurdles in the two years following the deal. Both businesses are on track to meet these profi t hurdles and the business acquisition liabilities are included in the Group’s statement of fi nancial position.
With effect from 25 January 2013, Massmart acquired seven Makro stores that had previously been lease-held. The cash consideration paid for control amounted to R575 million and has been funded by debt. We expect that the income statement effect of this transaction will be neutral in the 2013 fi nancial year but then positive thereafter with signifi cant annual cash fl ow benefi ts. Acquisitions are described in more detail in note 3. http://www.massmart.co.za/invest_profi le/fi nancial_results/2013/massmart_ar2013/fi nancials/group/approval_afs.asp
DisposalsDuring the fi nancial year, the Group disposed of a small Mozambican Masscash cash and carry business which was in the process of being sold at the previous fi nancial year-end and classifi ed as held for sale in the statement of fi nancial position. The loss on disposal amounted to R4.4 million and R3.8 million after tax. During the prior year, the Group disposed of the Score stores acquired in 2009. The loss on disposal amounted to R12.1 million and R9.9 million after tax. In the current year, another small Masscash business in South Africa is in the process of being sold. The assets and liabilities have been re-valued to the lower of carrying value and fair value less costs to sell and disclosed separately as non-current assets or liabilities classifi ed as held for sale in the statement of fi nancial position. Disposals are described in more detail in note 20. http://www.massmart.co.za/invest_profi le/fi nancial_results/2013/massmart_ar2013/fi nancials/group/approval_afs.asp
Accounting policiesThere were no signifi cant changes in accounting policies during the year. The accounting policies are detailed in note 1. http://www.massmart.co.za/invest_profi le/fi nancial_results/2013/massmart_ar2013/fi nancials/group/approval_afs.asp
Financial targetsThe Group has medium-term fi nancial targets or measures that we believe represent optimal performance levels within the income statement, statement of fi nancial position, or the combination of both. Certain of these targets are ‘stretch targets’ that will only be achieved in the medium term. In addition, these targets are also ‘through-the-cycle’ targets, meaning that during a strongly negative or positive economic environment, we may under- or over-perform against those targets.
These target ratios are shown below:
Medium-term target ratios Defi nition
ROS – 5.0% Return on sales (ROS) is the ratio of profi t before tax, excluding Walmart costs and foreign exchange amounts, to sales
ROE > 35% Return on equity (ROE) is the ratio of headline earnings excluding Walmart costs and foreign exchange amounts, to average ordinary shareholders’ equity
Gearing ≈ 35% Gearing is the ratio of average long-term interest-bearing debt to average ordinary shareholders’ equity
Dividend cover of x 1.55 Dividend cover represents the ratio of headline earnings to dividends paid to ordinary shareholders
FINANCIAL DIRECTOR’S REVIEW CONTINUEDINCLUDING THE AUDITED ABRIDGED ANNUAL FINANCIAL STATEMENTSfor the year ended 23 December 2012
40 Reports to Stakeholders

Return on salesThis ratio combines all the key income statement elements, being sales, gross margin, supplier income, expenses (including depreciation and amortisation), and net interest, but excludes Walmart costs and foreign exchange translation gains or losses. Every key fi nancial aspect of the retail or wholesale business model is therefore captured in this ratio. In addition, the largest asset investment in the Divisions is net working capital (being inventory and trade receivables), less the associated funding liability (in trade payables). The relative success of management’s impact on net working capital will therefore be refl ected in changed net fi nance charges or receipts from one year to the next. The reason foreign exchange translation gains or losses are excluded is because they are largely well beyond management’s control, are volatile, and do not refl ect the sustainable profi tability of the Division or Group.
Returns for the 26 weeks ended 23 December 2012 and 25 December 2011 were negatively impacted by the increased depreciation and occupancy costs. These costs comprised approximately 6.4% and 22.8% of total costs and increased by 24.3% and 23.9%, respectively. The increased depreciation and occupancy cost is a consequence of the Group’s signifi cant increase in RDC’s, the roll-out of new stores including two new Makros during the December year and three in the June 2012 year and the introduction and continued roll-out of Food Retail in three Divisions during the periods under review.
Massmart's current ROS is 3.7% (Dec 2011: 4.1%) for the 26-week period.
Return on equityMassmart is committed to delivering superior returns to shareholders over the longer term. The Group’s medium-term targets are to exceed a 35% return on average ordinary shareholders’ equity (ROE).
RETURN ON SALES BEFORE WALMART COSTS AND FOREIGN EXCHANGE (%)
4.5 4 3.74.5 3.73.44.14.6
52 WEEKS 26 WEEKS
Dec 2012
June 2012
Dec 2011
June 2011
Dec 2010
June 2010
Dec 2009
June 2009
52 WEEKS 26 WEEKS
RETURN ON AVERAGE SHAREHOLDERS' EQUITY BEFORE WALMART COSTS AND FOREIGN EXCHANGE (%)
Dec 2012
June 2012
Dec 2011
June 2011
Dec 2010
June 2010
Dec 2009
33.7 36.8 35.135 31.23432.2
June 2009
43.6
41Massmart Integrated Annual Report December 2012
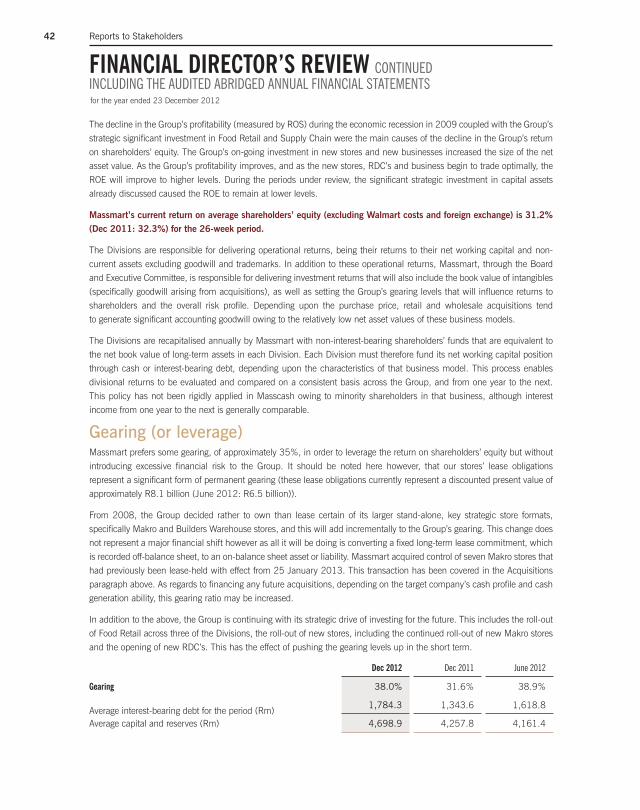
FINANCIAL DIRECTOR’S REVIEW CONTINUEDINCLUDING THE AUDITED ABRIDGED ANNUAL FINANCIAL STATEMENTSfor the year ended 23 December 2012
The decline in the Group’s profi tability (measured by ROS) during the economic recession in 2009 coupled with the Group’s strategic signifi cant investment in Food Retail and Supply Chain were the main causes of the decline in the Group’s return on shareholders’ equity. The Group’s on-going investment in new stores and new businesses increased the size of the net asset value. As the Group’s profi tability improves, and as the new stores, RDC’s and business begin to trade optimally, the ROE will improve to higher levels. During the periods under review, the signifi cant strategic investment in capital assets already discussed caused the ROE to remain at lower levels.
Massmart’s current return on average shareholders’ equity (excluding Walmart costs and foreign exchange) is 31.2%
(Dec 2011: 32.3%) for the 26-week period.
The Divisions are responsible for delivering operational returns, being their returns to their net working capital and non-current assets excluding goodwill and trademarks. In addition to these operational returns, Massmart, through the Board and Executive Committee, is responsible for delivering investment returns that will also include the book value of intangibles (specifi cally goodwill arising from acquisitions), as well as setting the Group’s gearing levels that will infl uence returns to shareholders and the overall risk profi le. Depending upon the purchase price, retail and wholesale acquisitions tend to generate signifi cant accounting goodwill owing to the relatively low net asset values of these business models.
The Divisions are recapitalised annually by Massmart with non-interest-bearing shareholders’ funds that are equivalent to the net book value of long-term assets in each Division. Each Division must therefore fund its net working capital position through cash or interest-bearing debt, depending upon the characteristics of that business model. This process enables divisional returns to be evaluated and compared on a consistent basis across the Group, and from one year to the next. This policy has not been rigidly applied in Masscash owing to minority shareholders in that business, although interest income from one year to the next is generally comparable.
Gearing (or leverage)Massmart prefers some gearing, of approximately 35%, in order to leverage the return on shareholders’ equity but without introducing excessive fi nancial risk to the Group. It should be noted here however, that our stores’ lease obligations represent a signifi cant form of permanent gearing (these lease obligations currently represent a discounted present value of approximately R8.1 billion (June 2012: R6.5 billion)).
From 2008, the Group decided rather to own than lease certain of its larger stand-alone, key strategic store formats, specifi cally Makro and Builders Warehouse stores, and this will add incrementally to the Group’s gearing. This change does not represent a major fi nancial shift however as all it will be doing is converting a fi xed long-term lease commitment, which is recorded off-balance sheet, to an on-balance sheet asset or liability. Massmart acquired control of seven Makro stores that had previously been lease-held with effect from 25 January 2013. This transaction has been covered in the Acquisitions paragraph above. As regards to fi nancing any future acquisitions, depending on the target company’s cash profi le and cash generation ability, this gearing ratio may be increased.
In addition to the above, the Group is continuing with its strategic drive of investing for the future. This includes the roll-out of Food Retail across three of the Divisions, the roll-out of new stores, including the continued roll-out of new Makro stores and the opening of new RDC’s. This has the effect of pushing the gearing levels up in the short term.
Dec 2012 Dec 2011 June 2012
Gearing 38.0% 31.6% 38.9%
Average interest-bearing debt for the period (Rm) 1,784.3 1,343.6 1,618.8
Average capital and reserves (Rm) 4,698.9 4,257.8 4,161.4
42 Reports to Stakeholders

Average interest-bearing debt is calculated by grossing up the net interest paid of R60.4 million (Dec 2011: R48.1 million/ June 2012: R115.1 million) by the average interest rate of 6.77% (Dec 2011: 7.16%/June 2012: 7.11%)
As the period-end statement of fi nancial position tends to be unrepresentative of the Group’s average net cash or debt position during the year (including higher cash balances that are paid to creditors after month-end), the Group’s gearing levels are best calculated using the net interest paid (or received) for the fi nancial period.
The Group’s average gearing was 38.0% (Dec 2011: 31.6%) for the 26-week period.
Dividend coverMassmart’s previous dividend policy was to declare and pay a total annual cash dividend representing a 1.70 times dividend cover ratio. The reference point for the calculation is headline earnings. No adjustment is made to the dividend calculation for the unrealised or non-cash portion of any foreign exchange translation gain or loss, unless these fi gures become material.
In light of the South African Dividend Tax introduced with effect from 1 April 2012 (Dividend Tax), the Group’s dividend cover has been adjusted to refl ect the benefi t to the Company of no longer paying the Secondary Tax on Companies (STC) on the net dividend. Consequently Massmart’s new dividend policy is to declare and pay a total annual cash dividend representing a 1.55 times dividend cover unless circumstances dictate otherwise. There were no STC credits available for use as part of this declaration. The number of shares in issue at the date of declaration was 216,910,195.
Despite the lower headline earnings per share, the Group maintained the absolute value of the fi nal cash dividend in the prior year, adjusted for the change in the Dividend Tax legislation. Notice was given that a gross fi nal cash dividend of 275.00 cents per share in respect of the period ended 23 December 2012 was declared. The dividend was declared out of income reserves and will be subject to the Dividend Tax rate of 15% which will result in a net dividend of 233.75 cents per share to those shareholders who are not exempt from paying Dividend Tax. Massmart’s tax reference number is 9900/196/71/9.
The salient dates relating to the payment of the dividend were as follows: Last day to trade cum dividend on the JSE: Thursday, 14 March 2013 First trading day ex dividend on the JSE: Friday, 15 March 2013 Record date: Friday, 22 March 2013 Payment date: Monday, 25 March 2013
Share certifi cates may not be dematerialised or rematerialised between Friday, 15 March 2013 and Friday, 22 March 2013, both days inclusive.
Massmart shareholders who hold Massmart ordinary shares in certifi cated form (certifi cated shareholders) should note that dividends will be paid by cheque and by means of an electronic funds transfer (EFT) method. Where the dividend payable to a particular certifi cated shareholder is less than R100, the dividend will be paid by EFT only to such certifi cated shareholder. Certifi cated shareholders who do not have access to any EFT facilities are advised to contact the Company’s transfer secretaries, Computershare Investor Services at Ground Floor, 70 Marshall Street, Johannesburg 2001, PO Box 61051 Marshalltown 2107 (011) 370 5000, 086 110 09818, in order to make the necessary arrangements to take delivery of the proceeds of their dividend.
Massmart shareholders who hold Massmart ordinary shares in dematerialised form will have their accounts held at their CSDP or broker credited electronically with the proceeds of their dividend.
The dividend cover ratio is not a target – because it is already being achieved – but is disclosed to give shareholders clarity on future dividend levels. The Board believes that this dividend cover ratio is appropriate, given the Group’s current and forecast cash generation, planned capital expenditure and gearing levels.
43Massmart Integrated Annual Report December 2012

FINANCIAL DIRECTOR’S REVIEW CONTINUEDINCLUDING THE AUDITED ABRIDGED ANNUAL FINANCIAL STATEMENTSfor the year ended 23 December 2012
Historical actual dividend cover ratios:
Dec 2012
June 2012
Dec 2011
June 2011
June 2010
June 2009
June 2008
June 2007
June 2006
June 2005
June 2004
Actual dividend cover x1.18 x1.41 x1.65 x1.07 x1.50 x1.56 x1.70 x1.70 x2.00 x2.00 x2.00Dividend cover before Walmart costs (taxed) x1.44 x1.59 x1.48 x1.59
More detail on the Group dividend is provided in note 10. http://www.massmart.co.za/invest_profi le/fi nancial_results/2013/massmart_ar2013/fi nancials/group/approval_afs.asp
Income statement for the year ended 23 December 2012
December 2012 December 2011 June 201226 weeks 26 weeks 52 weeks
Rm Rm Rm(Audited) (Reviewed) (Audited)
Revenue 36,234.5 31,547.1 61,362.9
Sales 36,122.6 31,492.2 61,209.1 Cost of sales (29,523.2) (25,917.3) (49,957.1)
Gross profi t 6,599.4 5,574.9 11,252.0 Other income 111.9 54.9 153.8 Depreciation and amortisation (342.6) (275.6) (594.2)Impairment of assets (5.4) (0.3) (16.5)Employment costs (2,487.5) (2,137.1) (4,336.1)Occupancy costs (1,225.6) (989.0) (2,059.9)Foreign exchange loss (76.7) 82.4 (72.5)Other operating costs (1,243.2) (902.2) (2,192.0)
Operating profi t before Walmart costs 1,330.3 1,408.0 2,134.6 Walmart transaction, integration and related costs (205.2) (41.7) (185.4)
Operating profi t 1,125.1 1,366.3 1,949.2
Finance costs (106.0) (72.5) (183.9)Finance income 45.6 24.4 68.8
Net fi nance costs (60.4) (48.1) (115.1)
Profi t before taxation 1,064.7 1,318.2 1,834.1 Taxation (342.3) (410.9) (618.2)
Profi t for the period 722.4 907.3 1,215.9
Profi t attributable to:
Owners of the parent 691.8 893.0 1,173.5 Preference shareholders 1.4 2.5 6.1 Non-controlling interests 29.2 11.8 36.3
Profi t for the period 722.4 907.3 1,215.9
Earnings per share (cents)
Basic EPS 319.7 414.9 544.4 Diluted basic EPS 315.4 406.3 532.7
44 Reports to Stakeholders

Sales
Total Group sales for the December 2012 fi nancial year amounted to R36.2 billion. Total and comparable store sales for the year increased by 14.7% and 7.3%, respectively, over the comparative period. Comparable sales are sales fi gures quoted for stores that have traded in excess of 12 months. The Group’s average product selling price infl ation rate for the year was 3.7% (Dec 2011: 1.1%), equating to a real comparable sales growth of 3.6%. Infl ation/defl ation for each of the Group’s major product categories is shown in the table below:
General Merchandise infl ation measured 0.8%, positive for the fi rst time in almost fi ve years. Some infl ation in this category will be positive for the business as the Group will need to move less boxes in order to achieve the same level of sales, thereby incurring lower costs.
Looking ahead to December 2013, infl ation is expected to increase in General Merchandise due to a combination of the weaker Rand and product infl ation out of the East. Food infl ation is likely to continue although there are some signs that it may have peaked. Some commodities, such as rice, are actually in defl ation. If the Rand remains stable, product infl ation should be between 4% and 6%.
During the December 2012 fi nancial year, the Group opened 13 stores, closed six stores, and acquired four stores, resulting in a total of 359 stores. Net trading space increased by 4.7% to a total of 1,413,573m2. New space has not been proportionately adjusted if the store was not open for part of the fi nancial year. The detailed store movement is explained in the table alongside.
Gross profit
The Group’s gross margin of 18.27% is above the comparative period’s 17.70%. The increase is a result of improved trading in Massbuild and Makro and a higher contribution from Game Africa. These increases were partially offset by a greater Food contribution across the Group.
The Group’s gross margin is dependent upon the sales mix across the Divisions and the required trading aggression occasioned by competitor activity. In a positive economic cycle, it should increase marginally owing to the increased contribution from the higher-margin Massbuild Division, as well as a higher proportion of General Merchandise sales. Gross profi t includes rebates and other forms of income earned from suppliers as well as on-going revenue from sales of cellular products and airtime.
STORE PROGRESS
OPENING BALANCE JULY 2012
GAME STORES OPENEDGROBLERSDAL (MPUMALANGA) KING WILLIAM’S TOWN (EASTERN CAPE) LEPHELALE (LIMPOPO) LICHTENBURG (NORTH WEST) MASERU (LESOTHO) QUEENSTOWN (EASTERN CAPE) STELLENBOSCH (WESTERN CAPE)
DIONWIRED STORE OPENED RUSTENBURG (NORTH WEST)
MAKRO STORES OPENED BLOEMFONTEIN (FREE STATE) CAPE TOWN (WESTERN CAPE)
BUILDERS EXPRESS STORE OPENED MIDDELBURG (MPUMALANGA)
MASSCASH WHOLESALE STORES ACQUIRED KIMBERLEY (NORTHERN CAPE) SUPERBLOEM (FREE STATE) UPINGTON (NORTHERN CAPE) MASSCASH WHOLESALE STORE CONVERTED RAHME GUYS (GAUTENG) MASSCASH WHOLESALE STORES CLOSED BARA RANK, DIEPKLOOF (GAUTENG) BLOEMFONTEIN CASH AND CARRY (FREE STATE) KIMBERLEY CASH AND CARRY (NORTHERN CAPE) LIQUORLAND EXPRESS, DIEPKLOOF (GAUTENG) JUMBO STORE CLOSED JUMBO BLOEMFONTEIN (FREE STATE)
CAMBRIDGE FOOD STORES OPENED EAST LONDON (EASTERN CAPE) MDANTSAME (EASTERN CAPE) CAMBRIDGE FOOD STORE ACQUIRED TEMBA (GAUTENG) CAMBRIDGE FOOD STORE CLOSED NEWTOWN (GAUTENG) CAMBRIDGE FOOD STORE CONVERTED RAHME GUYS (GAUTENG)
TOTAL STORES DECEMBER 2012
7
348
1
2
1
1
3
2
1
-4
-1
-1
-1
359
+
+
6.8% FOOD AND LIQUOR INFLATION
3.7% GROUP PRODUCT INFLATION
+
+Dec 2011: + 1.1%
Dec 2011: + 2.3%
0.8% GENERAL MERCHANDISE INFLATION
2.7% HOME IMPROVEMENT INFLATION
Dec 2011: + 0.6%
Dec 2011: - 6.1%
45Massmart Integrated Annual Report December 2012

FINANCIAL DIRECTOR’S REVIEW CONTINUEDINCLUDING THE AUDITED ABRIDGED ANNUAL FINANCIAL STATEMENTSfor the year ended 23 December 2012
Other income
Other income of R111.9 million (Dec 2011: R54.9 million) comprises royalties and franchise fees from in-store third parties, property rentals, investment income excluding interest, sundry third party management and administration fees, distribution income, income from insurance premium contributions and income from extended warranty insurance. Other income is described in more detail in note 4. http://www.massmart.co.za/invest_profi le/fi nancial_results/2013/massmart_ar2013/fi nancials/group/approval_afs.asp
Expenses
December 2012 December 2011 June 201226 weeks 26 weeks 52 weeks
Rm Rm Rm(Audited) (Reviewed) % change (Audited)
Depreciation and amortisation (342.6) (275.6) 24.3 (594.2)Impairment of assets (5.4) (0.3) (16.5)Employment costs (2,487.5) (2,137.1) 16.4 (4,336.1)Occupancy costs (1,225.6) (989.0) 23.9 (2,059.9)Other operating costs (1,243.2) (902.2) 37.8 (2,192.0)
Total expenses (5,304.3) (4,304.2) 23.2 (9,198.7)
Operating expenses as % of sales (14.7) (13.7) (15.0)
Due to the new stores, specifi cally the Makro stores, the investment in the Retail Food supply chain and infrastructure, and IT upgrades across most Divisions, total expenses (excluding foreign exchange movements and Walmart costs) increased by 23.2%. The impact of the Group’s continued investment in capacity and growth can be seen in the 24.3% higher depreciation and amortisation charge and the 23.9% increase in occupancy costs. Comparable expenses increased by 11.0%.
Total expenses (excluding foreign exchange movements and Walmart costs) represent 14.7% of sales, an increase compared to the comparative period’s 13.7%. The major expense categories and signifi cant expenses included in total expenses are discussed in more detail below.
Employment costs, the Group’s single largest cost category at 46.9% of total expenses, are 16.4% higher than the comparative period. As a percentage of sales, employment costs increased marginally to 6.89% (Dec 2011: 6.79%). On a comparable basis, these costs increased by only 8.1%. Included in employment costs are IFRS 2 Share-based Payments charges of R68.5 million (Dec 2011: R41.3 million) which arise from shares and options issued to benefi ciaries of the Massmart Employee Share Trust, the Thuthukani BEE Staff Scheme and Black Scarce Skills Trust. On 1 October 2012, the fi nal conversion of ‘A’ preference shares to ordinary shares through the Thuthukani Trust occurred. The employees had the option of converting their remaining share allocation into Massmart ordinary shares and continue to receive 100% of the dividend on their ordinary shares or they could sell their remaining share allocation and receive net proceeds after tax and selling expenses. The related share-based payment reserve was released to retained income and this entry had no impact on the income statement. Going forwards, the Group will not account for any share-based payment expenses relating to the Thuthukani BEE Staff Scheme. The Group employed 7.2% more employees (on a full-time equivalent basis or FTE and excluding acquisition FTE’s) compared to December 2011 and 11.1% more employees compared to June 2012, increasing as we opened new stores and from acquisitions. FTE’s in December periods will be considerably higher than June due to the impact of the festive season.
For the forthcoming year, the Group’s salary increases are expected to be 5.0% and 7.0% and wage increases, most of which have already been agreed, are in a range of 7.0% and 8.2%.
46 Reports to Stakeholders

Occupancy costs, the Group’s second biggest operating cost at 23.1% of total expenses, increased by 23.9%. On a comparable basis, these costs increased by 16.7%.
Property lease costs comprise 60.1% of total occupancy costs, the balance comprises ancillary property costs including municipal rates and services which continue to increase in excess of national South African infl ation levels. Expressed as a percentage of sales, occupancy costs, at 3.4%, are higher than the comparative period of 3.1%. The Massdiscounters RDC’s, the opening of new stores, including two new Makro stores, and the continued roll-out of Food Retail across the Group resulted in the high increase in occupancy costs. As Makro continues on its aggressive new store roll-out coupled with the continued Group roll-out of RDC’s, this trend is likely to continue over the next 12 months.
The lease-smoothing accounting policy applicable to operating leases (thereby affecting all store leases) has the effect of keeping comparable-store lease charges broadly equal from one year to the next, and so any increase in property lease costs between the years would be from new stores. Another effect of this accounting policy is that annual fi xed lease escalations no longer increase the Group’s lease charge. Adjusting for the non-cash lease-smoothing adjustment in both December periods shows that annual cash occupancy costs increased by 24.8% while total trading space increased by 7.0% and DC space increased by 18.1% for this same period.
Depreciation and amortisation is the Group’s third largest cost category and represents 6.5% of total expenses. Owing to the accelerated capital investment in new stores and RDC’s, the depreciation and amortisation charge increased by 24.3% which is well ahead of sales growth, and will continue to increase ahead of sales growth, for the next 12 months due to the Group’s capital expansion programme. Most Divisions refurbish their stores on a regular basis, resulting in steadily higher depreciation charges.
The three major cost categories described above together represent 76.5% of the Group’s total expenses. Other operating costs represent every other item of expense in the Group, including insurance, bad debts, travel, professional fees, advertising and marketing, stationery and consumables. Combined, this category represents the most manageable or variable costs and so while total costs in this category increased by 37.8%, comparable costs increased by 11.9% and continue to receive intense management focus.
The impairment of assets in the December 2012 year relates to the impairment of leasehold improvements in Masscash of R5.4 million. The impairment of assets in the December 2011 comparative six-month period relates to the closure of the Game Mauritius store of R0.3 million. The impairment of assets in the June 2012 year relates to the impairment of certain acquired goodwill in Masscash of R16.5 million. More information relating to impairment of assets can be found in note 5.
http://www.massmart.co.za/invest_profi le/fi nancial_results/2013/massmart_ar2013/fi nancials/group/approval_afs.asp
Other significant items
As noted in the summarised income statement above, included in operating profi t are net unrealised and realised losses on foreign currency transactions and translations of R76.7 million (Dec 2011: net gain of R82.4 million).
December 2012 December 2011 June 201226 weeks 26 weeks 52 weeks
Foreign exchange movement relating to:Rm
(Audited)Rm
(Reviewed)Rm
(Audited)
Arising from loans to African operations (82.8) 19.3 (124.7)Arising from hedges (0.7) 19.3 5.9 Arising from an investment in a trading and logistics structure 1.0 44.4 48.2 Arising from the translation of foreign creditors 5.8 (0.5) (1.9)
(76.7) 82.5 (72.5)
47Massmart Integrated Annual Report December 2012

FINANCIAL DIRECTOR’S REVIEW CONTINUEDINCLUDING THE AUDITED ABRIDGED ANNUAL FINANCIAL STATEMENTSfor the year ended 23 December 2012
During the December 2012 fi nancial year, the translation of the Group loans in the African balance sheets amounted to an R82.8 million foreign exchange loss in the income statement (Dec 2011: R19.3 million gain/June 2012: R124.7 million loss). There was a net translation gain from other foreign monetary balances of R6.1 million (Dec 2011: R63.2 million loss/June 2012: R52.2 million gain). During May 2012, the Government of Malawi devalued the country’s currency by 50%. The effect of this (included above) was a loss on translation of the loans in Malawi which amounted to R145.6 million. The Malawian Kwacha has continued to devalue, and at December 2012, the currency had lost a further 20.3% against the Rand in the current period. During January and February 2013, the Group successfully managed to repatriate almost all of its foreign currency cash from Malawi. At the time of writing, the Group’s in-country foreign cash equivalents amounted to R16.0 million. This loss in both June 2012 and December 2012 was offset by the Rand weakness compared to the Group’s African currencies basket. Should the Rand continue to weaken against these currencies, it is likely that the Group will report foreign exchange gains. The foreign exchange loss is described in more detail in note 7. http://www.massmart.co.za/invest_profi le/fi nancial_results/2013/massmart_ar2013/fi nancials/group/approval_afs.asp
When a new store is opened, large once-off or exceptional operating costs can be incurred in preparing the store (including temporary staff, marketing initiatives, special promotions, signage, amongst others). These costs are referred to as store pre-opening costs and in December 2012 amounted to R49.6 million (Dec 2011: R61.2 million) which included the new Makro stores.
Trading and operating profit
December 2012 December 2011 June 2012
Reconciliation between Trading and Operating profi t before tax
26 weeks Rm
(Audited)
26 weeks Rm
(Reviewed) % change
52 weeks Rm
(Audited)
Trading profi t before taxation 1,498.5 1,424.7 5.2 2,456.8 Corporate net interest (131.8) (137.1) (306.6)Asset impairments (5.4) (0.3) (16.5)Walmart transaction, integration and related costs (205.2) (41.7) (185.4)Loss on disposal of business (4.4) – (12.1)Fair value adjustment on assets classifi ed as held for sale (0.4) – (7.9)BEE transaction IFRS 2 charge (9.9) (9.8) (21.7)Foreign exchange loss (76.7) 82.4 (72.5)
Operating profi t before taxation 1,064.7 1,318.2 (19.2) 1,834.1
Trading profi t as % of sales 4.1% 4.5% 4.0%
Operating profi t as % of sales 2.9% 4.2% 3.0%
Group trading profi t, which is shown before accounting for the Walmart costs and foreign exchange, grew by 5.2% on the comparative period which is signifi cantly below sales growth of 14.7%. The Group’s lower net margin growth is a result of expense pressure due to investing in new stores and RDC’s, the roll-out of Food Retail throughout the Group and the additional costs resulting from the need to move additional volumes due to the low infl ation in General Merchandise. Expressed as a percentage of sales, Group trading profi t deteriorated from 4.5% to 4.1%.
Group operating profi t before Walmart costs, which includes the foreign currency translation movements, was 5.5% down on the comparative December 2011 period. After excluding foreign exchange, operating profi t of R1,407.0 million was up 6.1% on the comparative period. Considering the Group’s strategic investment in the future, EBITDA and EBITDAR for December 2012 are up 9.6% and 15.1% respectively, on the December 2011 comparative period.
48 Reports to Stakeholders

December 2012 December 2011 June 201226 weeks 26 weeks 52 weeks
Rm Rm RmEBITDA and EBITDAR (Audited) (Reviewed) % change (Audited)
Operating profi t before Walmart costs and foreign exchange 1,407.0 1,325.6 6.1 2,207.1 Depreciation and amortisation 342.6 275.6 24.3 594.2Impairment of assets 5.4 0.3 16.5
EBITDA 1,755.0 1,601.5 9.6 2,817.8 Occupancy costs 1,225.6 989.0 23.9 2,059.9
EBITDAR 2,980.6 2,590.5 15.1 4,877.7
The Group’s December 2012 fi nancial performance has been covered in detail above, but can broadly be summarised as:
R Total sales growth boosted by new stores and acquisitions during the December 2011 year or June 2012 fi nancial year
annualising;
R Good comparable sales growth achieved despite low product infl ation;
R Higher Group gross margins from improved gross margins in Massbuild and Makro and a higher contribution from
Game Africa;
R High occupancy and depreciation costs in line with the Group’s strategic investment in the future; and
R Increased non-cash contribution to the Supplier Development Fund.
Net finance costs
Using net interest paid as a proxy, the Group’s average net gearing (or fi nancial leverage) for the December 2012 fi nancial
year was 38.0% (Dec 2011: 31.6%/June 2012: 38.9%). Taking into account anticipated capital expenditure and
excluding any unforeseen developments or new initiatives, the Group will remain net geared for the foreseeable future.
Taxation
Tax rate reconciliation
December 201226 weeks(Audited)
December 201126 weeks
(Reviewed)
June 201252 weeks(Audited)
South African corporate taxation 28.0% 28.0% 28.0%Secondary Tax on Companies 0.1% 1.9% 4.3%IFRS 2 1.0% 0.9% 1.0%Other 3.0% 0.4% 0.4%
Overall tax rate 32.1% 31.2% 33.7%
TOTAL TAX CHARGE (Rm) 342.3 410.9 618.2
The total tax charge represents an overall tax rate of 32.1% (Dec 2011: 31.2%/June 2012: 33.7%). For several years
the Group’s tax rate has been higher than the standard South African corporate rate due to the charge from the Secondary
Tax on Companies (STC) payable on net dividends. Due to the abolishment of STC in the current year, there is a very small
STC impact in December 2012. STC added 1.9% to the December 2011 tax rate and 4.3% to the June 2012 tax rate.
Due to the reduced effect of non-deductible expenditure, we expect Massmart’s future effective tax rate to be approximately
30%, although higher tax rates in certain foreign jurisdictions may marginally increase this.
49Massmart Integrated Annual Report December 2012

FINANCIAL DIRECTOR’S REVIEW CONTINUEDINCLUDING THE AUDITED ABRIDGED ANNUAL FINANCIAL STATEMENTSfor the year ended 23 December 2012
Massmart is unconcerned at any specifi c element of historical tax risk in the Group, but there remains the uncertainty that material adjustments arising from potentially unfavourable tax assessments of previous tax returns, some of which have not yet been assessed by SARS, could impact future tax charges. Extending this uncertainty is that SARS can reopen any tax assessment within three years of issuing such assessment. More information relating to taxation can be found in note 9.
http://www.massmart.co.za/invest_profi le/fi nancial_results/2013/massmart_ar2013/fi nancials/group/approval_afs.asp
Statement of comprehensive incomefor the year ended 23 December 2012
December 2012 June 201226 weeks 52 weeks
Rm(Audited)
Rm(Audited)
Profi t for the period 722.4 1,215.9
Items that will not be re-classifi ed subsequently to the income statement – –
Items that will be re-classifi ed subsequently to the income statement
Foreign currency translation reserve 25.1 67.6 Revaluation of listed shares 1.6 0.2 Cash fl ow hedges (5.8) 11.3 Less income tax relating to the cash fl ow hedges 1.6 (3.2)
Other comprehensive income for the period, net of tax 22.5 75.9
Total comprehensive income for the period 744.9 1,291.8
Total comprehensive income attributable to:
Owners of the parent 714.3 1,249.4 Preference shareholders 1.4 6.1 Non-controlling interests 29.2 36.3
Total comprehensive income for the period 744.9 1,291.8
The Group accounts for three movements in other comprehensive income; the movement of the foreign currency translation reserve, the revaluation of listed shares and the net movement of cash fl ow hedges. All of these may be re-classifi ed subsequently to the income statement.
50 Reports to Stakeholders

Headline earningsHeadline earnings, before Walmart costs and foreign exchange, of R916.5 million (Dec 2011: R865.9 million/June 2012: R1,415.8 million) are 5.8% above the December 2011 comparative period. Including Walmart costs and foreign exchange however, reduces headline earnings to R705.5 million which is 21.2% down on the December 2011 comparative period. The more representative fi gure is 5.8% which better refl ects the Group’s actual trading performance in December 2012.
December 2012 December 2011 June 201226 weeks 26 weeks 52 weeks
Headline earningsRm
(Audited)Rm
(Reviewed) % changeRm
(Audited)
Reconciliation of net profi t for the period to headline earningsNet profi t attributable to owners of the parent 691.8 893.0 (22.5) 1,173.5 Impairment of assets 5.4 0.3 16.5 Loss on disposal of fi xed assets 6.2 2.4 12.6 Loss on disposal of business 4.4 – 12.1 Fair value adjustment on assets classifi ed as held for sale 0.4 – 7.9 Total tax effects of adjustments (2.7) (0.5) (5.9)
Headline earnings 705.5 895.2 (21.2) 1,216.7
Headline earnings before Walmart costs and foreign exchange (taxed) 916.5 865.9 5.8 1,415.8
Headline EPS (cents) 326.0 416.0 (21.6) 564.5 Headline EPS before Walmart costs and foreign exchange (taxed) (cents) 423.5 402.3 5.3 656.9 Diluted headline EPS (cents) 321.7 407.3 (21.0) 552.3 Diluted headline EPS before Walmart costs and foreign exchange (taxed) (cents) 417.9 394.0 6.1 642.7
Headline earnings per share (HEPS), before Walmart costs and foreign exchange, of 423.5 cents, is 5.3% higher than the December 2011 comparative period HEPS of 402.3 cents. Including Walmart costs and foreign exchange however, reduces HEPS to 326.0 cents which is 21.6% below the December 2011 comparative period.
After adjusting for the potential future conversion of 2.9 million shares (Dec 2011: 4.6 million/June 2012: 4.7 million shares), the diluted HEPS before Walmart costs and foreign exchange is 417.9 cents (Dec 2011: 394.0 cents/June 2012: 642.7 cents). Under the calculation required by IFRS, the number of potentially dilutive shares was increased due to the signifi cantly higher weighted-average Massmart share price during this fi nancial year. Headline earnings is described in more detail in note 11. http://www.massmart.co.za/invest_profi le/fi nancial_results/2013/massmart_ar2013/fi nancials/group/approval_afs.asp
51Massmart Integrated Annual Report December 2012

FINANCIAL DIRECTOR’S REVIEW CONTINUEDINCLUDING THE AUDITED ABRIDGED ANNUAL FINANCIAL STATEMENTSfor the year ended 23 December 2012
Statement of financial positionas at 23 December 2012
December 2012 December 2011 June 2012Rm
(Audited)Rm
(Reviewed)Rm
(Audited)
Assets
Non-current assets 7,595.1 6,291.6 7,175.8
Property, plant and equipment 3,868.2 3,236.1 3,520.6 Goodwill 2,557.7 2,052.5 2,521.4 Other intangibles 387.6 296.4 347.1 Investments 258.8 329.3 321.9 Other fi nancial assets 126.5 128.8 134.6 Deferred taxation 396.3 248.5 330.2
Current assets 15,422.2 14,972.3 11,895.9
Inventories 9,691.5 8,385.2 7,615.6 Trade, other receivables and prepayments 3,681.7 3,522.5 2,953.9 Taxation 17.0 54.4 21.0 Cash and bank balances 2,032.0 3,010.2 1,305.4
Non-current assets classifi ed as held for sale 2.5 – 103.2
Total assets 23,019.8 21,263.9 19,174.9
Equity and liabilities
Equity attributable to equity holders of the parent 4,739.7 4,658.1 4,356.9
Share capital 2.2 2.2 2.2 Share premium 752.1 750.1 750.6 Other reserves 323.3 583.1 614.7 Retained profi t 3,662.1 3,322.7 2,989.4
Non-controlling interests 175.6 206.5 207.9
Total equity 4,915.3 4,864.6 4,564.8
Non-current liabilities 1,183.4 928.9 1,486.0 Non-current liabilities:
– Interest-bearing 671.8 376.8 852.7 – Interest-free 305.7 357.5 345.8 Non-current provisions and other 169.2 170.2 259.0 Deferred taxation 36.7 24.4 28.5
Current liabilities 16,921.1 15,470.4 12,982.2
Trade and other payables 15,305.5 14,541.0 11,302.0 Current provisions and other 363.8 13.7 139.7 Taxation 298.5 235.7 259.0 Other current liabilities 561.2 520.0 648.9 Bank overdrafts 392.1 160.0 632.6
Liabilities associated to assets classifi ed as held for sale – – 141.9
Total equity and liabilities 23,019.8 21,263.9 19,174.9
52 Reports to Stakeholders

This review covers the consolidated statement of fi nancial position and the related Group AFS notes.
Non-current assetsDecember 2012 December 2011 June 2012
Rm(Audited)
Rm(Reviewed)
Rm(Audited)
Non-current assets 7,595.1 6,291.6 7,175.8
Property, plant and equipment 3,868.2 3,236.1 3,520.6 Goodwill 2,557.7 2,052.5 2,521.4 Other intangibles 387.6 296.4 347.1 Investments 258.8 329.3 321.9 Other fi nancial assets 126.5 128.8 134.6 Deferred taxation 396.3 248.5 330.2
Tangible and intangible assets
Property, plant and equipment and goodwill together represent 84.6% (Dec 2011: 84.1%/June 2012: 84.2%) of the Group’s total non-current assets.
Massmart continually refurbishes older stores and is building new stores and Distribution Centres, and so during December 2012 expenditure of R666.8 million (Dec 2011: R740.6 million/June 2012: R1,236.8 million) was spent on property, plant and equipment. Of this, R279.8 million (Dec 2011: R318.8 million/June 2012: R550.1 million) was replacement capital expenditure, while the balance of R387.1 million (Dec 2011: R421.8 million/June 2012: R686.7 million) was invested in new capital assets, including new stores and the new RDC. Acquisitions added a further R7.7 million (Dec 2011: R0.0 million/June 2012: R106.9 million) to Group property, plant and equipment.
December periods are 26 weeks and June periods are 52 weeks.
In December 2012, goodwill increased by R36.3 million in most part due to the acquisition of the trading assets in fi ve entities in Masscash for R38.4 million. No impairment was required in this period. Under IFRS all goodwill must be tested annually against the value of the business units with which it is associated and, if overstated, that goodwill must be impaired. For the six months to December 2011, goodwill increased by R3.1 million. In the June fi nancial year, goodwill increased by R472.0 million, refl ecting the two principal movements of goodwill arising from the acquisition of Fruitspot and the Rhino Cash and Carry Group (R486.4 million) less an impairment of R16.5 million in Masscash.
Other intangibles primarily represent computer software that IFRS requires to be disclosed in this category. In terms of IFRS the depreciation charge arising from this asset category is classifi ed as an amortisation charge.
2.6
2.12.1
1.5
2.7
2.22.4
TANGIBLE AND INTANGIBLE ASSETS CAPITAL EXPENDITURE (RM), ACQUISITIONS (RM) AND TOTAL CASH FLOW AS A % OF SALES
268.
330
9.6
334.
642
7.9
354.
5
284
346.
1
637.
1
347.
640
2.6
710.
4
345.
484
3
340.
1
EXPANSION REPLACEMENT TOTAL CASH FLOW AS A % OF SALES
June 2008
June 2009
June 2010
June 2011
Dec 2011
June 2012
Dec 2012
53Massmart Integrated Annual Report December 2012

FINANCIAL DIRECTOR’S REVIEW CONTINUEDINCLUDING THE AUDITED ABRIDGED ANNUAL FINANCIAL STATEMENTSfor the year ended 23 December 2012
During the 2009 fi nancial year the Group began to implement its strategic plan of investing in the future. This included the opening of a number of RDC’s (space increase > 400% in three years); the roll-out of new Makro stores (opened three new stores in June 2012 and a further two new stores in December 2012); and the roll-out of Food Retail across the Group including Cambridge and Foodco. Masscash Retail now operates out of 44 stores while Foodco can be found in 27 stores (including fi ve in Africa). Capital expenditure as a percentage of sales therefore increased from 1.2% of sales in 2006 to 2.1% in December 2012.
Capital expenditure for the next 12 months is budgeted to be slightly higher due to the continued roll-out of Makro stores; the Massdiscounters’ Foodco conversions and new stores; the opening of the Massbuild RDC; and the Group’s acquisition of seven of its Makro properties. More information relating to property, plant and equipment, goodwill and intangible assets can be found in notes 12, 13 and 14 respectively. http://www.massmart.co.za/invest_profi le/fi nancial_results/2013/massmart_ar2013/fi nancials/group/approval_afs.asp
December periods are 26 weeks and June periods are 52 weeks.
Investments and other financial assets
Investments comprise a R104.0 million (Dec 2011: R207.3 million/June 2012: R177.2 million) participation in an international treasury, shipping and trading business unit, revalued to refl ect the foreign-denominated net assets within that business unit. The R110.0 million (Dec 2011: R76.1 million/June 2012: R82.0 million) shown as a bare dominium revaluation represents the Group’s proportionate share of the estimated market value of the right to acquire bare dominiums in seven Makro stores in 2022. With effect from 25 January 2013, Massmart acquired control of these Makro stores. More information relating to investments can be found in note 15. http://www.massmart.co.za/invest_profi le/fi nancial_results/2013/massmart_ar2013/fi nancials/group/approval_afs.asp
Other fi nancial assets of R126.5 million (Dec 2011: R128.8 million/June 2012: R134.6 million) include executive and employee loans of R70.6 million (Dec 2011: R86.3 million/June 2012: R82.4 million) owed by participants in the Massmart employee share purchase trust that attract zero percent interest. This loan amount reduces as employees sell their shares and repay the associated loans and increases where executives elect to own Massmart shares, funded with these loans, rather than options issued by the trust. The fi nance lease deposit of R33.0 million (Dec 2011: R41.8 million/June 2012: R37.6 million) is related to the fi nancing of the Makro Strubens Valley store originally built in 2003. More information relating to other fi nancial assets can be found in note 16. http://www.massmart.co.za/invest_profi le/fi nancial_results/2013/massmart_ar2013/fi nancials/group/approval_afs.asp
Deferred tax
The deferred tax asset arises primarily from numerous temporary differences, including tax deductions on trademarks, the operating lease liability arising from the lease-smoothing accounting policy, and unutilised assessed losses. This net asset will reduce over time as the associated tax benefi ts are utilised. More information relating to deferred tax can be found in note 17.
http://www.massmart.co.za/invest_profi le/fi nancial_results/2013/massmart_ar2013/fi nancials/group/approval_afs.asp
CAPITAL EXPENDITURE, ACQUISITIONS AND BUYBACKS (RM)
268.
3
334.
6
354.
5
SHARE BUYBACKS ACQUISITIONS TOTAL CAPEX
577.9
271.8
762.5
86.3
28469
4.619
8.512
6 137.2
630.1
369.9
1 347
.532
7.920
6.7
1 188
.417
127
3.9
347.
6 750.2
56.9
124.5
June 2008
June 2009
June 2010
June 2011
Dec 2011
June 2012
Dec 2012
54 Reports to Stakeholders

Current assetsDecember 2012 December 2011 June 2012
Rm(Audited)
Rm(Reviewed)
Rm(Audited)
Current assets 15,422.2 14,972.3 11,895.9
Inventories 9,691.5 8,385.2 7,615.6 Trade, other receivables and prepayments 3,681.7 3,522.5 2,953.9 Taxation 17.0 54.4 21.0 Cash and bank balances 2,032.0 3,010.2 1,305.4
Net inventories represent approximately 59.9 days’ sales (on historic sales basis), marginally higher than the December 2011 comparative fi gure of 59.0 days (June 2012: 55.6 days). The 15.6% increase in stock on December 2011 is largely a result of the additional stores in the Group, an increase in Food inventory as a result of anticipated price increases due to global supply shortages and the over-stocked position in Massdiscounters given the slower comparable store sales in Game SA. In the graph below, the green bars illustrate December balances which will be considerably higher than June due to the impact of the festive season:
In general, Massdiscounters, being a retail discounter with 133 stores, including several stores in Africa with longer supply-chains, has the highest inventory levels and its sales days in inventory are almost double those for Massmart’s wholesale businesses (Makro and Masscash). Builders Warehouse also has higher inventory days than the Group average, given the broader and deeper merchandise range in its stores.
Net inventory days December 2012
Group 59.9 Massdiscounters 99.7 Masswarehouse 53.6 Massbuild 73.7 Masscash 38.8
December 2012 December 2011 June 2012
Inventory by category net of provisions:
Rm(Audited)
Rm(Reviewed)
Rm(Audited)
Food 3,068.0 2,559.6 2,434.0 Liquor 762.6 564.8 519.6 General Merchandise 4,250.7 3,773.3 3,221.7 Home improvement 1,610.2 1,487.5 1,440.3
9,691.5 8,385.2 7,615.6
INVENTORY DAYS
54.7 50.5 52.352.5 59.955.659
June 2008
June 2009
June 2010
June 2011
Dec 2011
June 2012
Dec 2012
55Massmart Integrated Annual Report December 2012

FINANCIAL DIRECTOR’S REVIEW CONTINUEDINCLUDING THE AUDITED ABRIDGED ANNUAL FINANCIAL STATEMENTSfor the year ended 23 December 2012
General Merchandise net inventory of R4,250.7 million (Dec 2011: R3,773.3 million/June 2012: R3,221.7 million)
represents about 43.9% of total Group inventory, while Food net inventory at R3,068.0 million (Dec 2011:
R2,559.6 million/June 2012: R2,434.0 million) is the second largest Group inventory category but with the fastest
stock-turns. This inventory category has increased by 19.9% on December 2011 due to the continued roll-out of Food
Retail within the Group. Home Improvement net inventory levels have increased on December 2011 from the one
new store in that Division and higher sales growth. More information relating to inventories can be found in note 18.
http://www.massmart.co.za/invest_profi le/fi nancial_results/2013/massmart_ar2013/fi nancials/group/approval_afs.asp
Total trade, other receivables and prepayments, net of provisions, is 4.5% higher than December 2011 and is below sales
growth. Included here are net trade accounts receivable of R1,692.9 million (Dec 2011: R1,632.9 million/June 2012:
R1,545.2 million), which increased by 3.7%. The businesses continue to focus on keeping debtors within their terms.
Although trade credit is offered to certain customers in Makro, Massbuild and in Masscash, it is well controlled, is insured
with a credit risk insurer, and is kept within the Group’s parameters. Allowances for doubtful debts at year-end was 4.7%
of total trade receivables (Dec 2011: 4.2%/June 2012: 5.1%). Trade, other receivables and prepayments are described
in more detail in note 19. http://www.massmart.co.za/invest_profi le/fi nancial_results/2013/massmart_ar2013/fi nancials/
group/approval_afs.asp
Non-current liabilities
December 2012 December 2011 June 2012Rm
(Audited)Rm
(Reviewed)Rm
(Audited)
Non-current liabilities 1,183.4 928.9 1,486.0
Non-current liabilities:– Interest-bearing 671.8 376.8 852.7 – Interest-free 305.7 357.5 345.8 Non-current provisions and other 169.2 170.2 259.0 Deferred taxation 36.7 24.4 28.5
Major items included in the total of R1,183.4 million (Dec 2011: R928.9 million/June 2012: R1,486.0 million)
are medium-term bank loans, capitalised fi nance leases, the operating lease liability arising from the lease-smoothing
adjustment, non-current provisions and deferred tax.
The interest-bearing liabilities included in this category are medium-term bank loans. This balance increased substantially
during the June fi nancial year as a new R750.0 million fi ve-year, fi xed rate, amortising loan was raised at 7.9%.
Two three-year amortising loans of R500.0 million were each secured during 2010 and 2011, respectively. Interest is fi xed
on these loans at 9.8% and 8.1%, respectively. Capitalised fi nance lease balances are R55.2 million (2011: R62.9 million/
June 2012: R75.5 million). The largest balance in non-current non-interest-bearing liabilities is the net operating lease
liability of R302.7 million (Dec 2011: R354.5 million/June 2012: R342.8 million) arising from the lease-smoothing
accounting policy and which will be released over the remaining period of the Group’s operating leases. More information
relating to non-current liabilities can be found in note 23. http://www.massmart.co.za/invest_profi le/fi nancial_
results/2013/massmart_ar2013/fi nancials/group/approval_afs.asp
Included in non-current provisions and other is the long-term provision of R81.5 million (Dec 2011: R69.2 million/June
2012: R78.2 million) arising from the actuarial valuation of the Group’s potential liability, unfunded, arising from post-
retirement medical aid contributions owed to current and future retirees. With effect from 1999, post-retirement medical aid
benefi ts were no longer offered to new employees joining the Group. The R100.0 million Supplier Development Fund raised
56 Reports to Stakeholders

as part of the Competition Tribunal’s approval of the Walmart transaction was included here in the June fi nancial year. It was
raised in the June 2011 fi nancial year. This provision has now been recognised as a current provision and more information
has been provided in that section. Also included in non-current provisions are liabilities raised on business acquisitions related to the long-term portion of the fi nal cash settlements from the acquisitions of Fruitspot and the Rhino Cash and Carry Group in the June fi nancial year. More information relating to non-current provisions can be found in note 24.
http://www.massmart.co.za/invest_profi le/fi nancial_results/2013/massmart_ar2013/fi nancials/group/approval_afs.asp
The deferred tax liability arises primarily from prepayments and property, plant and equipment. More information relating to deferred tax can be found in note 17. http://www.massmart.co.za/invest_profi le/fi nancial_results/2013/massmart_ar2013/fi nancials/group/approval_afs.asp
Current liabilities
December 2012 December 2011 June 2012Rm
(Audited)Rm
(Reviewed)Rm
(Audited)
Current liabilities 16,921.1 15,470.4 12,982.2
Trade and other payables 15,305.5 14,541.0 11,302.0 Current provisions and other 363.8 13.7 139.7 Taxation 298.5 235.7 259.0 Other current liabilities 561.2 160.0 648.9 Bank overdrafts 392.1 520.0 632.6
Included in the total trade and other payables fi gure are trade payables of R12,601.3 million (Dec 2011: R12,281.1 million/June 2012: R8,908.8 million) representing approximately 68.3 days of cost of sales (using the historic basis), which is lower than the December 2011 comparative fi gure of 75.9 days (June 2012: 57.1 days). The fi gure is representative of the Group’s supplier terms. The decline in trade payable days is largely a result of the shift in mix from General Merchandise to Food. We continue to monitor this ratio very closely. Owing to payments to creditors being made shortly after each month-end, the Group trade payables balances at year-end are not representative of the average during the remaining fi nancial period. The amount by which year-end trade payables are overstated in comparison to the average cannot be accurately calculated but is approximately R2.3 billion. More information relating to trade and other payables can be found in note 25.
http://www.massmart.co.za/invest_profi le/fi nancial_results/2013/massmart_ar2013/fi nancials/group/approval_afs.asp
Included in current provisions and other are liabilities raised on business acquisitions related to the short-term portion of the fi nal cash settlements from the acquisitions of the Rhino Cash and Carry Group. In the current period, the Supplier Development Fund was reclassifi ed from non-current provisions to current provisions. The Fund was also increased from R100 million to R240 million resulting from the Competition Appeal Court fi nal ruling described at the start of this report. Annually, Massmart must report to the Tribunal about our expenditure and achievements under this condition. More information relating to current provisions can be found in note 26. http://www.massmart.co.za/invest_profi le/fi nancial_results/2013/massmart_ar2013/fi nancials/group/approval_afs.asp
The current taxation liability refl ects the Group’s liability for provisional corporate tax payments that are generally payable within a few days of the fi nancial year-end.
Major items in other current liabilities include R414.7 million (Dec 2011: R387.4 million/June 2012: R503.8 million) being the short-term portion of the medium-term loans noted above. More information relating to other current liabilities can be found in note 27. http://www.massmart.co.za/invest_profi le/fi nancial_results/2013/massmart_ar2013/fi nancials/group/approval_afs.asp
57Massmart Integrated Annual Report December 2012

FINANCIAL DIRECTOR’S REVIEW CONTINUEDINCLUDING THE AUDITED ABRIDGED ANNUAL FINANCIAL STATEMENTSfor the year ended 23 December 2012
Contingent liabilities
There are no current or pending legal or arbitration proceedings, of which the Group is aware, which would have a material effect on the Group's fi nancial position.
Commitments
Commitments in respect of capital expenditure approved by directors:
December 2012Rm
(Audited)
June 2012Rm
(Audited)
Contracted for 954.8 472.1 Not contracted for 715.5 598.3
1,670.3 1,070.4
More information relating to these capital expenditure commitments can be found in note 30. http://www.massmart.co.za/invest_profi le/fi nancial_results/2013/massmart_ar2013/fi nancials/group/approval_afs.asp Massmart has the right of fi rst refusal on the sale of any shares by the minority shareholders in various Masscash stores. Historically Massmart has exercised this right. The amount to be paid in future, should Massmart exercise its rights, totals R370.5 million (June 2012: R259.9 million). Capital commitments will be funded using current facilities.
The Group is exposed to the following operating lease commitments:
December 2012 June 2012Rm
(Audited)Rm
(Audited)
Land and buildings
Year 1 1,430.8 1,329.8Years 2 to 5 5,537.4 5,104.2
Subsequent to year 56,379.9 5,799.3
13,348.1 12,233.3Plant and equipment
Year 1 4.9 5.5
Years 2 to 57.9 7.4
12.8 12.9Other
Year 1 10.2 9.8Years 2 to 5 12.3 15.0
Subsequent to year 5– –
22.5 24.8
13,383.4 12,271.0
Promissory notes that represent commitments under non-cancellable operating leases of R208.9 million (June 2012: R303.9 million) entered into by Masstores (Pty) Ltd on behalf of certain Makro stores are included in operating lease commitments in land and buildings. These leases terminate in December 2020 and have a discounted present value of R193.6 million (June 2012: R262.8 million), discounted at 10.5% (June 2012: 15%). In accordance with IAS 17 Leases, the rentals paid are amortised over the entire remaining lease period on a straight-line basis.
58 Reports to Stakeholders

Statement of changes in equityfor the year ended 23 December 2012
Share capital
Share premium
Other reserves
Retained profi t
Equity attributable
to equity holders of the parent
Non-controlling
interests TotalRm Rm Rm Rm Rm Rm Rm
Balance as at June 2011 (Audited) 2.0 743.9 444.4 2,775.6 3,965.9 215.8 4,181.7 Total comprehensive income – – 75.9 1,179.6 1,255.5 36.3 1,291.8
Profi t for the period – – – 1,179.6 1,179.6 36.3 1,215.9 Other comprehensive income for the
period – – 75.9 – 75.9 – 75.9
Dividends declared – – – (838.8) (838.8) – (838.8)Net changes in non-controlling interests – – – – – (5.3) (5.3)Distribution to non-controlling interests – – – – – (38.9) (38.9)Cost of acquiring non-controlling interests – – (20.5) – (20.5) – (20.5)Share-based payment expense – – 113.8 – 113.8 – 113.8 Share trust net consideration – – – (127.0) (127.0) – (127.0)Issue of share capital (net of costs) 0.2 – – – 0.2 – 0.2 Treasury shares – 6.7 1.1 – 7.8 – 7.8
Balance as at June 2012 (Audited) 2.2 750.6 614.7 2,989.4 4,356.9 207.9 4,564.8 Total comprehensive income – – 22.5 693.2 715.7 29.2 744.9
Profi t for the period – – – 693.2 693.2 29.2 722.4 Other comprehensive income for the
period – – 22.5 – 22.5 – 22.5
Dividends declared – – – (317.0) (317.0) – (317.0)Net changes in non-controlling interests – – – – – (21.9) (21.9)Distribution to non-controlling interests – – – – – (39.6) (39.6)Cost of acquiring non-controlling interests – – (13.6) – (13.6) – (13.6)Share-based payment expense – – 68.5 – 68.5 – 68.5 Share trust net consideration – – – (72.6) (72.6) – (72.6)Release of share-based payment reserve – – (292.6) 292.6 – – –Release of amortisation of trademark reserve – – (76.5) 76.5 – – –Treasury shares – 1.5 0.3 – 1.8 – 1.8
Balance as at December 2012
(Audited) 2.2 752.1 323.3 3,662.1 4,739.7 175.6 4,915.3
R The non-controlling interests comprise mainly store managers' holdings in certain Masscash stores.R Net changes in non-controlling interests represents the acquisition of non-controlling interests by the Group.R Distribution to non-controlling interests comprise dividends paid to non-controlling shareholders of a Group company.R Cost of acquiring non-controlling interests comprise the costs paid for increasing the Group's interest in a Group company
above the Company's non-controlling interest balance in the statement of fi nancial position.R The share trust net consideration is the cost of buying shares in the market above the exercise price to meet the demands
of the Massmart share schemes.
59Massmart Integrated Annual Report December 2012

FINANCIAL DIRECTOR’S REVIEW CONTINUEDINCLUDING THE AUDITED ABRIDGED ANNUAL FINANCIAL STATEMENTSfor the year ended 23 December 2012
Major items in other reserves include the share-based payments reserve of R579.2 million (Dec 2011: R730.9 million/ June 2012: R803.3 million), the foreign currency translation reserve of R57.3 million (Dec 2011: R51.3 million/ June 2012 R32.2 million) and the cost of acquiring minority interests of a debit of R306.1 million (Dec 2011: R276.8 million/June 2012: R292.5 million). The cost of acquiring non-controlling interests comprise the costs paid for increasing the Group's interest in a Group company above the Company's non-controlling interest balance in the statement of fi nancial position. This was previously recognised in goodwill, and even though recognised in other reserves, the balance will always be a debit balance. On 1 October 2012, the Thuthukani Trust came to an end. The employees had the option of converting their remaining share allocation into Massmart ordinary shares and continue to receive 100% of the dividend on their ordinary shares or they could sell their remaining share allocation and receive net proceeds after tax and selling expenses. The relevant share-based payment reserve was released to retained income. More information relating to other reserves can be found in note 22. http://www.massmart.co.za/invest_profi le/fi nancial_results/2013/massmart_ar2013/fi nancials/group/approval_afs.asp
Statement of cash fl owsfor the year ended 23 December 2012
December 2012 December 2011 June 201226 weeks 26 weeks 52 weeks
Rm(Audited)
Rm(Reviewed)
Rm(Audited)
Cash fl ow from operating activities
Operating cash before working capital movements 1,707.5 1,640.3 2,614.6 Working capital movements 1,110.0 1,939.4 53.9
Cash generated from operations 2,817.5 3,579.7 2,668.5 Interest received 45.6 24.4 68.8 Interest paid (106.0) (72.5) (183.9)Investment income – 3.8 0.1 Dividends received – – 3.8 Taxation paid (369.1) (363.2) (595.6)Dividends paid (317.0) (291.1) (838.8)
Net cash infl ow from operating activities 2,071.0 2,881.1 1,122.9
Cash fl ow from investing activities
Investment to maintain operations (347.6) (334.6) (637.1)Investment to expand operations (402.6) (427.9) (710.4)Proceeds on disposal of property, plant and equipment 8.6 4.5 10.2 Proceeds on disposal of assets classifi ed as held for sale 5.7 5.8 6.5 Investment in subsidiaries (56.9) (1.2) (327.9)Disposal of subsidiaries (50.7) – –Other investing activities 82.3 48.9 50.7
Net cash outfl ow from investing activities (761.2) (704.5) (1,608.0)
Cash fl ow from fi nancing activities
(Decrease)/increase in non-current liabilities (159.8) (224.1) 239.4 (Decrease)/increase in current liabilities (108.1) 123.7 233.5 Non-controlling interests acquired (27.3) – –Net acquisition of treasury shares (72.6) (57.1) (127.0)
Net cash (outfl ow)/infl ow from fi nancing activities (367.8) (157.5) 345.9
Net increase/(decrease) in cash and cash equivalents 942.0 2,019.1 (139.2)Foreign exchange movements 25.1 86.7 67.6 Cash and cash equivalents at the beginning of the period 672.8 744.4 744.4
Cash and cash equivalents at the end of the period 1,639.9 2,850.2 672.8
60 Reports to Stakeholders

Operating cash performance remained resilient and increased by 4.1% to R1,707.5 million (December 2011: R1,640.3 million). This is a great refl ection of the quality of earnings of the Group. Cash released from working capital however, decreased to R1,110.0 million (December 2011: R1,939.4 million). The decrease is a combination of lower trade payable days due to the Group’s increased Food mix contribution and due to the over-stock position in Massdiscounters as a result of the slower comparable store sales in Game SA. Included in operating cash is the cash effect of the Walmart costs amounting to R36.6 million (Dec 2011: R41.7 million/June 2012: R122.9 million).
Total capital expenditure (replacement and expansion) was R750.2 million, a slight decrease on the comparative period of R762.5 million (June 2012: R1,347.5 million). Capital expenditure for all three periods reviewed is the highest in the history of the Group but is in line with the Group’s strategy of investing for the future. Capital expenditure will continue at these high levels for the next 12 months while the Group continues to roll-out new Makro stores, the Massbuild RDC and to acquire key properties.
Investment in subsidiaries has been covered in the Acquisitions paragraph above. More information relating to the statement of cash fl ow can be found in note 37. http://www.massmart.co.za/invest_profi le/fi nancial_results/2013/massmart_ar2013/fi nancials/group/approval_afs.asp
Financial risksThese are described very briefl y below, however, more information relating to the Group’s fi nancial risk management and related sensitivity analysis can be found in fi nancial instruments note 38. http://www.massmart.co.za/invest_profi le/fi nancial_results/2013/massmart_ar2013/fi nancials/group/approval_afs.asp
Liquidity riskLiquidity risk is considered low owing to the Group’s conservative funding structure and its high cash generation. Massmart’s liquidity requirements are continually assessed through the Group’s cash management and treasury function. The Group has total banking facilities, incorporating overnight, short- and medium-term borrowings, letters of credit and forward exchange contracts of R5,428.6 million (June 2012: R6,071.7 million). As at December 2012, total interest-bearing debt amounted to R1.7 billion (June 2012: R2.1 billion).
Interest riskInterest rate exposure is actively monitored owing to the Group’s signifi cant intra-month cash movements and the seasonal changes in its net funding profi le during the fi nancial year. As noted above, interest rates on the three medium-term bank loans are fi xed at 9.8%, 8.1% and 7.9%, respectively. The remaining interest-bearing funding is done through overnight facilities at fl oating interest rates. Of the Group’s total fi nancial liabilities of R16.7 billion, 87.8% or R14.7 billion is represented by non-interest-bearing trade and other payables funding.
Credit riskCredit is available to wholesale customers at Makro, Massbuild and Masscash, and is adequately controlled by using appropriately trained personnel, applying credit granting criteria, continual monitoring and the use of software tools. A portion of the trade debtors’ book in Masscash is insured and a further portion is secured through general notarial bonds, pledges and other forms of security. Similarly, the trade debtors’ books in Builders Warehouse and Builders Trade Depot are also insured.
Currency riskWhere possible and practical, currency risk in the Group is actively managed. All foreign-denominated trading liabilities are covered by matching forward-exchange contracts. At fi nancial year-end, there were open forward exchange contracts totalling R713.1 million (June 2012: R635.5 million) of which 98.6% (June 2012: 98.7%) were US Dollar liabilities. The sensitivity of the Group to this exposure is shown in note 38. http://www.massmart.co.za/invest_profi le/fi nancial_results/2013/massmart_ar2013/fi nancials/group/approval_afs.asp In brief, using the US Dollar as a proxy for the Group’s total currency exposure, if the Rand strengthened by 5% from the 26-week year-end rate of R8.59/US Dollar (June 2012: R8.40/US Dollar), there would be a R3.9 million charge to total comprehensive income, while a 5% weakening would give rise to a R3.9 million gain (52 week June 2012 equivalent fi gures were R6.0 million). Foreign-denominated assets are not covered by forward exchange contracts, as these are permanent assets held for the long term. The Walmart creditor, whilst current in nature, has not been covered. The Group’s exposure to the African currencies has been explained in note 7
http://www.massmart.co.za/invest_profi le/fi nancial_results/2013/massmart_ar2013/fi nancials/group/approval_afs.asp and further detail on the sensitivity analysis can be found in note 38. http://www.massmart.co.za/invest_profi le/fi nancial_results/2013/massmart_ar2013/fi nancials/group/approval_afs.asp
61Massmart Integrated Annual Report December 2012

FINANCIAL DIRECTOR’S REVIEW CONTINUEDINCLUDING THE AUDITED ABRIDGED ANNUAL FINANCIAL STATEMENTSfor the year ended 23 December 2012
Segmental reviewBusiness segmentsThe Group is organised into four Divisions for operational and management purposes, being Massdiscounters, Masswarehouse, Massbuild and Masscash. Massmart reports its business segment information on this basis. The principal offering for each Division is as follows:R Massdiscounters – general merchandise discounter and food retailer.R Masswarehouse – warehouse club.R Massbuild – home improvement retailer and building materials supplier.R Masscash – food wholesaler, retailer and buying association.R The corporate column includes certain consolidation entries.R All inter-company transactions have been eliminated in the above results.R Trading profi t before taxation is earnings before corporate net interest, asset impairments, BEE transaction IFRS 2 charges,
foreign exchange movements, loss on disposal of business, assets classifi ed as held for sale and Walmart-related costs.R Net capital expenditure is defi ned as capital expenditure less disposal proceeds.
Business segmentsTotal Corporate
Mass-discounters
Mass-warehouse Massbuild Masscash
Rm Rm Rm Rm Rm Rm
Sales 36,122.6 – 8,422.1 9,630.2 4,663.1 13,407.2 Operating profi t before interest and taxation 1,125.1 (214.9) 352.5 516.4 269.1 202.0 Trading profi t before interest and taxation 1,427.1 – 426.5 518.1 271.0 211.5 Net fi nance (costs)/income (60.4) (131.8) 23.1 17.0 21.6 9.7 Operating profi t before taxation 1,064.7 (346.7) 375.6 533.4 290.7 211.7 Trading profi t before taxation 1,498.5 – 449.6 535.1 292.6 221.2
Inventory 9,691.5 31.2 3,406.2 2,376.9 1,321.6 2,555.6 Total assets 23,019.8 (3,462.5) 7,667.1 6,136.0 4,594.9 8,084.3 Total liabilities 18,104.5 (7,176.7) 7,492.7 6,299.1 4,236.5 7,252.9
Net capital expenditure 741.6 22.4 261.8 265.9 73.8 117.7 Depreciation and amortisation 342.6 9.4 128.1 62.0 61.6 81.5 Impairment losses 5.4 – – – – 5.4 Non-cash items other than depreciation and impairment 234.4 190.9 34.5 22.6 12.1 (25.7)
Cash fl ow from operating activities 2,071.0 1,545.9 37.2 100.9 102.4 284.6 Cash fl ow from investing activities (761.2) 54.9 (261.6) (253.2) (73.7) (227.6)Cash fl ow from fi nancing activities (367.8) (1,087.6) 388.0 249.1 (11.8) 94.5
Inventory days 59.9 – 99.7 53.6 73.7 38.8 Number of stores 359 – 133 18 85 123 Trading area (m2) 1,413,573 – 441,382 179,202 395,871 397,118 Trading area (m2) increase on
December 2011 7.0% – 6.9% 14.8% 0.5% 11.2%
Trading area (m2) increase on
June 2012 (before re-measurements) 4.7% – 5.8% 17.0% 0.5% 3.3%
Average trading area per store (m2) 3,938 – 3,319 9,956 4,657 3,229 Distribution centre space (m2) 290,704 – 178,488 51,300 29,624 31,292 Distribution centre space (m2)
increase on December 2011 18.1% – 5.6% 95.1% – 46.4%
Distribution centre space (m2)
increase on June 2012 11.1% – 5.6% 32.2% – 29.3%
Number of full-time equivalents 36,053 314 13,767 3,854 8,083 10,035 Number of full-time equivalents
increase on December 2011 7.2% (0.3%) 12.2% 21.8% (4.3%) 6.2%
Number of full-time equivalents
increase on June 201211.1% 0.3% 38.1% 9.5% 9.4% (10.8%)
for the 26 week year ended December 2012
62 Reports to Stakeholders

Business segmentsfor the 52 week year ended June 2012 Total Corporate
Mass-discounters
Mass-warehouse Massbuild Masscash
Rm Rm Rm Rm Rm Rm
Sales 61,209.1 – 14,805.7 15,370.6 8,138.0 22,894.8 Operating profi t before interest and taxation 1,949.2 (205.4) 656.2 848.4 397.2 252.9 Trading profi t before interest and taxation 2,265.3 – 749.8 844.5 389.8 281.2 Net fi nance (costs)/income (115.1) (306.6) 63.2 61.8 45.5 21.0 Operating profi t before taxation 1,834.1 (512.0) 719.4 910.2 442.7 273.9 Trading profi t before taxation 2,456.8 – 813.0 906.3 435.3 302.2
Inventory 7,615.6 8.6 2,661.2 1,793.2 1,198.3 1,954.3 Total assets 19,174.9 (2,763.5) 5,912.0 4,838.7 4,298.5 6,889.2 Total liabilities 14,610.1 (6,237.5) 5,775.7 5,032.5 4,131.3 5,908.1
Net capital expenditure 1,337.3 (106.6) 505.9 318.9 304.9 314.2 Depreciation and amortisation 594.2 16.1 213.2 110.2 119.7 135.0 Impairment losses 16.5 – – – – 16.5 Non-cash items other than depreciation and impairment 54.7 (34.7) 51.9 22.5 18.3 (3.3)
Cash fl ow from operating activities 1,122.9 385.7 (136.1) 76.5 209.9 586.9 Cash fl ow from investing activities (1,608.0) 187.1 (505.9) (455.8) (304.9) (528.5)Cash fl ow from fi nancing activities 345.9 (1,070.1) 607.7 245.5 332.9 229.9
Inventory days 55.6 – 89.0 51.0 75.0 34.0 Number of stores 348 – 125 16 84 123 Trading area (m2) 1,350,300 – 415,186 146,026 406,987 382,101 Trading area (m2) increase on June 2011 5.4% – 7.1% 13.7% (1.5%) 8.6%
Average trading area per store (m2) 3,880 – 3,321 9,127 4,845 3,107 Distribution centre space (m2) 261,579 – 168,953 38,800 29,624 24,202 Distribution centre space (m2) increase
on June 2011 11.2% – – 210.4% – 13.2%
Number of full-time equivalents 32,439 313 9,972 3,519 7,390 11,245 Number of full-time equivalents increase
on June 2011 17.0% 5.4% 18.1% 22.3% 8.1% 21.2%
63Massmart Integrated Annual Report December 2012

FINANCIAL DIRECTOR’S REVIEW CONTINUEDINCLUDING THE AUDITED ABRIDGED ANNUAL FINANCIAL STATEMENTSfor the year ended 23 December 2012
Geographic segments
The Group's four Divisions operate in two principal geographical areas – South Africa and the rest of Africa.
Geographic segmentsfor the 26 week year ended December 2012
Total South Africa Rest of AfricaRm Rm Rm
Sales 36,122.6 33,503.5 2,619.1 Segment assets 16,716.7 16,215.8 500.9 Net capital expenditure 741.6 700.6 41.0
R All inter-company transactions have been eliminated in the above results.R Segment assets excludes fi nancial instruments and deferred taxation and refl ects the geographic location of the Group's
physical assets.R Net capital expenditure is defi ned as capital expenditure less disposal proceeds.
More information relating to segmental reporting can be found in note 39. http://www.massmart.co.za/invest_profi le/fi nancial_results/2013/massmart_ar2013/fi nancials/group/approval_afs.asp
Related-party transactionsRelated-party transactions comprise:R Transactions between the Company and its subsidiaries, which have been eliminated on consolidation and are thus not disclosed.R Compensation of key-management personnel.R Transactions between the Company and Wal-Mart Stores, Inc (its holding company). Walmart transaction, integration
and related costs comprise professional fees, integration costs, expatriate employment costs, share-based payment, travel, consulting costs and other directors expenses relating to the Walmart transaction, of which certain amounts remain unpaid at the reporting date, as well as the additional R140 million being the increase in the Supplier Development Fund required by the judgement of the Competition Appeal Court. As a 51% shareholder, Wal-Mart Stores, Inc also received a dividend of R166 million based on their number of shares held.
R The Group holds cash reserves on behalf of the Group's Chairman, Lamberti Education Foundation Trust.R Loans to directors.R The post-retirement medical aid liability, Massmart Pension Fund and Massmart Provident Fund are managed for the
benefi t of past and current employees of the Group.
More information on related-party transactions can be found in note 33. http://www.massmart.co.za/invest_profi le/fi nancial_results/2013/massmart_ar2013/fi nancials/group/approval_afs.asp
Directors’ emolumentsA detailed review can be found in Corporate Governance on pages 82 – 84. This information can also be found in notes 34 and 35.
http://www.massmart.co.za/invest_profi le/fi nancial_results/2013/massmart_ar2013/fi nancials/group/approval_afs.asp
Technical reviewThe appropriate accounting policies, supported by sound and prudent management judgement and estimates, have been consistently applied, except for IAS 1: Presentation of Financial Statements, which amended the presentation of items within the Statement of Comprehensive Income. No restatement was required in the Group fi nancial statements for this change.
The accounting policies and methods of computation applied in the preparation of the abridged annual fi nancial statements are consistent with those applied in the preparation of the Group’s annual fi nancial statements for the 26 weeks ended 23 December 2012.
The Group fi nancial statements have been prepared in accordance with the framework concepts and the measurement and recognition requirements of International Financial Reporting Standards (IFRS), the SAICA Financial Reporting Guides as
64 Reports to Stakeholders

issued by the Accounting Practices Committee, the Financial Reporting Pronouncements as issued by the Financial Reporting Standards Council, the JSE Listings Requirements and the requirements of the Companies Act of South Africa.
A technical review has been provided in note 2 http://www.massmart.co.za/invest_profi le/fi nancial_results/2013/massmart_ar2013/fi nancials/group/approval_afs.asp of Standards issued and not yet effective as well as Standards that became effective in the current period.
Independent auditorsTo align with Wal-Mart Stores, Inc. (Massmart’s ultimate holding company), Massmart has changed its external auditors to Ernst & Young with effect from this reporting cycle.
Critical judgements in applying the Group's accounting policiesIn the process of applying the Group's accounting policies, management has not made any critical judgements that have a signifi cant effect on the amounts recognised in the fi nancial statements. Management applies judgement in classifying a lease as fi nancing or operating at its inception.
Key sources of estimation uncertaintyThe following areas highlight where estimation has been used in the Group fi nancial results:R Property, plant and equipment useful lives and residual values;R Goodwill impairment calculation;R Inventory provisions;R Allowance for doubtful debts;R Fair value of options granted;R Provision for post-retirement medical aid; andR Deferred tax assets – estimation of future taxable profi t.
More detail on estimation uncertainty is provided in note 41. http://www.massmart.co.za/invest_profi le/fi nancial_results/2013/massmart_ar2013/fi nancials/group/approval_afs.asp
Going-concern assertionThe Board has formally considered the going-concern assertion for Massmart and its subsidiaries and believes that it is appropriate for the forthcoming fi nancial year. The going concern assertion can be found in the Directors’ report.
http://www.massmart.co.za/invest_profi le/fi nancial_results/2013/massmart_ar2013/fi nancials/group/approval_afs.asp
Subsequent eventsWith effect from the end of January 2013, Massmart acquired seven Makro stores that had previously been lease-held. The cash consideration paid for control amounted to R575 million.
AppreciationI would like to acknowledge and pay tribute to the high-quality performances and signifi cant efforts invested by my Finance colleagues and their teams at the Massmart Divisions and the Massmart Corporate Offi ce. The December 2012 fi nancial year was a particularly diffi cult year for the Group’s Finance teams as they faced a change of year-end, change of auditors and progressed well with the Walmart integration. They delivered superbly on the on-going demands of their Divisions and the Group.
Ilan Zwarenstein
Financial Director
8 April 2013
65Massmart Integrated Annual Report December 2012

DEFINITIONS AND FORMULASEmployment costs
Includes the IFRS 2 Share-based Payment expense.
Other operating costs
Includes the foreign exchange gains and losses.
Walmart costs
Includes professional fees, integration costs, expatriate employment costs, share-based payments, travel, consulting costs and other direct expenses relating to the Walmart transaction.
Net fi nance costs
Interest received less interest paid.
EBITDA
Earnings before interest, taxation, depreciation, amortisation and asset impairments.
EBITDAR
Earnings before interest, taxation, depreciation, amortisation, asset impairments and occupancy costs.
Trading profi t before
interest and taxation
Earnings before interest, taxation, asset impairments, the BEE IFRS 2 charge, foreign exchange movements, loss on disposal of business, assets classifi ed as held for sale and Walmart related costs.
Comparable sales
Sales fi gures quoted for stores that have traded in excess of 12 months.
FTE (full-time
equivalents)
Includes all permanent employees and the permanent equivalent of temporary employees and contracted workers.
Trading space (m2)
Trading space excludes parking, yard, warehouse space, offi ce space and receiving areas.
Dividends/distribution
Distribution to shareholders.
Sales per store (R000)
Sales
Number of stores
Sales for Shield, CellShack, Saverite, Kawena and Kangela are excluded as they do not have stores.
Sales per FTE (R000)
Sales
FTE’s
Sales per trading m2
(R000)
Sales
Trading m2
Sales for Shield, CellShack, Saverite, Kawena and Kangela are excluded as they do not have stores.
Net asset turn
Sales
Net assets
The Group defi nes net assets as capital reserves and interest-bearing LT liabilities.
Gross margin (%)
Gross profi t
Sales
Operating margin (%)
Operating profi t
Sales
Trading profi t before
interest and taxation
margin (%)
Trading profi t before interest and taxation
Sales
EBITDA margin (%)
EBITDA
Sales
Effective tax rate (%)
Taxation
Profi t before tax
Note 9 in the Group Financial Statements holds further information.
http://www.massmart.co.za/invest_profi le/fi nancial_results/2013/massmart_ar2013/fi nancials/group/approval_afs.asp
Return on average
shareholders’ equity (%)
Headline earnings
Average of opening and closing equity
attributable to equity holders of the parent
Return on capital
employed (%)
Operating profi t before asset impairments
Average of opening and closing capital employed balances
The Group defi nes capital employed as capital and reserves and interest-bearing LT liabilities.
Return on invested
capital (%)
Adjusted operating profi t
Average invested capital
Adjusted operating profi t includes fi nance income and adds back depreciation, amortisation and occupancy costs
Average invested capital is average total assets of continuing operations plus average accumulated depreciation and amortisation less average accounts payable less average accrued liabilities plus occupancy costs x8.
Debt: Equity (%)
Debt
Capital and reserves
Debt comprises non-current interest-bearing liabilities.
Cash earnings cover
Operating cash fl ow per share
Headline earnings per share
Net cash to total equity
(%)
Cash and cash equivalents,
net of borrowings
Total equity at the end of the year
Current ratio
Current assets
Current liabilities
Quick ratio
Current assets excluding inventory
Current liabilities
Inventory days
Inventory
Total cost of sales
Inventory turn
Total cost of sales
Inventory
Payable days
Trade payables
Total cost of sales
Asset turn
Sales
Total assets
Total liabilities to total
equity
Current and non-current liabilities
Total equity
Headline earnings
per share
Headline earnings
Weighted average number of shares
in issue
Diluted headline
earnings per share
Headline earnings
Diluted weighted average number of
shares in issue
Attributable earnings
per share
Earnings attributable to the equity holders of
the parent
Weighted average number of shares
in issue
Cash generated from
operations before
working capital
movements per share
Cash generated from operations before working capital
movements
Weighted average number of shares
in issue
Operating cash fl ow
per share
Net cash fl ow from operations
Weighted average number of shares
in issue
Net cash fl ow from operations is after working capital movements, and excludes exceptional items and dividends paid.
Net asset value
Capital and reserves
Total number of shares in issue
Dividend cover
Headline earnings per share
Interim and fi nal dividend per share
66 Reports to Stakeholders

CONTENTS R EXCEPTIONS TO KING III 68
R BOARD AND COMMITTEE ATTENDANCE 72
R BOARD COMMITTEES 73
R GROUP RISK LANDSCAPE 74
R INTEREST OF DIRECTORS IN THE
COMPANY SHARE SCHEME 80
R DIRECTORS’ EMOLUMENTS 82
R INVESTOR RELATIONS 85
R SHAREHOLDER ANALYSIS 86
CORPORATE GOVERNANCEBUILDERS EXPRESS, BRYANSTON
BUILDERS TRADE DEPOT, SOWETO
BUILDERS WAREHOUSE, NORTHRIDING

EXCEPTIONS TO KING III
INTRODUCTION
Principle 2.18NOT APPLIED
The Board comprises a balance of power, with a majority of Non-executive Directors. The majority of Non-executive Directors are independent.The majority of the Non-executive Directors on the Board are independent.
Comment:Following the Walmart transaction, the reconstituted board does not have a majority of independent Non-executive Directors as required by King III. In mitigation, the majority of the Non-executive Directors are independent, as are the Chairman and Deputy Chairman.
Principle 2.25NOT APPLIED
The Company remunerates its Directors and Executives fairly.The value of awards of share options and incentives is not signifi cant compared to base pay.
Comment:The Remuneration Committee believes that participants in the employee share scheme should, on average, hold unvested shares or options representing value equivalent to approximately three times their annual remuneration.
Massmart believes that the fi rst steps towards good corporate governance must include embracing the requirements of the relevant governance and regulatory framework, as well as corporate best practice.
More than this, Massmart believes that sustainable and effective corporate governance is best demonstrated through a consistent pattern of doing the right thing regardless of the circumstances. The primary South African corporate governance framework is the King Report on Governance for South Africa and King Code of Governance Principles (King III), which forms the backbone to Massmart’s own corporate governance framework; in addition Massmart applies high ethical standards to its operating environment as refl ected in the Group’s Code of Ethical Conduct. Massmart believes that these sources of corporate decision making are essential for any governance framework to achieve desired outcomes consistent with out Company values. In addition to this corporate governance framework, the Group is committed to complying with all legislation, regulations and best practices relevant to our business, in every country where we conduct business.
For the 26 weeks ended 23 December 2012, apart from the exceptions outlined below, the Board confi rms that the Group complied with the Code of Governance Principles as set out in King III. A register documenting the assessment of all 75 principles of King III is available on the web: http://www.massmart.co.za/invest_profi le/fi nancial_results/2013/massmart_ar2013/governance/king_iii.asp
68 Corporate Governance

Principle 2.25NOT APPLIED
The Company remunerates its Directors and Executives fairly.Non-executive Directors’ fees comprise both a base fee and an attendance fee per meeting.
Comment:The Board does not believe that Directors should earn attendance fees in addition to a base fee. Many Directors add signifi cant value to the Group outside of the formal Board and Committee meetings, sometimes greater value than they might do within the confi nes of a formal meeting.
Principle 2.25PARTIALLY APPLIED
The Company remunerates its Directors and Executives fairly.The remuneration report discloses performance measures for vesting of share options and the reasons for choosing those performance measures.
Comment:The report discloses performance measures for vesting of share options but not the reasons for choosing those performance measures.
Principle 2.26NOT APPLIED
The Company has disclosed the remuneration of each individual Director and prescribed offi cer.The remuneration report includes the term of Executive service contracts as well as the notice period for termination.The remuneration report discloses both the nature and period of restraint provided for in Executive service contracts.
Comment:Whilst the remuneration of each Director and prescribed offi cer is disclosed, their notice period for termination and any restraints provided for in Executive Service Contracts, are not disclosed.
Principle 2.27NOT APPLIED
The shareholders have approved the Company’s remuneration policy.Shareholders pass a non-binding advisory vote on the Company's remuneration policy every year.
Comment:The Board does not ask the shareholders for non-binding approval for the Group’s remuneration policies. The rationale and basis for the Group’s Executive remuneration policy is carefully considered by the Remuneration Committee and is documented in the integrated annual report. Shareholders with concerns about this policy should contact the Chairman of either the Board or the Committee.
69Massmart Integrated Annual Report December 2012

Principle 3.2PARTIALLY APPLIED
Audit committee members are suitably skilled and experienced independent Non-executive Directors.The integrated report discloses the names and qualifi cations of all members of the Audit Committee during the period under review, and the period that each member has served on the Audit Committee.
Comment:Whilst we do not disclose the period that each member has served on the Audit Committee, we do show their length of service on the Board, in the Directors’ CV’s on pages 19 – 21.
Principle 3.4PARTIALLY APPLIED
The Audit Committee oversees integrated reporting.The Audit Committee recommends to the Board to engage an external assurance provider over material elements of the sustainability reporting within the integrated report. The Audit Committee evaluates both the independence and quality of the external providers of assurance on sustainability.
Comment:Massmart’s sustainability report has not been audited by an external assurance provider but verifi cation of the key sustainability metrics have been obtained through agreed upon procedures performed by Massmart Internal Audit Services (MIAS). A copy of the agreed upon procedures report is available at the registered offi ces of the Company.
Principle 3.7NOT APPLIED
The Audit Committee oversees the internal audit function.The Audit Committee is responsible for the appointment, performance assessment and dismissal of the Chief Audit Executive or outsourced internal audit service provider.
Comment:Massmart does not apply the King III recommendation that this Committee be responsible for the appointment, remuneration, performance assessment and where necessary the dismissal of the Chief Audit Executive. This process is conducted jointly by the Audit and Risk Committee and the Massmart Executive Directors as this is deemed more effective.
Principle 4.3PARTIALLY APPLIED
The Risk Committee and/or Audit Committee has assisted the Board in carrying out its risk responsibilities.Both the following statements are true: Membership of the Risk Committee includes Executive and Non-executive Directors; and members of senior management and independent risk management experts are invited to attend, if necessary.
Internal Comment:The Audit and Risk Committee includes only Non-executive Directors to ensure objectivity, however Executive Directors, members of senior management and independent risk management experts are invited to attend.
EXCEPTIONS TO KING III CONTINUED
70 Corporate Governance
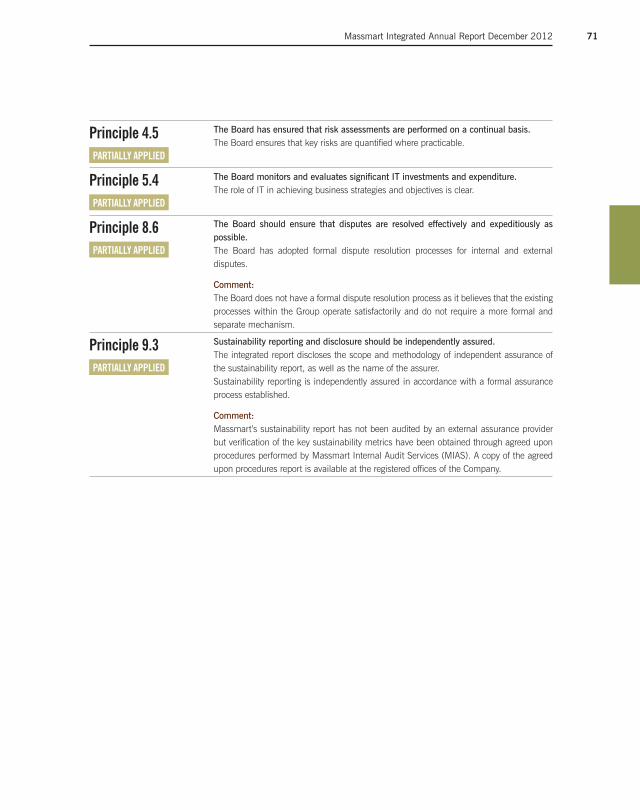
Principle 4.5PARTIALLY APPLIED
The Board has ensured that risk assessments are performed on a continual basis.The Board ensures that key risks are quantifi ed where practicable.
Principle 5.4PARTIALLY APPLIED
The Board monitors and evaluates signifi cant IT investments and expenditure.The role of IT in achieving business strategies and objectives is clear.
Principle 8.6PARTIALLY APPLIED
The Board should ensure that disputes are resolved effectively and expeditiously as possible.The Board has adopted formal dispute resolution processes for internal and external disputes.
Comment:The Board does not have a formal dispute resolution process as it believes that the existing processes within the Group operate satisfactorily and do not require a more formal and separate mechanism.
Principle 9.3PARTIALLY APPLIED
Sustainability reporting and disclosure should be independently assured.The integrated report discloses the scope and methodology of independent assurance of the sustainability report, as well as the name of the assurer.Sustainability reporting is independently assured in accordance with a formal assurance process established.
Comment:Massmart’s sustainability report has not been audited by an external assurance provider but verifi cation of the key sustainability metrics have been obtained through agreed upon procedures performed by Massmart Internal Audit Services (MIAS). A copy of the agreed upon procedures report is available at the registered offi ces of the Company.
71Massmart Integrated Annual Report December 2012

BOARD AND COMMITTEE ATTENDANCE
C Chairperson
* Invitee
1 Appointed to the Board on 20 August 2012
2 In accordance with King III, with effect from 4 March 2013 the Nomination
and Remuneration Committee has been split into two committees:
Mr MJ Lamberti will chair the Nomination Committee; and Mr CS Seabrooke
will chair the Remuneration Committee. The membership of the committees
will be the same as that of the former combined committee.
STATUS/POSITION BOARD AGMAUDIT AND
RISKNOMINATION AND REMUNERATION2
SOCIAL AND ETHICS
BOARD MEMBERS
MJ Lamberti Independent Non-executive
2/2C 1/1C – 2/2C –
CS Seabrooke Independent Non-executive
2/2 1/1 2/2C 2/2 –
D Cheesewright1 Non-executive 2/2 1/1 – 2/2 1/1*
JA Davis Non-executive 2/2 0/1 1/2* – –
NN Gwagwa Independent Non-executive
2/2 1/1 1/2 – –
GRC Hayward Executive 2/2 1/1 1/2* 2/2* –
P Langeni Independent Non-executive
1/2 0/1 2/2 – 1/1C
GM Pattison Executive 2/2 1/1 1/2* 2/2* 1/1
JP Suarez Non-executive 2/2 0/1 – – 0/1
I Zwarenstein Executive 2/2 1/1 2/2* 1/2* –
MANAGEMENT
N Gray Chief Audit Executive – 1/1* 2/2* – –
B Leroni Corporate Affairs Executive
– 1/1* – – 1/1*
P Maphoshe Human Capital Executive
– – – 1/2* 1/1*
M Mthunzi Supplier Development Executive
2/2* 1/1* – – –
P Sigsworth Company Secretary 2/2* 1/1* 2/2* – –
M Spivey General Counsel and Chief Compliance Offi cer
2/2* – 2/2* 2/2* 1/1*
K Vyvyan-Day Divisional Chief Executive Cambridge Food
– – 1/2* – –
CD McMillon resigned from the Board on 20 August 2012 and was not required to attend any of the meetings in the 26 weeks
ended 23 December 2012.
The table below refl ects the Board members’ attendance at the meetings for the 26 weeks ended 23 December 2012 only
72 Corporate Governance

BOARD COMMITTEES
COMPOSITIONSCHEDULED MEETINGS RESPONSIBILITY
AUDIT AND RISK COMMITTEECORPORATE GOVERNANCEMore information on the activities and responsibility of the Audit and Risk Committee can be found on the web at: http://www.massmart.
co.za/invest_profi le/fi nancial_
results/2013/massmart_ar2013/
governance/king_iii.asp
Chris Seabrooke Mark Lamberti*Lulu Gwagwa Phumzile Langeni
* Mr Mark Lamberti has
been appointed a member
of the Audit and Risk
Committee with effect
from 4 March 2013. This
appointment will be put to
shareholders for approval at
the Company’s May 2013
Annual General Meeting.
4 TIMES a year
TWICE in this 26 week reporting period
R Overseeing the effectiveness of the Group’s internal control systems.
R Reviewing the scope and effectiveness of the external and internal audit functions.
R Ensuring that adequate accounting records have been maintained.
R Ensuring the appropriate accounting policies have been adopted and consistently applied.
R Reviewing and reporting on compliance with King III. R Testing that the Group’s going-concern assertion remains
appropriate. R Overseeing the quality and integrity of the annual fi nancial
statements. R Overseeing the Group’s risk management programme as
contemplated in King III.
SOCIAL AND ETHICS COMMITTEECORPORATE GOVERNANCEMore information on the activities and responsibility of the Social and Ethics Committee can be found on the web at: http://www.massmart.
co.za/invest_profi le/fi nancial_
results/2013/massmart_ar2013/
governance/king_iii.asp
Phumzile Langeni Grant PattisonJP Suarez
TWICE a year
ONCE in this 26 week reporting period
R Assisting the Group with its responsibility towards sustainability with respect to practices that are consistent with good corporate citizenship .
R Assessing the Company’s standing in terms of the United Nations Global Compact Principles.
R Considering the Company’s standing in terms of consumer relationships, with particular attention to the United Nations Global Compact Principles and the OECD recommendations concerning corruption.
R Considering the Group’s contribution to the social and economic development within our communities.
R Assessing the Group’s contribution to labour and employment, the environment and health and public safety.
NOMINATION COMMITTEECORPORATE GOVERNANCEMore information on the activities and responsibility of the Nomination and Remuneration Committee can be found on the web at: http://
www.massmart.co.za/invest_profi le/
fi nancial_results/2013/massmart_
ar2013/governance/king_iii.asp
Mark Lamberti Chris Seabrooke David Cheesewright
3 TIMES a year
The Nomination and Remuneration Committee met TWICE in this 26 week reporting period and has been split into two committees with effect from 4 March 2013
R The assessment, recruitment and nomination of new Executive and Non-executive Directors.
R Making recommendations as to the composition of the Board.
R Formulating succession plans for the approval of the Board for the appointment of new Executive and Non-executive Directors, including the Chairperson and CEO.
REMUNERATION COMMITTEECORPORATE GOVERNANCEMore information on the activities and responsibility of the Remuneration Committee can be found on the web at: http://www.
massmart.co.za/invest_profi le/
fi nancial_results/2013/massmart_
ar2013/governance/king_iii.asp
Chris Seabrooke Mark LambertiDavid Cheesewright
3 TIMES a year
The Nomination and Remuneration Committee met TWICE in this 26 week reporting period and has been split into two committees with effect from 4 March 2013
R Designing, monitoring and communicating the Group’s remuneration policies.
R Considering and approving Executive remuneration including short- and long-term incentives.
EXECUTIVE COMMITTEEMASSMART AT A GLANCEBiographical details of each Executive Committee member can be found on pages 22 – 24
Grant Pattison Guy Hayward Ilan ZwarensteinNeville DunnDoug JonesBrian LeroniPearl MaphosheMncane MthunziMike SpiveyLlewellyn SteeneveldtKevin Vyvyan-DayLlewellyn WaltersRobin Wright
MONTHLY R Deliberating and taking decisions or making recommendations on all matters affecting Group strategy and operations, including risk management, and Executive and senior management succession.
73Massmart Integrated Annual Report December 2012

GROUP RISK LANDSCAPEfor the year ended 23 December 2012
Strategic/environmental riskDEFINITION
BUSINESS MODEL/ STRATEGIC EXECUTION
RISK: Non-adherence to business model or poor strategic execution
Through non-adherence to, or poor implementation and execution and/or prioritisation of, our business model and/or strategy, the Group’s longer-term fi nancial performance and competitive positioning could be severely compromised. The resultant fi nancial performance may be sub-optimal on either an absolute or relative basis.
BUSINESS MODEL/ STRATEGIC EXECUTION
RISK: Insuffi cient progress with Transformation
There is the possibility of adverse reputational exposure due to the Divisions or the Group not fulfi lling, or under delivering, in respect of BBBEE requirements. In the broader national context, inadequate transformation at all levels by Massmart and other South African businesses will curb the country’s longer-term growth potential and maintain the current, unacceptable and unsustainable levels of social and economic inequality. This issue includes insuffi cient Black representation at Executive level at the Group and Divisions.
HUMAN CAPITAL
RISK: Talent retention and succession
This covers four broad issues being: the national scarcity of retail-specifi c skills; the challenge to develop and retain suffi cient business and leadership skills internally to ensure our longer-term competitiveness; a possible over-dependence on key leaders in the Group; and the need for an actively managed leadership succession pipeline.
DEFINITIONSTRATEGIC/ENVIRONMENTAL RISKS
tend to be longer-term and more material in nature and can, in most cases, only be monitored, managed and partially mitigated through longer-term strategic or tactical business responses. Th ese risks, which, for example, include executive talent retention and succession, transformation and supply chain, are the primary focus of the Group’s Risk Management process.
74 Corporate Governance

POTENTIAL IMPACT RISK MITIGATION
R PROBABILITY
LOW
R FINANCIAL IMPACT
HIGH
R BUSINESS IMPACT
HIGH
The Group insists on strategic clarity at the Divisions and Massmart Corporate.
The strategies of all Divisions and the Group are formally documented and are reviewed annually at Divisional level, at Group Executive Committee level and then by the Board. A Division’s strategies dictate management’s operational tactics and priorities. The annual budget process is an output of these reviews and on-going monthly monitoring of annual fi nancial results and comparison to budget at Divisional Boards and Group Executive Committee level takes place.
R PROBABILITY
LOW
R FINANCIAL IMPACT
MEDIUM
R BUSINESS IMPACT
HIGH
The Board-approved BBBEE strategy covering the elements of the Code of Good Practice, has been implemented Group-wide. The most recent annual external BBBEE rating resulted in Level 4 status. Transformation is an agenda item at all Divisional and Group Board meetings and a senior Executive at Massmart has overall responsibility for delivering the strategy.
A BBBEE staff share issue amounting to 10% of the pre-dilution shares of Massmart was implemented in 2006 and all permanent Massmart employees, not already participants in the existing employee share trust, became benefi ciaries at that time. In 2008, the Group’s fi ve black Non-executive Directors, at the time, each purchased 20 000 heavily discounted Massmart shares.
R PROBABILITY
MEDIUM
R FINANCIAL IMPACT
HIGH
R BUSINESS IMPACT
HIGH
This remains a major focus area. The Executive Committee actively monitors the progress, development and possible succession plans for the ‘Top 200’ employees, as well as monitoring a further 200 employees.
There are in-house education programmes prepared and presented in conjunction with local and international business schools that focus on developing middle and junior Executives, and there is an in-house graduate recruitment programme in place.
Annual ‘fi re-side chats’ are held with each Executive in the Group, which are attended by that person’s superior and a third Executive.
The Group’s remuneration policy, incorporating short- and longer-term incentives, is designed to reward signifi cant outperformance and provides an opportunity for staff to accumulate wealth. The Share Scheme may act as a retention mechanism.
75Massmart Integrated Annual Report December 2012

GROUP RISK LANDSCAPE CONTINUEDfor the year ended 23 December 2012
Strategic/environmental risk continued
DEFINITION
ECONOMIC
RISK: Economic volatility
This concern focuses on three potential impacts, the fi rst being the possible fi nancial impact on the Group and the second being the possible adverse effect on consumer expenditure of dramatic changes in key economic variables including infl ation, interest and exchange rates. The third concern is the potential adverse systemic socio-economic impact of the HIV/AIDS pandemic.
With approximately 30% of the Group’s merchandise being imported, directly and indirectly, any changes in the exchange rate will eventually affect the valuation of imported stock.
Foreign currency fl uctuations in those African countries where the Group operates stores affects the level of sales and earnings reported by those stores in South African currency, and results in potentially adverse translation differences affecting earnings. The valuation of stock imported into those countries from South Africa becomes infl ationary.
Increases in interest rates will make South African corporate funding more expensive, with an adverse impact on profi tability.
Higher cost infl ation may affect Group profi tability where these cost increases cannot be controlled or no additional productivity is achieved. Consistently lower infl ation rates may make long-term property leases with higher fi xed escalation rates appear expensive and potentially affect profi tability.
South African consumer behaviour appears to be more affected by sudden and large changes in economic variables, including exchange rates and local interest and infl ation rates, than by gradual changes in these variables. It follows that a sudden deterioration in one or several of these economic variables may dampen levels of consumer expenditure, thereby reducing Group sales growth and potentially Group or Divisional profi tability.
GOVERNANCE/REGULATORY
RISK: Expected standards of sustainability conduct
There is a growing potential threat of signifi cant reputational risk associated with the failure to meet stakeholders’ increased expectations around Sustainability in its many forms. These expectations may be shaped by a variety of standards of conduct as encapsulated in codes such as Global Reporting Initiative, Global Compact, JSE SRII, Broad-based Black Economic Empowerment Codes of Good Practice, Marine Stewardship Council (MSC), Forestry Stewardship Council (FSC) and ISO 14001 certifi cation. Increasingly, the Group needs to comply with some or all of these standards.
76 Corporate Governance

POTENTIAL IMPACT RISK MITIGATION
R PROBABILITY
HIGH
R FINANCIAL IMPACT
MEDIUM
R BUSINESS IMPACT
MEDIUM
All direct foreign exchange import liabilities are covered forward, providing certainty about the expected landed cost of merchandise and also providing a four- to six-month buffer against changing the cost of imported inventory should there be any sudden deterioration in the exchange rate.
Interest rates on the Group’s medium-term debt have been fi xed to provide certainty as to the future cost of this funding, and this will keep the Group partially immune to any adverse increases in corporate borrowing rates.
Property lease escalation rates are negotiated as low as possible, taking market conditions into account, and certain property leases are infl ation-linked, within a cap (maximum rate) and collar (minimum rate).
Salary and wage increases are necessarily negotiated in the context of the South African socio-economic environment. Where a negotiated increase may be higher than is commercially desired or justifi able, productivity measures may be introduced to reduce the net cost of the higher wages.
The Group continually explores means of keeping the net assets of Game’s African operations to a minimum, thereby potentially reducing the translation effect of any currency movement. This includes repatriating cash profi ts as frequently as possible and settling cross-border liabilities timeously.
R PROBABILITY
LOW
R FINANCIAL IMPACT
MEDIUM
R BUSINESS IMPACT
MEDIUM
The Group has implemented transparent stakeholder interactions with special interest groups, which inform our view on stakeholder expectations and the management thereof. There is ongoing identifi cation, monitoring and adoption of relevant principles and standards of sustainability that are consistent with Massmart’s core values and industry norms. Massmart is in the JSE SRII and it subscribes to MSC and FSC, inter alia.
77Massmart Integrated Annual Report December 2012

GROUP RISK LANDSCAPE CONTINUEDfor the year ended 23 December 2012
Operational riskDEFINITION
OPERATIONAL
RISK: Supply chain
Supply chain describes all the business processes concerning the movement of inventory in the Group, and is not restricted to logistics but extends into IT systems and business processes around those systems.
An effi cient and effective supply chain should ensure the lowest-cost movement, and holding, of inventory and the optimisation of in-store inventory levels for given levels of demand.
An ineffective or ineffi cient supply chain may result in sub-optimal inventory management, with duplication of costs and over- or under-stocking affecting holding costs or rates of sales.
OPERATIONAL
RISK: In-store health and safety
The Group’s large warehouse format means that large and sometimes heavy quantities of inventory are moved, stored and stacked – sometimes at great heights – in our stores. Despite compliance with all relevant legislation, there remains the risk of injury or death to customers or employees should bulky items collapse, with the associated signifi cant reputational risk.
OPERATIONAL
RISK: Reliance on IT systems
With millions of transactions daily, the Group is dependent upon reliable, secure, effective and effi cient IT systems, including the management and storage of data and information. Major IT implementations or initiatives can distract management, be costly, destabilise other IT platforms and the business, and/or perform sub-optimally post-implementation. The Group may overly rely on one or more service providers. Secure and reliable connectivity with key transactional intermediaries including banks is critical. Finally, at a strategic level, there exists the potential for misalignment between business strategy and IT capability, which can result in reduced operational effectiveness.
GEO-POLITICAL/ECONOMIC
RISK: Complexity of the Group’s African operations
This refers to the multiple levels of risk, and the associated complexity, of doing business in 12 countries across Africa, each with different regulatory, fi scal and customs environments. Political risk can become an issue. African currencies can be illiquid, making them vulnerable to any withdrawal of hard currencies. Bureaucracy and/or currency illiquidity can delay cash repatriations. There are also operational and logistical challenges in managing the lengthy supply chain. There are, in addition, often challenges presented in securing legal title to land in some countries.
COMPETITIVE
RISK: Competitor attack on our major merchandise categories
This refers to the potential adverse impact of a sustained attack by a major competitor (local or international) on one or more of the Group’s major merchandise categories or formats.
DEFINITIONOPERATIONAL RISKS by their nature can be immediately addressed or mitigated by local management actions. Th ese risks – which include in-store health, safety and security, compliance, fi re prevention and detection, IT systems and food safety, amongst others – are therefore the direct responsibility of each Divisional Executive Committee where a Loss Prevention or Risk Offi cer has line-responsibility for overseeing these risks.
78 Corporate Governance

POTENTIAL IMPACT RISK MITIGATION
R PROBABILITY
R FINANCIAL IMPACT
R BUSINESS IMPACT
Massdiscounters, Makro and Builders Warehouse have implemented IT software to automate the forecasting and replenishment (F&R) of inventory. Massdiscounters has about 75% of their sales by value being automatically replenished. This ratio is about 70% in Builders Warehouse and 20% in Makro.
Massdiscounters now operates three substantial Regional Distribution Centres (RDCs) in Cape Town, Johannesburg and Durban. These have been very effective in addressing supply chain concerns and have improved inventory shrinkage levels and in-stock service levels in the stores. Makro operate two DCs in Johannesburg and Builders Warehouse is commissioning one.
R PROBABILITY
R FINANCIAL IMPACT
R BUSINESS IMPACT
Risk offi cers in each Division are responsible for monitoring and improving compliance. Executive awareness and scrutiny is high. There is formal communication with suppliers and logistics providers around specifi ed stacking protocols, and regular staff training in place.
We continually use MIAS and third party service providers to review in-store health and safety procedures.
Warning signs are on display in higher risk areas.
There is a supply chain focus to reduce inventory volumes.
R PROBABILITY
R FINANCIAL IMPACT
R BUSINESS IMPACT
All the Group’s IT development, hardware and software, must be specifi cally approved and then monitored by the Group’s TIP Forum, representing all the Divisions’ IT Executives, MIAS and, where appropriate, the external service providers. Divisional Boards must sign off all IT developments. MIAS has signifi cant IT expertise and independently assesses all IT developments and is part of the ‘go-live’ decision on any project. External Auditors review the IT general control environment in the major Divisions on an agreed rotation basis.
R PROBABILITY
R FINANCIAL IMPACT
R BUSINESS IMPACT
Careful pre-selection of countries for new stores, with a thorough evaluation of customs, tax, exchange control and business legislation. Regular repatriation of cash.
Although there is a natural economic hedge in place because our SA operations supply the African stores, IFRS accounting standards have broken this hedge, resulting in increased volatility of reported foreign currency movements. Dedicated Executives across several functions monitor and manage the African operations.
Keep supply chain as short as practical.
Develop relationships with key government and regulatory authorities in those countries.
R PROBABILITY
R FINANCIAL IMPACT
R BUSINESS IMPACT
Maintain a relevant and competitive product offering that offers affordable value to our customers. Invest in brand awareness and loyalty.
Manage low-cost effi cient operations.
Ensure suppliers believe that our stores and associated supply chain offer an ideal route to market.
Optimise our store locations, and ensure regular store refurbishments and format renewal.
LOW
LOW
LOW
LOW
LOW
MEDIUM
MEDIUM
MEDIUM
MEDIUM
MEDIUM
MEDIUM
MEDIUM
HIGH
HIGH
HIGH
79Massmart Integrated Annual Report December 2012
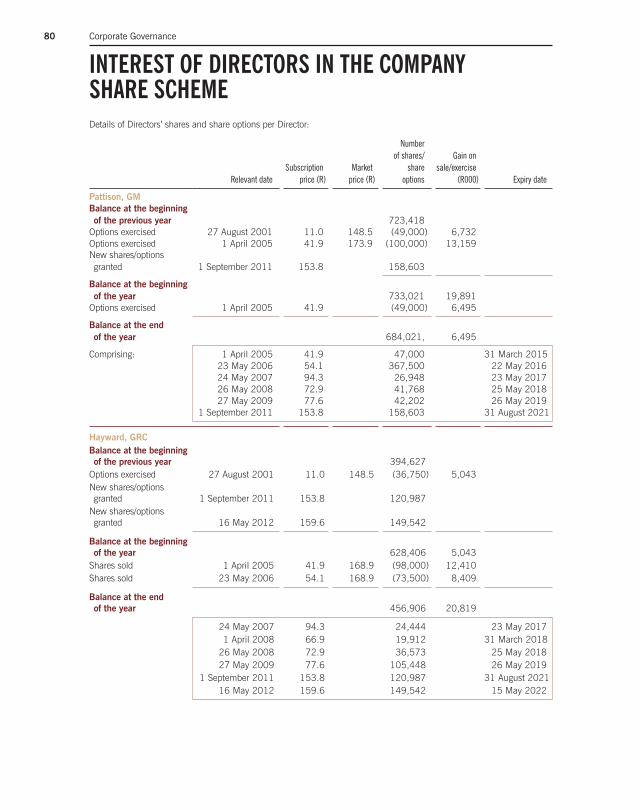
INTEREST OF DIRECTORS IN THE COMPANY SHARE SCHEMEDetails of Directors’ shares and share options per Director:
Relevant date Subscription
price (R)Market
price (R)
Number of shares/
share options
Gain on sale/exercise
(R000) Expiry date
Pattison, GM Balance at the beginning
of the previous year 723,418 Options exercised 27 August 2001 11.0 148.5 (49,000) 6,732 Options exercised 1 April 2005 41.9 173.9 (100,000) 13,159 New shares/options granted 1 September 2011 153.8 158,603
Balance at the beginning
of the year 733,021 19,891 Options exercised 1 April 2005 41.9 (49,000) 6,495
Balance at the end
of the year 684,021, 6,495
Comprising: 1 April 2005 41.9 47,000 31 March 2015 23 May 2006 54.1 367,500 22 May 2016 24 May 2007 94.3 26,948 23 May 2017 26 May 2008 72.9 41,768 25 May 2018 27 May 2009 77.6 42,202 26 May 2019 1 September 2011 153.8 158,603 31 August 2021
Hayward, GRC Balance at the beginning
of the previous year 394,627 Options exercised 27 August 2001 11.0 148.5 (36,750) 5,043 New shares/options granted 1 September 2011 153.8 120,987 New shares/options granted 16 May 2012 159.6 149,542
Balance at the beginning
of the year 628,406 5,043 Shares sold 1 April 2005 41.9 168.9 (98,000) 12,410 Shares sold 23 May 2006 54.1 168.9 (73,500) 8,409
Balance at the end
of the year 456,906 20,819
24 May 2007 94.3 24,444 23 May 2017 1 April 2008 66.9 19,912 31 March 2018 26 May 2008 72.9 36,573 25 May 2018 27 May 2009 77.6 105,448 26 May 2019 1 September 2011 153.8 120,987 31 August 2021 16 May 2012 159.6 149,542 15 May 2022
80 Corporate Governance

Relevant date Subscription
price (R)Market
price (R)
Number of shares/
share options
Gain on sale/exercise
(R000) Expiry date
Zwarenstein, I Balance on date
appointed as Executive
Director 110,983 New shares/options granted 16 May 2012 159.6 91,676
Balance at the beginning
of the year 202,659 Options exercised 1 April 2008 66.9 172.4 (5,484) 576 Options exercised 26 May 2008 72.9 172.4 (10,840) 1,075 Options exercised 27 May 2009 77.6 172.4 (3,676) 347
Balance at the end
of the year 182,659 1,998
Comprising: 1 April 2008 66.9 2,742 31 March 2018 26 May 2008 72.9 13,271 25 May 2018 27 May 2009 77.6 11,029 26 May 2019 1 September 2011 153.8 63,941 31 August 2021 16 May 2012 159.6 91,676 15 May 2022
R Shares and options at reporting date can be found in the Directors’ report on page 35.
81Massmart Integrated Annual Report December 2012

Services as
Directors of
Massmart Holdings Limited
Salary and
allowances
Bonuses and
perfor-mance related
payments1
Other benefi ts
Retirement and
related benefi ts
Otherwise in
connection with the
affairs of Massmart
Holdings Limited Subtotal
Fringe benefi t of interest-
free loans used
to fi nance shares2
Gains on exercise of
share options and on shares
purchased by
Directors TotalR000 R000 R000 R000 R000 R000 R000 R000 R000 R000
For the 26 week year
ended December 2012 Executive Directors Pattison, GM – 2,085 – 325 219 – 2,629 751 6,495 9,875Hayward, GRC – 1,728 – 262 182 – 2,172 490 20,819 23,481Zwarenstein, I – 1,187 – 6 111 – 1,304 2 1,998 3,304
– 5,000 – 593 512 – 6,105 1,243 29,312 36,660
Non-executive Directors Lamberti, MJ 505 – – – – – 505 – – 505Seabrooke, CS 460 – – – – – 460 – – 460Cheesewright, D3 – – – – – – – – – –Davis, JA – – – – – – – – – –Gwagwa, NN 183 – – – – – 183 – – 183Langeni, P 296 – – – – – 296 – – 296Suarez, JP – – – – – – – – – –
1,444 – – – – – 1,444 – – 1,444
Prescribed Offi cers Prescribed Offi cer A – – – – – – 6,099 243 4,524 10,866Prescribed Offi cer B – – – – – – 3,420 4 4,665 8,089Prescribed Offi cer C – – – – – – 1,892 314 5,566 7,772Prescribed Offi cer D – – – – – – 1,523 4 4,801 6,328Prescribed Offi cer E – – – – – – 5,218 – – 5,218Prescribed Offi cer F – – – – – – 3,400 – 39 3,439Prescribed Offi cer G – – – – – – 1,000 120 1,850 2,970Prescribed Offi cer H – – – – – – 2,152 – 452 2,604Prescribed Offi cer I – – – – – – 1,139 39 1,390 2,568Prescribed Offi cer J – – – – – – 1,607 148 – 1,755Prescribed Offi cer K – – – – – – 1,597 – – 1,597Prescribed Offi cer L – – – – – – 1,115 – – 1,115Prescribed Offi cer M – – – – – – 1,030 38 – 1,068Prescribed Offi cer N – – – – – – 451 87 – 538
– – – – – – 31,643 997 23,287 55,927
Total 1,444 5,000 – 593 512 – 39,192 2,240 52,599 94,031
1. In order to match incentive awards with the performance to which they relate, bonuses above refl ect the amounts accrued in respect
of each year and not amounts paid in that year2. Held in terms of the rules of the Company’s share scheme3. Appointed 20 August 2012
DIRECTORS’ EMOLUMENTS82 Corporate Governance

Services as
Directors of
Massmart Holdings Limited
Salary and
allowances
Bonuses and
perfor-mance related
payments1
Other benefi ts
Retirement and
related benefi ts
Otherwise in
connection with the
affairs of Massmart
Holdings Limited Subtotal
Fringe benefi t of interest-
free loans
used to fi nance shares2
Gains on exercise of
share options and on shares
purchased by
Directors TotalR000 R000 R000 R000 R000 R000 R000 R000 R000 R000
For the 52 week year
ended June 2012
Executive Directors Pattison, GM – 3,899 – 828 409 – 5,136 1,654 19,891 26,681Hayward, GRC – 2,995 – 522 314 – 3,831 1,329 5,043 10,203Zwarenstein, I3 – 366 – 2 35 – 403 – – 403
– 7,260 – 1,352 758 – 9,370 2,983 24,934 37,287
Non-executive Directors
Lamberti, MJ 976 – – – – – 976 – – 976Seabrooke, CS 891 – – – – – 891 – – 891Davis, JA – – – – – – – – – –Gwagwa, NN 354 – – – – – 354 – – 354Langeni, P 574 – – – – – 574 – – 574McMillon, CD4 – – – – – – – – – –Suarez, JP – – – – – – – – – –
2,795 – – – – – 2,795 – – 2,795
Prescribed Offi cers
Prescribed Offi cer A – – – – – – 5,051 581 1,314 6,946Prescribed Offi cer B – – – – – – 4,406 9 7,890 12,305Prescribed Offi cer C – – – – – – 3,837 673 – 4,510Prescribed Offi cer D – – – – – – 2,822 – – 2,822Prescribed Offi cer F – – – – – – 5,900 – 165 6,065Prescribed Offi cer G – – – – – – 2,147 258 – 2,405Prescribed Offi cer H – – – – – – 6,346 – 854 7,200Prescribed Offi cer I – – – – – – 2,279 134 4,527 6,940Prescribed Offi cer J – – – – – – 3,195 321 – 3,516Prescribed Offi cer K – – – – – – 1,945 – – 1,945Prescribed Offi cer L – – – – – – 5,346 – – 5,346Prescribed Offi cer M – – – – – – 2,107 100 7,346 9,553Prescribed Offi cer N – – – – – – 2,547 621 5,031 8,199Prescribed Offi cer O – – – – – – 2,035 1 2,000 4,036
– – – – – – 49,963 2,698 29,127 81,788
Total 2,795 7,260 – 1,352 758 – 62,128 5,681 54,061 121,870
1. In order to match incentive awards with the performance to which they relate, bonuses above refl ect the amounts accrued in respect
of each year and not amounts paid in that year2. Held in terms of the rules of the Company’s share scheme3. Appointed 7 May 20124. Resigned 20 August 2012
83Massmart Integrated Annual Report December 2012

DIRECTORS’ EMOLUMENTS CONTINUED
The comments below provide further background and context to the fi gures disclosed in this note, Directors’ emoluments, and Interests of Directors in the Company’s Share Scheme (note 35).
GM PattisonFollowing a third party Executive remuneration analysis which assessed positions of similar stature and complexity, the Nomination and Remuneration Committee awarded Grant a 7.0% increase to his salary and allowances for the December 2012 fi nancial year, from R3.90 million for the 52 weeks to R2.09 million for the 26 weeks. Grant did not receive a bonus for this fi nancial year.
During the 26 weeks ended 23 December 2012, Grant converted and sold 49,000 Massmart options, realising a pre-tax gain on exercise of share options of R6.5 million.
Through the Share Scheme, Grant holds 684,021 Massmart shares and options of which 42,202 shares and 158,603 options are held in the Pattison Family Trust, of which Grant is a benefi ciary. The average length of time that he has held these is 5.1 years and the average strike price is R80.58 per share. The Pattison Family Trust also directly owns 218,055 Massmart shares.
GRC HaywardFollowing a third party Executive remuneration analysis which assessed positions of similar stature and complexity, the Nomination and Remuneration Committee awarded Guy a 6.3% increase to his salary and allowances for the December 2012 fi nancial year, from R3.00 million for the 52 weeks to R1.73 million for the 26 weeks. Guy did not receive a bonus for this fi nancial year.
During the 26 weeks ended 23 December 2012, Guy sold 171,500 Massmart shares, realising a pre-tax gain on sale of shares of R20.8 million.
Through the Share Scheme, Guy holds 456,906 Massmart shares and options of which 19,912 shares are held in the Bluett-Hayward Trust, of which Guy is a benefi ciary. The average length of time that he has held these is 2.24 years and the average strike price is R124.67 per share. Guy also owns 36,517 Massmart shares directly.
I ZwarensteinIlan was appointed to the Board on 7 May 2012. His salary and allowances for the June 2012 fi nancial year, as refl ected in the Directors’ emoluments table (note 34), are representative of his salary and allowances during his time in this role. Following a third party Executive remuneration analysis which assessed positions of similar stature and complexity, the Nomination and Remuneration Committee awarded Ilan a 8.1% increase to his salary and allowances for the December 2012 fi nancial year, from R1.91 million for the 52 weeks to R1.19 million for the 26 weeks. Ilan did not receive a bonus for this fi nancial year.
During the 26 weeks ended 23 December 2012, Ilan converted and sold 20,000 Massmart options, realising a pre-tax gain on exercise of share options of R2.0 million.
Through the Share Scheme, Ilan holds 182,659 options. The average length of time that he has held these is 1.38 years and the average strike price is R144.95 per share.
84 Corporate Governance

INVESTOR RELATIONS
We strive to provide useful and frequent disclosure to our shareholders, regardless of how uncomfortable this may be in periods of diffi culty or underperformance.
Massmart reports formally to shareholders twice a year (in February and August) when its full-year and half-year results, together with a thorough Executive overview, are announced and issued to shareholders and the media. On both occasions the CEO, COO, FD and certain Group Executives give presentations to institutional investors, analysts and the media.
Early in January and July, shortly after the conclusion of the full-year and half-year trading periods, on release of the Integrated Annual Report and at the Group’s annual general meeting in May, Massmart releases sales updates reporting on the Group’s year-to-date sales performance. In addition, annually in May, the CEO, COO and FD host a day-long visit by institutional analysts and investors to Massmart stores. A sales update is released along with this visit.
During the year, apart from closed periods, the CEO, COO and FD together meet regularly with institutional shareholders and, in addition, are available for meetings or conference calls with analysts and any existing or prospective Massmart shareholder.
Company Secretary
P Sigsworth, CA(SA)
Contact details
Registered offi ce
Massmart House16 Peltier DriveSunninghill Ext 6Sandton2191South Africa
Postal address
Private Bag X4Sunninghill2157South Africa
Telephone number
+ 27 (0) 11 517 0000
Facsimile number
+ 27 (0) 11 517 0020
Website
www.massmart.co.za
Indicators
Company registration number
1940/014066/06 (incorporated in South Africa)
JSE share code
MSM
ISIN
ZAE000152617
Design partners
Publisher integrated annual report
Ince
Design
Studio Shelf
Photographer
Gareth Gilmour
Corporate partners
Transfer secretaries
Computershare Investor Services (Pty) Limited70 Marshall StreetJohannesburg2001
Principal bankers
ABSA Bank LimitedFirst National Bank (A division of FirstRand Bank Limited) Investec Bank LimitedNedbank Group Limited The Standard Bank of South Africa Limited
Auditors
Ernst & Young Inc.
Corporate law advisors
Cliffe Dekker HofmeyrEdward Nathan Sonnenbergs
Lead sponsor
Deutsche Securities
85Massmart Integrated Annual Report December 2012

SHAREHOLDER ANALYSIS
Number % Number
of shares %
Custodians and managers holding 3% or more The following custodians and managers held benefi cially, directly or indirectly, more than 3% of the Company's shares: Aberdeen Asset Management Group 29,194,402 13.5 Public Investment Corporation 12,493,541 5.8 J.P. Morgan Asset Management 9,437,919 4.4 Baillie Gifford & Co Ltd 8,974,970 4.1
The following analysis of shareholders was extracted from the shareholders register as at December 2012:
NUMBER %
1 - 1,000 shares 5,285
720
163
48
20
6,236
84.7
11.5
2.6
0.8
0.4
10,001 - 100,000 shares
1,001 - 10,000 shares
100,001 - 1,000,000 shares
1,000,001 and over
NUMBER OF SHARES %
1,234,732
2,170,672
4,894,586
15,895,477
192,714,728
0.6
1.0
2.3
7.3
88.8
100.0 216,910,195 100.0NUMBER OF SHARES(%)
Shareholder spread
NUMBER %
Walmart subsidiary: Main Street 830 (Pty) Ltd 1
88
85
42
17
6,236
-
1.4
1.4
0.7
0.3
Pension Funds
Unit Trusts/Mutual Fund
Other Managed Funds
Sovereign Wealth
NUMBER OF SHARES %
113,859,293
41,753,805
24,683,070
18,089,519
6,130,374
52.5
19.2
11.4
8.3
2.8
Private Investors 21
13
9
5
2
0.3
0.2
0.1
0.1
-
Charity
Custodians
Insurance Companies
Exchange-Traded Fund Total
3,608,507
3,797,887
1,210,917
649,734
939,246
1.7
1.8
0.6
0.3
0.4
1 -BEE 145,703 0.1
100.0 216,910,195 100.0
3
2
-
-
Investment Trust
Local Authority
243,399
64,238
0.1
-
5,947 95.5Remainder 1,734,503 0.8
NUMBER OF SHARES(%)
Distribution of shareholders
NUMBER OF SHARES(%)
NUMBER %
Walmart subsidiary: Main Street 830 (Pty) Ltd 1
4
1
6,230
6,236
-
0.1
-
99.9
Share trusts
Directors and Group Executives of the Company
Public shareholders
Non-public shareholders:
NUMBER OF SHARES %
113,859,293
938,967
30,510
102,081,425
52.5
0.4
-
47.1
100.0 216,910,195 100.0
Public/non-public shareholders
86 Corporate Governance

CONTENTS R NOTICE OF ANNUAL GENERAL MEETING 88
R SUMMARY OF THE PRINCIPLE TERMS
OF THE MASSMART HOLDINGS LIMITED
2013 SHARE PLAN 96
R FORM OF PROXY 99
SHAREHOLDER INFORMATION
CAMBRIDGE FOOD, BARAGWANETH HOTEL, SOWETO
JUMBO, CROWN MINES

NOTICE OF ANNUAL GENERAL MEETINGfor the year ended 23 December 2012
Notice is hereby given that the annual general meeting of holders of all classes of
shares of the Company will be held at 09h00 at Massmart House, 16 Peltier Drive,
Sunninghill Ext 6, Sandton, on Wednesday, 22 May 2013, for purposes of:
1. Transacting the following business:
1.1 to present the audited annual fi nancial statements of the Company and
its subsidiaries (Group) for the year ended 23 December 2012, and the
associated Directors’ report and External Auditor’s report, the Audit and
Risk Committee report and the Social and Ethics Committee report;
1.2 to elect Directors in the place of those retiring in accordance with the
Company’s Memorandum of Incorporation; and
1.3 such other business as may be transacted at an annual general meeting.
2. Considering and, if deemed fi t, passing, with or without modifi cation, the below
mentioned ordinary and special resolutions.
The Board of Directors of the Company has determined, in accordance with section 59
of the Companies Act, 71 of 2008, as amended (Act), that the record date for
shareholders to be recorded as shareholders in the securities register of the Company
in order to: (i) be entitled to receive this notice of annual general meeting is Friday,
12 April 2013; and (ii) be entitled to attend, participate and vote at the annual
general meeting is Friday, 17 May 2013. The last date to trade to be entitled to
attend, participate and vote at the annual general meeting is Friday, 10 May 2013.
Ordinary businessThe audited annual fi nancial statements of the Company and the Group (as approved
by the Directors of the Company), including the Directors’ report and External
Auditors Report, the Audit and Risk Committee report and the Social and Ethics
Committee report for the year ended 23 December 2012, circulated together with
this notice, are presented to the shareholders for their consideration.
The complete audited annual fi nancial statements for the year ended 23 December
2012 are available on the web: http://www.massmart.co.za/invest_profi le/
financial_results/2013/massmart_ar2013/financials/group/approval_afs.asp
The complete audited fi nancial statements for the year ended 24 June 2012 can be
found on the Company’s website: www.massmart.co.za
Ordinary resolutionsOrdinary Resolution Number 1
“Resolved that Mr MJ Lamberti, who retires by rotation and has offered himself for
re-election, be and is hereby re-elected to the Board of Directors of the Company.”
In terms of the Act, more than 50% of the voting rights exercised on this resolution
must be cast in favour of ordinary resolution number 1 for it to be adopted.
READ MORE: PAGES 19 – 21MASSMART AT A GLANCE
Biographical details of directors.
INSIGHTINITIAL APPOINTMENT DATES OF DIRECTORS STANDING FOR RE-ELECTION:MJ Lamberti 30 August 1990P Langeni 25 August 2004GM Pattison 7 December 2004JP Suarez 20 June 2011
REFER TO WEBCORPORATE GOVERNANCE
Further details relating to the directors.http://www.massmart.co.za/invest_profi le/fi nancial_results/2013/massmart_ar2013/governance/king_iii.asp
88 Shareholder Information

Ordinary Resolution Number 2
“Resolved that Ms. P Langeni, who retires by rotation and has offered herself for re-election, be and is hereby re-elected
to the Board of Directors of the Company.”
In terms of the Act, more than 50% of the voting rights exercised on this resolution must be cast in favour of ordinary
resolution number 2 for it to be adopted.
Ordinary Resolution Number 3
“Resolved that Mr GM Pattison, who retires by rotation and has offered himself for re-election, be and is hereby re-elected
to the Board of Directors of the Company.”
In terms of the Act, more than 50% of the voting rights exercised on this resolution must be cast in favour of ordinary
resolution number 3 for it to be adopted.
Ordinary Resolution Number 4
“Resolved that Mr JP Suarez, who retires by rotation and has offered himself for re-election, be and is hereby re-elected
to the Board of Directors of the Company.”
In terms of the Act, more than 50% of the voting rights exercised on this resolution must be cast in favour of ordinary
resolution number 4 for it to be adopted.
Ordinary Resolution Number 5
“Resolved that Ernst & Young Inc. (with Mr Allister Carshagen as the Audit Partner) be and is hereby elected as the
Company’s auditors for the ensuing fi nancial year to hold offi ce until the Company’s next annual general meeting,
as approved by the Audit and Risk Committee and recommended to shareholders.”
In terms of the Act, more than 50% of the voting rights exercised on this resolution must be cast in favour of ordinary
resolution number 5 for it to be adopted.
Ordinary Resolution Number 6
“Resolved that the following persons be and are hereby appointed, each by way of a separate vote, as members of the Audit
and Risk Committee:
6.1 CS Seabrooke (Chairman)
6.2 NN Gwagwa
6.3 MJ Lamberti*
6.4 P Langeni.**”
* Subject to his re-election as a director pursuant to ordinary resolution number 1
** Subject to her re-election as a director pursuant to ordinary resolution number 2
In terms of the Act, more than 50% of the voting rights exercised on each of these resolutions must be cast in favour of each
of ordinary resolutions numbers 6.1, 6.2, 6.3 and 6.4 for it to be adopted.
89Massmart Integrated Annual Report December 2012

NOTICE OF ANNUAL GENERAL MEETING CONTINUEDfor the year ended 23 December 2012
Ordinary Resolution Number 7
“Resolved that, subject to the JSE Limited Listings Requirements (JSE Listings Requirements), the directors be and are
hereby authorised to issue the ordinary shares in the authorised but unissued shares of the Company (or to issue options
or convertible securities convertible into ordinary shares) for cash to such person or persons on such terms and conditions
as they may deem fi t, subject to the following:
7.1 the securities shall be of a class already in issue, or convertible into a class already in issue;
7.2 the securities shall be issued to public shareholders (as defi ned in the JSE Listings Requirements) and not to related
parties (as defi ned in the JSE Listings Requirements);
7.3 the issues of securities in the aggregate under the authority of this resolution in any one fi nancial year shall not
exceed 5% of the number of securities of that class already in issue (determined in accordance with the relevant
provisions of the JSE Listings Requirements);
7.4 the maximum discount at which the shares may be issued shall be 10% of the weighted average traded price of
the shares of the Company over the 30 business days prior to the date that the price of the issue is agreed between
the Company and the party subscribing for the shares;
7.5 the authority hereby granted will be valid until the Company’s next annual general meeting, provided that it will not
extend to beyond 15 months from the date of this resolution; and
7.6 once shares representing, on a cumulative basis within a fi nancial year, 5% or more of the Company’s issued
ordinary and/or preference shares prior to that issue, have been issued, the Company shall publish an announcement
in accordance with paragraph 11.22 of the JSE Listings Requirements.”
Pursuant to the JSE Listings Requirements, the Company will only be entitled to implement this general authority to allot and issue ordinary shares for cash if this ordinary resolution number 7 is passed by a majority of 75% or more of the votes cast by all shareholders present or represented by proxy at the annual general meeting, excluding any votes cast by the Massmart Holdings Limited Employee Share Trust.
Ordinary Resolution Number 8
“Resolved that, in terms of Schedule 14 of the JSE Listings Requirements, the Company hereby adopts the rules of the
Massmart Holdings Limited 2013 Share Plan.”
The rules of the Massmart Holdings Limited 2013 Share Plan (Share Plan) will be tabled at this annual general meeting
and initialled by the Chairman for identifi cation. A summary of the principal terms of which are set out in the schedule
headed “Summary of the Principal Terms of the Massmart Holdings Limited 2013 Share Plan” annexed to this notice of
annual general meeting.
Pursuant to the JSE Listings Requirements, the Company will only be entitled to adopt the Share Plan if this ordinary
resolution number 8 is passed by a majority of 75% or more of the votes cast by all shareholders present or represented
by proxy at the annual general meeting, In compliance with paragraphs 14.6 and 14.7 of Schedule 14 of the JSE Listings
Requirements, a summary of the principal terms of the Share Plan has been circulated together with this notice of annual
general meeting and the complete Share Plan will be made available for inspection by shareholders during normal business
hours at the registered offi ce of the Company for a period of not less than 14 days prior to the annual general meeting.
90 Shareholder Information

Special resolutionsSpecial Resolution Number 1
“Resolved, as a special resolution, that the Company and/or its subsidiaries
be and are hereby authorised to generally repurchase the ordinary and/
or preference shares in the issued shares of the Company from such
shareholder/s, at such price, in such manner and subject to such terms and
conditions as the directors may deem fi t, but subject to the Memorandum of
Incorporation of the Company, the Act and the JSE Listings Requirements,
and provided that:
1.1 the authority hereby granted will be valid until the Company’s next
annual general meeting, or for 15 months from the date of this
special resolution, whichever period is shorter;
1.2 repurchases may not be made at a price greater than 10% above
the weighted average of the market value for the shares determined
over the fi ve business days immediately preceding the date that the
repurchase is effected (or, if no shares of the Company have been
traded in that period, subject to a ruling by the JSE);
1.3 repurchases in the aggregate in any one fi nancial year shall not
exceed 15% of that class of the Company’s issued shares;
1.4 the repurchase of shares will be effected through the order book
operated by the JSE trading system and will be done without any
prior understanding or arrangement between the Company and the
counterparty;
1.5 the Company may only appoint one agent, at any point in time,
to effect the repurchases on the Company’s behalf;
1.6 neither the Company nor its subsidiaries may repurchase
shares during a prohibited period (as defi ned in the JSE Listings
Requirements) unless a repurchase programme is in place where
the dates and quantities of shares to be traded during the relevant
period are fi xed (not subject to any variation) and where full details
of the programme have been disclosed in an announcement over
the Stock Exchange News Service prior to the commencement of the
prohibited period;
1.7 an announcement complying with paragraph 11.27 of the JSE
Listings Requirements will be published by the Company when the
Company and/or its subsidiaries have cumulatively repurchased 3%
of the Company’s initial number of issued ordinary and/or preference
shares and for each 3% in aggregate thereafter; and
1.8 a resolution by the Board of Directors that it authorises such
repurchase, that the Company and its subsidiaries have passed the
solvency and liquidity test as set out in section 4 of the Act and that,
since the application by the Board of Directors of the solvency and
liquidity test, there have been no material changes to the fi nancial
position of the Group, has been passed.”
INSIGHTBUYBACKS IN THE 26 WEEKS ENDED 23 DECEMBER 2012
DateNo of
sharesShare
price (R)
Totaltransaction value (Rm)
22 Aug 12 100,000 169.49 17.03
04 Sep 12 10,280 169.67 1.75
05 Sep 12 39,720 169.84 6.78
20 Sep 12 50,000 168.79 8.48
08 Oct 12 50,000 165.71 8.33
23 Oct 12 50,000 173.80 8.73
24 Oct 12 18,698 173.99 3.27
29 Oct 12 50,000 172.59 8.67
05 Nov 12 48,010 177.19 8.55
06 Nov 12 39,420 177.50 7.03
09 Nov 12 42,153 177.50 7.52
14 Nov 12 23,390 176.71 4.15
15 Nov 12 75,251 176.42 13.34
16 Nov 12 61,658 177.19 10.98
21 Nov 12 13,141 177.50 2.34
22 Nov 12 4,392 177.90 0.79
23 Nov 12 35,000 177.95 6.26
29 Nov 12 2,850 178.26 0.51
124.51
91Massmart Integrated Annual Report December 2012

NOTICE OF ANNUAL GENERAL MEETING CONTINUEDfor the year ended 23 December 2012
Statement by the Board of directors
In accordance with the JSE Listings Requirements, the Directors state that:
(a) the intention of the Directors is to utilise the authority given under special resolution number 1 at a future date,
provided that the cash resources of the Company are in excess of its requirements. In this regard, the Directors will
take into account, inter alia, an appropriate capitalisation structure for the Company and the long-term cash needs of
the Company, and will ensure that any such utilisation is in the interests of the shareholders;
(b) having considered the effect of the maximum number of ordinary and preference shares that may be acquired
pursuant to the authority given under special resolution number 1:
R the Company and the Group will in the ordinary course of business be able to pay its debts for a period of
12 months after the date of this notice of annual general meeting;
R the assets of the Company and the Group will be in excess of the liabilities of the Company and the Group for
a period of 12 months after the date of this notice of annual general meeting, such assets and liabilities being
recognised and measured in accordance with International Financial Reporting Standards and in accordance with
the accounting policies used in the annual fi nancial statements of the Company and the Group for the year ended
23 December 2012;
R the issued share capital and reserves of the Company and the Group will be adequate for ordinary business
purposes for a period of 12 months after the date of this notice of annual general meeting; and
R the working capital available to the Company and the Group will be adequate for ordinary business purposes for a
period of 12 months after the date of this notice of annual general meeting.
The Company will ensure that its sponsor provides the necessary sponsor letter on the adequacy of the working capital in
terms of the JSE Listings Requirements, prior to the commencement of any repurchase of the Company shares under the
authority given in terms of special resolution number 1.
The following additional information, which appears in the integrated annual report of which this notice forms part, is
provided in terms of the JSE Listings Requirements for purposes of special resolution number 1:
R directors and management – pages 19 to 24;
R major shareholders – page 86;
R material changes – pages 35 and 36;
R directors’ interests in shares – pages 34 and 35;
R share capital of the Company – page 33;
R responsibility statement – page 33; and
R litigation – page 36.
The Directors, whose names are set out on pages 19 to 21 of the integrated annual report, collectively and individually,
accept responsibility for the accuracy of information contained in this statement and certify that, to the best of their
knowledge and belief, there are no other facts, the omission of which would make any statement false or misleading and
that they have made all reasonable enquiries in this regard.
Other than the facts and developments reported in the integrated annual report, to which this notice of annual general
meeting is attached, there have been no material changes in the fi nancial or trading position of the Company and its
subsidiaries since the publication of the audited fi nancial statements for the year ended 23 December 2012.
In terms of the Act, at least 75% of the voting rights exercised on this resolution must be cast in favour of special resolution
number 1 for it to be adopted.
92 Shareholder Information

Special Resolution Number 2
“Resolved, as a special resolution, that the following Directors’ remuneration (payable to the applicable Directors for services
to be rendered by them in their capacities as such), be and is hereby approved, each by way of a separate vote, for the
period commencing on 23 May 2013 to the date on which the Company’s annual general meeting in respect of its fi nancial
year ending December 2013 will be held:
2.1 Chairman of the Board R822,000
2.2 Deputy Chairman R590,000
2.3 Directors R244,000
2.4 Committee Chairmen R238,000
2.5 Committee Members R113,000"
In terms of the Act, at least 75% of the voting rights exercised on each of these resolutions must be cast in favour of special
resolutions numbers 2.1, 2.2, 2.3, 2.4 and 2.5 for it to be adopted.
Special Resolution Number 3
"Resolved, as a special resolution, to the extent required in terms of, and subject to the provisions of, section 45 of the Act,
that the shareholders hereby approve of the Company providing, at any time and from time to time during the period of
two years commencing on the date of this special resolution, any direct or indirect fi nancial assistance as contemplated in
such section of the Act to any one or more related or inter-related companies or corporations (as defi ned in the Act) of the
Company and/or to any one or more members of any such related or inter-related company or corporation and/or to any
one or more persons related to any such company or corporation, on such terms and conditions as the Board of Directors of
the Company, or any one or more persons authorised by the Board of Directors of the Company from time to time for such
purpose, deems fi t, provided that any such fi nancial assistance shall not in the aggregate exceed an amount of R12 billion
in any fi nancial year."
In terms of the Act, at least 75% of the voting rights exercised on this resolution must be cast in favour of special resolution
number 3 for it to be adopted.
The following direct and/or indirect fi nancial assistance was provided by the Company to related and/or inter-related
companies and/or corporations of the Company in respect of the fi nancial year ended 23 December 2012:
Rbn
Cross-Suretyships in respect of banking facilities 5.9Promissory Notes in respect of operating leases 0.2 Loans to subsidiary companies 1.1
Total 7.2
It is anticipated that such fi nancial assistance will increase during the period of two years commencing on the date of special
resolution number 3, mainly as a result of the Group’s expansion and acquisition plans but that the total fi nancial assistance
after such anticipated increase will not exceed R12 billion in any fi nancial year.
In the event that the Company provides fi nancial assistance to its subsidiary companies in the form of loans, the Company’s
solvency and liquidity will not be impaired as the Company will raise an asset in its books for the equivalent amount then
due by that subsidiary.
93Massmart Integrated Annual Report December 2012

NOTICE OF ANNUAL GENERAL MEETING CONTINUEDfor the year ended 23 December 2012
Notice to shareholders of the Company in terms of section 45(5) of the Act of a resolution adopted by the Board
authorising the Company to provide direct or indirect fi nancial assistance:
By the time this notice of annual general meeting is delivered to shareholders, the Board of Directors will have adopted a resolution (Section 45 Board Resolution) authorising the Company to provide, at any time and from time to time during the period of two years commencing on the date on which special resolution number 3 is adopted, any direct or indirect fi nancial assistance as contemplated in section 45 of the Act to any one or more related or inter-related companies or corporations of the Company and/or to any one or more members of any such related or inter-related company or corporation and/or to any one or more persons related to any such company or corporation, provided that any such fi nancial assistance shall not in the aggregate exceed an amount of R12 billion in any fi nancial year.
The Section 45 Board Resolution will be effective only if and to the extent that special resolution number 3 is adopted by the shareholders, and the provision of any such direct or indirect fi nancial assistance by the Company, pursuant to such resolution, will always be subject to the Board of Directors being satisfi ed that: (i) immediately after providing such fi nancial assistance, the Company will satisfy the solvency and liquidity test as referred to in section 45(3)(b)(i) of the Act, and that (ii) the terms under which such fi nancial assistance is to be given are fair and reasonable to the Company as referred to in section 45(3)(b)(ii) of the Act.
In as much as the Section 45 Board Resolution contemplates that such fi nancial assistance will in the aggregate exceed one-tenth of one percent of the Company's net worth at the date of adoption of such resolution, the Company hereby provides notice of the Section 45 Board Resolution to shareholders. Such notice will also be provided to any trade union representing any employees of the Company.
GeneralIdentifi cation, voting and proxies
Shareholders are entitled to attend, speak and vote at the annual general meeting.
In terms of section 63(1) of the Act, any person attending or participating in the annual general meeting must present
reasonably satisfactory identifi cation and the person presiding at the annual general meeting must be reasonably
satisfi ed that the right of any person to participate in and vote (whether as a shareholder or as proxy for a shareholder)
has been reasonably verifi ed. Forms of identifi cation include valid identity documents, driver’s licences or passports.
Shareholders holding dematerialised shares, but not in their own name, must furnish their Central Securities Depository Participant (CSDP) or broker with their instructions for voting at the annual general meeting. If your CSDP or broker, as the case may be, does not obtain instructions from you, it will be obliged to act in accordance with your mandate furnished to it, or if the mandate is silent in this regard, complete the form of proxy attached.
Unless you advise your CSDP or broker, in terms of the agreement between you and your CSDP or broker by the cut-off time stipulated therein, that you wish to attend the annual general meeting or send a proxy to represent you at the annual general meeting, your CSDP or broker will assume that you do not wish to attend the annual general meeting or send a proxy.
If you wish to attend the annual general meeting or send a proxy, you must request your CSDP or broker to issue the necessary letter of authority to you. Shareholders holding dematerialised shares, and who are unable to attend the annual general meeting and wish to be represented thereat, must complete the form of proxy attached in accordance with the instructions therein and lodge it with or mail it to the transfer secretaries, Computershare Investor Services Proprietary Limited (Computershare).
A form of proxy (which is attached) must be dated and signed by the shareholder appointing a proxy and should be forwarded to reach Computershare by no later than 09h00 on Monday, 20 May 2013. Before a proxy exercises any rights of a shareholder at the annual general meeting, such form of proxy must be so delivered.
94 Shareholder Information

In compliance with the provisions of section 58(8)(b)(i) of the Act, a summary of the rights of a shareholder to be
represented by proxy, as set out in section 58 of the Act, is set out immediately hereunder:
R A shareholder entitled to attend and vote at the annual general meeting may appoint any individual (or two or more
individuals) as a proxy or as proxies to attend, participate in and vote at the annual general meeting in the place of
the shareholder. A proxy need not be a shareholder of the Company.
R A proxy appointment must be in writing, dated and signed by the shareholder appointing a proxy and, subject to the
rights of a shareholder to revoke such appointment (as set out below), remains valid only until the end of the annual
general meeting.
R A proxy may delegate the proxy's authority to act on behalf of a shareholder to another person, subject to any
restrictions set out in the instrument appointing the proxy.
R The appointment of a proxy is suspended at any time and to the extent that the shareholder who appointed such
proxy chooses to act directly and in person in the exercise of any rights as a shareholder.
R The appointment of a proxy is revocable by the shareholder in question cancelling it in writing, or making a
later inconsistent appointment of a proxy, and delivering a copy of the revocation instrument to the proxy and to
Computershare. The revocation of a proxy appointment constitutes a complete and fi nal cancellation of the proxy's
authority to act on behalf of the shareholder as of the later of: (i) the date stated in the revocation instrument, if any
and (ii) the date on which the revocation instrument is delivered to Computershare as required in the fi rst sentence
of this paragraph.
R If the instrument appointing the proxy or proxies has been delivered to Computershare, as long as that appointment
remains in effect, any notice that is required by the Act or the Company's Memorandum of Incorporation to be
delivered by the Company to the shareholder, must be delivered by the Company to: (i) the shareholder or (ii) the
proxy or proxies, if the shareholder has: (a) directed the Company to do so in writing and (b) paid any reasonable fee
charged by the Company for doing so.
R Attention is also drawn to the "Notes to the form of proxy".
R The completion of a form of proxy does not preclude any shareholder from attending the annual general meeting.
Shareholders may participate (but not vote) electronically in the annual general meeting. Shareholders wishing
to participate in the annual general meeting electronically should contact the Assistant Company Secretary on
[email protected] or +27 11 517 0000 not less than fi ve business days prior to the annual general meeting. Access to
the annual general meeting by way of electronic participation will be at the shareholder’s expense. Only persons physically
present at the annual general meeting or represented by a valid proxy shall be entitled to cast a vote on any matter put to
a vote of shareholders.
By order of the Board
Philip Sigsworth
Company Secretary
8 April 2013
95Massmart Integrated Annual Report December 2012

SUMMARY OF THE PRINCIPAL TERMS OF THE MASSMART HOLDINGS LIMITED 2013 SHARE PLAN (SHARE PLAN OR PLAN)
1. Introduction and rationaleThe purpose of a long-term share incentive plan is to attract, retain, motivate and reward executives and managers who are able to infl uence the performance of the Company and its subsidiaries on a basis which aligns their interests with those of the Company's shareholders. The Remuneration Committee commissioned reports by Deloitte, 21st Century Business & Pay Solutions and PricewaterhouseCoopers to review the appropriateness of the Company’s current long-term share incentive plan.
The various reports recommended to the Remuneration Committee that the current long-term share incentive plan be changed to be more in line with current market trends. The terms of the Share Plan detailed below will allow Massmart to remain competitive in annual and share based incentives, reward long term sustainable Company performance, act as a retention tool, and ensure that those participating in the Share Plan share a signifi cant level of personal risk with the Company’s shareholders. The Plan further provides for the inclusion of a number of performance conditions, designed to align the interests of participants with those of Massmart’s shareholders, and to reward Company and individual performance, more so than merely the performance of the economy or the retail sector in which the Company operates.
2. Summary of proposed principal terms of the Share PlanThe Plan
The Massmart Holdings Limited 2013 Share Plan, the terms of which are embodied in the Plan Rules, entails participation therein through either the restricted share method and/or the performance share method as determined by the Board of Directors in discussion with the Remuneration Committee.
Eligibility
Any person holding full-time salaried employment or offi ce, namely any executive (including any executive director), senior manager and/or key employee of any Group company (Employer Company) but excluding any non-executive director, as selected by the Board of Directors from time to time in its sole and absolute discretion, shall be eligible for participation in the Plan (Eligible Employee).
Grants and Awards of shares
The Board, at the direction of the Remuneration Committee, will offer to Eligible Employees participation in the Plan through a weighted combination of:R conditional grants of shares, which will vest in the participant no earlier than the third anniversary of the grant (Grants);R conditional awards of shares, which will vest in the participant no earlier than the third anniversary of the award date
to the extent that the relevant performance criteria imposed by the Board have been met (Awards).
Limitation
The maximum number of shares which may be acquired by: (i) participants under the Plan and any other Massmart share plan is not to exceed 39.5 million shares and (ii) any one participant in terms of the Plan and any other Massmart share plan is not to exceed 4 million shares. In the determination of the above limits, shares which have been acquired through the JSE and transferred to participants shall not be taken into account.
96 Shareholder Information

Settlement
As soon as reasonably possible after an Award or Grant has vested, the Company shall be entitled to settle the Award or Grant by either procuring that the relevant number of shares are acquired on the JSE and delivered to the participant, or by allotting and issuing new shares to the participant. It is the stated intention of the Company to acquire shares through the JSE rather than to issue new shares. Alternatively, in order to provide for future fl exibility, the Company or Employer Company is entitled to, in its sole and absolute discretion, make settlement through the payment of a cash bonus equal to fair market value of the relevant number of shares. The fair market value shall be determined by reference to the volume weighted average price of a share on the JSE over the 10 trading days immediately preceding the relevant vesting date.
Administration of the Plan
The Board is responsible for the operation and administration of the Plan through its Remuneration Committee, and has discretion to decide whether and on what basis the Plan shall be operated, which may include the delegation of the administration of the Plan to the compliance offi cer of the Plan or any third party appointed by the Board, but excluding any executive director of the Company. A trust will not be used to administer the Plan.
Annual accounts
The Board shall ensure that a summary appears in the annual fi nancial statements of the Company of, inter alia, the number of shares Granted or Awarded or settled to participants and the number of shares which may be utilised for the Plan at the beginning of the fi nancial year.
Shares
The Company shall at all times reserve and keep available, free from pre-emptive rights, out of its authorised but unissued share capital, such number of shares as may be required to enable the Company to fulfi l its obligations to deliver shares to participants, and shall ensure that shares may only be issued or purchased for purposes of the Plan once a participant (or group of participants) to whom Grants or Awards will be offered, has been formally identifi ed. This provision will however only be necessary in the unlikely event that the Company decides to settle shares from its authorised but unissued share capital.
Funding
Save for the tax liability arising pursuant to an Eligible Employee’s participation in the Plan, the costs associated with the implementation and administration of, and participation in, the Plan will be funded by the Company, and recovered from each Employer Company based on the number of participants who are employed by each Employer Company.
Termination of employment
Unless the Board determines otherwise, if a participant ceases to be employed by an Employer Company by reason of:R No Fault Termination prior to the vesting of a Grant, then the Grant shall vest on the date of termination of employment
and shall be settled to the participant as soon as practically possible after the date of termination of employment; orR Fault Termination prior to the vesting of a Grant, then such Grant shall be cancelled on the date of termination
of employment.
The manner in which a participant's Grant or Award is treated upon termination of employment is determined by reference to whether the participant’s employment was terminated by reason of No Fault Termination or Fault Termination.
97Massmart Integrated Annual Report December 2012

SUMMARY OF THE PRINCIPAL TERMS OF THE MASSMART HOLDINGS LIMITED 2013 SHARE PLAN CONTINUED
No Fault Termination is the termination of employment of a participant by the Employer Company by reason of:R death;R injury, disability or ill-health;R dismissal based on operational requirements as contemplated in the Labour Relations Act, 1995;R retirement;R the Employer Company ceasing to be a member of the Group; or R mutual agreement.
Fault Termination is the termination of employment of a participant by the Employer Company by reason of misconduct, poor performance or a resignation by the participant.
In the event that participant’s employment is terminated by virtue of:R No Fault Termination prior to the vesting of his Grant or Award, then the vesting of his Grant or Award will be accelerated
to the date on which his employment is terminated and: R all the shares in respect of which his Grant was made will be settled; R a pro rata portion of the shares in respect of which his Award was made will be settled, based on the extent to which
he has complied with the performance criteria and the number of days which he remained employed following the Award date; and
R Fault Termination prior to the vesting of his Grant or Award, the Grant or Award will be cancelled.
Voting and dividend rights
Prior to the settlement of a Grant or an Award, participants shall have no voting or dividend rights in respect of the shares in respect of which a Grant or an Award has been made.
Change of control
If an offer is made to shareholders or the Company or a scheme of arrangement is proposed between the Company and the shareholders which would result in a change of control of the Company, the Board of Directors will use its best endeavours to procure that the same or a similar offer is made or a scheme of arrangement is proposed, as the case may be, to all participants in respect of all existing Grants and Awards.
Alternatively, should control of the Company pass to a third party offeror (Offeror) as a result of an offer, an amalgamation or reconstruction or scheme of arrangement which makes provision for participants:R to receive shares in the Offeror or other company on terms which, in the opinion of the External Auditors, are not less
favourable than the settlement terms under the Plan, the participants will be obliged to accept such shares and the Grant and Award shall lapse;
R are granted similar rights based on an incentive scheme similar to the Plan in respect of shares in such Offeror or other company on terms which in the opinion of the External Auditors are not less favourable than the settlement terms under the Plan, they shall be deemed to have been granted such rights in terms of such new incentive scheme and the Grants or Awards shall lapse.
98 Shareholder Information
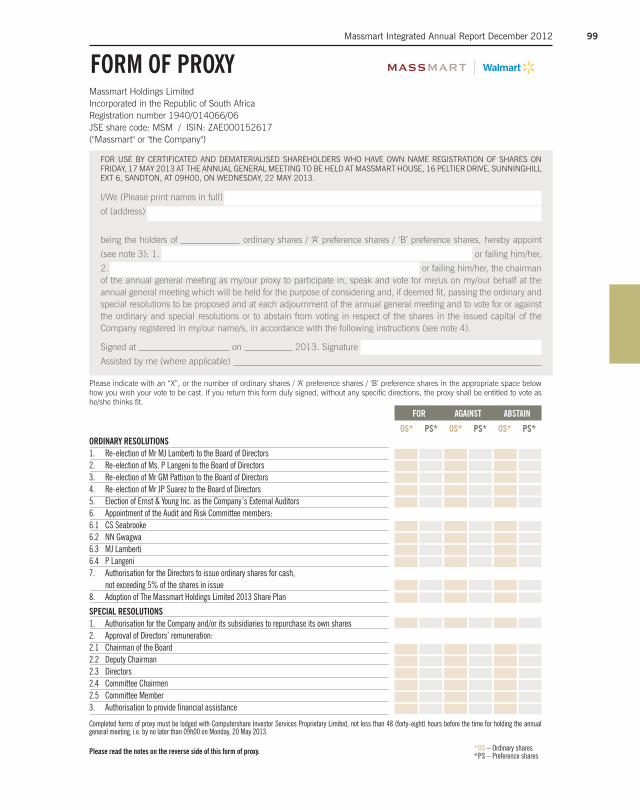
Massmart Holdings LimitedIncorporated in the Republic of South AfricaRegistration number 1940/014066/06JSE share code: MSM / ISIN: ZAE000152617 ("Massmart" or "the Company")
FORM OF PROXY
FOR USE BY CERTIFICATED AND DEMATERIALISED SHAREHOLDERS WHO HAVE OWN NAME REGISTRATION OF SHARES ON FRIDAY, 17 MAY 2013 AT THE ANNUAL GENERAL MEETING TO BE HELD AT MASSMART HOUSE, 16 PELTIER DRIVE, SUNNINGHILL EXT 6, SANDTON, AT 09H00, ON WEDNESDAY, 22 MAY 2013.
I/We (Please print names in full)
of (address)
being the holders of ordinary shares / ‘A’ preference shares / ‘B’ preference shares, hereby appoint
(see note 3): 1. or failing him/her,
2. or failing him/her, the chairman of the annual general meeting as my/our proxy to participate in, speak and vote for me/us on my/our behalf at the annual general meeting which will be held for the purpose of considering and, if deemed fi t, passing the ordinary and special resolutions to be proposed and at each adjournment of the annual general meeting and to vote for or against the ordinary and special resolutions or to abstain from voting in respect of the shares in the issued capital of the Company registered in my/our name/s, in accordance with the following instructions (see note 4).
Signed at on 2013. Signature
Assisted by me (where applicable)
Please indicate with an “X”, or the number of ordinary shares / ‘A’ preference shares / ‘B’ preference shares in the appropriate space below how you wish your vote to be cast. If you return this form duly signed, without any specifi c directions, the proxy shall be entitled to vote as he/she thinks fi t.
ORDINARY RESOLUTIONS1. Re-election of Mr MJ Lamberti to the Board of Directors 2. Re-election of Ms. P Langeni to the Board of Directors 3. Re-election of Mr GM Pattison to the Board of Directors 4. Re-election of Mr JP Suarez to the Board of Directors5. Election of Ernst & Young Inc. as the Company’s External Auditors 6. Appointment of the Audit and Risk Committee members:6.1 CS Seabrooke6.2 NN Gwagwa 6.3 MJ Lamberti6.4 P Langeni 7. Authorisation for the Directors to issue ordinary shares for cash, not exceeding 5% of the shares in issue 8. Adoption of The Massmart Holdings Limited 2013 Share Plan
SPECIAL RESOLUTIONS1. Authorisation for the Company and/or its subsidiaries to repurchase its own shares 2. Approval of Directors’ remuneration:2.1 Chairman of the Board2.2 Deputy Chairman2.3 Directors2.4 Committee Chairmen2.5 Committee Member3. Authorisation to provide fi nancial assistance
Completed forms of proxy must be lodged with Computershare Investor Services Proprietary Limited, not less than 48 (forty-eight) hours before the time for holding the annual general meeting, i.e. by no later than 09h00 on Monday, 20 May 2013.
Please read the notes on the reverse side of this form of proxy.
FOR AGAINST ABSTAIN
OS* PS* OS* PS* OS* PS*
*OS – Ordinary shares*PS – Preference shares
99Massmart Integrated Annual Report December 2012

1. A form of proxy is only to be completed by those shareholders who are: 1.1 holding shares in certifi cated form; or 1.2 recorded on the sub-register of the Company in dematerialised electronic form in own name on the record date
for attending, participating and voting at the annual general meeting.
2. If you have already dematerialised your shares through a Central Securities Depository Participant (CSDP) or broker and wish to attend the annual general meeting, you must request your CSDP or broker to provide you with a letter of representation or you must instruct your CSDP or broker to vote by proxy on your behalf in terms of the agreement between yourself and your CSDP or broker.
3. A shareholder may insert the name of a proxy or the names of alternative proxies of the shareholder’s choice in the space/s provided, with or without deleting ‘the chairman of the annual general meeting’ but any such deletion must be initialled by the shareholder. The person whose name stands fi rst on this form of proxy and who is present at the annual general meeting will be entitled to act as proxy to the exclusion of those whose names follow.
4. Please insert an ‘X’ in the relevant space according to how you wish your votes to be cast. However, if you wish to cast your votes in respect of a lesser number of shares than you own in the Company, insert the number of shares held in respect of which you wish to vote. Failure to comply with the above will be deemed to authorise the proxy to vote or to abstain from voting at the annual general meeting as he/she deems fi t in respect of all the shareholders’ votes exercisable at the annual general meeting. A shareholder or his/her proxy is not obliged to use all the votes exercisable by the shareholder or by his/her proxy, but the total of the votes cast and in respect of which an abstention is recorded may not exceed the total of the votes exercisable by the shareholder or by his/her proxy.
5. Forms of proxy must be received by the transfer secretaries, Computershare Investor Services Proprietary Limited (Computershare), Ground Floor, 70 Marshall Street, Johannesburg 2001 (PO Box 61051, Marshalltown 2107) by no later than 09h00 on Monday, 20 May 2013.
6. The completion and lodging of this form of proxy will not preclude the relevant shareholder from attending the annual general meeting and speaking and voting in person at such meeting to the exclusion of any proxy appointed in terms of this form of proxy.
7. Documentary evidence establishing the authority of a person signing this form of proxy in a representative capacity or other legal capacity must be attached to this form of proxy unless previously recorded by Computershare or waived by the chairman of the annual general meeting.
8. Any alterations or corrections made to this form of proxy must be initialled by the signatory/ies.
9. A minor must be assisted by his/her parent or guardian unless the relevant documents establishing his/her legal capacity are produced or have been registered by Computershare.
10. The chairman of the annual general meeting may accept any form of proxy which is completed, other than in accordance with these notes, if the chairman is satisfi ed as to the manner in which the shareholder wishes to vote.
11. If any shares are jointly held, the fi rst name appearing in the register shall, in the event of a dispute, be taken as a shareholder.
Transfer secretaries
Computershare Investor Services Proprietary LimitedGround Floor70 Marshall StreetJohannesburg 2011PO Box 61051, Marshalltown 2107Telephone: 011 370 5000Call Centre: 086 110 09818
NOTES TO THE FORM OF PROXY100 Shareholder Information