contamination warning system demonstration ilot …...contamination warning system demonstration...
TRANSCRIPT
EventDetectionDashboard
Online WaterQuality
Monitoring
Samplingand
Analysis
PublicHealth
Surveillance
EnhancedSecurity
Monitoring
CustomerComplaint
Surveillance
OtherSystem
Information
Routine Operation
Alert Validation& Initial
Investigation
PossibleContamination
Incident
CredibleContaimination
Incident
ConfirmedContamination
Incident
Remediation& Recovery of
Incident
Return to Routine Operations
Consequence Management
May 2013
Philadelphia Water Department Contamination Warning System Demonstration Pilot Project:
WBG012313172402PHL
Development of User Requirements and Use Cases for a Contamination
Warning System Dashboard
ii
When referencing this white paper in another document, please use the following citation:
Philadelphia Water Department and CH2M HILL. May 2013. Philadelphia Water Department Contamination Warning System Demonstration Pilot Project: Development of User Requirements and Use Cases
for a Contamination Warning System Dashboard. White Paper Submitted to EPA as part of the Water Security Initiative Grant Awarded to Philadelphia Water Department.
This paper can also be downloaded from www.ch2mhill.com/iws.
EPA DisclaimerAlthough the information in this document has been funded wholly or in part by the United States Environmental Protection Agency under the Water Security Initiative program, it may not necessarily reflect the views of the agency and no official endorsement should be inferred.

iii
Acknowledgments The Philadelphia Water Department would like to recognize the following individuals and organizations for their assistance and contributions in the development of this document:
EPA Water Security Division
Steve Allgeier
Katie Umberg
Philadelphia Water Department
Jerry Skoritowski
Reena George
Contractor Support
Raja Kadiyala, PhD, CH2M HILL
Andrew Hu, Critigen
Christopher Peluso, CH2M HILL
Christopher Wiggins, CH2M HILL
Yakir Hasit, PhD, PE, CH2M HILL
Questions concerning this document should be addressed to:
Geoffrey L. Brock Philadelphia Water Department 1101 Market Street ARAMARK Tower, 3rd Floor Philadelphia, PA 10107‐2994 Phone: 215‐685‐6220 E‐mail: [email protected]
Gary Burlingame Philadelphia Water Department Bureau of Laboratory Services 1500 E Hunting Park Avenue Philadelphia, PA 19124 Phone: 215‐685‐1402 E‐mail: [email protected]
Yakir Hasit, PhD, PE CH2M HILL 1717 Arch Street Suite 4400 Philadelphia, PA 19103 Phone: 215‐640‐9027 E‐mail: [email protected]

1
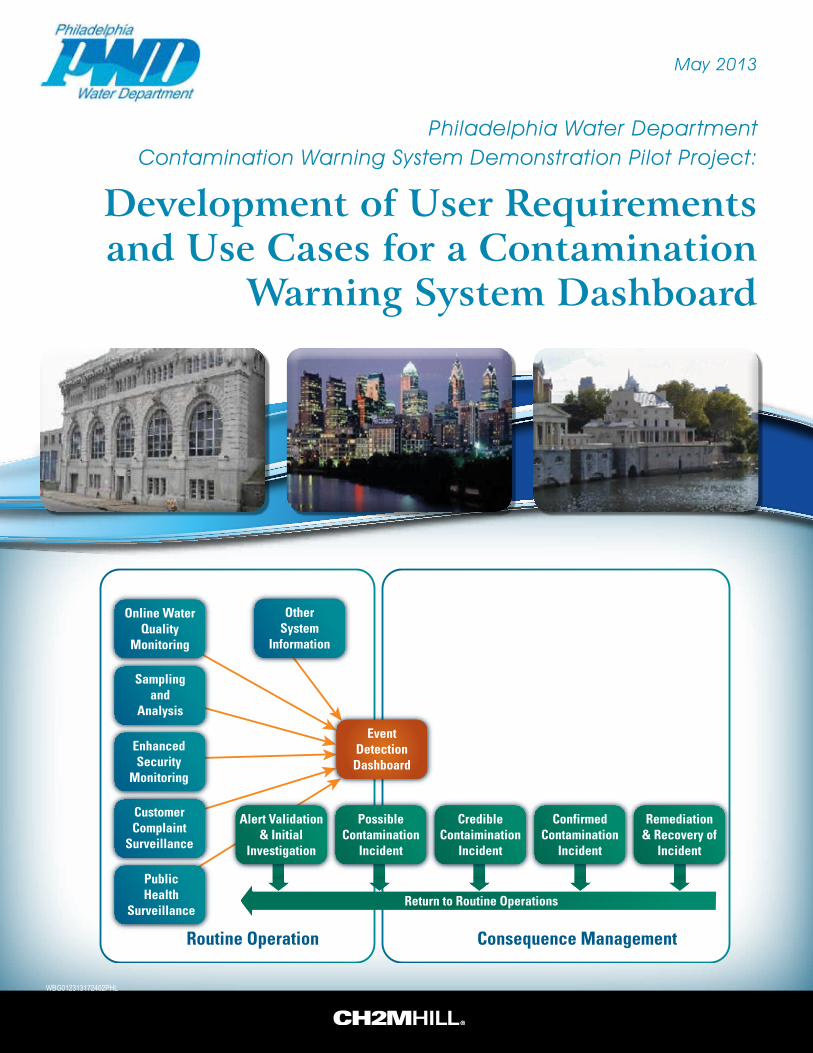
Abstract The Philadelphia Water Department (PWD) developed a comprehensive contamination warning system (CWS) for its drinking water system under a Water Security (WS) initiative grant from the U.S. Environmental Protection Agency (EPA). The integration of multiple information streams is a core element when designing a CWS. PWD envisioned a web‐based dashboard application to serve as the primary user interface for CWS alerts and an incident management system. The primary objective of system engineering and data integration was to combine the five surveillance components—online water quality monitoring, consumer complaint surveillance, sampling and analysis, enhanced security monitoring, and public health surveillance—into a centralized platform that can be used to determine whether a water contamination event has occurred and to facilitate appropriate response and consequence management actions. To develop the CWS Dashboard, the system engineering team conducted a series of dashboard requirement workshops with CWS component leads and primary CWS users. After each user requirement workshop, the system engineering team developed a detailed list of user requirements, coordinated follow‐up workshops to consolidate and prioritize the requirements, and then turned them over to the software design and development team to implement the CWS Dashboard.
This paper describes the four critical steps taken in the development of user requirements for the CWS Dashboard: (1) educate PWD staff on the process development through chartering workshop, (2) conduct requirement definition workshops with key staff from each CWS component, (3) review and prioritize the user requirements, and (4) develop software design documents.
Project Background PWD developed a comprehensive CWS for its drinking water system under a WS initiative grant. The WS initiative is a program developed by the EPA in partnership with drinking water utilities and other key stakeholders in response to Homeland Security Presidential Directive 9. The WS initiative involves designing, deploying, and evaluating a model CWS for drinking water security. A CWS is a systematic approach to collecting information from various sources, including monitoring and surveillance programs, to detect contamination in drinking water early enough to reduce public health or economic consequences. The WS initiative goal is to develop water security CWS guidance that can be applied by drinking water utilities nationwide.
The project has six major components:
1. Online water quality monitoring (OWQM)
2. Sampling and analysis (S&A)
3. Enhanced security monitoring (ESM)
4. Customer complaint surveillance (CCS)
5. Public health surveillance (PHS)
6. Consequence management (CM)
The integration of multiple information streams is a core element in designing a CWS. Taken separately, each component provides its own set of event triggers that have value for event detection. The primary objective of system engineering and data integration is to combine the five surveillance components into a centralized platform that can be used to determine whether a water contamination event has occurred and to facilitate appropriate response and consequence management actions.
The CWS Dashboard development process used for the PWD Pilot Project consisted of five steps (Figure 1); the first three are described in this white paper:
Define business processes.
Define user requirements.
Define use cases.
Design the software.
Develop the solution.

DEVELOPMENT OF USER REQUIREMENTS AND USE CASES FOR A CWS DASHBOARD
2
FIGURE 1 Software Development Flow
Definition of Business Processes The CWS Dashboard development process started during operational strategy discussions that defined the core business processes and initial information flow. Using the information flow diagrams, the project team then verified the sources of information for the given component topic of the workshop and detailed the systems of record for the data (i.e., the application or database housing the data for the component). As shown in Figure 1, documents prepared during the development process were User Requirements, System Requirements, Mapping Requirements, and Use Cases.
This paper focuses on the methods used to define user requirements and use cases for the CWS Dashboard.
Development of User Requirements PWD envisioned a web‐based dashboard application developed to serve as the primary user interface for CWS alerts and an incident management system. To develop the CWS Dashboard, the system engineering team conducted a series of dashboard requirement workshops with the five component leads and primary CWS Dashboard users. After each requirement workshop, the system engineering team developed a detailed list of requirements. The team identified whether a particular requirement was relevant only to a single component or could be applied to all components. These requirements were presented to component leads and users during follow‐up workshops for consolidation and prioritization before turning them over to the software design and development team to implement the CWS Dashboard. The process for developing the user requirements for the requested functionality had four steps:
1. Educate PWD staff on the process development through chartering workshops.
2. Conduct requirement definition workshops with key staff from each component.
3. Review and prioritize user requirements.
4. Develop the software design documents.
Each step is discussed in detail in the following subsections.

DEVELOPMENT OF USER REQUIREMENTS AND USE CASES FOR A CWS DASHBOARD
3
Chartering Workshop Many of PWD’s staff had not previously gone through a formal requirements‐gathering process, nor did they completely understand their role in the process and the expectations associated with their participation. The chartering session allowed the system engineering team to educate the participants on the process, define the need for the process, and provide examples of the outcome from the requirements gathering effort. The following key topics were discussed during the chartering workshop:
Project objectives—All participants were informed of the overall CWS project, particularly the CWS Dashboard application that would be developed for CWS. The scope of work and the timeline necessary to meet the overall project’s schedule was conveyed.
Critical success factors—Critical success factors both for the CWS Dashboard development effort and the business processes/functions served were identified. Questions such as “How will we know that the planned changes have been effective?” and “How will success be measured?” were answered.
Project deliverables—The deliverables from the effort were identified.
Prepare, inform, and educate the workshop participants—Background on the software development effort including why it was critical for the stakeholders to get involved in the requirements definition, was provided.
Participants—Participants that were needed for a successful workshop were selected. In general, these included business users and staff with domain knowledge and expertise.
Workshop schedule—Workshop dates and schedules were coordinated to achieve participation with critical staff.
Definition of User Requirements After the information sources were identified, the focus turned to individual data elements within the repositories:
Users needed to define, in detail, the data fields from each source system necessary to perform various business processes.
Users also were asked to define how they wanted to view and interact with these data.
This critical information was used to define user requirements. A template was created to document the following information for each user requirement (Table 1 lists example user requirements for the CCS component):
ID – Identifier to be used for requirement tracking
Requirement Name – A descriptive requirement name
Requirement Description – As much information as necessary to clearly describe the requirement
Category – Used to group like requirements into functional groups. Possible categories included the following:
Map – Requirement related to map display and availability of data layers, cartography
Data – Specific to a data layer or data set (see user requirement 2 in Table 1)
Navigation – Map navigation tools and shortcuts
Toolbox Functions – For each toolbox, toolbar icons control the functionality provided within the toolbox (see user requirements 4 and 5 in Table 1)
Query – Dataset‐specific filtering (see user requirement 3 in Table 1)
Reporting – The way that data are to be reported (chart, table, map)
Help – Online documentation
Printing – Maps, reports, queries
Workshops with key PWD staff were held to define the component‐specific user requirements. The workshops allowed free exchange of user requirements that aligned to the business processes automated by the application.

DEVELOPMENT OF USER REQUIREMENTS AND USE CASES FOR A CWS DASHBOARD
4
The workshop facilitator ensured that all attendees participated and that requirements with technical or organizational constraints were identified. The consolidation of requests and analysis of constraints occurred during the review cycles. If enough requests came up with the same constraints, the PWD organization was alerted that some investments and changes were needed to remove or reduce those constraints.
TABLE 1
Example User Requirements for CCS
ID Name Description Category
1 Pressure zone Pressure zone layer. Map service
2 Message board/overall activity log
Running list of all activities performed for each alert and incident. Includes custom messages entered by users. Message can be associated with an alert or a component but can also be a generic systemwide message. Log will include ID, timestamp, component, action/message, user, and priority. Include ability to filter by component, user, or priority.
Data
3 Query CCS complaints
Query by complaint type and date range, display chart with number of calls (and event detection algorithms [EDA] thresholds) by pressure zone, service area. Click on chart –> display calls (for the selected chart element) on the map.
Query
4 Mouse Over: CCS complaint
Mouse‐over window displays service request ID, status (open/closed), priority, complaint type, problem address/zip, timestamp.
Toolbox functions
5 Click On: CCS complaint
Click‐on window should display service request ID, status (open/close), priority, complaint type, customer name, problem address/zip, phone number, timestamp, sample taken, and a link to activity log for that call.
Toolbox functions
Review and Prioritization of User Requirements Once all user requirements were gathered at the component level, the system engineering team reviewed them both from a requirement definition perspective and from a business process perspective for completeness. Individual meetings were conducted to clarify any outstanding issues. Redundant requests were combined into a common request. Technical and organizational constraints were evaluated to identify requirements that were not feasible to implement given the project schedule and budget.
The following process was used in the review and prioritization of the requirements:
1. List all requirements to be prioritized in a spreadsheet. All items must be at the same level of detail.
2. Estimate the relative benefit that each feature provides to the end user or the component.
3. Estimate the negative impact on the end user if a feature is not implemented.
4. Calculate a total value of the feature as the sum of items 2 and 3 above.
5. Estimate the relative cost of implementing each feature.
6. Estimate the relative degree of risk (e.g., unknown elements, technical complexity).
7. Weight the value from 4 against the cost and risk of 5 and 6.
8. Rank the features according to 7.
As part of Step 7, the requirements were prioritized to identify the critical user requirements and those items that are “nice to have” and could be implemented in the future. Prioritization allowed the system engineering team to resolve conflicts, plan for staged deliveries, and make the necessary tradeoff decisions. The priority scale used to categorize and rank the requirements is provided in Table 2.
TABLE 2 Priority Scale
Priority Classification Definition
1 – High A mission‐critical requirement; required for next release.
2 – Medium Required eventually but could wait until a later release if necessary.
3 – Low An enhancement; would be nice to have someday if resources permit.

DEVELOPMENT OF USER REQUIREMENTS AND USE CASES FOR A CWS DASHBOARD
5
Definition of Use Cases and Software Design Documents Once the user requirements were reviewed and prioritized, user requirements with a high or medium classification were analyzed further to convert them into meaningful use cases to aid in software development. A use case is a list of steps typically defining interactions between a user and a system to achieve a goal.
Software design documents were prepared in the form of tables or figures to document the conversion of user requirements to use cases and provide overall guidance on the architecture of the CWS Dashboard. Example use cases in table form are provided to illustrate the conversion of requirements to a use case. Table 3 illustrates a general user requirement, i.e., opening the CWS Dashboard. Table 4 provides the use case that documents the mouse‐over user requirement defined for CCS functionality that was shown in Table 1.
TABLE 3 Example Use Case
Use Case ID CWS‐1
Related requirements 55
Title Open CWS Dashboard
Purpose/overview A user navigates to the Dashboard URL and opens the CWS Dashboard Intro/home page.
Users/actors All CWS users.
Precondition A user opens a web browser.
Scenario A user navigates to the CWS Dashboard Intro/home page with a unique URL.
System displays an intro page to the CWS Dashboard.
System displays web links relevant to PWD CWS (TBD).
System displays a login tab or button.
Post‐condition CWS Dashboard Intro/home page is shown on the screen. A user can:
Read CWS Dashboard information and/or user instruction on the intro page.
Click the login button to log into the Dashboard system.
TABLE 4 Example CCS Use Case
Use Case ID CCS‐3
Related requirements 5
Title Mouse‐over: CCS.
Purpose/overview As a user moves the mouse over a CCS complaint point on the map, quick facts about the complaint are displayed on the screen.
Users/actors CCS users.
Precondition Default CCS map and CCS toolbox is open on the screen, and a user selected the identify tool.
Scenario A user moves the mouse over a CCS complaint point on the map. System displays a map tips window showing: ‐ service request ID ‐ status (open/close) ‐ priority ‐ complaint type ‐ problem address/zip ‐ timestamp
(Note: Too much information in the mouse‐over window may block the view of the map, need to revisit and revise the number of parameters to be displayed by mouse‐over.)

DEVELOPMENT OF USER REQUIREMENTS AND USE CASES FOR A CWS DASHBOARD
6
TABLE 4 Example CCS Use Case
Use Case ID CCS‐3
Post‐condition Selected CCS complaint information, including service request ID, status (open/close), priority, complaint type, problem address/zip, timestamp, is displayed on the map (also see the note above).
Alternate Scenario 1 A user moves the mouse away from a CCS complaint point on the map. System closes the map tips window.
Screen mockups are an effective way of conveying user interface concepts from the requirements team to the development team. A simple screen mockup created in Microsoft Excel (Figure 3) conveyed the general screen layout of the CWS Dashboard to the development team.
FIGURE 3 Example Screen Mockup
Many of the user requirements requested particular geographic information system (GIS) layers to fulfill specific business needs. Table 5 is a separate mapping requirements document generated to manage the spatial requirements and coordinate the mapping requirements with the GIS group.
TABLE 5 Example Set of Mapping Requirements
Map Service Name Description
Pressure zone Display pressure zone layer on map
Water assets Display water assets
Hydrant Display hydrants
WTP service area Display water treatment plant (WTP) service areas
OWQM GIS Display OWQM GIS sites and water quality parameters
BLS GIS Display Bureau of Laboratory Services (BLS) GIS (sample location and water quality parameters)
Zip codes Zip codes
Councilmanic districts Councilmanic districts

DEVELOPMENT OF USER REQUIREMENTS AND USE CASES FOR A CWS DASHBOARD
7
Lessons Learned The most effective user requirements came from input specific to the contributor's roles and responsibilities. Although end users were not always pleased to learn that they would not get all the features they desired in the initial release of the CWS Dashboard, they understood that due to time and budget constraints, some features would be implemented before others. Getting a single user to set priorities on his or her requirements, let alone a large group of users from different parts of the organization, can be difficult, but it is an important part of the CWS Dashboard development process. Having a clearly communicated process that empowers end users throughout the organization led not only to an application that was an integral part of the CWS, but also to a more efficient development process and a higher rate of user acceptance. Using a consistent team through the entire process from initial business requirement and process definition through the development of the application also fostered an efficient development pipeline with fast review and modification cycles.
Conclusions and Recommendations The system engineering team conducted a series of dashboard requirement workshops with component leads and primary CWS Dashboard users from five surveillance components (OWQM, CCS, S&A, ESM, and PHS) as part of the development of the CWS Dashboard. After each requirement workshop, the system engineering team developed a detailed list of requirements. The four‐step process to develop the user requirements for the requested functionality proved to be successful.
PWD has benefited from integrating the various component data systems. The CWS Dashboard is a complex application that brings together data from multiple components and facilitates the determination of whether a contamination or operational event has occurred in the water utility system. The CWS Dashboard provides important system information to key decision‐makers, wherever and whenever, to support timely and appropriate responses to water quality anomalies.

8
Abbreviations and Acronyms BLS Bureau of Laboratory Services
CCS Customer Complaint Surveillance
CM Consequence Management
CWS Contamination Warning System
EDA Event detection algorithm
EPA United States Environmental Protection Agency
ESM Enhanced Security Monitoring
GIS Geographic Information System
ID Identification number
OWQM Online Water Quality Monitoring
PHS Public Health Surveillance
PWD Philadelphia Water Department
S&A Sampling and Analysis
TBD To be determined
WS Water Security
WTP Water treatment plant
DISCLAIMER
This white paper was prepared under an EPA Water Security initiative grant awarded to Philadelphia Water Department. Neither Philadelphia Water Department nor CH2M HILL makes any warranty, expressed or implied, or assumes any legal liability or responsibility for any third party’s use, or the results of such use, or any information, apparatus, product, or
process disclosed in this publication, or represents that its use by such third party would not infringe privately owned rights.