contacts between police and the public - bureau of … · bureau of justice statistics u.s....
TRANSCRIPT

Bureau of Justice Statistics
U.S. Department of Justice Office of Justice Programs
Contacts between Police and the Public Findings from the 2002 National Survey
In 2002 C
21% of surveyed residents had a contact with police
40% of contacts were in traffic stops
26% of contacts were to report a crime or problem
1.5% of contacts involved police use of force
9% of white drivers were stopped
9% of black drivers were stopped
9% of Hispanic drivers were stopped
84% of drivers considered stop legitimate

U.S. Department of JusticeOffice of Justice Programs810 Seventh Street, N.W.Washington, D.C. 20531
Alberto R. GonzalesAttorney General
Office of Justice ProgramsPartnerships for Safer Communities
Tracy HenkeActing Assistant Attorney General
World Wide Web site:http//www.ojp.usdoj.gov
Bureau of Justice Statistics
Lawrence A. GreenfeldDirector
World Wide Web site:http://www.ojp.usdoj.gov/bjs
For information contactNational Criminal Justice Reference Service
1-800-851-3420
U.S. Department of JusticeOffice of Justice ProgramsBureau of Justice Statistics
Contacts between Police and the PublicFindings from the 2002 National Survey
ByMatthew R. DuroseErica L. SchmittPatrick A. Langan, Ph.D.
BJS Statisticians
April 2005, NCJ 207845

U.S. Department of JusticeBureau of Justice Statistics
BJS statisticians Matthew R. Durose, Erica L. Schmitt, andPatrick A. Langan wrote this report. Tina Dorsey edited andproduced the report. Staff from the U.S. Census Bureaufacilitated the final construction of the questionnaire,managed the field aspect of the data collection, processedthe data, and provided the estimation specifications.
Data presented in this report can be obtained from theNational Archive of Criminal Justice Data at the University of Michigan, 1-800-999-0960. The archive Internet site canbe accessed through the BJS site.
Electronic versions of this and other reports are availablefrom the BJS Internet site:http://www.ojp.usdoj.gov/bjs/
Contents
Foreword iii Highlights ivIncidence and prevalence of police-public contact 1Traffic stops 4Police use of force 16Methodology 21Questionnaire 22
ii Contacts between Police and the Public, 2002

This publication represents the annual report to theCongress as required by Section 210402 of the ViolentCrime Control and Law Enforcement Act of 1994, whichmandates the collection of data by the Attorney Generalon the “use of excessive force by law enforcementofficers.” The report’s findings are based on the Police-Public Contact Survey (PPCS), a survey designed by theBureau of Justice Statistics (BJS) to document contactsbetween police and the public that culminated in policeusing force.
To date, national surveys of the public concerning itscontacts with police have been conducted three times byBJS:
The first survey – described in the BJS publicationPolice Use of Force: Collection of National Data(NCJ 165040) – documented levels of contacts withpolice during 1996.
The second survey – described in Contacts betweenPolice and the Public: Findings from the 1999National Survey (NCJ 184957) – recorded police-citizen contacts in 1999.
The third survey – described here under the publica-tion title Contacts between Police and the Public: Findings from the 2002 National Survey (NCJ207845) – covered interactions between police andthe public in 2002.
In addition to the three surveys, data collection activitiesundertaken by BJS pertaining to police use of forceinclude the following:
In 2000 BJS published Traffic Stop Data CollectionPolicies for State Police, 1999 (NCJ 180776), whichsummarized results of a survey documenting, forexample, the number of State police agencies in1999 that routinely keep administrative records onpolice use of force in traffic stops.
In 2001 BJS updated its information regarding themaintenance of administrative records on police useof force with results summarized in Traffic Stop DataCollection Policies for State Police, 2001 (NCJ191158).
In 2001 BJS published Policing and Homicide, 1976-98: Justifiable Homicide by Police, Police OfficersMurdered by Felons (NCJ 180987), which summa-rizes and analyzes historical data on the number ofpersons killed by police in the line of duty.
In 2003 BJS fielded a revised version of the nationalsurvey titled Sample Survey of Law EnforcementAgencies, which included for the first time a battery ofquestions to State and local police agencies aboutthe annual number of complaints they receive regard-ing excessive force by police (and the disposition ofthose complaints). Survey results are expected in2005 under the publication title Citizen Complaintsabout Police Use of Force, 2002. This survey will berepeated in 2006 and every 3 years thereafter.
In 2004 BJS expanded its annual Web publica-tion Homicide Trends in the United States to includethe latest national statistics on justifiable homicidesby police.
In 2005 BJS published State and Local Law Enforce-ment Training Academies, 2002 (NCJ 204030),summarizing results from the first survey of trainingacademies ever conducted by BJS. Among otherthings the publication includes considerable informa-tion about the types of training police recruits receiveon the use of force.
Over the years, BJS has vastly expanded its productionof statistical data on police use of force. BJS will continueto look for new and creative ways to meet the informationneeds of the public, policymakers, and criminal justicepractitioners concerning this most vital topic.
Lawrence A. GreenfeldDirectorBureau of Justice Statistics
Foreword
Contacts between Police and the Public, 2002 iii

Incidence and prevalence of contactwith police
• In 2002 an estimated 45.3 million U.S.residents age 16 or older — about 21%of all persons of this age — had at leastone face-to-face contact with a policeofficer. This is the same rate of contactbetween police and residents found inthe 1999 Police-Public Contact Survey(PPCS).
• On a per capita basis in 2002, the rateof police-resident contact for whites wasabout 15% higher than for blacks andabout 26% higher than for Hispanics.The rate of contact for males wasabout 20% higher than for females.
• In 2002 a total of about 76 millionencounters, or about 1.7 contacts perperson, occurred between the policeand the 45.3 million persons with atleast one contact that year.
• Seventy-one percent of personsexperiencing a contact with policeduring 2002 had no more than onecontact. The remaining 29% of thosewith contacts reported having multiplecontacts.
Reasons for contact with police
• Among the 45.3 million persons whohad at least one police contact during2002, 58.5% reported their latest (thatis, most recent) contact that year wasinitiated by police. The remaining 41.5%of contacts between the public and thepolice were initiated by the resident orsomeone other than the police (such asa family member or acquaintance of theresident).
• In 2002 the most common reason forpolice contact was being the driver of amotor vehicle that was pulled over bypolice, accounting for almost 17 millioncontacts.
• About 25% of the 45.3 million personswith a face-to-face contact indicated thereason for the contact was to report acrime or other problem.
Contacts culminating in arrest
• In 2002 about 1.3 million residents age16 or older — 2.9% of the 45.3 millionpersons with contact — were arrestedby police. Similarly, just over 1.3 millionresidents were handcuffed during theircontact with police.
Resident opinion on whether policeacted properly
• In 2002 the vast majority of the 45.3million persons who had a contact withpolice felt the officer(s) acted properly(90.1%).
Contacts with police in traffic stops
• In 2002 approximately 192.7 millionpersons age 16 or older said they drivea few times a year or more. Of these192.7 million drivers, an estimated 8.7%were pulled over by police in a trafficstop. The 8.7% represents 16.8 millionstopped drivers.
• Of the 16.8 million stopped drivers, anestimated 60.8% (10.2 million) were
male and 39.2% (6.6 million) werefemale; 76.5% (12.8 million) were white,11% (1.9 million) were black, 9.5% (1.6million) were Hispanic, and 2.9% (.5million) were drivers of other races.
• The likelihood of being stopped bypolice in 2002 did not differ significantlybetween white (8.7%), black (9.1%),and Hispanic (8.6%) drivers.
• An estimated 9.3% of drivers stoppedby police said the reason for the stopwas a burned out headlight, a loudmuffler, or some other vehicle defect;11.5% said the reason was a check forvehicle registration, insurancecoverage, driver’s license, or someother record; 1.3% said a roadsidecheck for drunk drivers; 7.1% said astopsign or stoplight violation; 4.4% saida seatbelt violation; 4.9% said theymade an illegal turn or an illegal lanechange; 54.8% said speeding; and4.2% said they were stopped for someother traffic offense.
• Of the 16.8 million stopped drivers,police issued a ticket to 58.6%, carriedout a search of some kind (a physicalsearch of the driver and/or a search ofthe vehicle) on 5%, handcuffed 2.8%,arrested 2.7%, used or threatened forceagainst 1.1%, and used or threatened
Highlights
iv Contacts between Police and the Public, 2002
Among the 45.3 million residents age 16 or older who had a contact with police in 2002, about 1.5% (664,500 persons) had a contact in which police used or threatened force against them.
Had a face-to-face contact with police 45,278,900
All other contacts 28,495,400
Use-of-force encounter resulted Use-of-force encounter resulted
Drivers in a motor vehicle stop 16,783,500
U. S. resident population age 16 or older 215,536,800
189,000 475,500

force that the driver deemed excessiveagainst 1%.
• During the traffic stop, police weremore likely to carry out some type ofsearch on a male (7.1%) than a female(1.8%), and more likely to carry outsome type of search on a black (10.2%)or Hispanic (11.4%) than a white(3.5%).
• The vast majority of drivers stopped by police (84%) said they had beenstopped for a legitimate reason, and88% of stopped motorists felt police hadbehaved properly during the traffic stop.
Contacts with police involving forceor the threat of force
• Among the 45.3 million residents age16 or older who had a contact withpolice in 2002, about 1.5% (664,500persons) had a contact in which policeused or threatened force against them.The 1.5% in 2002 is greater than thepercentage in 1999. In 1999, 1%(0.98%) of persons with contact experi-enced force or the threat of force.
• Among those with police contact,blacks (3.5%) and Hispanics (2.5%)were more likely than whites (1.1%) toexperience police threat or use of forceduring the contact.
• Force was used against 2.5% of16-to-29 year olds who came intocontact with police. The percentage waslower — 0.9% — for persons over age29.
• “Pushed” or “grabbed” by police wasthe type of force that characterized 42%of the 664,500 contacts in which forceoccurred. An additional 19% of the664,500 force incidents involved policepointing a gun at the resident.
• Of the 664,500 persons against whomforce was used, about three-quarterscharacterized the force as excessive.
• About 14% of the 664,500 personswho experienced force were injured asa result of the police action.
• About 24% of the 664,500 personsinvolved in a police force incidentargued with, cursed at, insulted, orverbally threatened the officer(s) duringthe incident.
• An estimated 38% of the 664,500persons involved in a force contactwere arrested during the incident.
• About 87% of the 664,500 personsexperiencing the threat or use of forcefelt the police acted improperly. Lessthan 20% of these persons took formalaction, such as filing a complaint orlawsuit with authorities.
Contacts between Police and the Public, 2002 v
Force in the PPCS
Force includes contacts in which thepolice officer pushed, grabbed,kicked, or hit the resident. Hitting wasdefined as striking with a hand or anobject held in the officer's hand.Included in the definition of forcewere police dog bites, spray withpepper spray or a chemical, and afirearm pointed in the resident’sdirection. Also included was thethreat to carry out any of these typesof force.
The survey provided an opportunityfor respondents to express theiropinion as to whether any policeforce or threat of force used againstthem was "excessive." The surveydid not define "excessive" for therespondent. Respondents who saidthey had experienced police use orthreat of force were asked whetherthey felt any of the physical forceused or threatened against them wasexcessive. If a respondent said theforce was excessive, he or she wasasked about the specific type ofphysical force considered excessive.


In 2002 an estimated 45.3 millionresidents — about 21% of the 216million U.S. residents age 16 or older —had at least one face-to-face contactwith a law enforcement officer (table 1).In 2002 rates of contact betweenresidents and the police translate intoabout 1 person with a contact for every4.8 residents age 16 or older. Thesefindings come from the 2002 Police-Public Contact Survey (PPCS) whichwas conducted during the last 6 monthsof that year.
Characteristics of residents havingface-to-face contact with police
Gender
Males had a per capita rate of contactabout 20% higher than females. About1 out of every 4.3 males age 16 or olderhad a contact with a police officer in2002. Among female residents age 16or older, there was about 1 with acontact for every 5.2 females.
Race/Hispanic origin
Per capita rates of contact betweenresidents and the police vary by therace and Hispanic origin of theresidents. Whites experienced contactwith law enforcement officers at thehighest rate: about 1 person for every4.5 non-Hispanic white residents age 16or older experienced a contact. Bycontrast, about 1 person for every 5.2black residents had contact, and at alower rate, about 1 Hispanic for every5.7 persons of Hispanic origin had adirect contact with a law enforcementofficer. Per capita, the white rate ofpolice-resident contact was about 15%higher than that for blacks and about26% higher than that for Hispanics.Other races (primarily Asians, PacificIslanders, American Indians, andAlaska Natives) experienced contactwith police at lower rates than whites
and blacks; on average, there wasabout 1 person with a contact for every6.2 residents of other races. Age
Residents in the youngest age group-ings generally had higher rates ofcontact with police than those in theoldest age groups. Residents in the agegroups of 18 to 19 and 20 to 24 had thehighest rates of contact with police(about 1 for every 3.1 persons andabout 1 for every 3.2 persons, respec-tively). By contrast, among those 50 orolder, rates of contact equal about 1person with a contact for every 7.1persons of this age.
Size of jurisdiction
Residents of jurisdictions with fewerthan 100,000 residents had a rate of
contact with police which was 42%higher than those residing in jurisdic-tions of 1 million or more residents (212 versus 149 per 1,000 residents).
Number of contacts residents hadwith police
In 2002 a total of 75.7 million encoun-ters occurred between the police andthe 45.3 million persons with at leastone contact that year (table 2).
Of the 45.3 million persons with policecontact during 2002:
• 71% had one contact
• 29% had 2 or more contacts
• the average number of face-to-facecontacts was 1.7.
Incidence and prevalence of police-public contact
Contacts between Police and the Public, 2002 1
Note: Detail may not add to total because of rounding.
14914,239,26412,123,1582,116,1061 million or more2287,968,7976,150,1991,818,598500,000-999,99922629,868,73523,105,3796,763,356100,000-499,999212163,459,985128,879,16034,580,825Under 100,000
Size of jurisdiction where resided
14077,311,82266,504,87610,806,94650 or older21221,110,99916,640,4164,470,58345-4921823,048,57618,024,4435,024,13340-4424521,108,22215,936,8355,171,38735-3923419,564,85514,990,9444,573,91130-3427317,745,20312,902,3324,842,87125-2931319,385,23213,310,4106,074,82220-243248,003,6245,409,5952,594,02918-192088,258,2486,538,0461,720,20216-17
Age
1628,513,8157,136,4831,377,332Other race17523,955,18219,763,4704,191,712Hispanic19325,694,07020,727,6824,966,388Black221157,373,713122,630,26134,743,452White
Race/Hispanic origin
192111,548,06190,153,82721,394,234Female230103,988,71980,104,07023,884,649Male
Gender
210215,536,780170,257,89745,278,884Total
Rate of contact per 1,000 persons
Total U.S.population
No contact with police
Contact with police
Demographiccharacteristic
Persons age 16 or older
Table 1. Rate of face-to-face contact between police and persons age 16 or older,by demographic characteristics of residents, 2002

Resident gender
In 2002 males were 48% of the U.S.population age 16 or older but 53% ofthe persons experiencing a face-to-facecontact with police and 55% of thosewith two or more contacts that year(table 3).
Resident race/Hispanic origin
Whites made up 73% of the U.S.population age 16 or older but 77% ofpersons with a police contact in 2002. Black residents age 16 or older madeup about the same percentage ofpersons having police contact (11%) astheir percentage of the U.S. population(12%).
Resident age
Residents in their twenties had relativelyhigh rates of contact with police. In2002 persons age 20 to 29 were 24.1%of persons with police contact but17.2% of the U.S. population age 16 orolder. The mean age of persons age 16or older with at least one face-to-facepolice contact during 2002 was 39; themedian was 37 (not shown in table).
Resident’s description of contactwith police during 2002
Survey respondents who said they hadface-to-face contact with police during2002 were asked to describe the natureof the contact. If persons had more thanone contact, they were asked onlyabout their latest (that is, most recent)contact that year.
2 Contacts between Police and the Public, 2002
Note: Detail may not add to total because of rounding.
1.422.11.13.411.282.26.860 or older1.633.22.26.016.272.441.130-591.83%5.3%3.2%7.7%17.8%65.927.816-29
Age
1.594.62.25.316.071.82.2Other race1.613.13.55.817.070.66.8Hispanic1.714.02.26.316.171.48.5Black1.68%3.8%2.3%6.4%16.1%71.358.3White
Race/Hispanicorigin
1.653.51.95.816.572.335.3Female1.69%4.1%2.9%6.7%16.0%70.340.4Male
Gender
1.67%3.8%2.4%6.3%16.2%71.375.7Total
5 timesor more4 times3 times2 times1 time
Demographiccharacteristic
Averagenumber ofcontacts perperson
Percent of persons 16 or older with police contactTotal number ofpolice contactsin 2002 (inmillions)
Table 2. Annual number of face-to-face contacts between police and personsage 16 or older, by demographic characteristics of residents, 2002
Note: Detail may not add to total because of rounding.
170,257,89713,004,02432,274,85945,278,884215,536,780Estimated number
39.118.226.123.935.950 or older20.420.421.221.020.540-499.411.611.311.49.835-398.89.810.210.19.130-347.611.210.510.78.225-297.816.512.213.49.020-243.27.84.95.73.718-193.8%4.4%3.6%3.8%3.8%16-17
Age
4.23.03.13.04.0Other race11.69.59.29.311.1Hispanic12.210.911.011.011.9Black72.0%76.6%76.8%76.7%73.0%White
Race/Hispanicorigin
53.045.547.947.251.8Female47.0%54.5%52.1%52.8%48.2%Male
Gender
100%100%100%100%100%Total
Two or morecontacts
One contactTotal
Demographiccharacteristic
Withoutpolicecontact
With police contactTotal U.S.population
Percent of persons age 16 or older
Table 3. Characteristics of persons with and without face-to-face police contact, 2002

Reason for contact
Among the 45.3 million persons whohad at least one police contact during2002, 58.5% reported their most recentcontact that year was initiated by police(table 4). The remaining 41.5% ofcontacts between the public and thepolice were initiated by the resident orsomeone other than the police (such asa family member or acquaintance of theresident). In 2002 the most common reason forpolice contact was driving a motorvehicle that was pulled over by police,accounting for almost 17 millioncontacts. Another 1.2 million personshad police contact as a passenger in astopped vehicle.
The second most frequent reason forface-to-face contact with police was toreport a crime or problem. Among the45.3 million persons with police contact,about 1 in 4 contacted police becauseof a crime or other problem.
Handcuffing or arresting the resident
When an arrest occurs, the police donot always handcuff the suspect, and not all persons who are handcuffed aresubsequently arrested. Handcuffs canbe used to detain someone for a shorttime while police determine how tohandle the situation. In 2002 about 1.3million residents age 16 or older —2.9% of the 45.3 million persons withcontact — were arrested by police(table 5). Similarly, just over 1.3 millionresidents were handcuffed during theircontact with police.
During the 26.5 million contacts initiatedby police, 4.3% of residents wereplaced under arrest. Less than 1%(0.8%) of residents were arrestedduring the 18.8 million contacts thatwere not police-initiated.
About 1 in 5 persons suspected ofcriminal wrongdoing were eitherhandcuffed (21.3%) or arrested (22.1%)by police. Persons who contacted policeto report a crime or other problemexperienced handcuffing or an arrestless than 1% of the time.
Resident opinion on whether policeacted properly
In 2002 the vast majority of residentswith police contact felt the officer(s)acted properly (90.1%). Persons whosecontact was not initiated by police(93.6%) were more likely than thosewhose contact was police-initiated(87.6%) to feel the officer(s) actedproperly during the encounter.
Contacts between Police and the Public, 2002 3
Note: Detail may not add to total because of rounding.*Includes contact initiated by the resident or someone other than the police, such as a familymember or acquaintance of the resident.
5.32,387,828Other reason2.61,158,167Suspected of something by police5.82,615,255Police were investigating crime7.23,264,503Police provided assistance or service
26.411,959,548Reported crime or problem to police2.71,218,470Passenger during traffic stop
37.116,783,467Driver during traffic stop13.0%5,891,645Traffic accident
Reason for contact
41.518,795,090Not police-initiated*58.5%26,483,794Police-initiated
Type of contact
100%45,278,884Total
Percent NumberContact with police
Table 4. Number of residents age 16 or older with police contact, by type of and reason for contact, 2002
*Includes contact initiated by the resident or someone other than the police, such as a familymember or acquaintance of the resident.
40,790,8301,302,4171,301,987Estimated number
83.65.14.2Other reason68.922.121.3Suspected of something by police86.78.28.3Police were investigating crime96.10.30.6Police provided assistance or service93.00.60.6Reported crime or problem to police80.65.55.8Passenger during traffic stop89.32.72.8Driver during traffic stop93.1%2.0%2.0%Traffic accident
Reason for contact
93.60.80.9Not police-initiated*87.6%4.3%4.3%Police-initiated
Type of contact
90.1%2.9%2.9%Total
Resident felt officer(s)acted properly
Arrested theresident
Handcuffedthe resident
Characteristics of police contact
Table 5. What police did during the contact, by type of and reason for contact, 2002

Number of drivers pulled over by police in 2002
The number of drivers age 16 or olderpulled over by police in a traffic stop in2002 totaled 16.8 million persons (table6). The 16.8 million includes stops of allkinds of motor vehicles — for example,motorcycles, buses, and private andcommercial cars and trucks — and bothpersonal and business travel.
Driver gender
Of the 16.8 million drivers stopped dur-ing the year, approximately 10.2 million,or 61%, were male, and 6.6 million, or39%, were female.
Driver race/Hispanic origin
Of the 16.8 million stopped drivers, 12.8million, or 77%, were white; 1.9 million,or 11%, were black; and 1.6 million, or10%, were Hispanic.
Driver age
Most stopped drivers were adults underage 40. Ten percent were under age20, and 50% were between 20 and 39years of age. Stopped drivers betweenages 40 and 49 accounted for 19%, and those age 50 or older, 21%.
Likelihood of driver being stopped
The 2002 U.S. population age 16 orolder totaled 215.5 million persons(table 7). An estimated 89%, or 192.7million, indicated they drive a few timesa year or more. On at least one occa-sion in 2002, 16.8 million of these driv-ers were driving a car or other motorvehicle when it was pulled over bypolice in a traffic stop. The 16.8 millionstopped drivers represent 8.7% —nearly 1 out of 11 — of the Nation's192.7 million drivers. In other words, anestimated 8.7% of all U.S. drivers age16 or older who say they drive a fewtimes a year or more were pulled overby police in 2002.
Driver gender
Ninety-three percent of males and 86%of females age 16 or older said theydrive a motor vehicle at least a fewtimes a year. Male drivers (10.6%) weremore likely than female drivers (6.8%)to be stopped by police in 2002.
Driver race/Hispanic origin
Among persons ages 16 or older in2002, 93% of whites, 79% of blacks,and 78% of Hispanics indicated thatthey drive a motor vehicle at least a fewtimes a year.
The likelihood of being stopped bypolice in 2002 did not differ significantlyamong white (8.7%), black (9.1%), andHispanic (8.6%) drivers.
Traffic stops
4 Contacts between Police and the Public, 2002
Note: Detail may not add to total because of rounding.
3.81,371,64082.336,552,98544,403,87260 or older6.82,074,38993.130,628,01732,907,95150-597.83,235,07394.241,588,88744,159,57540-499.83,741,42193.938,194,09440,673,07730-39
14.04,707,38190.433,569,98037,130,43520-29%13.61,653,563%74.612,125,18416,261,87216-19
Age
7.0493,25682.27,000,7298,513,815Other race8.61,595,87277.718,619,40523,955,183Hispanic9.11,852,08678.920,260,62125,694,070Black
%8.712,842,254%93.3146,779,643157,373,713WhiteRace/Hispanic origin
6.86,573,01586.496,387,512111,548,061Female%10.610,210,452%92.696,291,891103,988,719Male
Gender
%8.716,783,467%89.4192,687,190215,536,780Total
PercentNumberPercentNumberage 16 or oldercharacteristicby police in 2002a few times a year or morepopulationDemographicDrivers stoppedPopulation who driveU.S.
Table 7. Gender, race/Hispanic origin, and age of all drivers compared to driversstopped by police, 2002
Note: Detail may not add to total because ofrounding.
8.21,371,64060 or older12.42,074,38950-5919.33,235,07340-4922.33,741,42130-3928.04,707,38120-29
%9.91,653,56316-19Age
2.9493,256Other race9.51,595,872Hispanic
11.01,852,086Black%76.512,842,254White
Race/Hispanic origin
39.26,573,015Female%60.810,210,452Male
Gender
%100.016,783,467Total
PercentNumbercharacteristic
Drivers age 16 or older stopped by police in 2002Demographic
Table 6. Gender, race/Hispanic origin,and age of drivers stopped by police,2002

Whites were 76.2% of vehicle driversand 76.5% of those pulled over; blackswere 10.5% of drivers and 11% of driv-ers stopped; and Hispanics were 9.7%of drivers and 9.5% of drivers stoppedby police.
In short, survey results indicated that in 2002, white, black, and Hispanic driv-ers had an equal chance of being pulledover by police in a motor vehicle stop.
Driver age
In 2002, 75% of all persons age 16 to19 indicated they were drivers of amotor vehicle. Among persons in theirtwenties, thirties, forties, or fifties, 90%or more said they drove. Of those age60 or older, 82% operated a vehicle.
Generally, the younger the driver, thegreater the likelihood that he or she waspulled over by police in 2002. The oneexception was for teenage drivers anddrivers in their twenties, who did not dif-fer in their likelihood of being stoppedby police — 13.6% of drivers age 16 to 19 and 14% of drivers age 20 to 29.For those over age 30, the probability of being stopped by police in 2002decreased with age: 9.8% of those intheir thirties were pulled over by police,7.8% of those in their forties, 6.8% ofthose in their fifties, and 3.8% of driversage 60 or older.
Reason for being stopped
Surveyed drivers were asked what rea-son the officer gave for the stop:
• Most (54.8%) said "speeding" (table8).
• 9.3% said a "vehicle defect" (burnedout taillight, loud muffler, and so forth).
• 1.3% said a "roadside check for drunkdrivers." (Police may not stop motoristsrandomly at roadblocks to search fordrugs but may stop motorists randomlyto search for drunken drivers.)
• 11.5% said a "record check" of somesort (for example, a check for driver'slicense or insurance coverage or vehi-cle registration).
• 4.4% said they were stopped for a“seatbelt violation” (for example, a pas-senger in the vehicle was not wearing aseatbelt, or a small child was notsecured in a child safety seat).
• 4.9% said “illegal turn/lane change”(for example, the driver did not usehis/her signal properly, or turned thewrong way down a one-way street).
• 7.1% said a stopsign or stoplightviolation.
• 4.2% said "some other traffic offense"(following too closely, reckless driving,lights not on, loud music, curfew viola-tion, throwing a cigarette out a window,and so forth).
• A small percentage of stopped drivers(2.1%) said police had not given a rea-son for the stop.
Driver gender
Females were more likely than males tosay the reason for the stop was "speed-ing" (females 57.9%, males 52.8%).Males were more likely than females toindicate "vehicle defect" (males 10.6%,females 7.4%) and somewhat morelikely to say "seatbelt violation" (males4.8%, females 3.7%). Otherwise, therewere no significant differences betweenthe genders. For example, males(1.4%) and females (1.1%) were notsignificantly different in giving “roadsidecheck for drunk drivers” as the reason.
Driver race/Hispanic origin
Whites were more likely than blacksand Hispanics to say the reason for thestop was "speeding" (whites 57%,blacks 50%, and Hispanics 44.4%).Hispanics were more likely than whitesand somewhat more likely than blacksto say they were stopped for a "vehicledefect" (Hispanics 14%, whites 8.7%,and blacks 10.3%). Blacks (17.4%)were more likely than whites (11.3%) orHispanics (7.8%) to say the reason theywere stopped was for a record check.
Contacts between Police and the Public, 2002 5

Driver age
Speeding — The most consistent find-ing was that drivers in the youngest agecategory (age 16 to 19) were more likely(59.6%) than drivers in their forties(53.4%), fifties (49.1%), and sixties orolder (51.4%) to give "speeding" as thereason for being stopped.
Vehicle defect — Drivers in their teens(14.1%) and twenties (11.9%) weremore likely than drivers in each of theolder age categories to say the reasonthey were stopped was a "vehicledefect."
Record check — The most consistentfinding was that teenage drivers (5.2%)and drivers in their twenties (8.8%)were less likely than drivers in each ofthe older age categories to say theywere stopped for a "record check."
6 Contacts between Police and the Public, 2002
Note: Detail may not add to total because of rounding. Table excludes 2.1% of stopped drivers who said the police had not given a reason for the stop.*Estimate is based on 10 or fewer sample cases.
418,028708,9181,186,578817,543740,1361,930,284215,3261,567,3129,199,34216,783,467Estimated number
2.13.97.25.86.116.2*1.26.051.410060 or older2.84.57.35.25.216.01.68.249.110050-592.54.18.85.44.312.21.57.853.410040-492.64.45.84.44.812.81.37.356.710030-392.33.37.35.34.08.81.111.956.110020-29
%2.9%6.5%5.6%2.6%*2.4%5.2%*1.1%14.1%59.6%10016-19Age
*1.8*4.412.911.9*4.27.706.950.0100Other race3.56.211.25.75.57.8*1.614.044.4100Hispanic2.93.75.95.13.517.4*1.110.350.0100Black
%2.3%4.0%6.5%4.5%4.4%11.3%1.3%8.7%57.0%100WhiteRace/Hispanic origin
1.93.97.64.93.711.51.17.457.9100Female%2.9%4.4%6.7%4.9%4.8%11.5%1.4%10.6%52.8%100Male
Gender
%2.5%4.2%7.1%4.9%4.4%11.5%1.3%9.3%54.8%100 Total
OtherOther trafficoffense
Stop sign/lightviolation
Illegal turn/lane change
Seatbeltviolation
Recordcheck
Roadside check for drunk drivers
VehicledefectSpeedingTotal
Characteristic of stopped driver
Reason police gave for traffic stop
Table 8. Reasons police gave for stopping vehicle, by gender, race/Hispanic origin, and age of stopped drivers, 2002
Driver opinion on being stopped
The vast majority of drivers pulledover by police (84%) felt they hadbeen stopped for a legitimate reason.That opinion was not uniform acrossthe different segments of thepopulation.
Driver gender Females (86%) were more likely thanmales (82%) to say that the stop wasfor a legitimate reason.
Driver race/Hispanic origin
The vast majority of blacks stopped by police (73%) felt they had beenstopped for a legitimate reason. Nevertheless, blacks were less likelythan whites (86%) and somewhat lesslikely than Hispanics (82%) to say thepolice had a legitimate reason forstopping them.
Driver age
There were no significant differencesbetween drivers of one age and driv-ers of another age in terms of theiropinion about whether they had beenstopped for a legitimate reason.
8360 or older8550-598440-498530-398320-29
%8416-19Age
83Other race82Hispanic73Black
%86White
Race/Hispanicorigin
86Female%82Male
Gender
%84Total
Percent of stopped drivers who felt that they had beenstopped for a legitimate reason

Warnings and tickets issued duringtraffic stops
Police issued a traffic ticket to 58.6% of the drivers they stopped (table 9).Another 25.3% received some type ofwarning, either written or verbal. Theremaining 16.1% did not receive a ticketor warning. Driver gender
Females (26.9%) were more likely thanmales (24.2%) to receive a warningfrom police after being pulled over.Males (59.8%) were more likely thanfemales to be ticketed (56.8%).
Driver race/Hispanic origin
Compared to black drivers (18.3%),Hispanic drivers (18.2%), and drivers ofother races (20.3%), white drivers(27.4%) were more likely to be issued awarning during a traffic stop.
Blacks (58.4%) were not significantlymore likely than whites (56.5%) to beticketed during a traffic stop. Hispanics(71.5%) were more likely than bothwhites (56.5%) and blacks (58.4%) tobe issued a ticket.
Hispanics were 9.5% of stopped driversbut 11.6% of those given a ticket. Com-paratively, whites were 76.5% ofstopped drivers and 73.8% of thoseticketed, and blacks were 11% of driv-ers stopped by police and 11% of tick-eted drivers.
Driver age
Generally, the older the driver, the lowerthe likelihood of receiving a ticket duringa traffic stop. For example, teenagedrivers (58.6%), and drivers in theirtwenties (64.3%), thirties (61.3%), orforties (58.5%) were each more likelythan either drivers in their fifties (50.2%)or drivers age 60 or older (44.9%) to beticketed.
Arresting the driver
Among drivers stopped by police, 2.7%were arrested (table 9). Arrestsoccurred for a variety of reasons, suchas —
• Failing a sobriety test• Having drugs or an illegal weapon on the driver or in the vehicle• Having an outstanding warrant for arrest • Assaulting the police officer.
Driver gender
Stopped males (3.7%) were more likelythan stopped females (1.1%) to bearrested.
Driver race/Hispanic origin
Blacks (5.8%) and Hispanics (5.2%)stopped by police were more likely thanwhites (2%) to be arrested.
Blacks were 11% of drivers stopped bypolice but 23.8% of drivers who werearrested, and Hispanics were 9.5% ofstopped drivers but 18.4% of thosearrested. Whites were 76.5% ofstopped motorists and 58% of driversarrested.
Driver age
Drivers in their twenties (3.7%) or thir-ties (2.9%) were more likely than driversin their fifties (1.5%) to be arrested bypolice during a traffic stop. No other sig-nificant differences in the likelihood ofarrest were found between drivers ofdifferent age groups.
Contacts between Police and the Public, 2002 7
Time of day of traffic stop
All other things being equal, if policepractice racial profiling of blackdrivers, blacks as a percentage of alldaytime traffic stops should be greaterthan blacks as a percentage of allnighttime stops. Why? Because policecan identify the race of drivers moreeasily during the day than at night.
To investigate the issue, daytime traf-fic stops were compared to nighttimestops. Of the 10.1 million white and black drivers stopped during the day
in 2002, about 1.1 million — 11% —were black.
Of the 4.6 million white and black drivers stopped at night, approxi-mately 700,000 — 15% — were black.These results indicate that blackswere a smaller — not greater — percentage of daytime (11%) thannighttime (15%) traffic stops, providingno specific evidence of differentialstops based on the visibility of thedriver's race.
15700,000111,100,000Black85%3,900,00089%9,000,000White
100%4,600,000100%10,100,000Total
PercentNumberPercentNumberAt nightDuring the day
Race of stopped driver
Drivers stopped —
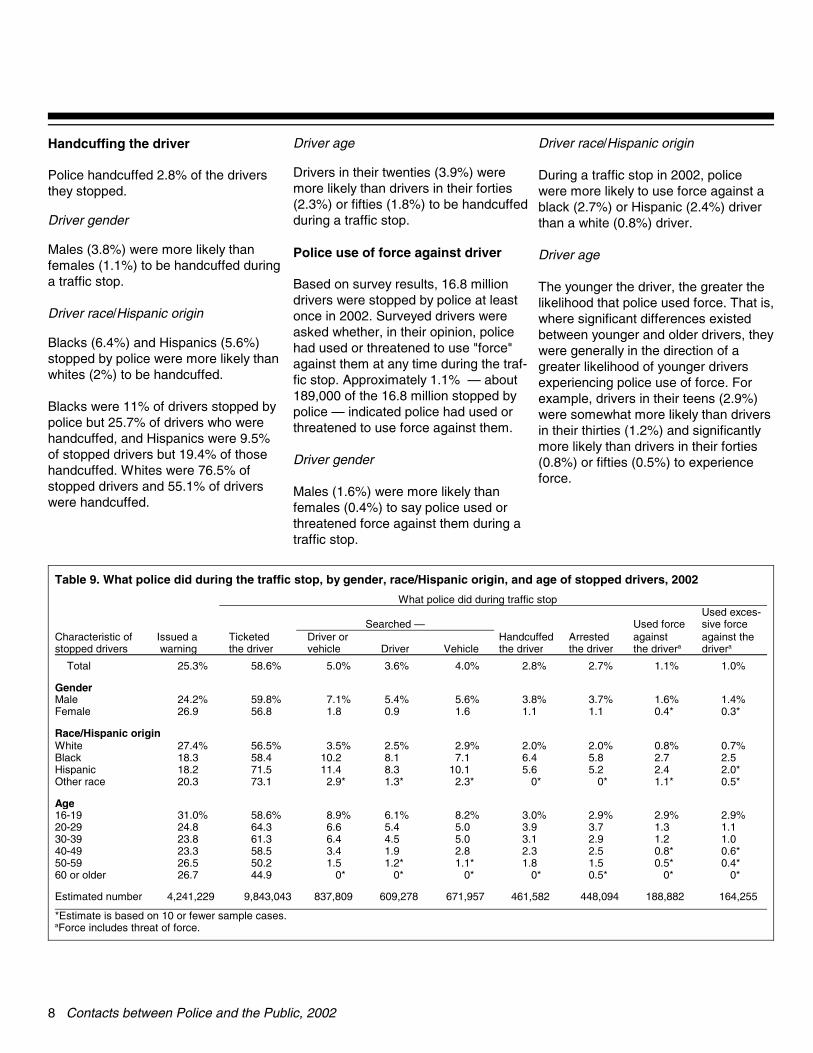
Handcuffing the driver
Police handcuffed 2.8% of the driversthey stopped.
Driver gender
Males (3.8%) were more likely thanfemales (1.1%) to be handcuffed duringa traffic stop.
Driver race/Hispanic origin
Blacks (6.4%) and Hispanics (5.6%)stopped by police were more likely thanwhites (2%) to be handcuffed.
Blacks were 11% of drivers stopped bypolice but 25.7% of drivers who werehandcuffed, and Hispanics were 9.5%of stopped drivers but 19.4% of thosehandcuffed. Whites were 76.5% ofstopped drivers and 55.1% of driverswere handcuffed.
Driver age
Drivers in their twenties (3.9%) weremore likely than drivers in their forties(2.3%) or fifties (1.8%) to be handcuffedduring a traffic stop.
Police use of force against driver
Based on survey results, 16.8 milliondrivers were stopped by police at leastonce in 2002. Surveyed drivers wereasked whether, in their opinion, policehad used or threatened to use "force"against them at any time during the traf-fic stop. Approximately 1.1% — about189,000 of the 16.8 million stopped bypolice — indicated police had used orthreatened to use force against them.
Driver gender
Males (1.6%) were more likely thanfemales (0.4%) to say police used orthreatened force against them during atraffic stop.
Driver race/Hispanic origin
During a traffic stop in 2002, policewere more likely to use force against ablack (2.7%) or Hispanic (2.4%) driverthan a white (0.8%) driver.
Driver age
The younger the driver, the greater thelikelihood that police used force. That is,where significant differences existedbetween younger and older drivers, theywere generally in the direction of agreater likelihood of younger driversexperiencing police use of force. Forexample, drivers in their teens (2.9%)were somewhat more likely than driversin their thirties (1.2%) and significantlymore likely than drivers in their forties(0.8%) or fifties (0.5%) to experienceforce.
8 Contacts between Police and the Public, 2002
*Estimate is based on 10 or fewer sample cases.aForce includes threat of force.
164,255188,882448,094461,582671,957609,278837,8099,843,0434,241,229Estimated number
*0*0*0.5*0*0*0*044.926.760 or older*0.4*0.51.51.8*1.1*1.21.550.226.550-59*0.6*0.82.52.32.81.93.458.523.340-49
1.01.22.93.15.04.56.461.323.830-391.11.33.73.95.05.46.664.324.820-29
%2.9%2.9%2.9%3.0%8.2%6.1%8.9%58.6%31.016-19Age
*0.5*1.1*0*0*2.3*1.3*2.973.120.3Other race*2.02.45.25.610.18.311.471.518.2Hispanic
2.52.75.86.47.18.110.258.418.3Black%0.7%0.8%2.0%2.0%2.9%2.5%3.5%56.5%27.4White
Race/Hispanic origin
*0.3*0.41.11.11.60.91.856.826.9Female%1.4%1.6%3.7%3.8%5.6%5.4%7.1%59.8%24.2Male
Gender
%1.0%1.1%2.7%2.8%4.0%3.6%5.0%58.6%25.3 Total
against thedrivera
againstthe drivera
Arrested the driver
Handcuffed the driverVehicleDriver
Driver orvehicle
Ticketed the driver
Issued a warning
Characteristic ofstopped drivers
Used exces-sive forceUsed forceSearched —
What police did during traffic stop
Table 9. What police did during the traffic stop, by gender, race/Hispanic origin, and age of stopped drivers, 2002

Police use of excessive force against driver
Of the estimated 189,000 drivers whohad force used against them by policeduring a traffic stop, about 164,000 feltthe force was "excessive" (table 9). The164,000 represent about 87% of the189,000 drivers who experienced policeuse of force and about 1% of the 16.8million drivers stopped by police.
Driver gender
Males (1.4%) were more likely thanfemales (0.3%) to say police had usedexcessive force during a traffic stop.
Driver race/Hispanic origin
Black drivers (2.5%) stopped by policewere significantly more likely thanstopped white drivers (0.7%) to say thatpolice used excessive force againstthem.
Stopped Hispanics (2%) were some-what more likely than stopped whites(0.7%) to feel that excessive force hadbeen used.
Driver age
The younger the driver, the greater thelikelihood the driver would indicate thatpolice used excessive force againstthem. That is, where significant differ-ences existed between younger andolder drivers, they were always in thedirection of a greater likelihood ofyounger drivers saying that excessiveforce had been used. For example,stopped drivers in their teens (2.9%)were somewhat more likely than driversin their twenties (1.1%) or thirties (1%)to say excessive force was used duringa traffic stop. Similarly, drivers in theirteens (2.9%) were more likely than driv-ers in their forties (0.6%) or fifties(0.4%) to report excessive force duringa motor vehicle stop.
Contacts between Police and the Public, 2002 9
Race of officers in traffic stops
The 2002 PPCS uncovered evidenceof black drivers’ having worse experi-ences — more likely to be arrested,more likely to be searched, more likelyto have force used against them —during traffic stops than white drivers.Were these worse experiences occur-ring regardless of the race of the offi-cer who made the traffic stop? Toanswer this question, black and whitedrivers stopped by white officersshould be compared, and black andwhite drivers stopped by black officersshould be compared. Results from the 1999 PPCS sug-gested that the various racial dispari-
ties in traffic stop outcomes had nomeasurable relationship to the race ofthe officer who made the stop. In 1999black drivers stopped by police gener-ally had a worse outcome than whitedrivers, whether they were stopped bya white or a black officer.
However, in the 2002 PPCS, the sam-ple size of drivers stopped by blackofficers was too small for reliableanalyses. Because of the small sam-ple size, this report is not able to esti-mate whether the race of the officerwho made the traffic stop was relatedto what occurred during the stopamong drivers stopped in 2002.
Driver opinion on whether policeacted properly
An estimated 88% of the 16.8 milliondrivers stopped by police felt policehad behaved properly during the stop.
Driver gender
Opinion was divided between themales and females stopped by police.When asked if police had behavedproperly or improperly, males (87%)
were less likely than females (90%) to say "properly."
Driver race/Hispanic origin
Of the nearly 12.8 million white driversstopped by police, 90% felt police hadbehaved properly during the trafficstop. That compares to 78% of the 1.9million black drivers and 85% of the1.6 million Hispanic drivers stopped.Though vast majorities of blacks andHispanics felt police had behavedproperly, black and Hispanic driverswere less likely than white drivers tohold that opinion.
Driver age
While the percentage of drivers age60 or older (93%) did not differ statisti-cally from that of drivers in their fifties(90%), in believing that the police hadacted appropriately, the older driverswere more likely than drivers in theirteens (87%), twenties (86%), thirties(89%), or forties (88%) to feel policehad behaved properly.9360 or older
9050-598840-498930-398620-29
%8716-19Age
87Other85Hispanic78Black
%90White
Race/Hispanicorigin
90Female%87Male
Gender
%88Total
Percent of stopped drivers whofelt that the police had behavedproperly during the traffic stop

Searching the driver, vehicle, or both
During a traffic stop police sometimesconduct a search for drugs, open con-tainers of alcohol, stolen property, orother evidence of criminal wrongdoing.The search may be of the vehicle, of thedriver, or of both the vehicle and thedriver.
In 5% of the 16.8 million traffic stopsdocumented in the 2002 nationalsurvey, police searched the driver, thevehicle, or both. The 5% representapproximately 838,000 drivers whowere physically searched and/or hadtheir vehicle searched by police. Of thenearly 838,000 searches, 28% weresearches just of the vehicle, 19% weresearches just of the driver, and 53%were searches of both the driver andthe vehicle.
Driver gender
Police were more likely to conduct asearch of the vehicle and/or the driver in traffic stops of males (7.1%) than offemales (1.8%).
Driver race/Hispanic origin
Black (10.2%) and Hispanic (11.4%)motorists stopped by police were morelikely than whites (3.5%) to be physicallysearched or have their vehiclesearched.
Blacks were 11% of drivers stopped bypolice but 22.5% of drivers who werephysically searched or whose vehiclewas searched, and Hispanics were9.5% of stopped drivers but 21.7% ofthose searched. Whites were 76.5% ofstopped drivers and 54.1% of thosewho had some type of search.
Driver age
Drivers under the age of 40 had agreater likelihood than drivers age 40 orolder of being frisked or having theirvehicle searched. Drivers in the young-est three age categories — teenagedrivers (8.9%), drivers in their twenties(6.6%), and drivers in their thirties(6.4%) — were all more likely than driv-ers in their forties (3.4%) and fifties(1.5%) to be physically searched orhave their vehicle searched.
Searching the driver
Overall, 3.6% of stopped drivers werephysically searched by police (table 9).Such body searches often involve thedriver being frisked or lightly patteddown by the officer. Sometimes, thesearch is more invasive, involving, forexample, the officer’s reaching into thedriver's clothing.
Driver gender
Driver searches (as distinct from vehiclesearches) were more common amongmale drivers (5.4%) than female drivers(0.9%).
Driver race/Hispanic origin
Black (8.1%) and Hispanic (8.3%)motorists stopped by police were morelikely than white motorists (2.5%) to besubjected to a search of the driver.
Blacks were 11% of drivers stopped bypolice but 24.6% of drivers who werephysically searched, and Hispanicswere 9.5% of stopped drivers but 21.9%of those physically searched. Whiteswere 76.5% of stopped drivers and52.5% of the ones who were physicallysearched.
Driver age
The younger the driver, the greater thelikelihood of a search of the driver.That is, where significant differencesexisted between younger and older driv-ers, they were always in the direction ofa greater likelihood of younger driversbeing physically searched. Drivers intheir teens (6.1%), twenties (5.4%), andthirties (4.5%) were more likely thandrivers in their forties (1.9%) to befrisked by police during a traffic stop in 2002.
Searching the vehicle
Police searched the vehicle in 4% of traffic stops (table 9).
Driver gender
Police were more likely to search avehicle driven by a male (5.6%) than a female (1.6%).
Driver race/Hispanic origin
Police were more likely to search avehicle driven by a black (7.1%) or His-panic (10.1%) driver than by a white(2.9%) driver.
Blacks were 11% of drivers stopped bypolice but 19.6% of drivers whose vehi-cle was searched, and Hispanics were9.5% of stopped drivers but 24% of driv-ers of searched vehicles. Whites were76.5% of stopped drivers and 54.9% ofthose whose vehicle was searched.
10 Contacts between Police and the Public, 2002

Driver age
The younger the driver, the greater thelikelihood of a vehicle search. Morespecifically, where significant differ-ences existed between younger andolder drivers, they were always in thedirection of a greater likelihood of avehicle search for the younger drivers.Vehicles driven by teenage drivers(8.2%) were more likely to be searchedthan vehicles driven by those in theirtwenties (5%), thirties (5%), forties(2.8%), or fifties (1.1%).
Searches and racial profiling
One definition of racial profiling is "usingrace as a key factor in deciding whetherto make a traffic stop." Another defini-tion is “using race as a key factor indeciding whether, during a traffic stop,to search the vehicle or the driver."Survey findings reported above indi-cated the following about the likelihoodof searches and the race or Hispanicorigin of the driver:
1. Black (10.2%) and Hispanic (11.4%)motorists stopped by police were morelikely than whites (3.5%) to be physicallysearched or to have their vehiclesearched.
2. Black (8.1%) and Hispanic (8.3%)motorists were more likely than white(2.5%) motorists to be subjected to aphysical search of the driver.
3. Police were more likely to search avehicle driven by a black (7.1%) or His-panic (10.1%) than by a white (2.9%).
However, while the survey data canreveal these racial disparities, they can-not answer the question of whether thedriver's race, rather than the driver'sconduct or other specific circumstancessurrounding the stop, was the reasonfor the search. The survey asked fewquestions about circumstances or driverconduct. For example, having drugs inplain view of police is a circumstancethat would normally warrant a legalsearch of the vehicle. But since the sur-vey did not ask drivers whether anydrugs within plain view were in the vehi-cle, the analysis is necessarily limited.
Contacts between Police and the Public, 2002 11

12 Contacts between Police and the Public, 2002
Figure 1
Of the estimated 837,800 searchesconducted by police in 2002, more thanhalf — 458,300 — were apparently jus-tified because police had obtained thedriver's consent prior to performing thesearch. The remaining 45% (379,500)of searches occurred without thedriver's consent. The percentage ofthese 379,500 nonconsent searchesthat may or may not be justifieddepends on the specific circum-stances of each search.
To determine how many of the 379,500non-consent searches were potentially
justified, two circumstances that typi-cally warrant a nonconsent searchwere investigated: 1) a search con-ducted after a person has been placedunder arrest, and 2) a search con-ducted when police have probablecause to believe the suspect commit-ted a crime. To determine the latter, asearch was treated as a probable-cause search anytime a search uncov-ered evidence of criminal wrongdoing,such as drugs, an open container ofalcohol or other evidence.
Analysis of the survey data indicatedthat 131,200 of the 379,500 non-consent searches were potentially justi-fied. Of these 131,200 searches,84,900 were searches conducted afterthe driver was arrested, and 46,300were probable-cause searches thatrevealed evidence of a crime.
For the remaining 248,300 non-consent searches, the driver was notsearched following an arrest and thesearch did not uncover evidence ofcriminal wrongdoing.
Searches conducted by police during traffic stops
Searches justifiedby consent458,300 / 55% Searches justified by
Searches of the driver, arrest or evidence foundthe vehicle, or both 131,200 / 16%837,800 / 100%
Nonconsentsearches379,500 / 45%
Nonconsent searches withno arrest or evidence found248,300 / 29%

Search of driver, vehicle, or both
Search with or without driver consent
In some jurisdictions an officer need nothave any suspicion to ask for permis-sion to conduct a search. In other juris-dictions police departments require thatthe officer have at least a "reasonablesuspicion" before asking for permissionto conduct a search. In all jurisdictions,if the officer has "probable cause" tobelieve that the person or the vehiclecontains evidence of a crime, the officerdoes not need to ask for permission.
Of the 837,800 searches conductedduring traffic stops in 2002, just overhalf, or about 458,300, were by consent(table 10). The 458,300 consentsearches take one of two forms: 1)either the officer asked permission tosearch and the driver then granted it; or 2) the driver told the officer he/shecould conduct a search without the offi-cer first asking for permission. Theremaining 45% of searches (379,500)were not by consent; either the officerhad not asked permission before con-ducting the search, or the officer askedbut the driver reported saying "no."
Likelihood of search finding criminal evidence
In 11.7% of the 837,800 searches,police found drugs, an illegal weapon,open containers of beer, or other evi-dence of a possible crime. The likeli-hood of finding criminal evidence wasnot significantly different between the379,500 searches without consent(12.2%) and the 458,300 searches withconsent (11.4%) (not shown in table).
Search of driver
Search with or without consent
Nearly half (46%) of all body searcheswere without the driver's consent,according to surveyed drivers.
Likelihood of search finding criminalevidence
Of the 609,300 physical searches, 86%found no criminal evidence, accordingto surveyed drivers.
The likelihood of finding criminal evi-dence was not significantly differentbetween the 280,200 physical searcheswithout consent (14.6%) and the329,100 physical searches with consent(14.1%) (not shown in table).
Search of vehicle
Search with or without consent
More than a third of all vehicle searches(38.5%) were conducted without driverconsent.
Likelihood of search finding criminalevidence
Approximately 86% of vehicle searchesfound no evidence of criminal wrong-doing, according to surveyed drivers.
Vehicle searches without consent(17.6%) were not significantly morelikely than searches with consent(12.4%) to uncover evidence (notshown in table).
Small sample sizes
This report has presented separate statistics on each of four categories:physical searches with consent, physi-cal searches without consent, vehiclesearches with consent, and vehiclesearches without consent. Within eachof the four, it would be desirable to havecomparative statistics by gender, race,and age — for example, for physicalsearches without consent finding crimi-nal evidence, comparing white andblack drivers. But such detailed estimates would be based on samplestoo small to form reliable statisticalcomparisons. Only by combining physi-cal searches and vehicle searches canadditional comparisons be made.
Contacts between Police and the Public, 2002 13
Note: Detail may not add to total because of rounding. A total of 447,009 drivers had both typesof searches. For that reason the sum of the number of searches under the "driver" column and thenumber under the "vehicle" column is greater than the number under the "driver, vehicle, or both"column. Note also that some of the 447,009 drivers consented to one type of search but not theother. In those cases they were classified as a search "without consent" in the "driver, vehicle, orboth" column.
85.6575,21885.7521,89388.3739,415No evidence found%14.496,739%14.387,385%11.798,394Evidence found
Outcome of search
38.5258,73046.0280,22745.3379,471Without consent%61.5413,226%54.0329,051%54.7458,338With consent
Type of search
%100671,957%100609,278%100837,809All searchesTotalnumberTotalnumberTotalnumber
EstimatedEstimatedEstimatedVehicleDriverDriver, vehicle, or both
Search of C
Table 10. Type of search of vehicle or driver and the outcome, 2002

Searching the driver, vehicle, or both: Gender
Search with or without consent
The proportion of all searches (bothphysical and vehicle) that were withoutconsent was not significantly differentfor males (46.4%) and females (38.6%)(table 11).
Likelihood of search finding criminalevidence
The proportion of searches yieldingcriminal evidence was not significantlydifferent for males (10.5%) than forfemales (19.2%).
Searching the driver, vehicle, or both: Race/Hispanic origin
Search with or without consent
Searches (physical or vehicle) of blackdrivers (58.6%) were more likely to bewithout consent than searches of whitedrivers (39.1%).
The percentage of all physical or vehi-cle searches conducted without thedriver’s consent was not significantlygreater for Hispanics (46.2%) than for whites (39.1%).
Likelihood of search finding criminalevidence
Searches of black drivers or their vehi-cles were less likely to find criminal evi-dence (3.3%) than searches of whitedrivers (14.5%), and somewhat lesslikely than searches of Hispanic drivers(13%).
Searching the driver, vehicle, or both: Age
Search with or without consent
Among drivers who were searched,those in their fifties (75.3%) were more
likely to report a non-consent searchthan drivers in their twenties (39.8%) or thirties (42%). No other significantdifferences between age categorieswere found.
Likelihood of search finding criminal evidence
No comparisons are made betweendrivers of different ages because manyof the samples on which the separateage categories are based are too smallto form reliable estimates.
Searching the driver, the vehicle, or both; arresting stopped drivers
Survey data indicate that approximately450,000 drivers were arrested afterbeing pulled over by police in 2002.After an arrest is made, the police willoften conduct a search of the arrestee.After an arrest is made during a trafficstop, the type of search conducted
could be a physical search of the driver,a search of the driver's vehicle, or both.
Of the nearly 450,000 drivers arrestedduring a traffic stop in 2002, three-quarters (74%), or slightly more than329,000 drivers, also experienced asearch of the driver, the vehicle, or both(table 12). An estimated 26% of these329,000 searches were physicalsearches of the driver, 9% were vehiclesearches, and 65% of drivers had botha physical and vehicle search con-ducted (not in a table).
14 Contacts between Police and the Public, 2002
Note: Detail may not add to total because of rounding.*Estimate is based on 10 or fewer sample cases.—No case in the sample.
739,41598,394379,471458,338837,809Estimated number
—————60 or older*78.3*21.7*75.3*24.710050-59
95.4*4.652.447.610040-4992.2*7.842.058.010030-3988.4*11.639.860.210020-29
%78.4%*21.6%50.6%49.4%10016-19Age
*73.5*26.5*48.1*51.9100Other race87.0*13.046.253.8100Hispanic96.7*3.358.641.4100Black
%85.5%14.5%39.1%60.9%100WhiteRace/Hispanic origin
80.8*19.238.661.4100Female%89.5%10.5%46.4%53.6%100Male
Gender
%88.3%11.7%45.3%54.7%100Total
No evidencefound
Evidencefound
Withoutconsent
Withconsent
All searches
Outcome of searchType of searchDemographiccharacteristic ofsearched driver
Search of the driver or the vehicle
Table 11. Type and outcome of searches conducted by police duringtraffic stops, 2002
Note: Detail may not add to total because ofrounding. The 329,347 include searches ofthe driver, the vehicle, or both.
26118,748Driver was not searched74%329,347Driver was searched
100%448,094Total arrestedPercentNumber
Table 12. Among drivers arrested bypolice, percent searched, 2002

Searches subsequent to arrest
In 2002, of the 329,000 drivers whowere searched and arrested, 58% weresearched after being arrested (table13). Twenty-three percent of the192,000 searches conducted subse-quent to arrest were physical searchesof the driver, 12% were vehiclesearches, and 65% were searches of both the driver and the vehicle (not in a table).
The remaining 42% of drivers searchedand arrested were searched beforebeing arrested (table 13). Of these137,000 drivers who were searchedprior to their arrest, 17% were physicallysearched, 7% had their vehiclesearched, and 76% had both a physicaland vehicle search conducted (not in atable).
Search with or without consent
Among the 329,000 drivers searchedand arrested in 2002, 144,000, or43.7%, were searched without theirconsent (table 14).
Searches following an arrest (53%)were somewhat more likely thansearches prior to arrest (30.9%) to beconducted without the driver's consent.This difference may be attributed to thecommon police practice of searching anarrestee and his or her belongings fol-lowing an arrest; for those searches,police do not need to seek or obtain thedriver’s permission.
Likelihood of search finding criminalevidence
Evidence was found during a search ofthe driver, vehicle, or both for about afifth of the 329,000 drivers who weresearched and arrested in 2002 (table14).
No comparisons of the likelihood offinding criminal evidence were madebetween drivers searched before anarrest and those searched after anarrest because the sample sizes forthese categories were too small to formreliable estimates.
Contacts between Police and the Public, 2002 15
Note: Detail may not add to total because of rounding.*Estimate is based on 10 or fewer sample cases.
260,52768,819143,865185,481329,347Total searchedand arrested
83.5*16.553.047.0100After arrest%73.1%*26.9%30.9%69.1%100Before arrest
Search occurred —
%79.1%20.9%43.7%56.3%100Total
No evidencefound
Evidencefound
Withoutconsent
Withconsent
All driverssearchedand arrested
Outcome of searchType of search
Search of the driver or the vehicle
Table 14. Among drivers arrested and searched by police, type and outcome of searches, by whether the search occurred before or after the arrest, 2002
Note: Detail may not add to total because ofrounding. The 329,347 include searches ofthe driver, the vehicle or both.
58191,926After arrest42%137,421Before arrest
Search occurred —
100%329,347TotalPercentNumber
Drivers searchedand arrested
Table 13. Among drivers arrested and searched by police, percent ofsearches that occurred before or after the arrest, 2002

In the 2002 PPCS, respondents whosaid they had a face-to-face contactwith police were then asked whether thepolice officer(s) used or threatened touse physical force against them duringthis contact.
In 2002 an estimated 664,500 personsage 16 or older had a contact withpolice in which force was used orthreatened against them (table 15). This estimate is about 1.5% of the 45.3million people reporting face-to-facepolice contact during 2002 (table 16).The estimate of 664,500 in 2002 repre-sents an increase from 1999, when thePPCS that year estimated approxi-mately 422,000 persons age 16 or olderhaving a contact in which police used orthreatened force. Also, the 2002estimate of 1.5% experiencing the useor threat of force by police representsan increase from less than 1% (0.98%)in 1999.
About three-quarters (75.4%) of thoseexperiencing force in 2002 felt the forceused or threatened by the police wasexcessive (table 20).*
Among all persons who had a policecontact in 2002, 52.8% were male.However, among those who reportedthat they were threatened with force oragainst whom force was used, 78.3%were male (table 15).
Persons age 16 to 29 were 33.6% ofthe estimated 45 million who had apolice contact but 57.5% of thoseexperiencing force during a contact. The median age of those experiencingforce was 26.
Whites comprised 76.7% of all personswith a police contact, blacks 11%, andHispanics 9.3%. About 56% of those
experiencing force were white, 26%black, and 15.5% Hispanic.
Likelihood of experiencing force
Gender
Among persons 16 years or older with aface-to-face contact, females (0.7%)were less likely than males (2.2%) tohave had a contact with police thatresulted in force (table 16).
Race/Hispanic origin
Among those persons age 16 or olderwith a face-to-face contact, blacks(3.5%) and Hispanics (2.5%) were morelikely than whites (1.1%) to havereported that the police used or threat-ened force against them.
Police use of force
16 Contacts between Police and the Public, 2002
Note: Detail may not sum to total because of rounding.See Appendix table for distribution of unweighted cases.*Estimate based on 10 or fewer sample cases.aThe standard error of the estimate of the total number of persons reporting the use or threat of force is 50,658.
9.663,6141 million or more8.254,489500,000-999,999
16.9112,213100,000-499,999 %65.3434,142Under 100,000
Size of jurisdiction where resided
*3.120,53760 or older7.549,71750-59
14.395,28540-4917.6116,77430-3934.6230,02820-29
%22.9152,11816-19Age
*2.315,284Other race15.5102,670Hispanic26.0172,658Black
%56.3373,847WhiteRace/Hispanic origin
21.7144,281Female%78.3520,178Male
Gender
%100664,458aTotal
Percent Number
Contacts with police in which force was used or threatenedDemographic
characteristic
Table 15. Demographic characteristics of residentsage 16 or older whose contact involved police use of force in 2002
*In this report “use of force” includes threat offorce unless otherwise indicated.
Note: Detail may not sum to total because of rounding.*Estimate based on 10 or fewer sample cases.
3.063,6142,116,1061 million or more3.054,4891,818,598500,000-999,999 1.7112,2136,763,356100,000-499,999 1.3%434,14234,580,825Under 100,000
Size of jurisdictionwhere resided
0.4*20,5374,800,11760 or older0.849,7176,006,82850-591.095,2859,494,71640-491.2116,7749,745,29830-392.1230,02810,917,69320-293.5%152,1184,314,23116-19
Age
1.1*15,2841,377,332Other race2.5102,6704,191,712Hispanic3.5172,6584,966,388Black1.1%373,84734,743,452White
Race/Hispanic origin
0.7144,28121,394,234Female2.2%520,17823,884,649Male
Gender
1.5%664,45845,278,884Total
PercentNumber
Contacts with police in which force was used or threatened
Number ofpersons withpolice contact
Demographiccharacteristic
Table 16. Among residents age 16 or older who had contact withpolice in 2002, percent whose contact involved police use of force,by demographic characteristics of residents

Age
Persons age 16 to 29 (2.5%) with policecontact were more likely than thoseover age 29 (0.9%) to have had forceused against them (not in table).
Reason for contact
Persons whose contact was police-initiated (such as a traffic stop) weremore likely than those whose contactwas not initiated by the police (such asasking police for assistance) to experi-ence police use or threat of force (2.1%versus 0.6%) (table 17). Police-initiatedcontacts were 58.5% of the 45.3 millioncontacts in 2002 but 83.5% of the664,500 contacts involving police force(table 18). Persons whom police suspected ofsomething or who had contact througha criminal investigation represented arelatively large percentage of the664,500 force incidents, as comparedto their representation of all personswith contact in 2002. Residentssuspected of something by policeaccounted for a percentage of the forceincidents (18.6%) that was 7 timeshigher than their portion of all contacts(2.6%). Persons whose contactoccurred because of a criminal investi-gation accounted for a percentage offorce incidents (13%) that was twice ashigh as their percentage of all contacts(5.8%). Type of force used
Residents who experienced force or thethreat force were asked to describe thetype of force. An estimated 42% of the664,500 force incidents involved thepolice pushing or grabbing the resident(table 19). An additional 8% of the forceincidents involved the police kicking orhitting the resident.
Among those persons involved in aforce-related incident, 18.9% had police
Contacts between Police and the Public, 2002 17
Note: Detail may not sum to total because of rounding.*Estimate based on 10 or fewer sample cases.aIncludes contact initiated by the resident or someone other than the police, such as a familymember or acquaintance of the resident.
4.8113,8182,387,828Other reason10.7123,5161,158,167Suspected of something by police3.386,4802,615,255Police were investigating crime
*0.517,9253,264,503Police provided assistance or service0.668,00811,959,548Reported crime or problem to police
*2.935,2791,218,470Passenger during traffic stop1.1188,82216,783,467Driver during traffic stop
%*0.530,6105,891,645Traffic accidentReason for contact
0.6109,33018,795,090Not police-initiateda
%2.1555,12926,483,794Police-initiatedType of contact
%1.5664,45845,278,884Total
PercentNumber
Contacts with police in which force was used or threatened
Number ofpersons withpolice contact
Table 17. Among residents age 16 or older who had contact with police in 2002,percent whose contact involved police use of force, by type of and reason forcontact
Note: Detail may not sum to total because of rounding.*Estimate based on 10 or fewer sample cases.aIncludes contact initiated by the resident or someone other than the police, such as a familymember or acquaintance of the resident.
5.317.1113,818Other reason2.618.6123,516Suspected of something by police5.813.086,480Police investigating crime7.2*2.717,925Police provided assistance or service
26.410.268,008Reported crime or problem to police2.7*5.335,279Passenger during traffic stop
37.128.4188,822Driver during traffic stop%13.0%*4.630,610Traffic accident
Reason for contact
41.516.5109,330Not police-initiateda%58.5%83.5555,129Police-initiated
Type of contact
%100%100664,458Total
Percent Number Percent with policecontact in 2002
Contacts with police in which force was used or threatened
Table 18. Type of contact and reason for contact with police among residentsage 16 or older whose contact involved police use of force in 2002
Note: Detail may not sum to total because of rounding. Percents do not sum to 100 becausesome respondents reported more than one type of force or threat of force.
56.8377,628Used or threatened to use any other force 18.9125,872Officer(s) pointed gun at resident 8.254,682Kicked or hit by officer(s)
%41.8277,433Pushed or grabbed by officer(s)
%100664,458Total
Percent NumberType of force used or threatened by police
Contacts with police in which force was used or threatened
Table 19. Type of force police used or threatened against residents age 16 orolder during face-to-face contact in 2002

point a gun at them. Over half of the664,500 residents experienced othertypes of force or threats, such as thethreat to fire a gun or use chemicalspray.
Amount of force
Residents involved in a force incidentwere asked if they felt any of the physi-cal force used or threatened againstthem was excessive. Most (75.4%) ofthe 664,500 people involved in a police-use-of-force incident thought the forceused or threatened was excessive(table 20). Whites (71.6%) involved inforce incidents were not more likelythan blacks (77.7%) to say the forcewas excessive. Among Hispanics withforce used against them, 84.6% felt itwas excessive. The differencesbetween estimates for whites (71.6%),blacks (77.7%), and Hispanics (84.6%)were not statistically significant.
Injuries from force
Overall, about 14% of the approxi-mately 664,500 persons involved in aforce or threat-of-force incident wereinjured as a result of the police action(table 21). Twelve percent of whites,21.5% of Hispanics, and 15.4% ofblacks in force incidents were injured.These differences were not statisticallysignificant.
Characteristics of incident
More than half of those involved in aforce or threat-of-force incident werephysically searched or, if they were in atraffic stop, had their vehicle searched.About 7% of the persons with forcereported that during the course of theforce incident the police found possibleevidence of a crime (such as drugs, anopen alcohol container, or a weapon onor near them or in their vehicle after atraffic stop) (table 22).
Forty percent of the 664,500 personsinvolved in a contact with force had atleast one charge filed against them C
ranging from a traffic offense topossessing a weapon (table 23). Atraffic-related offense was one of themost common charges (13.9%).
Ten percent were charged with disor-derly conduct. About 5% were chargedwith resisting arrest, and 2.5% werecharged with a drug offense.
18 Contacts between Police and the Public, 2002
Note: Included are items found in the vehiclesof stopped drivers. Respondents could reportmore than one item found in a search. *Estimate based on 10 or fewer samplecases.
1.6*10,633Other evidence of crime
1.6*10,491Open alcohol container(s)
2.3*15,316Drugs2.9*19,580Weapons6.5%43,309
Persons with anyevidence found
100%664,458Total
PercentNumber
Contacts with police inwhich force was used or threatenedType of criminal
evidence found
Table 22. Type of criminal evidencefound on or near residents age 16 orolder during contact that involvedpolice use of force in 2002
Note: Detail may not add to total because of rounding.*Estimate based on 10 or fewer sample cases.
*79.612,15915,284Other race84.686,908102,670Hispanic77.7134,075172,658Black
%71.6267,664373,847White
%75.4500,806664,458Total
Percent Number
Contacts with police in which force used or threatened was excessive
Number of personsagainst whom force wasused or threatened
Race/Hispanic origin ofresident
Table 20. Among residents age 16 or older whose contact involved police use of force in 2002, percent who felt the force used or threatened was “excessive,” by race/Hispanic origin of residents
Note: Detail may not sum to total because of rounding. Zero represents no cases in sample. *Estimate based on 10 or fewer sample cases.
0*015,284Other race21.5*22,101102,670Hispanic15.4*26,530172,658Black11.7%43,637373,847White
13.9%92,268664,458Total
PercentNumber
Persons injured during contact in which force was used or threatened
Number of personsagainst whom force wasused or threatened
Race/Hispanic origin ofresident
Table 21. Among residents age 16 or older whose contact involved police use of force in 2002, percent who were injured, by race/Hispanic origin of residents
Note: Respondents could report more thanone type of charge.*Estimate based on 10 or fewer samplecases.
14.596,448Other charge13.992,159Traffic offense9.764,717Disorderly conduct0.5*3,460
Possession of a weapon
2.5*16,463Drug offense4.530,095Resisting arrest0.9*6,311Assaulting an officer
39.5%262,342
Persons with atleast one chargefiled
100%664,458Total
Percent Number
Contacts with police inwhich force was used or threatenedType of offense
charge
Table 23. Type of charge filed againstresidents age 16 or older whosecontact involved police use of force in 2002

Conduct of resident during forceincident
Persons who had contact with policewere asked about their behaviors duringthe encounter that could have provokedthe officer(s) to use or threaten force.Among the 664,500 persons experienc-ing police use or threat of force, 1 in 4self-reported that they argued with,cursed at, insulted, or verbally threat-ened the officer(s) (table 24). About 6%of those involved in a force incidentresisted being handcuffed, arrested, orsearched.
Other actions reported by personsexperiencing police force includeddisobeying or interfering with theofficer(s) (6%), trying to get away (3%),and fighting the police (0.5%).
There were too few cases of white,black, and Hispanic residents involvedin a force incident to provide reliableestimates about their conduct during the police contact.
Conduct of resident and the likelihood that police used or threatened force
Persons who engaged in behavior thatcould have provoked police to use forcewere significantly more likely to experi-ence the use or threat of force. Policeused or threatened force against 1.1%of the 44.5 million persons who did notengage in behavior that could haveprovoked the officer(s) compared to: 23% of the estimated 706,000
persons who argued with, cursed at,insulted, or verbally threatened thepolice (table 25)
34% of those who disobeyed or inter-fered with the officer(s)
41% of those who tried to get away orescape
30% of persons who pushed, grabbedor hit the officer(s)
68% of persons who resisted beinghandcuffed, arrested, or searched
27% of those who used some otherphysical behavior towards police.
Force and arrests
About 4 in 10 persons who had forceused or threatened against them werearrested during the incident (table 26).Blacks (42.8%) and Hispanics (42.5%)
Contacts between Police and the Public, 2002 19
Note: Respondents could report more than one type of behavior.*Estimate based on 10 or fewer sample cases.
1.1%487,31244,486,824Residents who did not engage in any of the above behaviors
27.3*3,07111,235Other physical behavior against police68.338,65156,575Resist being handcuffed, arrested, or searched29.7*3,46011,662Push, grab, or hit officer(s)40.9*20,25449,533Try to get away from police33.939,664117,157Disobey or interfere with officer(s)22.8161,057706,156
Argue with, curse at, insult, or verbally threaten the police
22.4%177,146792,060Residents who engaged in at least one type of behavior
1.5%664,45845,278,884Total
Percent NumberConduct of resident during contact
Contacts with police in whichforce was used or threatened
Number ofpersons withpolice contact
Table 25. Among residents age 16 or older who had contact with police in 2002,percent whose contact involved police use of force, by conduct of residentsduring contact
Note: Respondents could report more than one type of behavior. *Estimate based on 10 or fewer sample cases.
0.5*3,071Other physical behavior against police5.838,651Resist being handcuffed, arrested, or searched0.5*3,460Push, grab, or hit officer(s)3.0*20,254Try to get away from police6.039,664Disobey or interfere with officer(s)
24.2161,057Argue with, curse at, insult, or verbally threaten the police26.7%177,146Residents who engaged in at least one type of behavior
100%664,458Total
Percent Number Conduct of resident during contact
Contacts with police in which force was used or threatened
Table 24. Conduct of residents age 16 or older during contact that involved policeuse of force in 2002
Note: Detail may not add to total because of rounding.*Estimate based on 10 or fewer sample cases.
72.7*94.693.583.287.3Resident felt officer(s) acted improperly
45.1*42.542.833.537.6Arrested45.1*47.546.941.143.7Handcuffed64.2%*58.1%69.1%46.0%54.0%Person or vehicle searched
15,284102,670172,658373,847664,458Total
Other raceHispanicBlackWhiteTotalCharacteristic of force incidentRace/Hispanic origin of resident
Table 26. Among residents age 16 or older whose contact involved police use of force in 2002, characteristics of force incident, by race/Hispanic origin of residents

who experienced police force were notsignificantly more likely than whites(33.5%) to be arrested.
Force and handcuffing
Forty-four percent of the personsexperiencing force were also hand-cuffed during the incident — including41.1% of whites, 46.9% of blacks, and47.5% of Hispanics. These differenceswere not statistically significant.
Resident opinion on whether policeacted properly
The vast majority (87.3%) of thepersons involved in police-use-of-forceincidents felt the police acted improp-erly (table 26). There was some indica-tion that blacks (93.5%) and Hispanics(94.6%) were more likely than whites(83.2%) to contend that the police actedimproperly.
Although 87% of persons reportingpolice use of force felt that the policehad acted improperly, less than 20% ofthe total (about 102,000) took formalaction (table 27). Formal actions includefiling a complaint or a lawsuit.
20 Contacts between Police and the Public, 2002
In 2002 about 501,000 of the 664,500(75.4%) residents age 16 or older whoexperienced force felt the physicalforce used or threatened against themwas excessive. Persons who charac-terized the force as “excessive” wereasked to describe the type of forcethey considered excessive. The follow-ing are nine examples of what inter-viewers recorded:
• Fight was over and officer keptyelling at resident• Forcing respondent’s arms behindhis back
• Grabbed and forced resident intoback of police car• Gun pointed at resident• Handcuffs put on too tight• Resident was running and policegrabbed him by the arm and pushedhim against a car • Officers used insulting words and did not read resident his rights• Officer pushed resident to the ground• Verbal threat to slam respondent’shead into a wall.
Selected responses to the 2002 PPCS question: “What force was excessive?... Describe briefly”
Note: Percents do not sum to 100 because some respondents may have taken more than one type of formal action. *Estimate based on 10 or fewer sample cases.
23.7*24,070Other formal action10.0*10,162Other government agency7.3*7,416Court
13.0*13,157Local prosecutor62.763,699Agency employing officer(s)7.9*7,988Civilian complaint review board
Filing complaint with —
100%101,600Total
PercentNumber Persons taking action against police
Table 27. Type of formal action taken against police by residents age 16 or older whose contact involved police use of force in 2002

The 2002 Police-Public Contact Survey(PPCS) was conducted as a supple-ment to the National Crime VictimizationSurvey (NCVS). During the last 6months of 2002 in which interviewswere conducted, the NCVS sampleconsisted of 93,410 individuals age 16or older. Of these, 10,902, or 11%, wereNCVS non-interviews, though someoneelse in the household was interviewed.In addition to those not interviewed forthe NCVS, 2,261 persons either refusedto participate in the PPCS or said theywere not available for the interview orthe interviewer failed to indicate thespecific reason for not conducting theinterview.
By far the most frequent reason for notcompleting the PPCS in 2002, account-ing for 2,882 respondents, was theexclusion of the proxy interviewsconducted for the NCVS when a personwas unable, for physical, mental, orother reasons, to participate. BJS staffdetermined that caregivers and otherproxy interviewees would have difficultydescribing the details of any contactsbetween police and the sampledrespondent. Another 455 non-Englishspeaking respondents were alsoexcluded from the 2002 PPCS.
The PPCS failed to interview 16,500persons and interviewed 76,910; thistranslates into an 82% response rate for the PPCS, compared to an overallresponse rate of 87% for the NCVS.Among the PPCS interviews conducted,25,993 (34%) were in person and50,917 (66%) were by telephone.
The PPCS national sample, afteradjustment for nonresponse, weights toa national estimate of 215,536,780persons age 16 or older in 2002.
Other information on surveymethodology
Unless indicated otherwise, differencesdocumented in this report were signifi-cant at the .05-level. Certain differenceswere not significant at the .05-level butwere significant at the .10-level. Theterms "some indication" and “somewhatmore likely” refer to differences signifi-cant at the .10-level.
Regarding racial designations given inthe report, "white" refers to non-Hispanic whites, "black" refers tonon-Hispanic blacks, and "other races"refers to non-Hispanics in the "otherraces" category. White Hispanics, blackHispanics, and Hispanics of "otherraces" are categorized in the reportunder the heading "Hispanic."
Due to small samples and concernsabout confidentiality, the report does not provide separate statistics on eachracial category that makes up "otherraces" (Asians, Pacific Islanders, Ameri-can Indians, Native Hawaiians, andAlaska Natives).
Methodology
Contacts between Police and the Public, 2002 21
217765,3011 million or more 166833,111500,000-999,999 342,46211,331100,000-499,999
13811,81057,167Under 100,000
Size of jurisdiction where resided
91,84117,18760 or older182,32212,68350-59303,37615,80540-49423,60515,05930-39693,40711,72120-29411,1804,45516-19
Age
54983,184Other race371,5428,929Hispanic461,4928,101Black
12112,19956,696WhiteRace/Hispanic origin
517,83941,861Female1587,89235,049Male
Gender
20915,73176,910Total persons
Number of personsagainst whom force wasused or threatened
Number of personswith police contact
All surveyrespondentsDemographic characteristic
Appendix table. Number of survey respondents in the 2002 Police-Public ContactSurvey, by demographic characteristics of resident

PPCS-1, Page 1 Black ink Page 1, 100% Pantone 278 Blue
FORM PPCS-1(5-16-2002)
DEPARTMENT OF COMMERCEEconomics and Statistics Administration
U.S. CENSUS BUREAUACTING AS COLLECTING AGENT FOR THE
BUREAU OF JUSTICE STATISTICSU.S. DEPARTMENT OF JUSTICE
J ___________
Sample Control number
PSU Segment CK Serial
ASK OF ALL NCVS SELF-INTERVIEWEDPERSONS AGE 16+
POLICE PUBLIC CONTACT SURVEYSUPPLEMENT TO THE
NATIONAL CRIMEVICTIMIZATION SURVEY
A proxy interview is unacceptable for the PPCS.
D. Reason for PPCS noninterview
F. CONTACT SCREEN QUESTIONS
2002
A. Field Representative’sCode
B. Respondent’scharacteristics
Line no. Age
Last name
MF
001 002 0041
2
Sex
003 WhiteBlack
1
2
3
Race
005 YesNo
1
2
Hispanic Origin
006
C. Type of PPCS interview
Personal (Self)Telephone (Self)Noninterview – FILL ITEM D
1
2
3
007
1
2
3
008
Asian, PacificIslander
4
American Indian,Aleut, Eskimo
Other5
010 1 YesNo2
009
1 YesNo – SKIP to Check Item D2
SKIP to INTRO 1
First name
NOTICE – We are conducting this survey under the authority of Title 13, United States Code, Section 8. Section 9 of this law requires us to keep allinformation about you and your household strictly confidential. We may use this information only for statistical purposes. Also, Title 42, Section 3732,United States Code, authorizes the Bureau of Justice Statistics, Department of Justice, to collect information using this survey. Title 42, Sections 3789gand 3735, United States Code, also requires us to keep all information about you and your household strictly confidential.
PRA Burden Statement – We estimate that it will take between 2 to 10minutes to complete this interview. If you have any comments regardingthese estimates or any other aspect of this survey, send them to the SeniorStatistician, Research and Public Policy Issues, Bureau of Justice Statistics,Washington, DC 20531. According to the Paperwork Reduction Act of 1995,no persons are required to respond to a collection of information unlesssuch collection displays a valid OMB control number.
FIELD REPRESENTATIVE – Complete a PPCS-1 form forall NCVS interviewed persons age 16+. Do NOT completea PPCS-1 form for NCVS Type Z noninterview persons,NCVS proxy interviews, or persons in Type A households.
E. DRIVING HABITS QUESTIONS
FIELD REPRESENTATIVE – Read introduction.
INTRO 1 – Shortly, I will be asking you some additional questions about any contacts you may have had with thepolice during the last 12 months. However, before I get to these questions, I have some questionsabout your use of a motor vehicle.
How often do you usually drive? Is it ...(Read answer categories.)
Almost every day?A few days a week? A few days a month?A few times a year?Never? – ASK item 2
Refused PPCS only Not available for PPCS only Non-English speaking respondent only
1
2
3
4
5
Even though you never drive, do you have adriver’s license?
FIELD REPRESENTATIVE – Read introduction.
SKIP to INTRO 2
INTRO 2 – The next series of questions is about any contacts you may have had with the police during the last12 months. Exclude contacts with private security guards, police officers you see socially, orrelatives who are police officers. Also, exclude any police contacts that occurred because youremployment or volunteer work brought you into regular contact with police officers.
Did you have any contact with a police officerduring the last 12 months, that is, any time since
Were any of these contacts with a police officerin person, that is, face-to-face?
Did you have more than one face-to-face contact?
How many face-to-face contacts with a policeofficer did you have during the last 12 months?
Number of contacts – Read INTRO 3
______________________________________ 1, 2001?
011
1 YesNo – SKIP to Check Item D2
012
1 Yes – ASK item 3d No – SKIP to item 42
013
014
1.
2.
3a.
3b.
3c.
3d.

Yes – ASK item 5bNo Don’t know
PPCS-1, Page 2 Black ink Page 2, 100% Pantone 278 Blue
1
2
G. USE OF FORCE DURING CONTACT
FIELD REPRESENTATIVE – Read introduction.
INTRO 3 – For the rest of the interview, please tell me ONLY about the most recent face-to-face contact youhad with the police.
Was this contact initiated by the police?
During this contact, did the police USE orTHREATEN TO USE force against you for anyreason?
Did the police officer(s)...(Read answer categories.)
Mark (X) all that apply.
Actually push or grab you?Actually kick or hit you?Actually point a gun at you?Use or threaten to use any other forceagainst you? – Specify
Do you feel any of the force used or threatenedagainst you was excessive?
What force was excessive?
Were you injured as a result of any force usedagainst you?
During this contact were you arrested?
During this contact were you handcuffed?
At any time during this contact, did you arguewith, curse at, insult, or verbally threaten thepolice?
Yes No Don’t know
1
2
3
015
016
3SKIP to item 6
1
2
017
3
4
021 1
2
Yes No – SKIP to item 5e
018
019
020
Describe briefly022
023 1
2
Yes No
024 1
2
3
Yes No Don’t know
Yes No Don’t know
025 1
2
3
2
3
Yes No Don’t know
026 1
2
3
2
3
At any time during this contact, did you... (Readanswer categories 1–5.)
Mark (X) all that apply.
Disobey or interfere with the officer(s)?
Push, grab, or hit the police officer(s)?Resist being handcuffed, arrested, orsearched?Physically do anything else? – Specify
None of the above
H. REASON FOR CONTACT
Did this contact occur during a trafficACCIDENT?
Did this contact occur during a traffic STOP?
Were you the driver or passenger of the vehiclethat was stopped?
Did this contact occur because you reported acrime or some other problem to the police?
Did this contact occur because the police wereproviding some sort of service or assistance toyou?
Try to get away?027 1
2
3
4
028
029
030
031 5
6032
033 1
2
Yes – SKIP to Check Item A No
034 1
2
Yes No – SKIP to item 12
035 1
2
Driver – SKIP to item 19 Passenger – SKIP to Check Item A
036 1
2
Yes – SKIP to Check Item ANo
037 1
2
Yes – SKIP to Check Item ANo
Page 2 FORM PPCS-1 (5-16-2002)
4.
5a.
5b.
5c.
5d.
5e.
6.
7.
8.
9.
10.
11a.
11b.
12.
13.
038 1
2
Yes – SKIP to Check item A No
Did this contact occur because the police wereinvestigating a crime?
14.
039 1
2
Did this contact occur because the policesuspected you of something?
Yes – SKIP to Check item A No
15.

Properly – SKIP to Check Item D Improperly – ASK item 18a Don’t know – SKIP to Check Item D
PPCS-1, Page 3 Black ink Page 3, 100% Pantone 278 Blue
1
2
Civilian Complaint Review BoardLaw enforcement agencyemploying the officer(s)
CourtSome other government agency
042
3
SKIP to Check Item D
1
2
044
3
4
045
047
048
Describe briefly040
Yes No Don’t know
050 1
2
3
2
3
H. REASON FOR CONTACT – Continued
What was the reason for this contact?
Yes – SKIP to item 35 on page 5 No – ASK item 17
CHECKITEM A
Number of police officers
Was force used or threatened against therespondent? Is box 1 marked in item 5a?
Looking back on this contact, do you feel thepolice behaved properly or improperly?
Did you take any formal action, such as filing acomplaint or lawsuit against the police?
With whom did you file a complaint or lawsuit?
I. TRAFFIC STOPS
Did the traffic stop occur at night?
How many officers were present?Record actual number.
Yes – ASK item 18b No Don’t know
1
2
043
3
Other – Specify049
SKIP to Check Item DLocal prosecutor046
5
6
051
FORM PPCS-1 (5-16-2002) Page 3
(Was/Were) the police officer(s) White, Black, orsome other race?
If only one box is marked in item 21, SKIP toitem 23.
What race were most of the officers?
J. TRAFFIC STOP – VEHICLE/PERSONAL SEARCH
Whether or not the police officer(s) asked forPERMISSION, at any time during this traffic stopdid you GIVE the police officer(s)...
Did the police officer(s)...
At any time during this traffic stop, did thepolice officer(s)...
052 1 White Black Some other race Don’t know race of any/some
2
3
4
053
054
055
Mostly White Mostly Black Mostly some other race Equal number of each race Don’t know
1
2
3
4
5
056
057 111 2 3
Mark (X) all that apply.
Mark (X) all that apply.
1
2
041
16.
17.
18a.
18b.
19.
20.
21.
22.
23.
24.
25a.
(READ CATEGORIES.)
a. ASK PERMISSION to search the vehicle?
b. ASK PERMISSION to search you, frisk you, orpat you down?
Yes
058
(READ CATEGORIES.)
a. PERMISSION to search the vehicle?
b. PERMISSION to search you, frisk you, or patyou down?
059
060
(READ CATEGORIES.)
a. Search the vehicle?
b. Search you, frisk you, or pat you down?
061
062
No Don’t know
111 2 3Yes No Don’t know
111 2 3Yes No Don’t know
111 2 3Yes No Don’t know
111 2 3Yes No Don’t know
111 2 3Yes No Don’t know
Yes – ASK item 25b No – SKIP to item 27
CHECKITEM B
Did the police officer(s) search the vehicleOR the respondent? Is box 1 marked in item 25a, categories a OR b?
1
2
063

PPCS-1, Page 4 Black ink Page 4, 100% Pantone 278 Blue
Assaulting a police officer?Resisting arrest?
Possession of a firearm or concealedweapon?Disorderly conduct?
SKIP to item 33
1
2
085
3
4
086
088
089
Given a warning? Given a traffic ticket? None of the above
081 1
2
3
J. TRAFFIC STOP – VEHICLE/PERSONAL SEARCH – Continued
072 1
2
Yes – SKIP to item 29 No
Yes – ASK item 26 No – SKIP to item 27
CHECKITEM C
Was the respondent arrested? Is box 1 marked in item 6?
Yes – ASK item 32 No Don’t know
1
2
084
3
Some other offense? – Specify090
A drug offense?087
5
6
FORM PPCS-1 (5-16-2002)Page 4
Did the police officer(s) find any of the followingitems during (this search/these searches)?(Read answer categories 1–4.)
Illegal weapons?Illegal drugs?Open containers of alcohol, such as beer orliquor?Other evidence of a crime? – Specify
Mark (X) all that apply.
064 11
2 065 2
3
4
066
067
None of the above5068
Earlier you said that you were arrested and youor your vehicle were searched. Did the searchoccur before you were arrested?
K. REASON FOR TRAFFIC STOP
Did the police officer(s) give a reason forstopping the vehicle?
Was the reason speeding?
A vehicle defect?
A record check?
A seatbelt violation?
A roadside check for drunk drivers?
Yes No Don’t know
070 1
2
3
2
3
Yes – ASK item 28a No Don’t know
071 1
2
3
2
3SKIP to item 30
073 1
2
Yes – SKIP to item 29 No
074 1
2
Yes – SKIP to item 29 No
075 1
2
Yes – SKIP to item 29 No
076 1
2
Yes – SKIP to item 29 No
077 1
2
Yes – SKIP to item 29 No
078 1
2
Yes – SKIP to item 29 No
Yes – Specify079 1
YesNo Don’t know
1
2
080
3
2 No
An illegal turn or illegal lane change?
A stop sign or stop light violation?
Was there some other reason?
Would you say that the police officer(s) had alegitimate reason for stopping you?
L. OUTCOME OF TRAFFIC STOP
During this contact were you... (Read answercategories 1–2.)
Mark (X) all that apply.082
083
Were you charged with a non-traffic offense?
Were you charged with... (Read answer categories.)
Looking back on this contact, do you feel thepolice behaved properly or improperly?
Mark (X) all that apply.
Properly – SKIP to Check Item D Improperly – ASK item 34a Don’t know – SKIP to Check Item D
091 1
2
3
2
3
1
2
069
32.
33.
31.
30.
29.
28h.
28g.
28f.
28e.
28d.
28c.
28b.
28a.
27.
26.
25b.

Did you take any formal action, such as filing acomplaint or lawsuit against the police?
PPCS-1, Page 5 Black ink Page 5, 100% Pantone 278 Blue
Civilian Complaint Review BoardLaw enforcement agencyemploying the officer(s)
CourtSome other government agency
1
2
093
3
4
094
096
097
Yes – END SUPPLEMENT No – Interview next household member
CHECKITEM D
Is this the last household member to beinterviewed?
Yes No Don’t know
1
2
099
3
Other – Specify098
SKIP to Check Item DLocal prosecutor095
5
6
FORM PPCS-1 (5-16-2002) Page 5
Yes – ASK item 34b No Don’t know
092 1
2
3
2
3
L. OUTCOME OF TRAFFIC STOP – Continued
With whom did you file a complaint or lawsuit?Mark (X) all that apply.
M. OTHER CONTACT – PERSONAL SEARCH
At any time during this contact, did the policeofficer(s) ASK PERMISSION to search you, friskyou, or pat you down?
Did the police officer(s) actually search you, friskyou, or pat you down?
Whether or not the police officer(s) asked forPERMISSION, at any time during this contact didyou GIVE the police officer(s) PERMISSION tosearch you, frisk you, or pat you down?
SKIP to Check Item D
Yes No Don’t know
1
2
100
3
Yes – ASK item 37b No Don’t know
1
2
101
3SKIP to item 38a
Did the police officer(s) find any of the followingitems on or near you?
(Read answer categories 1–4.)
Mark (X) all that apply.
N. OUTCOME OF OTHER CONTACT
During this contact, were you charged with anyoffenses?
Were you charged with . . .(Read answer categories.)
Looking back on this contact, do you feel thepolice behaved properly or improperly?
Did you take any formal action, such as filing acomplaint or lawsuit against the police?
With whom did you file a complaint or lawsuit?
Mark (X) all that apply.
Illegal weapons?Illegal drugs?Open containers of alcohol, such as beer orliquor?Other evidence of a crime? – Specify
Assaulting a police officer?Resisting arrest?A drug offense?Possession of a firearm or concealed weapon?Disorderly conduct or public drunkenness?Some other offense – Specify
1
2
102
3
4
5 None of the above
Yes – ASK item 38b No Don’t know
1
2
107
3SKIP to item 39
103
104
105
106
1108
2
3
4
5
6
109
110
111
112
113
Properly – SKIP to Check Item D Improperly – ASK item 40a Don’t know – SKIP to Check Item D
1
2
114
3
Yes – ASK item 40b No Don’t know
1
2
115
3SKIP to Check Item D
116
117
119
120
121
118
Civilian Complaint Review BoardLaw enforcement agencyemploying the officer(s)
CourtSome other government agency
1
2
3
4
Other – Specify
Local prosecutor
5
6
Mark (X) all that apply.
34a.
34b.
35.
36.
37a.
37b.
38a.
38b.
39.
40a.
40b.
1
2
122

PPCS-1, Page 6 Black ink Page 6, 100% Pantone 278 Blue
Page 6 FORM PPCS-1 (5-16-2002)
NOTES