consumption and circulation of prehistoric products in
TRANSCRIPT

Analysing Ancient Economies and Social Relations 1
Estelle Gauthier
Consumption and Circulation of Prehistoric Products in Europe: Characterization of Spatial Evolutions by Using Map Algebra
Spatial Analysis and Modelling of Ancient Social-Economic Systems
Abstract: Modelling the evolution of the consumption of products in prehistory with map algebra methods brings good results. These methods are used to reconstitute the continuity of space from a distribution of points, without interpolation; to highlight the main metal consumption areas and to combine several pa-rameters in order to understand the organization of space. The quantification of social and economic values of the archaeological discoveries distinguishes several different ways of metal consumption and different organizations of territories. Creating a protocol of analyses using various map algebra methods applied to several parameters can lead to propose models of spatial organization. Two case studies are presented from the results of a thesis dedicated to the metal consumption during the Bronze Age and some results of the research programme ArchaeDyn on the dynamics of consumption and circulation of raw materials and final products in the prehistoric Europe.
Introduction
Our knowledge of Bronze Age metal consumption is mainly based on finds found in contexts of “the-saurization”, i.e. intentional depositions (hoards, certain underwater finds and grave goods) bur-ied on account of social and/or economic reasons (Bradley 1990). However the major part of the produced metal was recycled in order to repair the used and broken objects or increase the amount of metal in circulation. Due to recycling it was pos-sible to keep large amounts of metal in circulation; nevertheless the objects could disappear without leaving indices on the real nature of their previ-ous form. To understand the evolution of the metal consumption, our information is mainly based on evidence of intentional depositions which raise the problem of representation. In spite of these obstacles, the spatial analysis of their distribution allows us to understand the intensity and the or-ganisation of the consumption of metal objects. A distribution, indicated by simply placing points, cannot fully represent the spatial organisation that needs to be analysed considering the territories and combining several parameters. Algebra be-comes a convenient way to carry out this analysis map.
Map Algebra
Map algebra regroups the geotreatments defined by C. D. Tomlin (1990), and allows the analysis of spatial and thematic information in grids. Grids are georeferenced meshed structures, possessing topo-logic properties and they are associated with a dual topologic graph. Every vertex of this dual graph is the centre of every mesh of the grid and carries the thematic information. Map algebra consists of oper-ating calculations on one or several grids at different levels with local, zonal, focal or global functions. The calculations are applied on each cell, taking into ac-count a delimited area for zonal functions, a neigh-bourhood for focal functions, and the entire grid for global functions. Among the methods of map algebra, the focalsums are used to reconstruct the spatial continuity without supposing the continuity of the variation of the analysed phenomena, unlike the interpolations. It is possible to consider certain geographic factors as continuous, for example the relief, but it cannot be said of the human factor, which has a discontinuous distribution. In fact the habited areas are limited spatially. A zone of human occupation can reduce slowly or terminate sudden-ly, so the method of interpolation cannot be used to reconstruct the continuity of the space. The method

2 Layers of Perception – CAA 2007
To compare results coming from two different variables, the value of one grid should be subtracted from the other (Fig. 2). Applied to subsequent peri-ods this method allows us to model the evolution of the observed phenomenon, highlighting areas of expansions or regressions.
Global functions allow us to accomplish multi-variate analyses, which distinguish different areas according to chosen parameters. For example, the results of isocluster methods and Principal Compo-nent Analysis (PCA) associated with an Ascendant Hierarchical Classification (AHC) can be displayed on grids (Fig. 3).
The map algebra serves for different applications. Two case studies are presented for examination: Firstly the analysis of evolution of Bronze Age metal consumption in eastern France and the Transdanu-bia (western Hungary). Secondly the research into consumption areas of different materials during the European prehistory within the workshop no. 3 of the ArchaeDyn programme.
Metal Consumption during the Bronze Age in Eastern France and Transdanubia
This is a Ph.D. dissertation realized in the framework of a French-Hungarian cooperation at the Univer-sity of Burgundy and the Eötvös Lóránd Univers ity, Budapest (Gauthier 2005b). The main goal of the research was to compare the evolution of metal con-sumption during the Middle and Late Bronze Age in two test areas and to investigate the relationship between the geographical organisation and the con-sumption and circulation of metal products.
Research on Principal Areas of Metal Consumption
The principal zones of metal consumption are the regions where a lot of bronze objects were found. When taking into consideration the very important factor of recycling, a major part of the metal could have disappeared in zones were the “thesaurization” of the metal was not current. Regions showing high concentrations of archaeological sites, and poten-tial areas that were densely populated, could also be important zones of metal consumption. Both the concentrations of the sites and the concentrations of objects need to be taken into consideration at the same time.
Fig. 1. Localisation of the main metal consumption areas in Eastern France during the Middle Bronze Age. Treat-ments: pointgrids (500 m) then focalsum (900 km2) for frequencies of objects and for frequencies of sites, sum of
the two grids.
of focalsums does not carry this disadvantage. In a grid, each square gains the value of adding up the values of the cells around it, on a surface called the neighbourhood (Gauthier 2004; Gauthier 2005a). Thus it is a density calculation which allows us to take into consideration the directly adjacent areas as well as to reconstruct spatial continuity, without interpolation and without supposing the continuity of the phenomenon itself (Fig. 1).
Other map algebraic methods can be used to com-bine several parameters: e.g. the calculation of the sum, the average or maximal value of the squares of several grids. These treatments work on the lo-cal scale. It is very important to note that the values are of a comparable nature. When a number of finds is analysed, the usage of frequencies calculated in a common scale can be efficient. Grids correspond-ing to different quality parameters can be produced, using a system of scores in order to quantify qualita-tive parameters, while giving each of them a relative value (Stepniak 1986, for another example of a scor-ing system). The sum of the grids accumulates the values of the different – quantitative or qualitative – parameters and allows us to appreciate the maximal value they present together in the area.

Analysing Ancient Economies and Social Relations 3
Two databases were created: one for eastern France, with 3825 discovery units and 11,595 metal objects, and one for Transdanubia, with 6388 dis-covery units and 18,356 bronze objects. At first the
objects were spatialized. In order to compare their number, frequencies were calculated on a common scale taking into consideration all periods in both zones. Then the distribution was converted into a
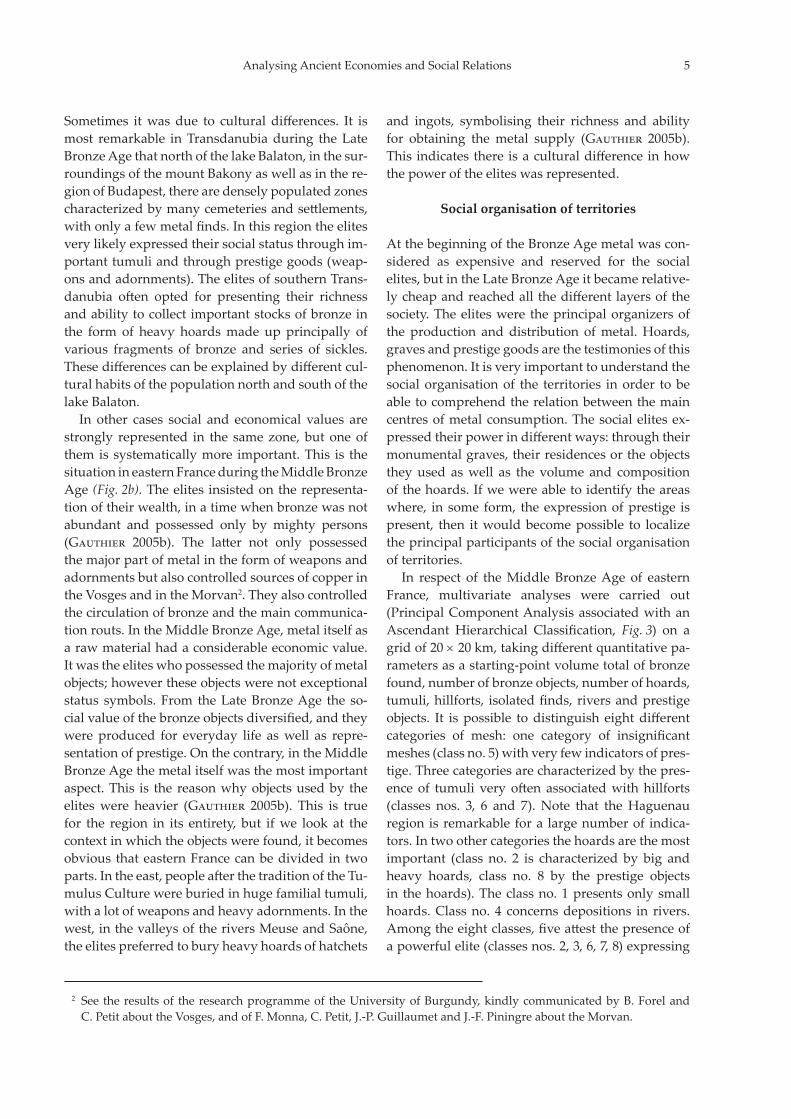
Fig. 3. The social organisation of the territories during the Middle Bronze Age in eastern France. On the left and in the centre: multivariate analyses (PCA and AHC) highlighting the main centres of social activities and the different ways for elites to express their power. A grid was made for the count of each parameter and multivariate analyses were made on the stack. It may be noticed that each parameter is not dependent on the others. On the right: modelling of the social
organisation of space.
Fig. 2. Comparison of the social and the economic values of the discoveries in Transdanubia during the Late Bronze Age 1 (on the left) and in eastern France during the Middle Bronze Age (on the right). Treatments: pointgrids (500 m) then focalsum (900 km2) for scores of the 10 criteria, sum of the 5 grids of social indicators and sum of the 5 grids of
economic indicators, then subtraction of the 2 grids.

4 Layers of Perception – CAA 2007
grid where the information was still kept separate. Applying the method of focalsums to the two param-eters (frequency of sites and frequency of objects) it was possible to reconstruct the continuity of space and to demonstrate the most important concentra-tion areas. Then the two parameters had to be com-bined with the sum of the grids to produce a new map showing all areas of high potential for metal consumption (Fig. 1). During the Middle Bronze Age in eastern France, an outstanding area is the region of Haguenau (1), where there are several large cemeteries of the Eastern Tumulus Culture (Hügelgräber-Kultur). This is the wealthiest zone in metal finds, but other regions are important as well: for example, southern to the previous, the region of Appenwihr (2). The area of the confluence of the riv-ers Seine and Yonne (3) seems to be also dynamic. In the valley of the river Saône several regions such as the surroundings of Chalon-sur-Saône (4), Pon-tailler-sur-Saône (5) and Saint-Germain-au-Mont-d’Or (6) are significant. The counties of Jura (7) and Allier (8) show significant concentrations. And the region of Langres (9) pops out from a sparsely pop-ulated territory. All of these areas are influenced by the Tumulus Culture and are on the main commu-nication routes to the Mediterranean (the valleys of the rivers Rhône and Saône) or to the Atlantic (the valleys of the rivers Seine, Yonne and Loire). The method used here presents the higher concentra-tions and especially allows the comparison of their extent and their relative importance. This method now surpasses the point repartition and presents a new view of the organization of territories.
A social and economic consumption
In order to characterise bronze consumption, it is important to understand how metal was used1. The consumption reflects the organisation of the society as well as the economic system. Metal objects are symbols of richness and power in some regions where the highest class of the society, which we can refer to as “the elites” monopolized the activities
connected to exchange, redistribution and defence of the territories.
Metal was a support of social and economic self-expression. Objects circulated and were exchanged. They had an economic value related to their mate-rial, weight or exotism (Gauthier 2005b). The ac-cumulation of bronze objects in hoards gave a sig-nificant economic value to these assemblages. They housed a large amount of metal which could be re-melted to become the final products of a work-shop in order to sell them or a voluntary sacrifice. Whatever the reason for depositing these objects, withdrawing this amount of metal from consump-tion and circulation network (Needham 1998) was a considerable loss for the population. The same is true for the goods thesaurized in burials.
These objects also had a social value due to, for ex-ample, their function. It is the reason why some ob-jects were considered as “prestige” goods, “socially valorised” products or symbols of power (Gauthier 2005b). Both the hoards and the graves can be ana-lysed according to a social representation, reflected by the function, by the activities or by the status of the person with whom they were connected. It is possible to establish a scoring system to quantify the social and economic value of these objects and of the context in which they were found.
Five parameters were distinguished for the so-cial value (of the objects, hoards, graves, isolated finds and the density of the occupation). Another five parameters were distinguished to estimate the economic value (of the objects, of the hoards, total mass of bronze, maximal number of objects and the number of sites with metal finds). These ten pa-rameters were spatialized and converted into grids (Pirot et al. 2005). For each a focalsum was calcu-lated. Summing up the five indicators of the social value, it is possible to make a map which shows the areas where the social representation was the most important. The same was carried out with the in-dicators of the economic value. Finally these maps can be compared by subtraction (Fig. 2). The zones where the social and economic representations were the most important are not always the same (Fig. 2a).
1 The main objective of this article is to develop methodological and technical aspects that can be applied to archaeo-logical data and to propose an example for their application. Complete argumentations, bibliography, the details of scoring system and specific applications to the metal consumption during the Bronze Age (see Gauthier 2005b) are available on request and will be published in the near future. On the organization of the society and the relation between economy, society and bronze circulation during the Bronze Age, see principally the recent syntheses with further bibliography: Scarre / Healy 1993; Aravantinos / Barceló / Bockisch-Bräuer 1999; Kristiansen 2000; Pare 2000.
Analysing Ancient Economies and Social Relations 5
Sometimes it was due to cultural differ ences. It is most remarkable in Transdanubia during the Late Bronze Age that north of the lake Balaton, in the sur-roundings of the mount Bakony as well as in the re-gion of Budapest, there are densely populated zones characterized by many cemeteries and settlements, with only a few metal finds. In this region the elites very likely expressed their social status through im-portant tumuli and through prestige goods (weap-ons and adornments). The elites of southern Trans-danubia often opted for presenting their richness and ability to collect important stocks of bronze in the form of heavy hoards made up principally of various fragments of bronze and series of sickles. These differences can be explained by different cul-tural habits of the population north and south of the lake Balaton.
In other cases social and economical values are strongly represented in the same zone, but one of them is systematically more important. This is the situation in eastern France during the Middle Bronze Age (Fig. 2b). The elites insisted on the representa-tion of their wealth, in a time when bronze was not abundant and possessed only by mighty persons (Gauthier 2005b). The latter not only possessed the major part of metal in the form of weapons and adornments but also controlled sources of copper in the Vosges and in the Morvan2. They also controlled the circulation of bronze and the main communica-tion routs. In the Middle Bronze Age, metal itself as a raw material had a considerable economic value. It was the elites who possessed the majority of metal objects; however these objects were not exceptional status symbols. From the Late Bronze Age the so-cial value of the bronze objects diversified, and they were produced for everyday life as well as repre-sentation of prestige. On the contrary, in the Middle Bronze Age the metal itself was the most important aspect. This is the reason why objects used by the elites were heavier (Gauthier 2005b). This is true for the region in its entirety, but if we look at the context in which the objects were found, it becomes obvious that eastern France can be divided in two parts. In the east, people after the tradition of the Tu-mulus Culture were buried in huge familial tumuli, with a lot of weapons and heavy adornments. In the west, in the valleys of the rivers Meuse and Saône, the elites preferred to bury heavy hoards of hatchets
and ingots, symbolising their richness and ability for obtaining the metal supply (Gauthier 2005b). This indicates there is a cultural difference in how the power of the elites was represented.
Social organisation of territories
At the beginning of the Bronze Age metal was con-sidered as expensive and reserved for the social elites, but in the Late Bronze Age it became relative-ly cheap and reached all the different layers of the society. The elites were the principal organizers of the production and distribution of metal. Hoards, graves and prestige goods are the testimonies of this phenomenon. It is very important to understand the social organisation of the territories in order to be able to comprehend the relation between the main centres of metal consumption. The social elites ex-pressed their power in different ways: through their monumental graves, their residences or the objects they used as well as the volume and composition of the hoards. If we were able to identify the areas where, in some form, the expression of prestige is present, then it would become possible to localize the principal participants of the social organisation of territories.
In respect of the Middle Bronze Age of eastern France, multivariate analyses were carried out (Principal Component Analysis associated with an Ascendant Hierarchical Classification, Fig. 3) on a grid of 20 × 20 km, taking different quantitative pa-rameters as a starting-point volume total of bronze found, number of bronze objects, number of hoards, tumuli, hillforts, isolated finds, rivers and prestige objects. It is possible to distinguish eight different categories of mesh: one category of insignificant meshes (class no. 5) with very few indicators of pres-tige. Three categories are characterized by the pres-ence of tumuli very often associated with hillforts (classes nos. 3, 6 and 7). Note that the Haguenau region is remarkable for a large number of indica-tors. In two other categories the hoards are the most important (class no. 2 is characterized by big and heavy hoards, class no. 8 by the prestige objects in the hoards). The class no. 1 presents only small hoards. Class no. 4 concerns depositions in rivers. Among the eight classes, five attest the presence of a powerful elite (classes nos. 2, 3, 6, 7, 8) expressing
2 See the results of the research programme of the University of Burgundy, kindly communicated by B. Forel and C. Petit about the Vosges, and of F. Monna, C. Petit, J.-P. Guillaumet and J.-F. Piningre about the Morvan.

6 Layers of Perception – CAA 2007
their power in different ways. Again it can be stated that the areas of the tumuli and the hillforts are in the east and the heavy or prestige hoards are in the west.
Twelve zones can be considered as centres of power: the regions of Haguenau, Shirrhein (Bas-Rhin), Appenwihr, Mulhouse (Haut-Rhin), Amancey (Doubs), Saint-Claude (Jura), Chassey (Saône-et-Loire), Alise-Saint-Reine (Côte-d’Or), region of the Brie (hoard of Verneuil-l’Etang, Seine-et-Marne), Varennes-sur-Allier (hoard of Rongères), Montluçon (hoard of Teillet-Argenty, Allier), Diarville (Meur-the-et-Moselle). These regions are scattered over the territory of eastern France in an equal distance. The only exception is Shirrhein which is near to the area of Haguenau and could therefore be considered part of that region. They are all loaded with a great number of metal finds. The majority of these zones emerge on the map as areas with high potential for metal consumption, and they show considerable con-centrated mass of metal (the regions of Haguenau, Chassey, Montluçon and Verneuil-l’Etang). Only the areas in the northern part of eastern France (mainly between the Seine and the Vosges) do not have cen-tres of power, probably because they are not well documented. In the well known regions, the centres of power are situated at a regular distance (approx. 100 km). This model is to be completed by secondary centres located in the important zones of bronze con-sumption, but not so rich in indicators of power as e.g. the region of Pontailler-sur-Saône, the confluent of the rivers Seine and Yonne or the surroundings of Saint-Germain-au-Mont-D’Or (Rhône).
Therefore it is possible to propose a model for the social organisation of eastern France during the Middle Bronze Age (Fig. 3, on the right). Centres of power were organised regularly and the secondary centres played an intermediate role between the principal centres. The main centres were situated in the principal axes of the circulation of products along the water-ways, often at confluences, to be able to control the circulation of goods. They are sometimes situated on the mouth of the roads giv-ing access to the natural resources, like salt in the Jura or copper of the Morvan and the Vosges, form-
ing territories closely related to the strategy of the circulation of goods.
Consumption of Prehistoric Products in Europe: Looking for the Dynamics of Evolution
The Workshop 3 of the programme ArchaeDyn3
(Nuninger / Tourneux / Favory 2008), is dedicated to the evolution of the consumption of raw materials and final products of different nature (flint, Alpine rock, millstones, bronze…) from the Neolithic un-til the Bronze Age. The main goal is to understand the spatial dynamics of the organisation of space in respect of the exchanges and consumption of prod-ucts. 17 scholars from different institutes4 took part in this programme and implied their data, namely 20 datasets, concerning different products found in varied contexts and studied at different scales of analysis: regional (12 databases, including 2 from abroad), supra-regional (2 databases), national (4 databases) and also two European. Each participant proposed a map of spatial reliability of his invento-ry. The three reliability levels lead to elaborate confi-dence maps (Oštir et al. 2008) from which the group could correctly interpret the results of the analyses made from the data provided.
This programme is destined to study relations between sources (or places of production) and con-sumption areas. It aims to analyse the flow and the dynamics of circulation of products and to identify consumption areas, their characteristics and their evolutions over different periods of time.
In order to determine the indicators of concentra-tion or dispersion, the focalsums are used to show the principal concentrations of each product. These zones can also be compared to see if the principal areas of consumption of these products are the same and whether several tendencies could be observed. The first tests have already been realized, however the management of multiple scales requires an ad-aptation of the methodology (resolution of the grid, size of the neighbourhood etc.), which is currently in progress.
3 ArchaeDyn’s project is coordinated by F. Favory and L. Nuninger (University of Franche-Comté, UMR6565, Be-sançon).
4 Members of ArchaeDyn – Workshop 3: L. Jaccottey, A. Milleville, L. Nuninger, P. Pétrequin, F. Tolle, O. Weller and E. Gauthier (UMR6565-Besançon), J. Affolter, M. Gabillot, R. Martineau, C. Mordant, C. Moreau, L. Saligny, S. Rottier (MSH and UMR5594-Dijon), P. Allard (UMR7055-Nanterre) and F. Pennors, B. Quilliec (UMR7041-Nanterre).

Analysing Ancient Economies and Social Relations 7
These concentrations can reflect differences in the usage of the products, e.g. as in the case of Bronze Age objects found in hoards, graves and in rivers. The consumption of socially valued objects and the consumption of ordinary goods could have taken place in different localities. The databases were real-ized in different scales. It was important to choose test areas, for example Burgundy and Franche-Comté, common to several programmes. The con-centration of a type of object in a specific region shows its diffusion in a more or less wide area. The most important concentrations are found normally in the region neighbouring the workshop, but some examples can be found several hundreds kilometres away.
In spite of the observed differences, when some of the consumption areas are the same for several prod-ucts, we put forward the hypothesis that these re-gions were occupied by a population in need of a lot of raw material or final products or that there could have been existed a level of socio-economic develop-ment important enough to control the redistribution of products. Comparing the principal areas of con-centrations, at different scales of analysis, it is pos-sible to understand the role and the influence of the consumption areas or the main axes of circulation. Some of the regions only played a role on a local or regional scale and their importance was limited. Oth-ers were involved in the distribution of products on a European scale, and these were the most dynamic regions. The same can be said of the analysis made at different scales of time by using map algebra to subtract the grids of two consecutive periods to visu-alize the evolution of the concentrations in length of time. Some of the consumption areas are short-lived while others remain stable over a long time.
Conclusion
Through these different examples, we see that Map algebra offers several methods for studying spatial organisation and the evolution of archaeological data. The latter method allows us to understand the relationship between the territories by taking into account economic, cultural or social factors. There are many possibilities and these methods are par-ticularly appropriate for opening up new perspec-tives in the study of organisation of space, accord-ing to the strategies of consumption of products in ancient periods and their dynamics over the long term.
References
Aravantinos / Barceló / Bockisch-Bräuer 1999V. Aravantinos / J. Barceló / C. Bockisch-Bräuer, Eli-ten in der Bronzezeit. Ergebnisse zweier Kolloquien in Mainz und Athen. Monographien RGZM 43 (Mainz 1999).
Bradley 1990R. Bradley, The Passage of Arms: An Archaeological Analysis of Prehistoric Hoards and Votive Deposits (New York 1990).
Gauthier 2004E. Gauthier, L’évolution de la consommation du métal à l’Âge du Bronze, en France orientale et en Transdanu-bie. Histoire et Mesure 19,3/4, 2004, 345–376.
Gauthier 2005aE. Gauthier, Recherche d’une méthode d’analyse com-parée des flux de métal à l’Age du bronze (XVIIè– IXè s.) en France orientale et en Transdanubie: utilisa-tion et adaptation de la méthode des sommes focales.In: J.-F. Berger / F. Bertoncello / F. Braemer / G. Dav-tian / M. Gazenbeek (eds.), XXVe rencontres interna-tionales d’archéologie et d’histoire d’Antibes (Antibes 2005) 161–171.
Gauthier 2005bE. Gauthier, La consommation du métal en France orientale et en Transdanubie du XVIIè au IXè s. avant notre ère. Analyse spatiale et modélisation des systè-mes socio-économiques de l’Age du Bronze. PhD thesis (Dijon 2005).
Kristiansen 2000K. Kristiansen, Europe Before History (Cambridge 2000).
Needham 1998S. Needham, Modelling the flow of metal in the Bronze Age. In: C. Mordant / M. Pernot / V. Rychner (eds.), L’atelier du Bronzier en Europe du XXè s. au VIIIè s. avant notre ère, Production circulation et consomma-tion du bronze. Actes du colloque «Bronze’96» (Paris 1998) 285–298.
Nuninger / Tourneux / Favory 2008L. Nuninger / P. F. Tourneux / F. Favory, From Archae-omedes to Archaedyn. In: Present volume, 278.
Oštir et al. 2008K. Oštir / Z. Kokalj / L. Saligny / F. Tolle / L. Nunin-ger, Confidence maps: a tool to evaluate archaeological data’s relevance in spatial analysis. In: Present volume, 272.
Pare 2000C. Pare, Metal makes the world go round (Oxford 2000).

8 Layers of Perception – CAA 2007
Pirot et al. 2005F. Pirot / T. Saint-Gérand / E. Gauthier / A. Banza-Nsungu, L’analyse spatiale versus algèbre de cartes sous ArcGIS: Des exemples en sciences de l’homme et de la société. Actes de la conférence francophone ESRI (Issy-les-Moulineaux 2005). http://www.esrifrance.fr/sig2005/communications2005/Pirot3/pirot3.htm [31 Dec 2007].
Scarre / Healy 1993C. Scarre / F. Healy, Trade and Exchange in Prehistoric Europe. Oxbow Monographs 33 (Oxford 1993).
Stepniak 1986T. Stepniak, Quantitative Aspects of Bronze Age Metal-work in Western Poland. BAR International Series 317 (Oxford 1986).
Tomlin 1990C. Tomlin, Information Systems and Cartographic Modeling (Englewood Cliffs 1990).
Illustration credits
CAO, Estelle Gauthier, University of Franche-Comté, In-stitute of Chrono-Ecology, Besançon, France.Geographical data providers: IGN, GEOFLA, Road 120, 2001, SRTM. Software: ArcGis-Arc Info 9.0 and Arc Info-Workstation 9.0.
Estelle Gauthier
CNRSLaboratory of Chrono-Ecology UMR 6565
16 Route de Gray25030 Besançon