consumer trends - packaged food in · pdf fileconsumer trends packaged food in japan ... note:...
TRANSCRIPT
International Markets Bureau
MARKET INDICATOR REPORT | APRIL 2013
Consumer Trends
Packaged Food in Japan

EXECUTIVE SUMMARY INSIDE THIS ISSUE
PAGE 2
Consumer Trends Packaged Food in Japan
Executive Summary 2
Market Trends 3
Retail Sales by Product Category
3
Key Market Segments: 2011-2012
5
Sources 11
Japan’s economy has experienced challenges in recent years, influenced by a changing internal and external economic environment. For example, exports always have been Japan’s key source of economic strength. However, as the global economy faced challenges from a series of financial crises, the demand for Japanese exports declined. In addition, an aging population is shifting the country’s economic structure. Finally, the Great Eastern Japan Earthquake, which occurred in 2011, also contributed to economic contraction. These dynamics led to a decline in consumer confidence. However, some markets, including packaged food, experienced a much less pronounced decline in sales than expected. During the 2007-2012 period, sales in the Japanese packaged food market decreased. Specifically, this market shrank by 1% every year from 2008 to 2010. However, the packaged food market showed signs of recovery in 2012, and is expected to show positive growth from 2013 to 2017. Despite the stagnant market situation, there were some sectors experiencing healthy growth, with a compound annual growth rate (CAGR) of more than 5% between 2007 and 2012. These sectors include convalescence meal replacements* (CAGR of 17.5%), olive oil (CAGR of 8.9%), breakfast bars (CAGR of 6.4%), prepared baby food (CAGR of 6.7%), and dried ready meals (CAGR of 5.7%). However, these sectors represent a small segment of the Japanese packaged food market and are expected to show limited growth over the 2012-2017 period, except for breakfast bars. This report summarizes major trends in Japan’s packaged food market, with an overview of sales and growth, focusing the largest segments, including chilled processed food, bakery, dried processed food, dairy, and other major sectors, with rapid growth. It also highlights sales performance and identifies major players in key packaged food segments during the period from 2011-2012 .
“LIMITED EDITION”
WAS THE MOST POPULAR CLAIM
FOR NEWLY LAUNCHED
PACKAGED FOOD IN JAPAN
IN 2012.
(MINTEL, 2013)
Note: Convalescence meal replacements are food substitutes that can be consumed as meals or supplements to meals for seniors or people experiencing health problems. The leading global brands are Ensure (Abbott), Boost (Bristol-Myers Squibb), and Medi-F (Ajinomoto).
PAGE 3
Traditionally, the staple Japanese meal has consisted of rice, pickled vegetables, soup, and other assorted side dishes. However, changing eating habits among Japanese consumers are key to growth for certain types of packaged food. With the western influence and a fast-paced lifestyle becoming more predominant, convenient and portable food, such as ready meals, cereal, breakfast bars and bagels, have become popular, which has contributed to consistent sales growth for these products.
To meet dynamic consumer needs, most Japanese grocery retailers sell packaged food and cooking
ingredients, not only for traditional Japanese cuisine, but also international dishes. For example, dried pasta, cheese, cooking wines and oils (especially, olive oils) have become readily available in supermarkets, reflecting the growing popularity of home-cooking and western and fusion cuisines with various international flavours.
Due to rising health awareness and food safety concerns, Japanese consumers’ demand for organic
packaged food has also been increasing. In addition, low levels of domestic production and strict restrictions on imports, resulting in limited access to organic produce, contributed to a decline in actual consumption of organic fresh fruits and vegetables. These factors have contributed to increasing demand for organic packaged food, products containing more natural ingredients, or even packaged produce products, such as fresh-cut fruits and prepared salads.
Young Japanese consumers tend to favour packaged snacks, including biscuits, cookies, chocolates, potato
crisps and many others. In recent years, packaged dried nuts, fruit, berries and bars made of these ingredients have become popular snacks among adult consumers, especially women. These products are consumed as snacks or meal replacements. In addition, low-calorie, chewy fruit snacks and jelly cups have become even more popular in recent years.
Japanese retailers have diversified the formats of their distribution channels and developed various ways to
connect with consumers whose shopping preferences have changed. In recent years, convenience stores, which are similar to small- and medium-size chained supermarkets in North America, have grown in popularity. These stores offer various private label packaged food products, and many have signature chilled ready-meal brands, which have become significant revenue generators for these retailers. In addition, many major grocery retailers sell food products through online outlets and offer prompt delivery service, which further expands access to grocery shopping for the busy urban population. The practice of shopping online is becoming more and more popular, particularly for specialty products.
MARKET TRENDS
RETAIL SALES BY PRODUCT CATEGORY
Japan’s packaged food market totaled US$236 billion in 2012, a 0.2% decline from the previous year. Traditionally, large markets, such as chilled processed food and dried processed food, experienced continuous declines in sales, while some of the sectors within these segments, including chilled ready meals, instant noodles and soups, performed better than other packaged food sectors.
In 2013, the Japanese packaged food sector is forecast to experience a further decrease in sales. However,
it is expected that the market will rebound in 2014, to be valued at US$240.8 billion by 2017, expanding at a CAGR of 0.4% over the 2012-2017 period.
Meal and meal centre categories, including ready meals, noodles, soup and pasta, performed well with
steady growth in sales during the 2007-2012 period. Meal and meal centres had the most active new product launches during this same period. These categories are expected to show higher growth rates than most other categories from 2012 to 2017.

PAGE 4
RETAIL SALES BY PRODUCT CATEGORY (continued)
Category 2007 2012* 2013 2017 2007-12 CAGR**
2012-17 CAGR**
Packaged food total 236,895.7 236,305.2 236,253.4 240,800.8 0.0% 0.4%
Chilled processed food 69,846.5 65,826.5 65,306.8 64,808.0 -1.2% -0.3%
Bakery 32,547.1 34,079.8 34,070.9 34,596.9 0.9% 0.3%
Dried processed food 32,960.2 31,452.1 31,365.7 31,802.5 -0.9% 0.2%
Dairy 25,536.7 27,048.9 27,406.3 28,985.5 1.2% 1.4%
Sauces, dressings and condiments 22,167.0 22,522.4 22,613.0 23,425.8 0.3% 0.8%
Sweet and savoury snacks 13,270.7 14,188.6 14,271.9 14,785.1 1.3% 0.8%
Confectionery 10,281.4 10,220.1 10,228.6 10,448.5 -0.1% 0.4%
Canned/preserved food 8,254.3 8,362.8 8,268.2 8,273.5 0.3% -0.2%
Frozen processed food 7,483.5 7,526.0 7,624.1 8,079.8 0.1% 1.4%
Ice cream 6,304.8 6,793.3 6,790.9 7,043.3 1.5% 0.7%
Oils and fats 3,874.3 3,981.1 3,986.5 4,105.0 0.5% 0.6%
Baby food 1,358.5 1,348.5 1,330.0 1,293.7 -0.1% -0.8%
Spreads 1,116.5 1,154.4 1,166.3 1,218.9 0.7% 1.1%
Snack bars 789.7 775.2 783.0 811.9 -0.4% 0.9%
Meal replacement 781.9 688.4 700.4 764.6 -2.5% 2.1%
Ready meals*** 19,071.4 20,413.2 20,977.9 22,499.3 1.4% 2.0%
Noodles*** 14,307.2 15,731.0 16,109.9 17,364.2 1.9% 2.0%
Soup*** 2,321.8 2,541.6 2,576.1 2,709.0 1.8% 1.3%
Pasta*** 1,058.4 1,162.7 1,197.5 1,306.2 1.9% 2.4%
Japan’s Packaged Food, Retail Sales by Product Category (Historic/Forecast) in US$ Millions
Source: Euromonitor International, 2013 Note: A fixed exchange rate at US$1.00=JJ¥ 80.10 is applied for both historic and forecast data . * 2012 data is based on mid-year provisions and estimates. ** CAGR: compound annual growth rate *** The sub-categories within ready meals, noodles (excluding snack noodles), soup (excluding ultra-high-temperature processed soup), and pasta are also listed within other relative categories, including canned/preserved food, chilled processed food, dried processed food and frozen processed food. However, these sub-categories are not double counted in total packaged food sales.
PAGE 5
KEY MARKET SEGMENTS: 2011-2012
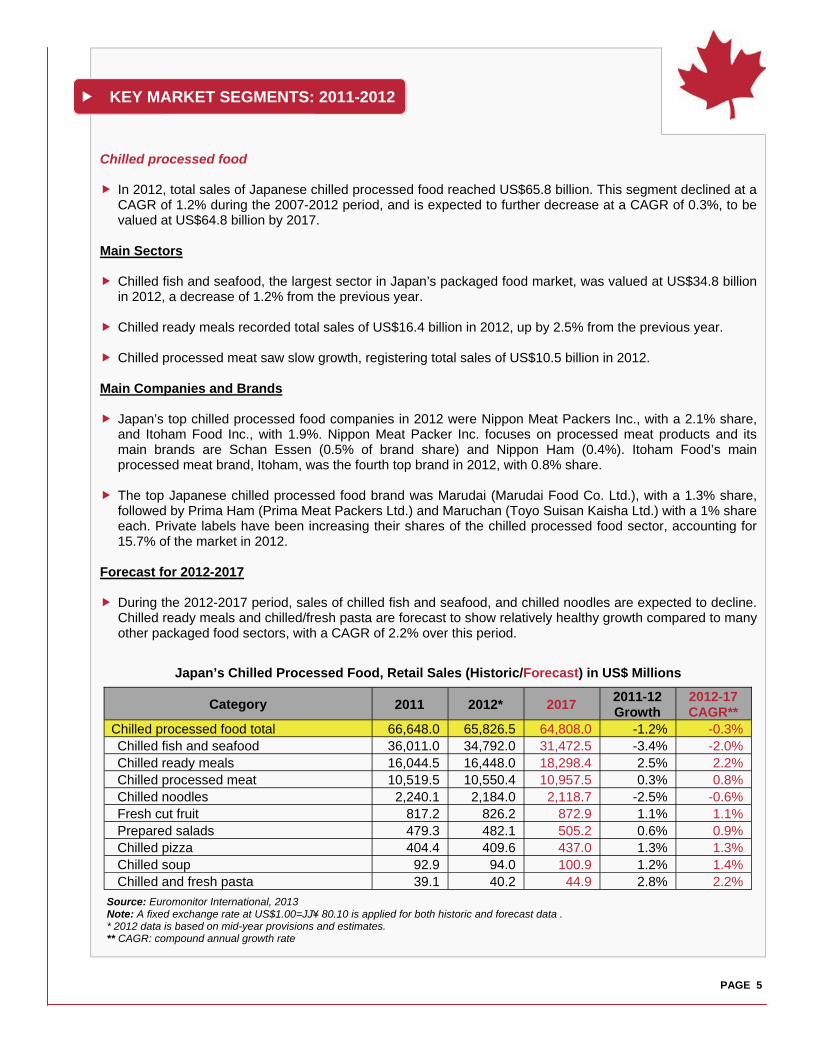
Chilled processed food In 2012, total sales of Japanese chilled processed food reached US$65.8 billion. This segment declined at a
CAGR of 1.2% during the 2007-2012 period, and is expected to further decrease at a CAGR of 0.3%, to be valued at US$64.8 billion by 2017.
Main Sectors Chilled fish and seafood, the largest sector in Japan’s packaged food market, was valued at US$34.8 billion
in 2012, a decrease of 1.2% from the previous year. Chilled ready meals recorded total sales of US$16.4 billion in 2012, up by 2.5% from the previous year. Chilled processed meat saw slow growth, registering total sales of US$10.5 billion in 2012. Main Companies and Brands Japan’s top chilled processed food companies in 2012 were Nippon Meat Packers Inc., with a 2.1% share,
and Itoham Food Inc., with 1.9%. Nippon Meat Packer Inc. focuses on processed meat products and its main brands are Schan Essen (0.5% of brand share) and Nippon Ham (0.4%). Itoham Food’s main processed meat brand, Itoham, was the fourth top brand in 2012, with 0.8% share.
The top Japanese chilled processed food brand was Marudai (Marudai Food Co. Ltd.), with a 1.3% share,
followed by Prima Ham (Prima Meat Packers Ltd.) and Maruchan (Toyo Suisan Kaisha Ltd.) with a 1% share each. Private labels have been increasing their shares of the chilled processed food sector, accounting for 15.7% of the market in 2012.
Forecast for 2012-2017 During the 2012-2017 period, sales of chilled fish and seafood, and chilled noodles are expected to decline.
Chilled ready meals and chilled/fresh pasta are forecast to show relatively healthy growth compared to many other packaged food sectors, with a CAGR of 2.2% over this period.
Category 2011 2012* 2017 2011-12 Growth
2012-17 CAGR**
Chilled processed food total 66,648.0 65,826.5 64,808.0 -1.2% -0.3% Chilled fish and seafood 36,011.0 34,792.0 31,472.5 -3.4% -2.0% Chilled ready meals 16,044.5 16,448.0 18,298.4 2.5% 2.2% Chilled processed meat 10,519.5 10,550.4 10,957.5 0.3% 0.8% Chilled noodles 2,240.1 2,184.0 2,118.7 -2.5% -0.6% Fresh cut fruit 817.2 826.2 872.9 1.1% 1.1% Prepared salads 479.3 482.1 505.2 0.6% 0.9% Chilled pizza 404.4 409.6 437.0 1.3% 1.3% Chilled soup 92.9 94.0 100.9 1.2% 1.4% Chilled and fresh pasta 39.1 40.2 44.9 2.8% 2.2%
Source: Euromonitor International, 2013 Note: A fixed exchange rate at US$1.00=JJ¥ 80.10 is applied for both historic and forecast data . * 2012 data is based on mid-year provisions and estimates. ** CAGR: compound annual growth rate
Japan’s Chilled Processed Food, Retail Sales (Historic/Forecast) in US$ Millions

PAGE 6
KEY MARKET SEGMENTS: 2011-2012 (continued)
Category 2011 2012* 2017 2011-12 Growth
2012-17 CAGR**
Bakery products total 33,987.0 34,079.8 34,596.9 0.3% 0.3% Baked goods 28,032.3 28,147.1 28,760.6 0.4% 0.4% Biscuits 5,401.2 5,362.8 5,224.4 -0.7% -0.5% Breakfast cereals 553.5 569.9 611.9 3.0% 1.4%
Source: Euromonitor International, 2013 Note: A fixed exchange rate at US$1.00=JJ¥ 80.10 is applied for both historic and forecast data . * 2012 data is based on mid-year provisions and estimates. ** CAGR: compound annual growth rate
Japan’s Bakery Products, Retail Sales (Historic/Forecast) in US$ Millions
Bakery Japan’s bakery segment registered total sales of US$34.1 billion in 2012, a 0.3% increase from the previous
year. Sales in this segment are expected to increase, at a CAGR of 0.3% over the 2012-2017 period, reaching US$34.6 billion by 2017.
Main Sectors Baked goods, including breads, cakes and pastries, is the largest sector in Japan’s bakery market. This
sector was valued at US$28.1 billion in 2012, an increase of 0.4% from the previous year. Biscuits experienced a slight decrease in sales down by 0.7% in 2012 from 2011, with total sales of
US$5.3 billion in 2012. Breakfast cereals is one of the sectors in Japan’s packaged food industry that has been growing. In 2012,
this sector’s total sales reached US$570 million, a 3% increase from 2011. Main Companies and Brands Yamazaki Baking Co. Ltd. was the largest bakery company in Japan in 2012, with a 19.9% share at the
market. This company’s major brand, Yamazaki, has been the dominant bakery brand in Japan, with a market share of 11.8% share in 2012.
Shikishima Baking Kashipan (Shikishima Baking Co. Ltd.) was the second-largest brand, with a 3% share in
2012. This brand maintained this second position throughout the 2007-2012 period. Forecast for 2012-2017 Breakfast cereals are projected to show relatively moderate
growth, with a CAGR of 1.4% from 2012 to 2017, to reach US$612 million in sales by 2017. While baked goods are also expected to register positive growth, sales of biscuits will likely decline during this period.
Source: Shutterstock

PAGE 7
KEY MARKET SEGMENTS: 2011-2012 (continued)
Category 2011 2012* 2011-12 Growth 2017
2012-17 CAGR**
Dried processed food total 31,635.8 31,452.1 -0.6% 31,802.5 0.2% Rice 16,549.8 15,887.8 -4.0% 14,394.4 -2.0% Instant noodles 9,384.1 9,765.7 4.1% 11,169.4 2.7% Plain noodles 2,271.4 2,296.4 1.1% 2,440.6 1.2% Instant soup 2,015.3 2,055.7 2.0% 2,206.4 1.4% Dried pasta 1,087.0 1,122.5 3.3% 1,261.3 2.4% Dessert mixes 195.5 194.1 -0.7% 195.8 0.2% Dried ready meals 111.1 108.7 -2.2% 114.3 1.0% Dehydrated soup 21.6 21.2 -1.9% 20.3 -0.9%
Source: Euromonitor International, 2013 Note: A fixed exchange rate at US$1.00=JJ¥ 80.10 is applied for both historic and forecast data . * 2012 data is based on mid-year provisions and estimates. ** CAGR: compound annual growth rate
Japan’s Dried Processed Food, Retail Sales (Historic/Forecast) in US$ Millions
Dried processed food The dried processed food segment is Japan’s third-largest packaged food market. In 2012, this segment
was valued at US$31.4 billion in 2012, a 0.6% decrease from 2011. Japan’s dried processed food market is expected to see a slight increase in sales, with a CAGR of 0.2% from 2012 to 2017, reaching US$31.8 billion by 2017.
Main Sectors While rice is still one of the most important staple foods in Japan, the consumption of rice as a component of
a meal or snack has been declining. In 2012, Japanese rice sales reached US$15.9 billion, a 4% decrease from 2011.
Instant noodles saw a healthy increase in sales in 2012. Total sales in this sector reached US$9.7 billion in
2012, a 4.1% increase from the previous year. Sales of plain noodles reached US$2.3 billion in 2012, a 1.1% increase from 2011. Main Companies and Brands The top dried processed food company in Japan is JA Group (Japan Agricultural Cooperatives), with a
22.1% share in 2011. The next top player is Nissin Foods Holdings Co. Ltd., with a 15.6% share in 2012. In 2008, Nissin Foods Holdings Co. Ltd. experienced a drop in company share from 14.2% to 12.7%, the company has rebounded quickly, supported by increasing sales of instant noodles.
The Nissin brand (Nissin Foods Holdings Co. Ltd.) has been the predominant dried processed food brand in
Japan, with a 13.6% share in 2012. The next top brand was Maruchan (Toyo Suisan Kaisha Ltd.), with a 5.7% share in the same year.
Forecast for 2012-2017 Except for rice and dehydrated soup, most other sectors within Japan’s dried processed food will enjoy a
sales increase over the 2012-2017 period. Dried pasta sales in particular have been trending upward, and sales are expected to exceed US$1.2 billion by 2017.

PAGE 8
KEY MARKET SEGMENTS: 2011-2012 (continued)
Category 2011 2012* 2011-12 Growth
2017 2012-17 CAGR**
Dairy 26,592.6 27,048.9 1.7% 28,985.5 1.4% Drinking milk products 10,202.0 10,374.7 1.7% 11,072.6 1.3% Yogurt and sour milk products 9,353.6 9,568.1 2.3% 10,380.4 1.6% Cheese 3,921.2 3,960.6 1.0% 4,207.8 1.2% Other dairy 3,115.8 3,145.5 1.0% 3,324.7 1.1%
Source: Euromonitor International, 2013 Note: A fixed exchange rate at US$1.00=JJ¥ 80.10 is applied for both historic and forecast data . * 2012 data is based on mid-year provisions and estimates. ** CAGR: compound annual growth rate
Japan’s Dairy Products, Retail Sales (Historic/Forecast) in US$ Millions
Dairy Dairy is a highly fragmented and significant segment within the Japanese packaged food industry. Total
sales of dairy products reached US$27 billion in 2012, a 1.7% increase from the previous year. This segment is projected to experience a continuous increase in sales, at a CAGR of 1.4% from 2012 to 2017, reaching US$29 billion by 2017.
Main Sectors Milk products for drinking, including fresh/pasteurized milk, flavoured milk and milk substitutes such as soy
milk, account for the largest segment of the Japanese dairy industry. In 2012, total sales of milk drink products were US$10.3 billion, a 1.7% increase from 2011.
Yogurt and sour milk products, the second largest dairy product sector, grew 2.3% in 2012, reaching
US$9.5 billion at the end of year. Cheese is becoming more popular in Japan, reaching total sales of nearly US$4 billion in 2012, a 1%
increase in sales from the previous year. Main Companies and Brands Among companies, Meiji Holdings Co. Ltd. has been the largest player in Japan’s dairy market, with a 13.6%
share in 2012. Next, Morinaga Milk Industry Co. Ltd. had a 9.5% share and Megmilk Snow Brand Co. Ltd. had a 9.3% share in 2012.
With regard to brands, Morinaga (Morinaga Milk Industry Co. Ltd.) is the
largest, accounting for 7.1% of total dairy market, followed by Yakult (Yakult Honsha Co. Ltd.) with a 5% share.
Forecast for 2012-2017 Sales of yogurt and sour milk products are forecast to grow the most within
the dairy segment, at a CAGR of 1.6% over the 2012-2017 period, exceeding total sales of US$10.3 billion by 2017. In addition, drinking milk products and cheese are also projected to experience an increase in sales during this same period, at a CAGR of 1.3% and 1.2% respectively.

PAGE 9
KEY MARKET SEGMENTS: 2011-2012 (continued)
Category 2011 2012* 2011-12 Growth 2017
2012-17 CAGR**
Sauces, dressings and condiments 22,455.3 22,522.4 0.3% 23,425.8 0.8% Table sauces 9,908.6 9,916.9 0.1% 10,269.9 0.7% Cooking sauces 5,648.4 5,742.0 1.7% 6,219.6 1.6% Pickled products 3,150.3 3,059.4 -2.9% 2,844.9 -1.4% Tomato pastes and purées 52.5 53.1 1.1% 57.0 1.4% Dips 3.5 3.5 0.0% 3.4 -0.6% Other sauces, dressings and condiments 3,692.0 3,747.5 1.5% 4,031.0 1.5%
Source: Euromonitor International, 2013 Note: A fixed exchange rate at US$1.00=JJ¥ 80.10 is applied for both historic and forecast data . * 2012 data is based on mid-year provisions and estimates. ** CAGR: compound annual growth rate
Japan’s Sauces, Dressings and Condiments, Retail Sales (Historic/Forecast) in US$ Millions
Sauces, dressings and condiments Japan’s sauces, dressings and condiments market was valued at US$22.5 billion in 2012, a 0.3% increase
from 2011. This segment is expected to expand at a CAGR of 0.8% from 2012 to 2017, to be valued at US$23.4 billion by 2017.
Main Sectors Table sauces are the largest sector in the Japanese sauces, dressings and condiments market. This sector
was valued at US$9.9 billion in 2012. Cooking sauces are the second-largest sector, with total sales of US$5.7 billion in 2012. This sector grew by
1.7% from 2011. Pickled products are the third-largest market, but this sector has been shrinking gradually, influenced by a
decline in consumption. In 2012, total sales in this sector were slightly more than US$3 billion, a 2.9% decrease from the previous year. Pickled product sales will likely see a further decrease over the 2012-2017 period. Total sales of these products are projected to be US$2.8 billion by 2017, with a CAGR of -1.4% over the 2012-2017 period.
Main Companies and Brands Kikkoman Corp. was the largest company in Japan’s sauces, dressings and
condiments market, with a 7.7% share in 2012. The company’s major brand, Kikkoman, was the largest brand, accounting for a 6.8% share in 2012.
QP Corp. is the second-largest company, with a 6.6% share in 2012. This company
focuses on salad condiments and pasta sauces and Kewpie is its main brand. Forecast for 2012-2017 Table sauces are expected to have a slight increase in sales with a CAGR of 0.7%
from 2012 to 2017, reaching a total value of US$10.2 billion by 2017. Cooking sauces are expected to expand at a CAGR of 1.6%, registering US$6.2 billion by 2017. Tomato pastes and purées are also projected to enjoy continuous growth during this period, at a CAGR of 1.4%, reaching US$57 million by 2017.

PAGE 10
KEY MARKET SEGMENTS: 2011-2012 (continued)
Category 2011 2012* 2011-12 Growth
2017 2012-17 CAGR**
Ready meals 19,961.8 20,413.2 2.3% 22,499.3 2.0% Chilled ready meals 16,044.5 16,448.0 2.5% 18,298.4 2.2% Canned/preserved ready meals 1,573.2 1,601.2 1.8% 1,711.4 1.3% Frozen ready meals 1,055.3 1,074.0 1.8% 1,145.7 1.3% Prepared salads 479.3 482.1 0.6% 505.2 0.9% Chilled pizza 404.4 409.6 1.3% 437.0 1.3% Frozen pizza 294.0 289.6 -1.5% 287.3 -0.2% Dried ready meals 111.1 108.7 -2.2% 114.3 1.0%
Source: Euromonitor International, 2013 Note: A fixed exchange rate at US$1.00=JJ¥ 80.10 is applied for both historic and forecast data . * 2012 data is based on mid-year provisions and estimates. ** CAGR: compound annual growth rate
Japan’s Ready Meal Products, Retail Sales (Historic/Forecast) in US$ Millions
Ready meals Ready meals are quite popular within the Japanese packaged food market. There are numerous products
available, with many new offerings, making the market even more fragmented. In 2012, the total size of this segment reached US$20.4 billion, a 2.3% increase in sales from the previous year. This segment is forecast to grow at a CAGR of 2% from 2012 to 2017, to be valued at US$22.5 billion by 2017.
Main Sectors Chilled ready meals are dominant and the fastest-growing sector within the ready meals segment, with total
sales of US$16.4 billion in 2012. Chilled ready meals saw relatively healthy growth, with a 2.5% increase in sales from 2011.
Canned/preserved ready meals and frozen ready meals saw an increase in sales with 1.8% in 2012 over the
previous year. The canned/preserved ready meal market totaled US$1.6 billion, and frozen ready meals exceeded US$1 billion in sales in 2012.
Even though it is still a small market, the prepared salad sector has been growing in popularity. In 2012, this
sector totalled US$482 million, a 0.6% increase in sales from the previous year. Main Companies and Brands The ready meal segment in Japan is highly competitive among brand-name and numerous small
non-brand-name products. Convenience store chains, including 7-Eleven, AEON, and LAWSON, carry diverse self-branded private label products, which represent significant market share, increasing competition in this market. Among the packaged food manufacturers, House Foods Corp. was the largest, accounting for 1.7% share in 2012, and the company’s Kareya brand was the second largest-brand with a 1.5% share. QP Corp. was the next, representing 1.6% share. Its top brand, Salad Club, accounted for 1.1% share in 2012.
Forecast for 2012-2017 During the 2012-2017 period, chilled ready meals are forecast to see relatively healthy growth, with a CAGR
of 2.2%, reaching US$18.3 billion by 2017. Most other sectors will likely enjoy an average of a 1% increase in sales over this period, but frozen pizza will continuously experience a decrease in sales, at a CAGR of -0.2%.

PAGE 11
Fast-growing sectors Frozen processed red meat, prepared baby food, olive oil,
convalescence meal replacement and breakfast bars saw exceptional growth rates during the 2007-2012 period, compared to other packaged food sectors. While the growth rate was limited to slightly more than 1% in 2012 from 2011, these sectors are forecast to expand faster than most other sectors over the 2012-2017 period.
KEY MARKET SEGMENTS: 2011-2012 (continued)
Category 2011 2012* 2011-12 Growth 2017
2012-17 CAGR**
Frozen processed red meat 829.9 875.5 1.1% 1,038.5 3.5% Prepared baby food 304.8 324.8 1.3% 368.5 2.6% Olive oil 224.0 226.2 0.2% 255.0 2.4% Convalescence meal replacement*** 179.8 194.1 1.5% 264.0 6.3% Breakfast bars 158.7 171.5 1.6% 235.8 6.6%
Source: Euromonitor International, 2013 Note: A fixed exchange rate at US$1.00=JJ¥ 80.10 is applied for both historic and forecast data . * 2012 data is based on mid-year provisions and estimates. ** CAGR: compound annual growth rate *** Convalescence meal replacements are food substitutes that can be consumed as meals or substitutes to meals for seniors or people experiencing health problems. The leading global brands are Ensure (Abbott), Boost (Bristol-Myers Squibb), and Medi-F (Ajinomoto).
Japan’s Fast-Growing Packaged Food Sectors, Retail Sales (Historic/Forecast) in US$ Millions
Source: Shutterstock
Euromonitor International. "Consumer Lifestyles - Japan." January 14, 2013. Accessed: January 23, 2013. — "Baked Goods in Japan." January 2012. Accessed: January 28, 2013. — "Chilled Processed Food in Japan." October 2011. Accessed: January 25, 2013. — "Dried Processed Food in Japan." October 2011. Accessed: January 28, 2013. — "Packaged Food in Japan." January 2012. Accessed: January 23, 2013. — "Pastas in Japan." October 2011. Accessed: January 23, 2013. — "Ready meals in Japan." October 2011. Accessed: January 28, 2013. — "Sauces, dressings and condiments in Japan." January 2012. Accessed: January 28, 2013. Mintel Global New Products Database, 2013.
SOURCES

Consumer Trends: Packaged Food in Japan © Her Majesty the Queen in Right of Canada, represented by the Minister of Agriculture and Agri-Food (2013). ISSN 1920-6615 AAFC No. 12007E Photo Credits All photographs reproduced in this publication are used by permission of the rights holders. All images, unless otherwise noted, are copyright Her Majesty the Queen in Right of Canada. For additional copies, to request an alternate format, and for all other inquiries regarding this publication, please contact: Agriculture and Agri-Food Canada, Global Analysis Division 1341 Baseline Road, Tower 5, 4th floor Ottawa, ON Canada K1A 0C5 E-mail: [email protected] Aussi disponible en français sous le titre : Tendances de consommation : Les aliments emballés au Japon
The Government of Canada has prepared this report based on primary and secondary sources of information. Although every effort has been made to ensure that the information is accurate, Agriculture and Agri-Food Canada (AAFC) assumes no liability for any actions taken based on the information contained herein.
Reproduction or redistribution of this document, in whole or in part, must include acknowledgement of Agriculture and Agri-Food Canada as the owner of the copyright in the document, through a reference citing AAFC, the title of the document and the year. Where the reproduction or redistribution includes data from this document, it must also include an acknowledgement of the specific data source(s), as noted in this document. Agriculture and Agri-Food Canada provides this document and other report services to agriculture and food industry clients free of charge.