consumer perceptions of children’s furniture in shanghai
TRANSCRIPT
Consumer perceptions of children’s furniture
in Shanghai and Shenzhen, China
Master’s Thesis
Jiao Chen
June, 2013
Tiedekunta - Fakultet - Faculty
Faculty of Agriculture and Forestry
Laitos - Institution – Department
Department of Forest Sciences
Tekijä - Författare - Author
Jiao Chen
Työn nimi - Arbetets title - Title
Consumer perceptions of children’s furniture in Shanghai and Shenzhen, China
Työn laji/ - Arbetets art – Level
Master’s Thesis
Aika - Datum - Month and year
June 2013
Sivumäärä - Sidoantal - Number of pages 134
Tiivistelmä - Referat – Abstract China’s high-speed economic growth has accelerated consumers’ disposable income evidently. With the improvement of living standards, people have increasingly been concerned about their life quality, especially when buying consumables like food, toys and clothing as well as durable commodities like furniture for their children. In the past ten years, the Chinese children's furniture market has developed rapidly, making up 9% of total furniture market. However, no studies concerning the analysis of consumer behavior in this market segment exist so far. The objective of this study is to fill this gap by examining Chinese consumers’ perceptions of children’s furniture based on their socio-demographics, their attitudes towards product, supplier and environmental attributes. The empirical part of the study focused on analyzing quantitative data, which were collected by using a structured questionnaire in Shanghai and Shenzhen of China.The data were analyzed by a wide array of statistical analysis methods using SPSS software package. The final sample size was made up of 299 respondents. The data reveal that females accounted for 67% of the total respondents, with 63% of all respondents being in the range of 31-40 years old and 23% in the range of 20-30 years old. The results indicate that safety and environmental friendliness were the primary consideration for parents to purchase children’s furniture. And supplier quality was detected as the central dimension when respondents perceived different attributes of children’s furniture. In addition, 83% of the respondents chose solid wood as the primary raw material for children’s furniture, and 35% of them stated that they were willing to pay 6-10% more for environmentally friendly children's furniture. The choice of environmentally friendly products was closely connected with consumers’ lifestyle and majority of respondents expressed positive attitudes towards healthy and sustainable lifestyle. However, Chinese consumers showed low brand awareness in the children’s furniture market and their price expectations on solid wood furniture were below current market levels. Nevertheless, the Chinese children’s furniture presents a tremendous market potential not only for wooden furniture producers but also for both domestic and international wood raw material suppliers.
Keywords
Consumer perceptions, children’s furniture, Shanghai, Shenzhen, China
Säilytyspaikka - Förvaringsställe - Where deposited
Helsinki University Library, Viikki Campus Library Muita tietoja - Övriga uppgifter - Additional information
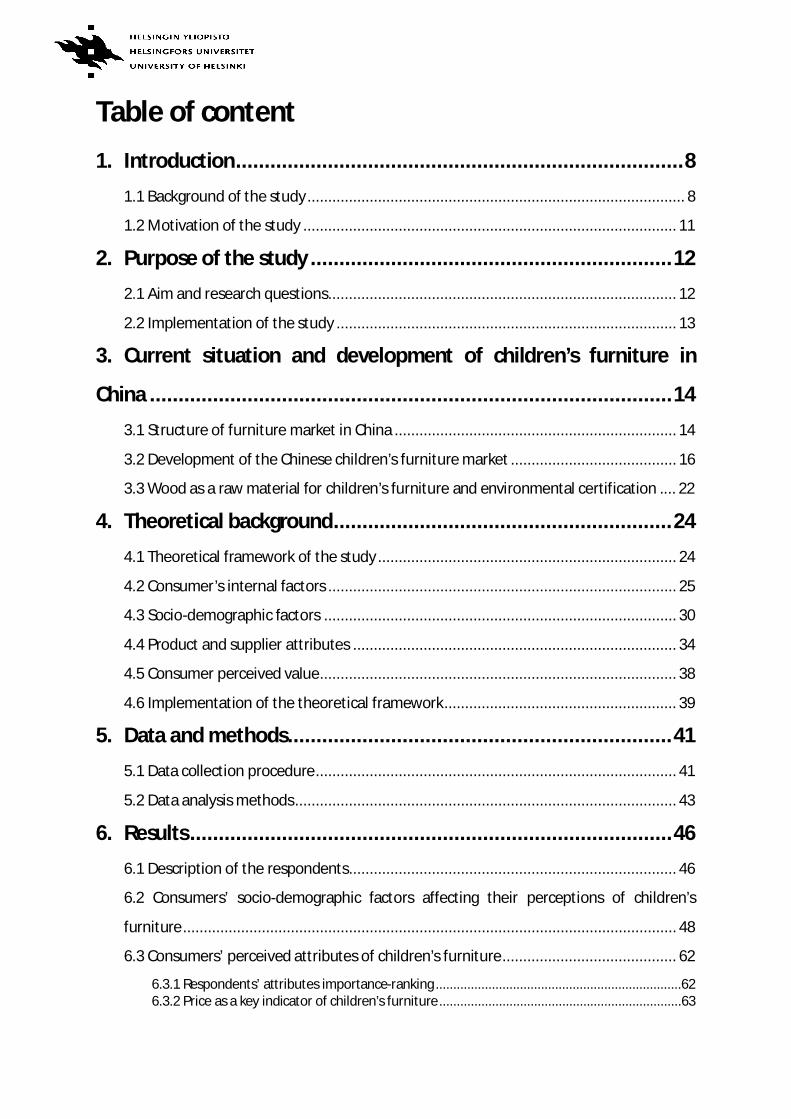
Table of content 1. Introduction .............................................................................. 8
1.1 Background of the study ........................................................................................... 8
1.2 Motivation of the study .......................................................................................... 11
2. Purpose of the study ............................................................... 12
2.1 Aim and research questions .................................................................................... 12
2.2 Implementation of the study .................................................................................. 13
3. Current situation and development of children’s furniture in
China ........................................................................................... 14
3.1 Structure of furniture market in China .................................................................... 14
3.2 Development of the Chinese children’s furniture market ........................................ 16
3.3 Wood as a raw material for children’s furniture and environmental certification .... 22
4. Theoretical background ........................................................... 24
4.1 Theoretical framework of the study ........................................................................ 24
4.2 Consumer’s internal factors .................................................................................... 25
4.3 Socio-demographic factors ..................................................................................... 30
4.4 Product and supplier attributes .............................................................................. 34
4.5 Consumer perceived value ...................................................................................... 38
4.6 Implementation of the theoretical framework ........................................................ 39
5. Data and methods ................................................................... 41
5.1 Data collection procedure ....................................................................................... 41
5.2 Data analysis methods ............................................................................................ 43
6. Results .................................................................................... 46
6.1 Description of the respondents ............................................................................... 46
6.2 Consumers’ socio-demographic factors affecting their perceptions of children’s
furniture ....................................................................................................................... 48
6.3 Consumers’ perceived attributes of children’s furniture .......................................... 62
6.3.1 Respondents’ attributes importance-ranking ......................................................................62 6.3.2 Price as a key indicator of children’s furniture .....................................................................63
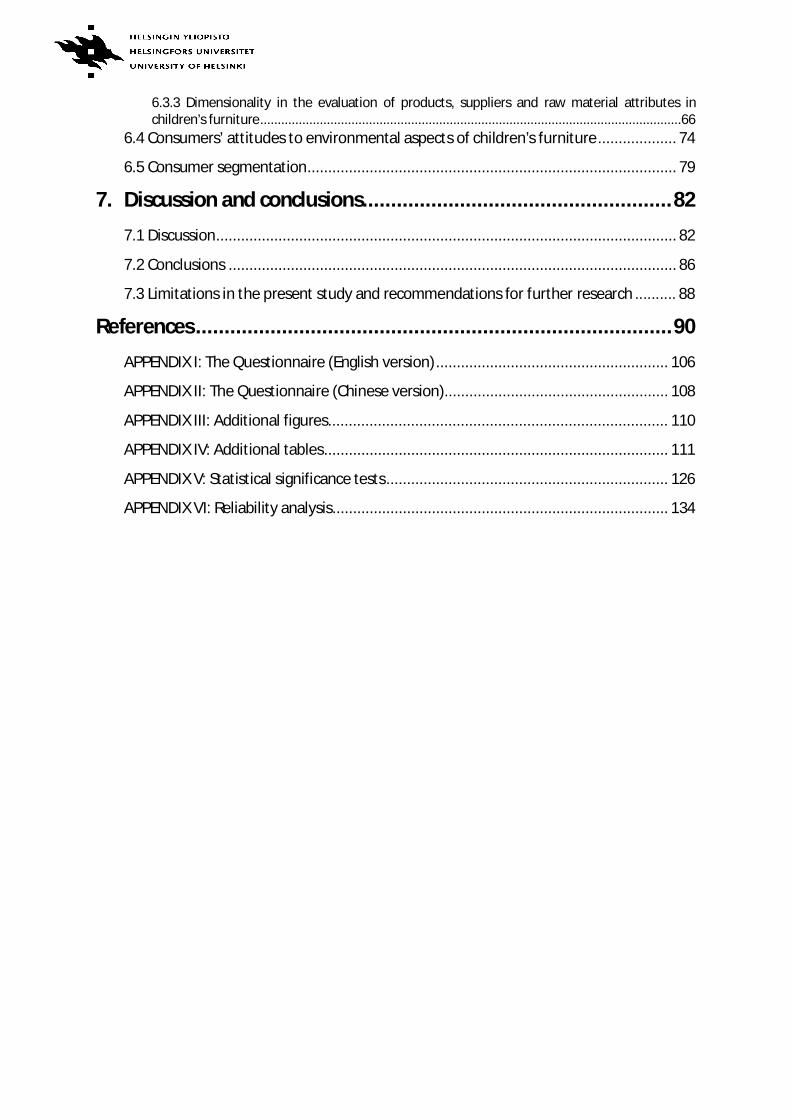
6.3.3 Dimensionality in the evaluation of products, suppliers and raw material attributes in children’s furniture ........................................................................................................................66
6.4 Consumers’ attitudes to environmental aspects of children’s furniture ................... 74
6.5 Consumer segmentation ......................................................................................... 79
7. Discussion and conclusions ...................................................... 82
7.1 Discussion ............................................................................................................... 82
7.2 Conclusions ............................................................................................................ 86
7.3 Limitations in the present study and recommendations for further research .......... 88
References ................................................................................... 90
APPENDIX I: The Questionnaire (English version) ........................................................ 106
APPENDIX II: The Questionnaire (Chinese version)...................................................... 108
APPENDIX III: Additional figures.................................................................................. 110
APPENDIX IV: Additional tables ................................................................................... 111
APPENDIX V: Statistical significance tests .................................................................... 126
APPENDIX VI: Reliability analysis ................................................................................. 134
List of Figures Figure 3-1.Distribution of Chinese furniture industry …………………………………………………………14
Figure 3-2.Components of children’s furniture ………………………………………………………………….20
Figure 3-3.A typical set of children’s furniture (a) ………………………………………………………………20
Figure 3-4.A typical set of children’s furniture (b) ………………………………………………………………21
Figure 3-5.Logos of three forest certifications ……………………………………………………………………24
Figure 4-6.Theoretical framework of the study……………………………………………………………………25
Figure 4-7.Hofstede’s cultural dimension scores of China and Finland ………………………………31
Figure 5-8.Methods of analysis ………………………………………………………………………………………….44
Figure 6-9.Frequency of changing children’s furniture by gender……………………………………….49
Figure 6-10.Frequency of changing children’s furniture by age group…………………………………49
Figure 6-11.Price preference for a set of children’s furniture by gender……………………………..50
Figure 6-12.Perception of lifestyle statement “B10c” by gender ………………………………………..50
Figure 6-13.Preference for information channel of children’s furniture (Advertisement and
Furniture stores) by marital status ………………………………………………………………….51
Figure 6-14.Perception of lifestyle statement “B10e” by marital status ……………………………..52
Figure 6-15. Preference for information channel of children’s furniture (Professional
magazine and the Internet) by education………………………………………………………..53
Figure 6-16.Perception of lifestyle statement “B10a” by education …………………………………..53
Figure 6-17.Perception of lifestyle statement “B10f” by education ……………………………………54
Figure 6-18.Possession of children’s room and furniture by income …………………………..........55
Figure 6-19.Importance-ranking of reasonable price by income ………………………………………..55
Figure 6-20.Perception of lifestyle statement “B10c” by income ……………………………………….56
Figure6- 21.Respondents’ importance-ranking of reference groups ………………………………….57
Figure 6-22.Respondents’ preference for Information channels of children’s furniture ……58
Figure 6-23.Respondents’ most preferred material of children’s furniture by city …………….59
Figure 6-24.Respondents’ price preference for a set of children’s furniture by city …………..60
Figure 6-25.Respondents’ brand awareness of children’s furniture by city ………………………..61
Figure 6-26.Respondents’ preference for well-known brand furniture stores by city ………..61
Figure 6-27.Respondents’ price preference for a set of children’s furniture ……………………..64
Figure 6-28.Respondents’ price preference for different components of children’s
furniture ………………………………………………………………………………………………………..64
Figure 6-29.Respondents’ preference for the material of children’s furniture …………………..65
Figure 6-30.Respondents’ price preference for a set of solid wood children’s furniture …….65
Figure 6-31.Comparing means between Factor 1 and WTP ……………………………………………….70
Figure 6-32.Comparing means between Factor 3 and income …………………………………………..71
Figure 6-33.Comparing means between Factor 3 and respondents’ price preference for a set
of children’s furniture ……………………………………………………………………………………71
Figure 6-34.Comparing means between Factor 3 and WTP ……………………………………………….72
Figure 6-35.Comparing means between Factor 4 and marital status …………………………………73
Figure 6-36.Comparing means between Factor 4 and WTP ……………………………………………….73
Figure 6-37.Respondents’ stated WTP premiums for environmentally friendly children’s
furniture ………………………………………………………………………………………………………..75
Figure 6-38.Respondents’ stated WTP by city ……………………………………………………………………76
Figure 6-39.Respondents’ stated WTP by education ………………………………………………………….77
Figure 6-40.Respondents’ stated WTP by their importance-ranking of reasonable price …..77
Figure 6-41.Respondents’ stated WTP by their price sensitivity ………………………………………..78
List of Tables
Table 1-1.China: GDP and composition of GDP, 1990-2011 …………………………………………………8
Table 1-2.China: urban and rural household income and consumption, 1990-2011 …………….9
Table 4-3.Implementation of the framework ……………………………………………………………………. 41
Table 6-4.Background of the respondents ………………………………………………………………………….47
Table 6-5.Respondents' attributes importance-ranking ………………………………………………………63
Table 6-6.Total Variance Explained ……………………………………………………………………………………..66
Table 6-7.Rotated Component Matrix ………………………………………………………………………………..67
Table 6-8.Variables that composed the factor …………………………………………………………………….67
Table 6-9.Results of ANOVA test at the 0.05 level of significance ……………………………………….69
Table 6-10.Respondents' importance-ranking of properties of environmentally friendly
furniture …………………………………………………………………………………………………………..74
Table 6-11.Respondents' importance-ranking of lifestyle statements ………………………………..79
Table 6-12.Cluster descriptions and centre values ……………………………………………………………..80
Table 6-13: Characteristics of each respondent cluster and cluster comparisons ……………….81
8
1. Introduction
1.1 Background of the study
China has witnessed an unprecedented period of economic growth in the last two decades.
As one of the most important measures of economic growth, GDP (Gross Domestic Product)
can be defined as the sum total of goods and services consumed by a nation in a given year
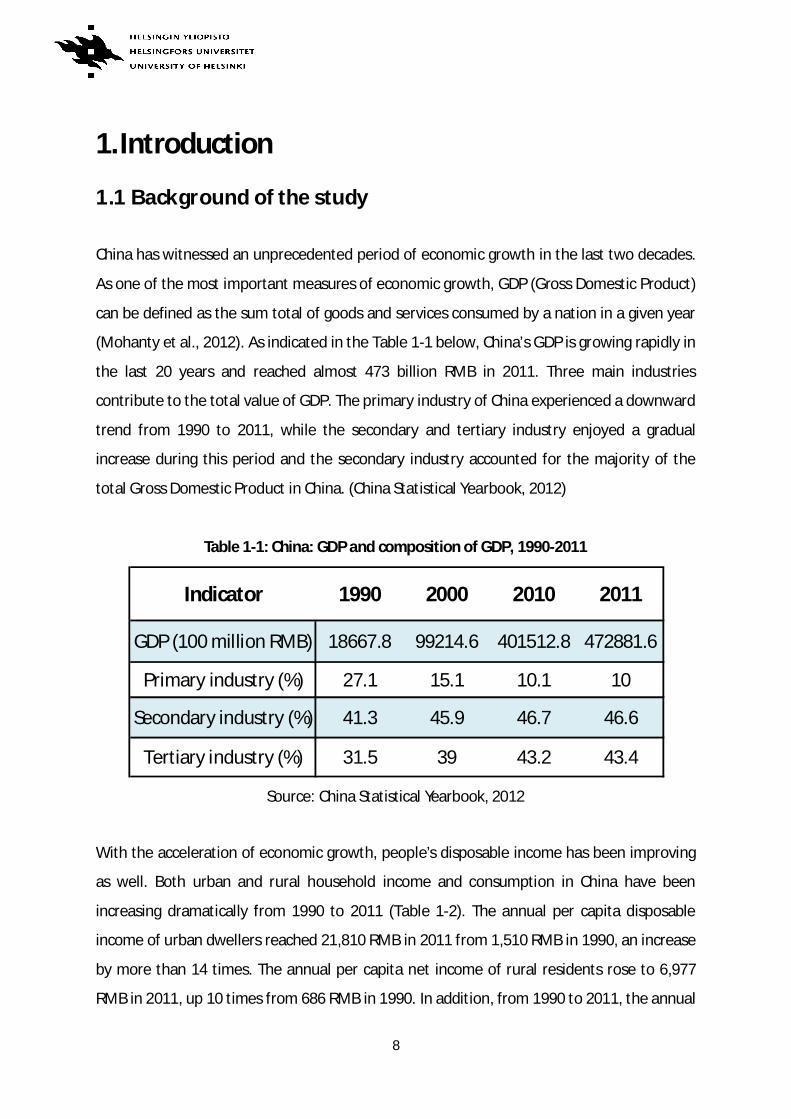
(Mohanty et al., 2012). As indicated in the Table 1-1 below, China’s GDP is growing rapidly in
the last 20 years and reached almost 473 billion RMB in 2011. Three main industries
contribute to the total value of GDP. The primary industry of China experienced a downward
trend from 1990 to 2011, while the secondary and tertiary industry enjoyed a gradual
increase during this period and the secondary industry accounted for the majority of the
total Gross Domestic Product in China. (China Statistical Yearbook, 2012)
Table 1-1: China: GDP and composition of GDP, 1990-2011
Source: China Statistical Yearbook, 2012
With the acceleration of economic growth, people’s disposable income has been improving
as well. Both urban and rural household income and consumption in China have been
increasing dramatically from 1990 to 2011 (Table 1-2). The annual per capita disposable
income of urban dwellers reached 21,810 RMB in 2011 from 1,510 RMB in 1990, an increase
by more than 14 times. The annual per capita net income of rural residents rose to 6,977
RMB in 2011, up 10 times from 686 RMB in 1990. In addition, from 1990 to 2011, the annual
Indicator 1990 2000 2010 2011
GDP (100 million RMB) 18667.8 99214.6 401512.8 472881.6
Primary industry (%) 27.1 15.1 10.1 10
Secondary industry (%) 41.3 45.9 46.7 46.6
Tertiary industry (%) 31.5 39 43.2 43.4
9
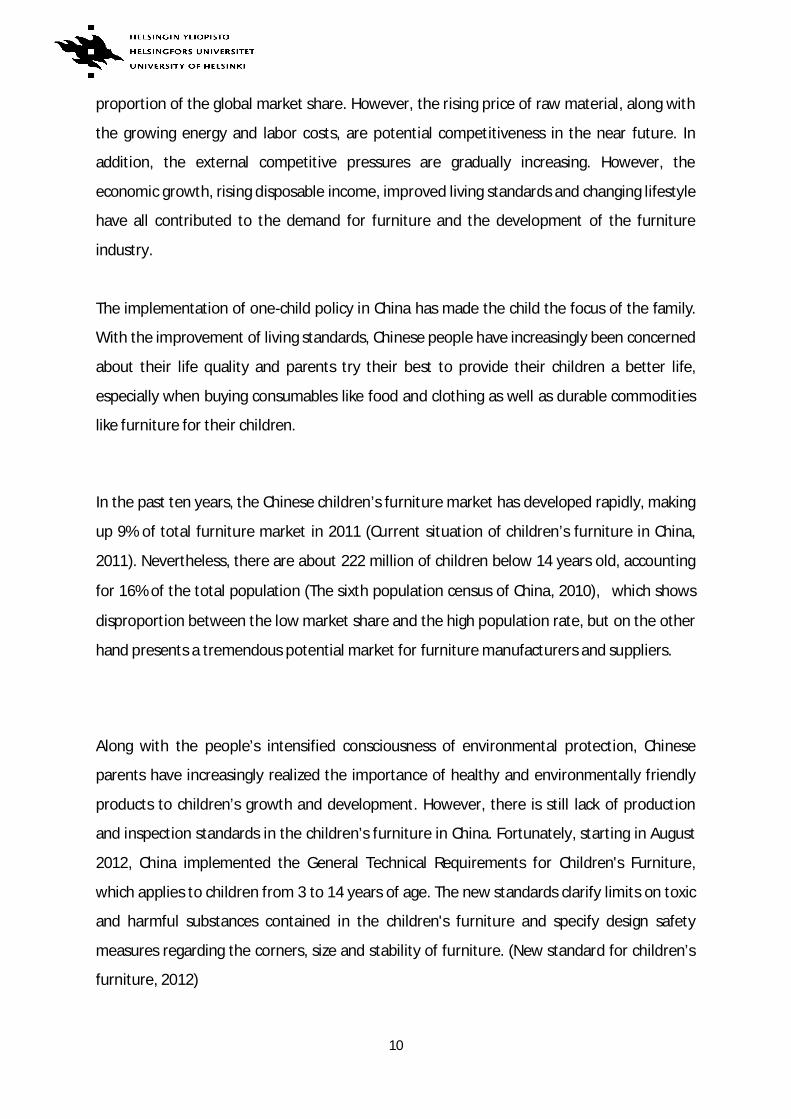
per capita consumption expenditure of households also showed an enormous upward trend,
growing by roughly 12 times in urban households and 9 times in rural households. (China
Statistical Yearbook, 2012)
Table 1-2: China: urban and rural household income and consumption, 1990-2011
Source: China Statistical Yearbook, 2012
The enhancement of living standards impacts consumers’ spending patterns directly. The
consumption structure of Chinese consumers has been transforming from the basic
necessities of life to higher level of products, from commodity and quantitative consumption
to service and quality consumption (ITC/ITTO, 2005). The proportion of basic consumables
such as clothing and food has decreased, while consumption on living conditions and
recreation has ascended. China’s housing industry is enjoying prosperous growth. The
average housing space for urban residents is increasing, which craves for better appliances
and improving home environment (China Statistical Yearbook, 2012).
As one composition of the secondary industry, furniture industry in China has also
experienced considerable development. Today, China is the largest producer, exporter and
consumer of furniture worldwide (CSIL, 2012). Low costs make it possible to occupy a large
Items 1990 2000 2010 2011
Annual per capitadisposable income of urbanhouseholds (RMB)
1510 6280 19109 21810
Annual per capita netincome of rural households(RMB)
686 2253 5919 6977
Annual per capitaconsumption expenditureof urban households (RMB)
1279 4998 13471 15161
Annual per capita livingexpenditure of ruralhouseholds (RMB)
585 1670 4382 5221
10
proportion of the global market share. However, the rising price of raw material, along with
the growing energy and labor costs, are potential competitiveness in the near future. In
addition, the external competitive pressures are gradually increasing. However, the
economic growth, rising disposable income, improved living standards and changing lifestyle
have all contributed to the demand for furniture and the development of the furniture
industry.
The implementation of one-child policy in China has made the child the focus of the family.
With the improvement of living standards, Chinese people have increasingly been concerned
about their life quality and parents try their best to provide their children a better life,
especially when buying consumables like food and clothing as well as durable commodities
like furniture for their children.
In the past ten years, the Chinese children’s furniture market has developed rapidly, making
up 9% of total furniture market in 2011 (Current situation of children’s furniture in China,
2011). Nevertheless, there are about 222 million of children below 14 years old, accounting
for 16% of the total population (The sixth population census of China, 2010), which shows
disproportion between the low market share and the high population rate, but on the other
hand presents a tremendous potential market for furniture manufacturers and suppliers.
Along with the people’s intensified consciousness of environmental protection, Chinese
parents have increasingly realized the importance of healthy and environmentally friendly
products to children’s growth and development. However, there is still lack of production
and inspection standards in the children’s furniture in China. Fortunately, starting in August
2012, China implemented the General Technical Requirements for Children's Furniture,
which applies to children from 3 to 14 years of age. The new standards clarify limits on toxic
and harmful substances contained in the children's furniture and specify design safety
measures regarding the corners, size and stability of furniture. (New standard for children’s
furniture, 2012)
11
Actually, early in July 2001, the standard “Green Furniture” was released by the China
Certification Committee for Environment Label Products, which took the first step in
building environmental protection standard and label for the furniture industry in China.
The standard emphasizes on the materials for assembled furniture, such as plank materials,
metal, paint and adhesives. Thus, the new competition on environmental aspects was
expected among manufacturers in the wood products industry. (ITC/ITTO, 2005)
Chinese consumers have been used to referring to the general furniture standards when
choosing furniture for their children and considering some superficial problems such as
pungent paint smells. With the new specific standard for children's furniture, environmental
aspects are being stressed in the design and manufacturing of the products, and the use of
harmful adhesives and chemicals are being avoided, the share of natural raw materials is
being maximized. Taken together, these will secure the legal rights of consumers to some
extent and facilitate the better functioning of the whole market as well.
1.2 Motivation of the study
Since China is playing a crucial role in the global furniture market, it is necessary to analyze
the current state of the Chinese furniture industry, especially the increasingly important
sector of the Chinese children’s furniture. Apart from the external competitiveness and
challenges, the internal impacts and demand in the domestic market should also be
considered seriously. In spite of the main macro drivers such as economic development and
policy implementation that were mentioned above, the behavior and perception of
domestic consumers regarding children’s furniture should be explored as well because they
are the important forces that stimulate the development of this market segment.
12
In addition, the wooden furniture manufacturing constitutes the highest percentage of the
Chinese furniture manufacturing sector, and the market share of wood products has been
growing because of Chinese consumers’ preference for natural materials, rather than
materials like plastic, steel or glass, as well as Chinese parents’ increasing concern of their
children’s healthy growth. The Chinese children’s furniture segment presents a growing
high-end market potential not only for wooden furniture producers, but also for both
domestic and international wood raw material suppliers. However, no studies concerning
the analysis of consumer behavior in this market segment exist so far, especially there is a
lack of knowledge of consumer attitudes on environmental and other attributes of furniture
products in China. Thus, the research of consumer perceptions of children’s furniture in
China is highly relevant for both industry and retail sector.
2. Purpose of the study
2.1 Aim and research questions
In recent years, China’s furniture industry has gone through a phase of vigorous and
prosperous growth towards the future. China is becoming the manufacturing center of the
global furniture and is playing an increasingly significant role in the world’s furniture industry
and trade. As one of the fastest growing sectors of the furniture industry, the children’s
furniture in China has evolved from the immature stage to the early growth stage in the past
ten years, but there is still a long way to go in terms of its more sophisticated production,
marketing and research and development (R&D), which provide opportunities for furniture
manufacturers to improve. Besides, any market cannot survive without its consumers and it
is necessary for producers and suppliers to understand consumers’ needs, and to cater for
their expectations towards product quality, service and brand since their attention of the
living environment and conditions of sustainable living is strengthening especially all the
time.
The aim of this study is to investigate consumer perceptions of children’s furniture in two
13
cities – Shanghai and Shenzhen in China. This study will start with providing a general
overview of the children’s furniture market in China, followed by looking into the domestic
market focusing on Chinese consumers’ purchasing behavior and their perceptions of the
children’s furniture.
The main research questions of the study are as follows:
1. Which socio-demographic factors affect Chinese consumers’ choices of children’s
furniture?
2. How important do Chinese consumers perceive different product and supplier attributes
of children’s furniture?
3. What attributes make children’s furniture environmentally friendly from the perspective
of Chinese consumers?
2.2 Implementation of the study
The implementation of the study begins by briefly providing the background and the macro
environment of the children’s furniture in China in Chapter 1 and 3. This also lays the basis
of motivation to show why this research has relevance, followed by presenting the specific
purpose of the study.
The theoretical background can be found in Chapter 4, which is mainly based on the theory
of consumer buying behavior. Hawkins et al.’s (2001) consumer behavior model is referred
to as the theoretical framework to see which factors influence consumers’ perceptions of
children’s furniture and how importantly the factors affect. The framework guides the
empirical implementation of the study and indicates the internal connections between
theories and the empirical part of the study.
Then in Chapter 5, the research data and methods are given. In this study, the data are
based on two surveys gathered from respondents in two cities of China. The survey data are
analyzed by a wide array of statistical analysis methods using SPSS software package.
14
Chapter 6 presents the main results regarding consumers’ perceptions of children’s
furniture in accordance with the main research questions. Finally, the discussion and
conclusions based on the analysis are drawn in Chapter 7.
3. Current situation and development of children’s furniture in China
3.1 Structure of furniture market in China
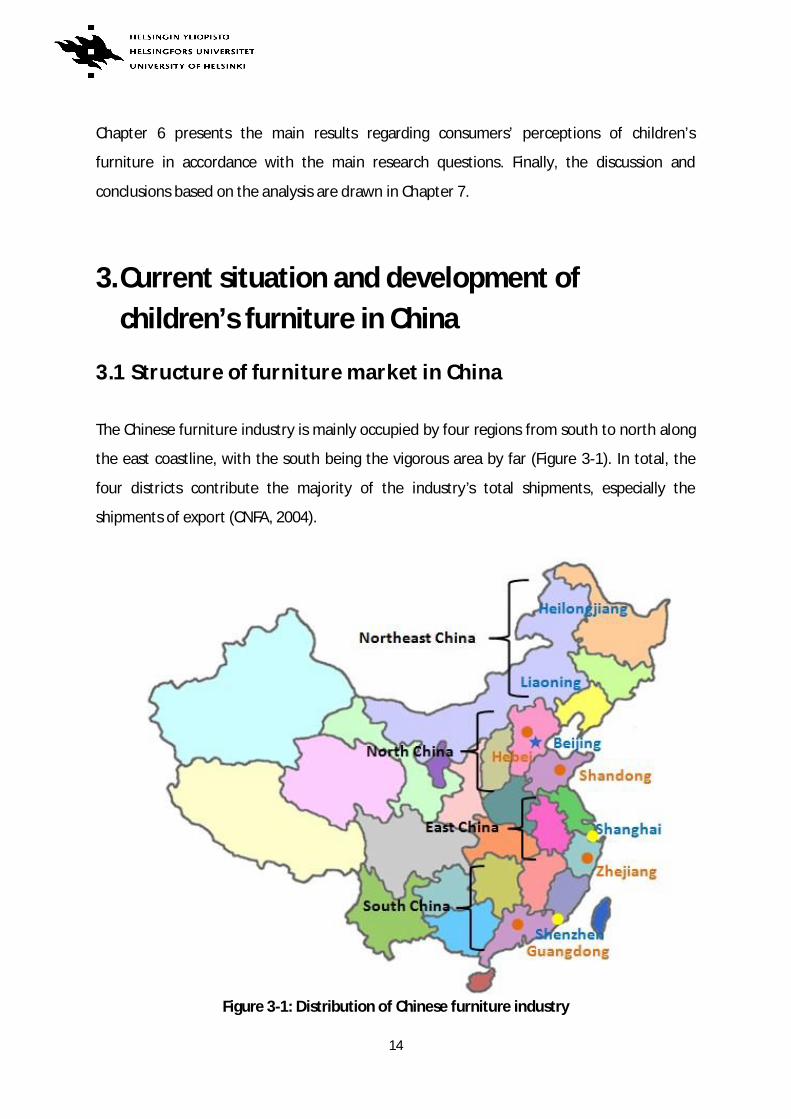
The Chinese furniture industry is mainly occupied by four regions from south to north along
the east coastline, with the south being the vigorous area by far (Figure 3-1). In total, the
four districts contribute the majority of the industry’s total shipments, especially the
shipments of export (CNFA, 2004).
Figure 3-1: Distribution of Chinese furniture industry
15
Source: CNFA, 2004
Among these four major regions, Guangdong (including Shenzhen) is the top furniture
producing province in the south. It hosts abundant furniture manufacturing and supplying
firms and is the industry’s leading production and export region. It is followed by Zhejiang
Province and the fastest growing market: Shanghai. They are the center of furniture industry
in the Yangtze River Delta in East China. The third-largest area is made up of Shandong
Province, Hebei Province and the capital city Beijing with its adjacent district Tianjin in North
China. The northeastern region is comprised of the provinces of Liaoning and Heilongjiang.
(CNFA, 2004) In addition, increasing investments from Hong Kong, Taiwan, and some
American and European furniture manufacturers have expanded capacity since the late
1980s, contributing to this distribution (Sun et al., 2005).
A large number of Chinese furniture companies are structured by small and medium-size,
while large-sized firms account for only a small proportion of the total industry. In terms of
ownership, less than 10% of Chinese furniture enterprises are state owned, the types are
consisting of foreign owned, domestic Chinese privately owned, stock-holding companies
and various joint ventures (Xu, 2004). The most important transform is that the state-owned
companies are phasing out and private and joint-venture/foreign direct invested companies
are presently the main manufacturers in the Chinese furniture industry (Hunter, 2007).
Today, China overtakes the United States and has become the largest furniture producing
country in the world, and ranks first in terms of export shipment value, leaving Italy and
Germany behind (CSIL, 2012). However, the Chinese furniture, including the children’s
furniture, is mainly low-end associated with designs with simple imitation and the lack of
originality since most firms don’t have design teams and there is an appreciable shortage of
qualified furniture design professionals in China. Chinese manufacturers are reluctant to
purchase copyrights to foreign designs or employ foreign designers because of the high costs
(ITC/ITTO, 2005). According to Italy Trade Commission (2011), Original Equipment
Manufacturer (OEM) orders currently account for more than 80% of China’s furniture
exports, and there are only few well-known Chinese furniture brands in the marketplace.
16
3.2 Development of the Chinese children’ furniture market
The children’s furniture manufacturing in China took the initial step in the late 1980s, while
only sporadic furniture manufacturers were specializing in children’s furniture. The market
started to form at a small scale till 1998 and acted as a separate specialized segment till
2001 when China joined the World Trade Organization. It took off in 2003 and has
developed dramatically in the last ten years. (Future prospects of children’s furniture, 2012)
Compared with developed countries in Europe and the United States, the children’s
furniture market in China has started rather late. Earlier, most of the children’s furniture in
China was simplified adult furniture, which could not cater for special psychological and
physical requirements of children (Luo, 2012).
However, with the fierce competition and increasing domestic demand for children’s
furniture, even during the period of global financial crisis, the segment was under stable
development. In addition, consumers are transforming from simply concerned about the
price to focusing on safety, environmental friendliness, design, brand and some other
intangible attributes of the product. More and more manufacturers have realized this
market potential and engaged in developing this segment. Some large furniture stores have
also set up special sales area (shop-in-shops) for children’s furniture. So far, there are about
200 children’s furniture enterprises in China but there is a lack of well-known domestic
brands. At present, foreign brands of children’s furniture occupy 30% of the domestic
market. The remaining 70% of the market share consists of 30% of domestic brands and the
rest is under the non-branded products with ineffective competitive situation (Luo, 2012).
Competition from imported children’s furniture enterprises remains intensive from the time
when non-tariff on imported furniture was applicable in 2005, which had the effect of
opening the Chinese market to medium and lower levels of furniture from Southeast Asia
and high-grade furniture from Europe and North America (ITC/ITTO, 2005). The removal of
tariff barriers is enabling imported furniture to compete with local products. Suffering from
low product quality and technical level, poor design and insufficient volumes of high-grade
17
products, the children’s furniture market presents a situation of poor management and
lacking standardization, but at the same time also provides enormous potential for
development and improvement. In recent years, the Chinese children’s furniture segment
has been supported by the government. The impact of foreign brands will also expel some
small-scale or inefficient local enterprises out of the market, which is beneficial to the
healthy growth of domestic market.
Currently, there are four major well-known brands of wooden children’s furniture in China,
including foreign as well as domestic manufacturers: FLEXA, Comagic, Sampo and X.M.B.
FLEXA, an internationally renowned leading brand origins from
Denmark and has established stores in Beijing, Tianjin, Shanghai and Shenzhen of China. It
has been specializing in producing and designing children’s furniture for over 30 years and
possessed the largest scale and high level of the products in Europe. It offers abundant
options and combinations to suite child’s room, age, interest and taste, and the products
can be expanded to cater for child’s changing needs. It clarifies standards pertaining to the
safety issue. The main raw material used for children’s furniture is Arctic pine that grows
slowly in cold climate, making its structure more intensified and its quality better than other
pines. (Solid wood children’s furniture, 2011; FLEXA, 2013)
Comagic is a domestic brand that was established in Guangzhou in
2008, with its branch offices in Beijing and Shanghai and export destinations such as
Malaysia, Russia, Greece and South Africa. It has successfully attained authorized licenses of
international and domestic famous animation and cartoon brands including Disney, Time
Warner, Hello Kitty and Doraemon since establishment. It perfectly combines elements of
animation and cartoon figures with furniture and household products to provide children
with high quality products and perfect design concept. New Zealand pine makes up the main
18
raw material of the products. (Solid wood children’s furniture, 2011; Comagic, 2013)
Sampo is another domestic furniture manufacturer
focusing on the development and design of children’s furniture. So far, there are over 300
distributors all over China and it expands markets into foreign countries like Japan, Korea
and Australia. The main raw material is Finland pine. (Solid wood children’s furniture, 2011;
Sampo, 2013).
X.M.B is a company specializing in design, production and sales
of modern furniture and focusing on pine furniture manufacturing in the past 22 years.
X.M.B has its own R&D and design team from America, Hong Kong and Taiwan and
children’s furniture brand BOBI. It is one of the minority enterprises that hold the Forest
Stewardship Council (FSC) certification and the main raw material origins from Brazil pine
growing in rainforest (Solid wood children’s furniture, 2011; X.M.B, 2013)
The four brands have some characteristics in common. The main raw material for producing
children’s furniture in all these four companies are imported pine wood. Each firm has its
own advanced production technique and is making efforts to create green and healthy
lifestyle for children. They all hold certain certificates to ensure the quality and safety of
products. FLEXA maintains the highest price in the Chinese children’s furniture market due
to its high quality and reputation. The price for a set of children’s furniture is around 30,000
RMB, which exceeds the average Chinese household monthly income even in big cities and
most of them cannot afford such high price level. The price of a set of children’s furniture of
both Comagic and Sampo is about 20,000 RMB. For X.M.B., such price is approximately
15,000 RMB and the price of a piece of children’s furniture ranges from 2,000 to 5,000 RMB,
which are relatively lower comparing with other three brands. One previous research
conducted in 2011 indicated that in terms of raw material, quality and environmental
19
friendliness, FLEXA and Comagic were most suitable for children. But Comagic seemed to be
more competitive and it possessed more advantages in its design and price, which was
favored by most parents. (Comparison between four well-known solid wood children’s
furniture brands, 2011)
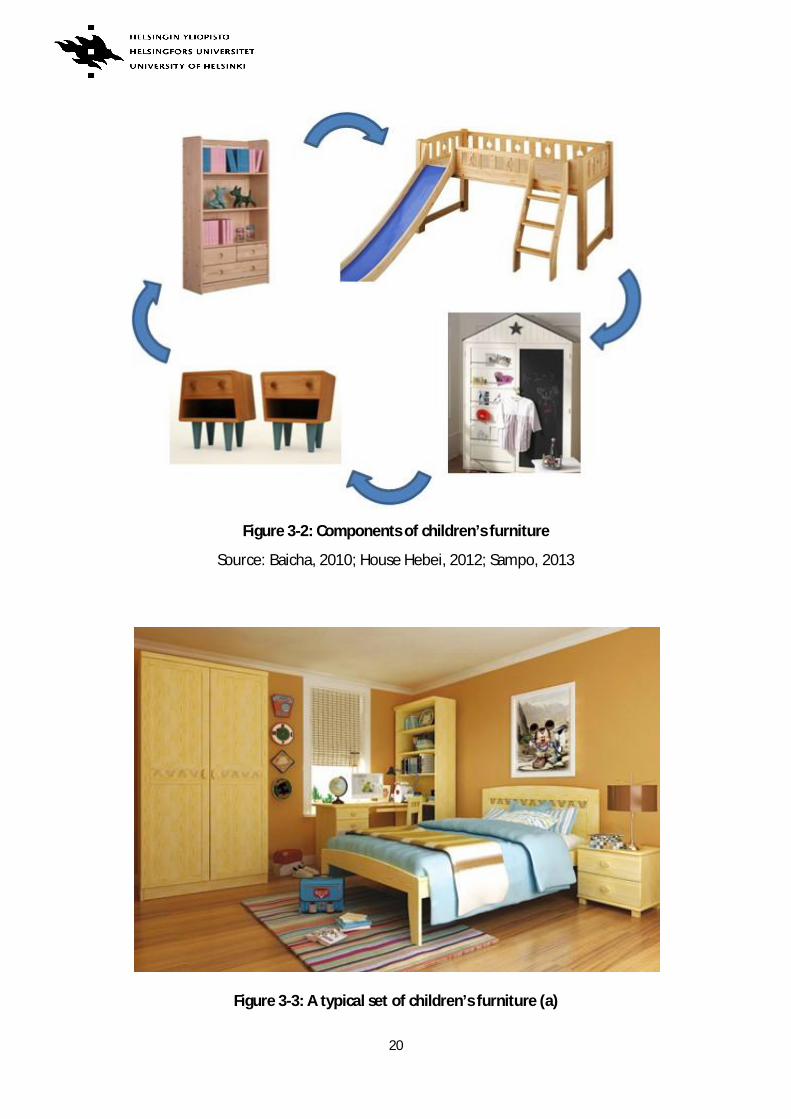
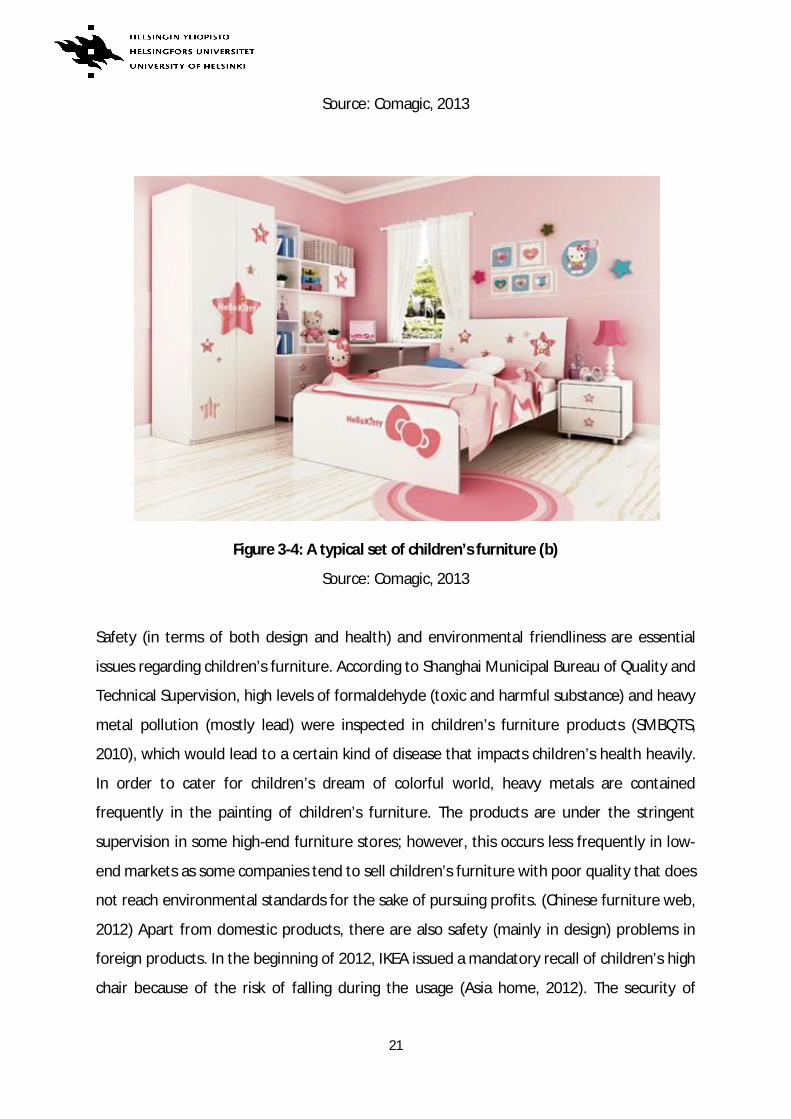
Normally, a typical set of children’s furniture consists of bed, bedside cabinet, wardrobe and
bookcase (Figure 3-2), sometimes even includes table and chair. Composite panel is widely
utilized in producing children’s furniture due to its low cost (Chinese furniture web, 2012).
And its market share has been growing compared to last year, especially in less developed
cities in China and maintains its competitiveness in low-end market. Additionally, children’s
furniture made of pine wood is increasingly preferred by consumers along with their
intensified consciousness of environmental protection. The enhancement of entertainment
and functionality is emphasized in current market that is beneficial to children’s creativity
development. (Children’s furniture highlights, 2013) The appropriate combination of each
component will reflect children’s individual characteristics and provide them with a better
living and studying environment, which is of substantial significance to their mental and
physical healthy growth. Thus, most companies offer completed collocation with the whole
set of products as Figure 3-3 and 3-4 indicate which seems more convenient and time-saving
for consumers.
20
Figure 3-2: Components of children’s furniture
Source: Baicha, 2010; House Hebei, 2012; Sampo, 2013
Figure 3-3: A typical set of children’s furniture (a)
21
Source: Comagic, 2013
Figure 3-4: A typical set of children’s furniture (b)
Source: Comagic, 2013
Safety (in terms of both design and health) and environmental friendliness are essential
issues regarding children’s furniture. According to Shanghai Municipal Bureau of Quality and
Technical Supervision, high levels of formaldehyde (toxic and harmful substance) and heavy
metal pollution (mostly lead) were inspected in children’s furniture products (SMBQTS,
2010), which would lead to a certain kind of disease that impacts children’s health heavily.
In order to cater for children’s dream of colorful world, heavy metals are contained
frequently in the painting of children’s furniture. The products are under the stringent
supervision in some high-end furniture stores; however, this occurs less frequently in low-
end markets as some companies tend to sell children’s furniture with poor quality that does
not reach environmental standards for the sake of pursuing profits. (Chinese furniture web,
2012) Apart from domestic products, there are also safety (mainly in design) problems in
foreign products. In the beginning of 2012, IKEA issued a mandatory recall of children’s high
chair because of the risk of falling during the usage (Asia home, 2012). The security of
22
children’s furniture once again became the focus of the public attention, which should be
taken seriously by the furniture manufacturers.
3.3 Wood as raw material for children’ furniture and
environmental certification
The furniture industry hinges substantially on wood and wood-based materials throughout
history. Wood excels in performance, manufacturing and appearance characteristics (Shelly,
2001). From the consumer’s perspective, wood is the overwhelming choice due to its
reliability, environmental friendliness and pleasing appearance (Pakarinen, 1999). Although
those non-wood materials such as metals and plastics have made significant inroads into
furniture manufacturing, the bulk of the furniture made today is still made of wood or wood-
based materials (Shelly, 2001).
Environmental aspects of furniture rely heavily on the raw materials adopted –
consequently the use of certified wood under sustainable management is essential in terms
of wooden furniture (Parikka-Alhola, 2008). Especially for the wooden children’s furniture,
materials with high quality and certification are important elements for parents to choose
products for their children. Today most furniture manufacturers are making efforts to
improve reputation and image by incorporating more environmentally friendly and social
responsible activities in their operation process.
Wooden furniture manufacturing made up the largest proportion of the Chinese furniture
manufacturing sector in 2010 at around 58% of the total furniture manufacturing revenue.
This growth was driven by strong domestic and foreign demand, with exports increasing
rapidly. (CNFA, 2011)
Nevertheless, China is a forest resource scarcity country on a per capita basis, plus its
natural forest protection and restriction policies, which lead to excessive reliance on timber
imports. Due to huge demand of wood for the furniture industry, China obtains raw
23
materials mainly from countries like the United States, Canada and European countries, and
then produces these raw materials into finished wood furniture products to sell back to the
regions (United Nation, 2009). Wood materials for children’s furniture in China are mostly
covered by pine species imported from New Zealand, Brazil, Russia and other Nordic
countries (Current situation of children’s furniture in China, 2011).
Environmental certification is adopted by a growing number of companies especially forest
industry companies (Li and Toppinen, 2011) since it can be taken as one of the important
attributes for consumers to make purchasing decisions. The FSC and the Programme for the
Endorsement of Forest Certification (PEFC) are most widely used forest certification
programs worldwide (Cai and Aguilar, 2013). By April 2013, FSC had certified 176.7 million ha
of forests in 79 countries, 4.55% of which were in Asia and in China 3 million ha were
certified (FSC, 2013). Among those three famous domestic brands of children’s furniture
mentioned above, only X.M.B. is certified by the FSC. On the other hand, 244 million ha of
forests distributed in 29 countries were globally certified under PEFC standards by April 2013
(PEFC, 2013). Both the FSC and the PEFC have been gradually emphasized by domestic
furniture companies as they are important for the exports of products especially to North
America and European countries.
Definitely, China has made active endeavor on forest certification since 1990s and the launch
of China Forest Certification Scheme occurred in 2010 that suited China’s own national
forest conditions (CFCC, 2013). China Forest Certification Council (CFCC) has joined the PEFC
in 2011 and built a platform to facilitate the interaction with and between stakeholders in
promoting forest sustainable management (CFCC, 2013; PEFC, 2013). The logos of these
three certifications are shown in Figure 3-5 below. In this study, environmental certification
is one of the indicators to identify consumers’ understanding of environmentally friendly
wood products. Such certification can also affect their first impression of the product they
intend to purchase and may increase their trust in certain brands.
24
Figure 3-5: Logos of three forest certifications
Source: CFCC, 2013; FSC, 2013; PEFC, 2013
4. Theoretical background
4.1 Theoretical framework of the study
Consumer behavior is the discipline that combines elements from psychology, sociology,
anthropology and economics, which attempts to understand the buyer decision-making
process individually and in groups (Dodoo, 2007). It is a complex and multifaceted concept.
According to Hawkins et al. (2001), consumer behavior refers to the processes individuals
adopt to choose products and services in order to satisfy their needs and also the influences
that these processes have on the consumer and the whole society. Likewise, as Belch and
Belch (2007) indicate, consumer behavior is taken as the activities that people participate in
before and after purchasing products or services so as to fulfill their needs and desires. In
other words, consumer behavior consists of factors affecting the consumer’s mind before
purchasing a product or service, the actions consumers perform in the consumption process
and impacts to them in the post purchase situation (Peter and Olson, 2010).
Consumer behavior in purchasing a product or service is affected by a wide variety of factors
consisting of internal as well as external ones. Internal factors include personality,
motivation, attitudes, learning and lifestyle, while culture, demographics, social status,
25
reference groups and family constitute external factors. Additionally, product attributes such
as price, quality and design, and supplier attributes like reputation and service can also be
regarded as external factors that influence consumers’ purchasing perceptions.
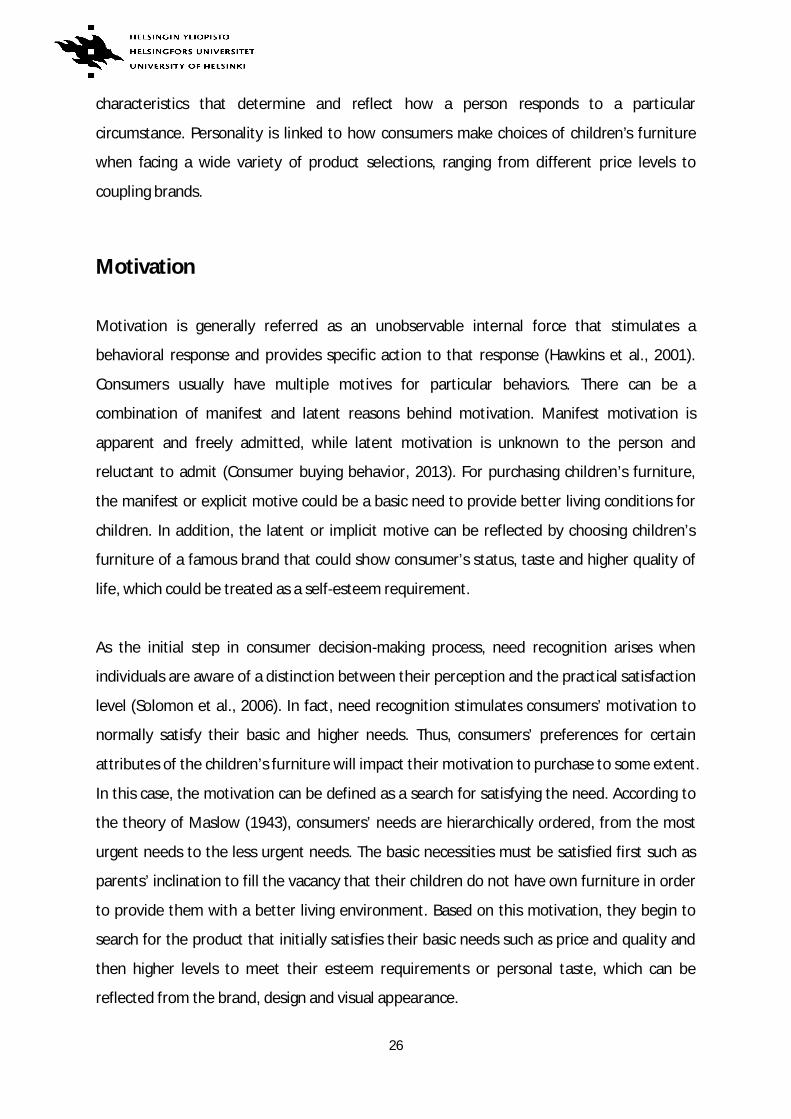
The purpose of this research is to study Chinese consumers’ perceptions of children’s
furniture by analyzing the factors affecting consumer preference and behavior. Figure 4-6
shows the theoretical framework of the study, which serves as the foundation for the
research analysis. It will be explored in more detail in the following section.
Figure 4-6: Theoretical framework of the study (modified from Hawkins et al., 2001)
4.2 Consumer’s internal factors
Personality
Personality is formed of an individual's unique dynamic psychological characteristics that
influence one’s behavior and lead to relatively consistent responses to the social and
physical environment (Schiffman et al., 2008). Each unique individual has different inner
Consumer Perceptions
of Children’s Furniture
External factors
Socio-demographic factors:
Culture Demographics Social status Reference groups Family
Product attributes
Supplier attributes
Internal factors
Personality Motivation Attitudes Learning Lifestyle
26
characteristics that determine and reflect how a person responds to a particular
circumstance. Personality is linked to how consumers make choices of children’s furniture
when facing a wide variety of product selections, ranging from different price levels to
coupling brands.
Motivation
Motivation is generally referred as an unobservable internal force that stimulates a
behavioral response and provides specific action to that response (Hawkins et al., 2001).
Consumers usually have multiple motives for particular behaviors. There can be a
combination of manifest and latent reasons behind motivation. Manifest motivation is
apparent and freely admitted, while latent motivation is unknown to the person and
reluctant to admit (Consumer buying behavior, 2013). For purchasing children’s furniture,
the manifest or explicit motive could be a basic need to provide better living conditions for
children. In addition, the latent or implicit motive can be reflected by choosing children’s
furniture of a famous brand that could show consumer’s status, taste and higher quality of
life, which could be treated as a self-esteem requirement.
As the initial step in consumer decision-making process, need recognition arises when
individuals are aware of a distinction between their perception and the practical satisfaction
level (Solomon et al., 2006). In fact, need recognition stimulates consumers’ motivation to
normally satisfy their basic and higher needs. Thus, consumers’ preferences for certain
attributes of the children’s furniture will impact their motivation to purchase to some extent.
In this case, the motivation can be defined as a search for satisfying the need. According to
the theory of Maslow (1943), consumers’ needs are hierarchically ordered, from the most
urgent needs to the less urgent needs. The basic necessities must be satisfied first such as
parents’ inclination to fill the vacancy that their children do not have own furniture in order
to provide them with a better living environment. Based on this motivation, they begin to
search for the product that initially satisfies their basic needs such as price and quality and
then higher levels to meet their esteem requirements or personal taste, which can be
reflected from the brand, design and visual appearance.
27
Attitudes
Attitude is defined as a predisposition of the consumer to react positively or negatively to an
impetus pattern of a product offer and can also be seen as the consumer’s evaluation or
image of a product (Hawkins et al., 2001). Attitudes to the favorable or unfavorable
attributes of the product may be transformed through a learning process that affected by
reference group influences, personality, past experience and exposure to various forms of
direct marketing (Schiffman and Kanuk, 2004). Attitudes express individual’s behavioral
inclinations and can be used to predict behavior. It normally depends on consumers’ overall
evaluation of a product (Solomon, 2004). The elements of children’s furniture consumers
consider important, the levels of price that can be accepted by them and their perceptions
of properties that make product environmentally friendly can reveal their attitudes towards
purchasing children’s furniture.
Learning
Learning is generally explained as the procedure by which a consumer’s memory and
behavior are altered as a result of conscious and non-conscious information processing
(Hawkins et al., 2001). Consumers purchase a certain product or service based on their
experience and knowledge. The knowledge of the product is important in purchasing
decision-making process, which is composed of the attributes of the product, the positive
consequences or benefits of utilizing the product and the values of the product that satisfy
consumers (Peter and Olson, 2010).
Once consumers perceive a need that can be satisfied by the purchase of a product, they
begin to search for information needed to make a purchase decision. Consumers’
knowledge about the product has direct influence on their purchase intention and decision
(Satish and Peter, 2004; Franz et al., 2006), and their psychological characteristics can reflect
their perception on product knowledge (Li et al., 2006). Past experiences and knowledge
28
regarding various purchase alternatives are the information stored in memory that is
regarded as internal search. When internal search is not enough for consumers to make the
decision, they will engage in external search to seek additional information such as personal
sources (e.g., relatives or friends), and other commercial or public sources like
advertisement, the Internet and social media in order to satisfy their needs and to manage
possible risk associated with high involvement purchase (Grant et al., 2010).
Lifestyle
Lifestyle is the consistent pattern people follow based on their past experiences, innate
characteristics and current situation in one's life circle. In fact, lifestyle is influenced by
individual characteristics such as personality and motivation which are mentioned above as
well as socio-demographic features such as demographics, social status etc. which will be
discussed below. The children’s furniture a consumer chooses to buy can reflect his or her
style of life.
The lifestyle concept is one of the most widely used in modern marketing activities. It can
reflect and inform the consumer’s self-concept or identity through a package of related
practices (Axsen et al., 2012). Consumers choose products not only based on products'
attributes but also to create and maintain a personal lifestyle. Environmental aspect may
accentuate the product’s invisible attributes by carrying values that are important to
consumers, such as choosing a healthy and sustainable way of life. Consumers’ intensified
awareness of environmental protection, preferences for natural raw material (solid wood
for furniture making) and willingness-to-pay (WTP) premiums for environmentally friendly
products all represent their values to live such way of life. To ensure respondents’
understanding of sustainable lifestyle, the definition was attached in Question 10 in the
second part of the questionnaire (See Appendix II). Sustainable living is commonly regarded
as a lifestyle that attempts to reduce an individual's or society's use of the Earth's natural
resources and personal resources (Ainoa, 2009) and preserve for future generations (NMI,
2007).
29
In recent years, a series of fresh terms such as organic food, energy efficiency, ecotourism
and socially responsible investing are frequently discussed by the public (Ernst and Young,
2007). Thus, a postmodern lifestyle called LOHAS (Lifestyle of Health and Sustainability) is
derived. Consumers are currently interested in correlating their personal values with brands
and products they purchase, particularly in today’s ethical consumerism marketplace (NMI,
2007). LOHAS consumers are pursuing the conscientious consumption of products with
health benefits that go in alignment with social justice, pursuit of ecology and sustainability.
They have also recognized the importance of their contribution and responsibility as an
individual towards society and environment, and show their support for business practices
and products and services that apply these ethical principles. (Ernst and Young, 2007) For
one thing, LOHAS consumers are socially responsible and advocators of using green
products, for another, they influence and encourage others to do the same and assist to
push environmentally friendly products into the mainstream market. Therefore, LOHAS is an
essential target for companies in marketing green or socially responsible products and
LOHAS consumers are an ideal target for corporate social responsibility (CSR) campaigns as
well. (NMI, 2007)
The Natural Marketing Institute (NMI) has conducted three years of the LOHAS research in
eight European countries as well as the United States and Japan that showed key
differences between the United States and Europe regarding the use of green products and
WTP more for environmentally friendly items. The result also indicates that each country
has a similar concentration of LOHAS consumers. (NMI, 2007) Thus, LOHAS is becoming a
mainstream under the global environment. The Chinese culture contains abundant values
that match the concept of LOHAS properly such as the concept of harmonious coexistence
of human and nature. However, such traditions have been gradually eroded by fast-paced
development and civilization. Recently, with the mainstream of the global lifestyle, the
concept of LOHAS has been gradually entering Chinese consumers’ life. EUNIC (2011) points
out green consumers of green products including LOHAS have been increasing among the
wealthy on the future trends of China’s upper urban classes, since products with green label
are positioned as status symbols and also follow government demand for more
sustainability. Although this segment only consists of a small group, its market capacity
shows a great potential.
30
Moreover, NMI research has also observed whether personal or planetary motivations
influence consumers more in the LOHAS marketplace. The result shows that planetary
health outweighed personal health for most U.S. consumers. When asking them whether
buying green is a sacrifice, LOHAS consumers were more willing to make such sacrifice and
they were even less likely to consider that they were sacrificing when they used
environmentally friendly products. (NMI, 2007) In this study, respondents were for example
asked whether consumption decisions of an individual have a great impact on global
sustainable development and whether choosing environmentally friendly products will limit
their lifestyle. The former statement is connected to one term that used in the
environmental studies called perceived consumer effectiveness (PCE), which is regarded as a
measure to predict whether an individual has contribution on environmental concern such
as pollution mitigation (Kinner et al., 1974).
4.3 Socio-demographic factors
Culture
Culture is regarded as a comprehensive concept that includes knowledge, belief, art, law,
morals, customs and any other capabilities and habits acquired by humans as members of
society (Hawkins et al, 2001). It influences the pattern of living, consumption, decision-
making by individuals and is the most fundamental determining factor of a person’s behavior
(Kotler, 2000).
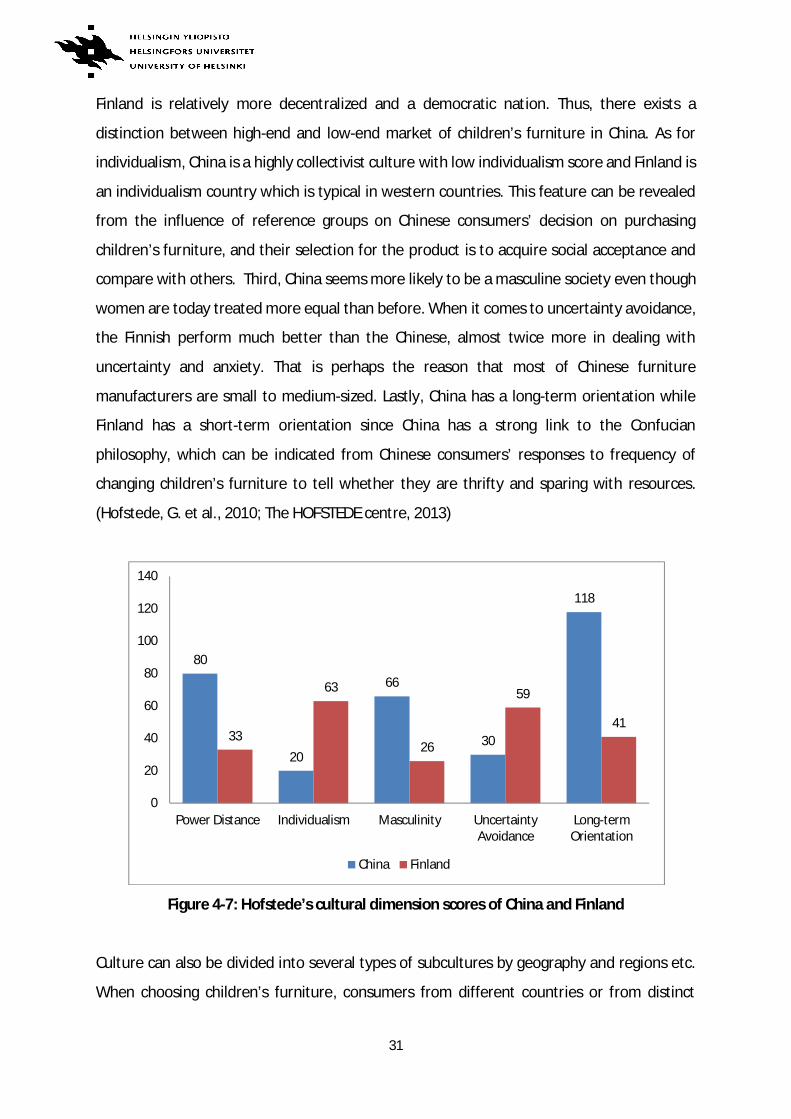
In Hofstede’s five cultural dimensions theory, power distance, individualism, masculinity,
uncertainty avoidance and long-term orientation are applied to explore cultural
characteristics in different countries, which indicates the Chinese culture is different from
western cultures (Hofstede et al., 2010). Take China and Finland as examples, Figure 4-7
shows that evident differences have been found among five dimension scores. In terms of
power distance, the scores of China are twice more as those of Finland, which implies that
China is politically centralized and the problem of polarization is prominent in society, while
31
Finland is relatively more decentralized and a democratic nation. Thus, there exists a
distinction between high-end and low-end market of children’s furniture in China. As for
individualism, China is a highly collectivist culture with low individualism score and Finland is
an individualism country which is typical in western countries. This feature can be revealed
from the influence of reference groups on Chinese consumers’ decision on purchasing
children’s furniture, and their selection for the product is to acquire social acceptance and
compare with others. Third, China seems more likely to be a masculine society even though
women are today treated more equal than before. When it comes to uncertainty avoidance,
the Finnish perform much better than the Chinese, almost twice more in dealing with
uncertainty and anxiety. That is perhaps the reason that most of Chinese furniture
manufacturers are small to medium-sized. Lastly, China has a long-term orientation while
Finland has a short-term orientation since China has a strong link to the Confucian
philosophy, which can be indicated from Chinese consumers’ responses to frequency of
changing children’s furniture to tell whether they are thrifty and sparing with resources.
(Hofstede, G. et al., 2010; The HOFSTEDE centre, 2013)
Figure 4-7: Hofstede’s cultural dimension scores of China and Finland
Culture can also be divided into several types of subcultures by geography and regions etc.
When choosing children’s furniture, consumers from different countries or from distinct
80
20
66
30
118
33
63
26
59
41
0
20
40
60
80
100
120
140
Power Distance Individualism Masculinity UncertaintyAvoidance
Long-termOrientation
China Finland
32
regions of the same country express diverse preferences and perceptions. In this study,
cultural characteristics, especially regional differences, are influential in understanding
Chinese consumer buying behavior.
Demographics
Demographics describe a population in terms of its size, distribution (geographic location),
and structure (age, gender, income, education, occupation) (Hawkins et al., 2001).
Consumers’ background information is essential to the analysis of comparing the
perceptions of different respondent groups and how the demographic elements affect their
perceptions of children’s furniture.
Social status
Each individual possesses different roles and status in the society depending upon the
groups, family, organization etc. to which he or she belongs (Hawkins et al., 2001). Such
status is frequently measured by educational level, occupation and income.
Occupation is a typical indicator of social status that has significant impact on consumer
behavior. Generally, occupation is influenced by one’s educational level. Income and wealth
are related to possessions. Possessions are symbols of class membership, which can be
expressed not only through the number or quality of possessions, but also the nature of the
choices made (Engel et al., 1995). Today, people have increasingly been concerned about
their image and the status in the society, which can be a direct outcome of their material
prosperity. With more capability to afford, consumers would have more choices to select.
According to Kotler (2000), products and brands often seek to be positioned as symbols of
status. Through selection of brands and products, consumers can build up their own
identities. The children’s furniture consumption can reflect parents’ social status.
33
Reference groups and family
A reference group is a group whose perspectives or values are being adopted by an
individual as the basis for one’s current behavior, beliefs and feelings (Hawkins et al., 2001).
Such groups involve a group of people such as family and friends or intermediaries like
advertisement, the Internet and social media in guiding and impacting an individual's
thoughts, feelings and actions (Environmental influences on consumer behavior, 2010).
It is worthwhile to mention social media as it has been an indispensable tool for people to
communicate and exchange information presently. China offers a vigorous environment for
social media based on its large-scale Internet user base (Chiu et al., 2012). There are
approximately 600 million social networking users in China (Go-Globe, 2013). The users
spend more than 40% of their time online on social media but they are also skeptical of the
information from social networks (Chiu et al., 2012). The top ten social networking sites in
China are domestic rather than Facebook or Twitter, and most Chinese users have at least
one account and are active on the social media site. The survey also indicates that 43% of
Chinese netizens showed interest in products and 38% of them took shopping decisions
from recommendations on their social networks. (Go-Globe, 2013)
Additionally, family can be taken as one of the primary reference groups, which is made up
of a group of two or more persons living together who are related by blood, marriage or
adoption (Hawkins et al., 2001). In real life, many decisions are made by families or
households rather than individuals. The family plays an important role in influencing the
individual’s early attitude patterns (Oskamp and Schultz, 2004). And as one of the household
consumables, furniture consumption usually requires joint decisions that are made by
involving family members (Belch and Willis, 2001; Harcar et al., 2005). Moreover, consumer
behavior varies over the family life cycle, which is based on age, marital status, number and
ages of children (Environmental influences on consumer behavior, 2010).
34
4.4 Product and supplier attributes
Traditional consumer behavior theories emphasize consumers demand features of products
rather than that of specific products. In previous forest products related research, consumer
preferences for forest products have been analyzed based on the assumption of maximizing
utility (Nyrud et al., 2008). Utility of a product is influenced by its relative importance
consumers attach to product attributes (Kaul and Rao, 1995). Lancaster (1966) suggests
consumers’ perceptions towards a product and their preferences for specific product
attributes can provide information to prognosticate consumer choice. Consequently
consumers’ purchasing decision is based on the perceived attributes or learned cognitions of
a product (Fishbein, 1963).
Generally, a product can be described as a bundle of attributes and characteristics that
providing benefits for consumers (Peter and Olson, 2010) to satisfy their needs or wants
(Kotler and Keller, 2005). The total product from a consumer’s perspective can be
determined as comprising two components or dimensions: tangible and intangible
(Toivonen, 2012). Both components consist of more specific sub-dimensions and concrete
attributes (Levitt, 1980, 1981; Snöj et al., 2004). The tangible product comprises physical
object that can be perceived by touch, while the intangible product provides benefits of the
immaterial characteristics of the object (Saren and Tzokas, 1998) and can only be perceived
indirectly. Tangible and intangible product components are often interrelated (Toivonen,
2012). In terms of wood products, tangible attributes such as technical characteristics and
appearance represent the main element in the total offering and fulfill the basic needs of
consumers (Toivonen et al., 2008). The consumer judges the product through its tangible
and intangible attributes. Understanding why a consumer chooses a certain product based
upon its attributes helps to satisfy his or her needs and wants.
Supplier characteristics seem to be more important than product performance in industrial
markets and they associate with product intangibles (Saren and Tzokas, 1998). But in terms
of wood products, supplier attributes are less frequently investigated. It has been noted that
supplier features contribute to the intangible part of the total product (Toivonen, 2011). In
fact, supplier attributes such as brand, service, and reputation can also be taken as
35
components of product attributes since they are parts of product intangibles. Moreover,
product tangibles such as production technique are regarded as one of supplier features as
well. Other supplier attributes such as location of store or ease of buying are also factors
that influence consumer’s purchasing behavior. Thus, both supplier and product attributes
are interconnected and important elements affecting consumers’ perception of children’s
furniture.
Price has been seen as an outcome of perceived product quality rather than part of an
element of product quality (Toivonen, 2011). Quality is defined as the overall features of a
product or service that bears on its capability to satisfy given needs by the American
National Standards Institute (American Society for Quality Control, 1978), while it is viewed
as a precise and measurable variable and an inherent characteristic of goods based on
product-based approach (Garvin, 1984). In this study, both price and quality are regarded as
product attributes and basic requirements of the product from the perspective of
consumers. However, while they explain only a fraction of the purchasing decision, they are
essential to explore consumers’ perceptions of children’s furniture. Price is regarded as the
key extrinsic quality (measurable) indicator or signal of the product (Zeithaml, 1988). Thus,
price is doubtless playing an important role in the purchasing furniture (Hassan et al., 2010).
Moreover, it has been noted that there is a positive connection between price and objective
(measurable) quality (Kirchler et al., 2010). Definitely, consumers perceive price varying from
country to country. Consumers in developing and emerging countries are expected to treat
price relatively more highly important than other product attributes (Zhang et al., 2002).
Apart from price, brand is another essential indicator of product value (Brucks et al., 2000).
Brand is not only a symbol, but also a powerful marketing tool that has cognitive effects of
consumers’ emotions, beliefs and attitudes (Keller, 2002) to communicate product attributes
and to create associations and expectations of a product (Desai et al., 2002). It can also be
taken as a guarantor of reliability and quality in consumer products (Roman et al., 2005).
Consumers would like to buy and use brand-name products with a view to highlight their
personality in different situational contexts (Fennis and Pruyn, 2006). Therefore, brand is a
crucial driving force behind consumption and a strategic tool for building consumer trust.
Brand loyalty is an important element in marketing a certain product (Jung and Shen, 2011).
36
The satisfactory experience of using a particular brand may lead to repeated purchase.
Environmental impact of products and services has been more concerned and integrated
into business strategic decision-making since it can be taken as one of the core corporate
competitive advantages. Its characteristics have been much highlighted in the case of wood
products and the forest-based industry (Roos and Nyrud, 2008; Li and Toppinen, 2011).
Environmental aspects such as a value-added part of the product, contributes to the
intangible part of the total product. But some of the environmental characteristics may
actually be also created through raw material acquisition and production process which are
connected to the product tangibles (Toivonen, 2011). Environmental and social attributes of
the product can also be conveyed through the availability of product information that is
regarded as one of supplier characteristics as well as the intangible dimension of the product
(Toivonen, 2011).
Environmental protection and product safety belong to dimensions of CSR (Maignan and
Ralston, 2002). As one of corporate stakeholders, consumers should be ensured of product
quality and safety. Green and Peloza (2011) point out that CSR provides emotional, social
and functional value to consumers, but it can either enhance or diminish the overall value of
the product. Such responsible product can be poorly understood by the public since
consumers’ learning of corporate responsibility mechanisms generally takes time and efforts
(Mohr and Webb, 2005; Green and Peloza, 2011).
In previous research, socio-demographic characteristics such as gender, marital status, age,
number of children, level of education, income and social class have been applied to
measure consumers’ environmental awareness (Laroche et al., 2001; Diamantopoulos et al.,
2003; Aguilar and Vlosky, 2007; Mohamed and Ibrahim, 2007; Van Houtven et al., 2007;
Barrio and Loureiro, 2010 (a)). Pertaining to consumers’ responses to CSR, it seems that
older individuals (Carrigan et al., 2004), females, higher-education and higher-income
groups are more supportive of CSR practices (Youn and Kim, 2008).
Another crucial indicator is consumers’ WTP for environmentally friendly products.
According to the results of several studies, it is believed that consumers are willing to pay
37
premiums for certified wood products (Merry and Carter, 1997; Ozanne and Vlosky, 1997;
Aguilar and Vlosky, 2007; Veisten, 2007). However, consumers in Asian countries are
explored to have hardly any interest in certified timber products with extra charge (Gale,
2006), one of the key reasons is that consumers in developing countries cannot afford to be
environmentally ethical in their consumption (Van Kempen et al., 2009).
Nevertheless, there are also studies pointing that understanding of CSR issues is not only
greater in developed economies but also has become highlighted in emerging economies
over the last decade (Ramasamy and Yeung, 2009). Since consumers are moving towards
ethical products, rising social consciousness is extending to developing countries (Auger et
al., 2003; Berry and McEachern, 2005). And supplier’s CSR may have positive influence on
consumers’ evaluations and purchase intentions for the product (Ellen et al., 2006), which
helps promote the companies’ prestige and fame, and will implicitly lead to a greater
competitive advantage (Miron et al., 2011).
There is a growing consensus that consumers do care about corporate social behavior, but
Page and Fearn (2005) found in the United Kingdom, the United States and Japan that CSR is
not the primary concern in their purchasing process. Consumers are less willing to sacrifice
basic functional features of products or core product attributes such as price and quality for
ones that are socially and environmentally responsible (Auger et al., 2003; Beckmann, 2007).
In other words, environmentally friendly products can influence consumer decision-making
to some extent, but price and quality are likely continue to be the most essential
considerations (Teisl et al., 2002).
Some studies have recognized that CSR has a positive effect on a firm’s reputation and
brand. It is a positive signal of company’s honesty and reliability and may increase
consumers’ trust and loyalty towards the company as well as the brand (Bhattacharya and
Sen, 2004; Siegel and Vitaliano, 2007). Previous research has demonstrated that high price is
the most prominent barrier preventing consumers from environmentally positive
consumption behavior (Hansmann et al., 2006). Nevertheless, considering consumption
decisions with high personal involvement, trust in a brand can lead to consumer
commitment and attitudinal loyalty, which can in turn increase the price tolerance
38
(Delgado-Ballester and Munuera-Aléman, 2001).
4.5 Consumer perceived value
Consumer perceived value is significant and has been the subject of considerable interest in
marketing and strategic management (Mizik and Jacobson, 2003; Spiteri and Dion, 2004;
Tsiotsou, 2005). However, there has been conceptual confusion between the terms of
perceived value and perceived quality (Oliver, 1999). Both of them possess certain
characteristics in common (Rust and Oliver, 1994), while there are differences between them
(Zeithaml, 1988). Sweeney and Soutar (2001) contend that quality belongs to one
component of the total value, and perceived quality can be treated as an antecedent of
perceived value (Cronin et al., 2000). Since quality is regarded as one attribute of the
product in this study, perceived value is applied to distinguish between these two confusing
concepts.
Previous studies have asserted that consumers perceive product value is consisting of
multiple dimensions. Garvin (1987) proposes eight dimensions of quality composing of
performance, features, reliability, conformance, durability, serviceability, aesthetics and
image. Sweeney and Soutar (2001) assert consumers’ perceptions of durable goods on a four
value dimensions, namely emotional, social, quality/performance and price. Likewise, Wang
et al. (2004) find that functional, social, emotional and perceived sacrifices have important
influence on consumer satisfaction. Holbrook (1999) suggests a more comprehensive
approach that comprises economic, social, hedonic and altruistic dimensions of perceived
value.
Perceived value is a multidimensional construct and indicates an interaction between the
consumer and the product (Sanchez-Fernandez and Iniesta-Bonillo, 2007). It can be affected
by product attributes such as price, quality and design (Kerin et al., 1992; Ann, 2008),
supplier attributes such as the availability of product information, service and reputation
(Bolton and Drew, 1991; Chang and Wildt, 1994; Ozkan-Tektas and Wilson, 2010) and
consumers’ characteristics like desires, expectations, their knowledge about the product
39
(Spreng et al, 1993; Satish and Peter, 2004), and culture (Overby et al., 2005). In this study,
apart from consumer perceived value of children’s furniture affected by product and
supplier attributes, environmental characteristic is another important value evaluation
dimension based on consumers’ WTP for the environmentally friendly product.
4.6 Implementation of the theoretical framework
The structure of the theoretical framework is based on the questionnaire developed for this
study. Table 4-3 below demonstrates the implementation of the framework according to
specific questions since the main objective of the questionnaire is to support the theoretical
framework. For the sake of comprising the elements that affect consumers’ perceptions of
children’s furniture comprehensively, designing and planning of the questionnaire are
strenuous and challenging.
Both English and Chinese versions of the questionnaire are presented in Appendices I and II.
Respondents’ background information is identified in the second part of the questionnaire
through Questions 1 to 9 in order to make respondents focus on their perceptions and
attitudes of children’s furniture. There is no specific question concerning culture aspect, but
since the questionnaires were collected from two cities in China, regional differences (sub-
culture) that belong to one division of culture might be explored and the characteristics of
Chinese culture would also be reflected through respondents’ attitudes toward attributes of
the product such as price and brand. Furthermore, some other socio-demographic features
like reference groups and family are also involved in the first part of the questionnaire. In
addition, product and supplier attributes are mostly determined in Question 5 in the first
part, so as for environmental aspect since it belongs to product as well as supplier features,
and it can also be detected in Questions 8 and 9 regarding respondents’ understanding of
environmentally friendly product and their WTP premiums. As one of consumer
characteristics, lifestyle could be examined by the last question in the second part as it is
connected to the concept of LOHAS, which also relates to respondents’ environmental
attitudes.
40
The implementation of the theoretical framework also provides answers to the research
questions exhibited in Chapter 2. The first question “Which socio-demographic factors affect
Chinese consumers’ choices of children’s furniture?” can be detected through respondents’
background information. The second question “How important do Chinese consumers
perceive different product and supplier attributes of children’s furniture?” focuses on
product and supplier sections. In terms of the third question “What attributes make
children’s furniture environmentally friendly from the perspective of Chinese consumers?”,
it is mainly tackled based on the environmental section. Nevertheless, evaluations of
consumers’ socio-demographic characteristics, product and supplier attributes as well as
environmental characteristics that influence Chinese consumers’ perceptions of children’s
furniture are interconnected and emphasized through the whole study. In the result section,
all the factors will be analyzed respectively based on the empirical data.
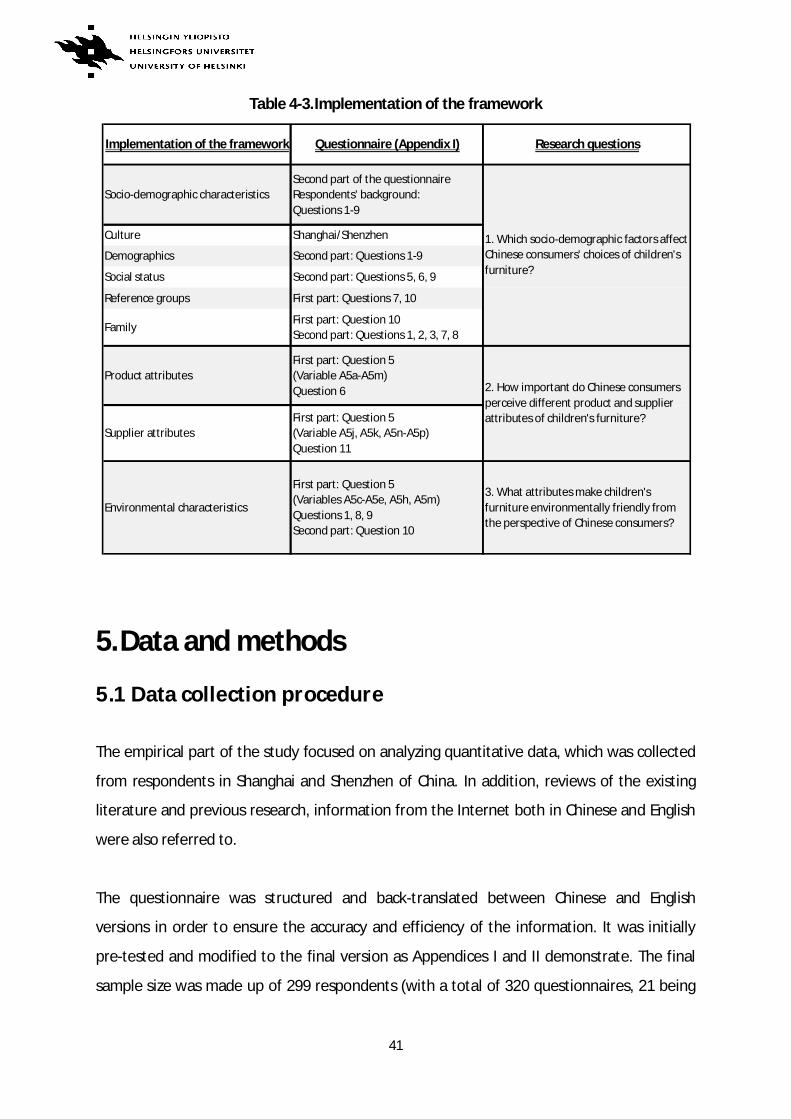
41
Table 4-3.Implementation of the framework
5. Data and methods
5.1 Data collection procedure
The empirical part of the study focused on analyzing quantitative data, which was collected
from respondents in Shanghai and Shenzhen of China. In addition, reviews of the existing
literature and previous research, information from the Internet both in Chinese and English
were also referred to.
The questionnaire was structured and back-translated between Chinese and English
versions in order to ensure the accuracy and efficiency of the information. It was initially
pre-tested and modified to the final version as Appendices I and II demonstrate. The final
sample size was made up of 299 respondents (with a total of 320 questionnaires, 21 being
Implementation of the framework Questionnaire (Appendix I) Research questions
Socio-demographic characteristicsSecond part of the questionnaireRespondents' background:Questions 1-9
Culture Shanghai/Shenzhen
Demographics Second part: Questions 1-9
Social status Second part: Questions 5, 6, 9
Reference groups First part: Questions 7, 10
FamilyFirst part: Question 10Second part: Questions 1, 2, 3, 7, 8
Product attributesFirst part: Question 5(Variable A5a-A5m)Question 6
Supplier attributesFirst part: Question 5(Variable A5j, A5k, A5n-A5p)Question 11
Environmental characteristics
First part: Question 5(Variables A5c-A5e, A5h, A5m)Questions 1, 8, 9Second part: Question 10
3. What attributes make children'sfurniture environmentally friendly fromthe perspective of Chinese consumers?
2. How important do Chinese consumersperceive different product and supplierattributes of children's furniture?
1. Which socio-demographic factors affectChinese consumers' choices of children'sfurniture?
42
rejected because of inadequate answers), of which 153 questionnaires were collected by a
Ph.D. student in Shenzhen in December 2012 and 146 questionnaires were collected by me
in Shanghai and completed in January 2013. The reasons to choose these two cities are that
Shanghai is the center for furniture manufacturing and distribution in East China and
Shenzhen is regarded as one of China’s special economic zones that located in Guangdong
province in South China, which is the largest furniture manufacturing base in China. Besides,
both of the two cities are considered to be the top target markets in China for high-end
products because of their heavy concentration of middle-class consumers (Cao et al., 2004).
The main locations chosen in Shanghai were furniture chain stores such as IKEA and big
furniture centers like B&Q – a British multinational do-it-yourself (DIY) and home
improvement retailing company which is the largest DIY retail chain in China, and Red Star
Macalline which is the largest national furniture mall chain in China. And the survey
conducted in Shenzhen was mainly taken place in IKEA, the furniture malls like Bao’an and
Xianghe, and also Shenzhen Xiangjiang home furnishing European city. Other places were
selected in order to ensure that a broad cross-section of consumers was involved in this
study, including primary school, children’s art school, shopping malls, amusement parks,
residence zones and cinema.
Data collection was based on the face-to-face investigation procedure. Passers-by were
asked to fill the questionnaires with the assistance if needed. Each participant would be
provided with a small gift (chocolate or socks) for the cooperation. By standing beside them
and assisting them in completing each question, unclear or blank answers would be avoided.
Finally, 299 questionnaires in total were used in this study.
The questionnaire consists of two parts. In the first section, respondents were required to
provide their preferences of children’s furniture. The second part aimed at obtaining the
background information of respondents, including gender, age, occupation, education,
income, etc. These independent variables will be compared with respondents’ perceptions.
The variables are mostly nominal and ordinal. Nominal variables are those whose outcomes
are categorical other than coded, while ordinal variables are those that are naturally
43
ordered (Anthony, 2011). Categorical variables involve background information and other
additional questions, whereas numerical variables include questions that identify
consumers’ purchase decisions concerning children’s furniture. And a five-point scale is
adopted to evaluate consumers’ attitudes ranges from 1=”Not at all important” to
5=”Extremely important” and 1=”Totally disagree” to 5=“Totally agree”.
5.2 Data analysis methods
The study data were analyzed by a wide array of statistical analysis methods using SPSS
software package (Figure 5-8). The basic descriptions of variables were determined by
defining means and frequencies. Cross-tabulations with X2 tests and one-way analysis of
variance (ANOVA) were used to run comparisons between respondents’ background and
their perceptions of children’s furniture. Cross tabulation illustrates the correlation between
two or more variables on a nominal scale (Metsämuuronen, 2012). Furthermore, ANOVA is a
parametric test of comparing the mean values from more than two samples (Anthony, 2011).
Additionally, K-means cluster analysis was conducted on group respondents based on factor
scores of their importance ranking of different product attributes. It can be used in similar
applications as factor analysis to investigate the underlying structure and identify the groups
within a data set (Anthony, 2011). The significance level used in the analysis was 5% (p <
0.05). Cluster analysis can also provide a profile of consumer segments by being combined
with analysis of variance techniques.
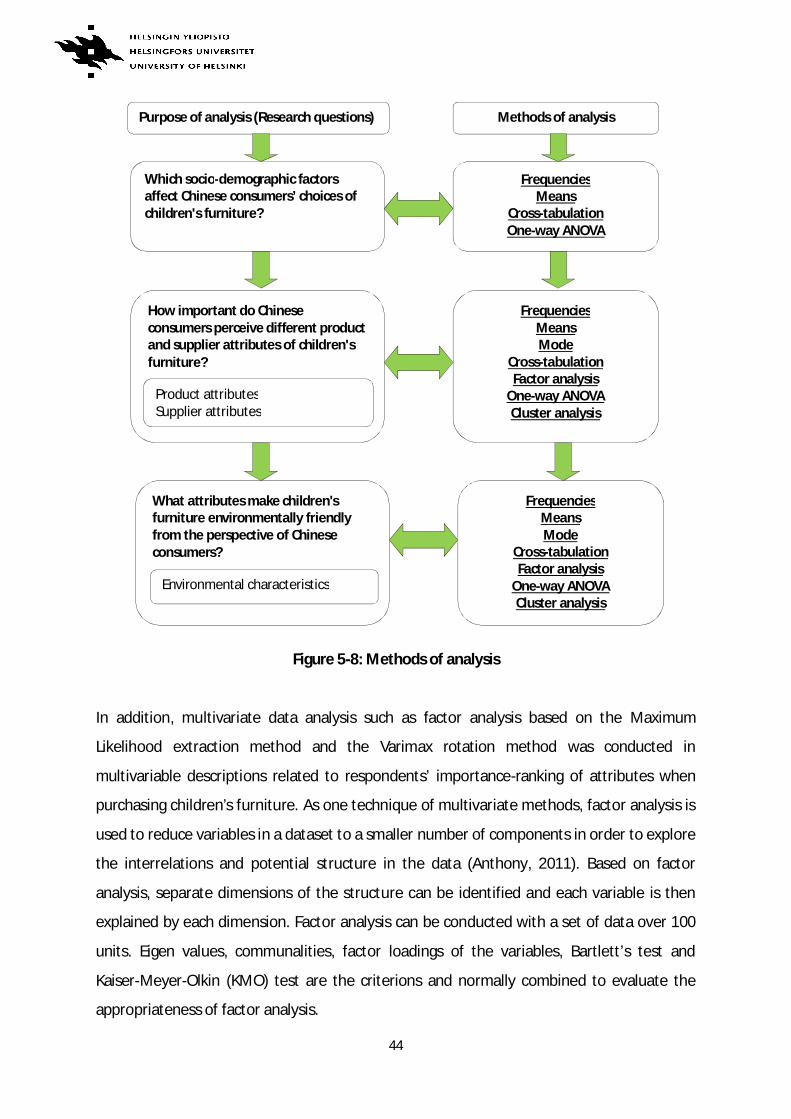
44
Figure 5-8: Methods of analysis
In addition, multivariate data analysis such as factor analysis based on the Maximum
Likelihood extraction method and the Varimax rotation method was conducted in
multivariable descriptions related to respondents’ importance-ranking of attributes when
purchasing children’s furniture. As one technique of multivariate methods, factor analysis is
used to reduce variables in a dataset to a smaller number of components in order to explore
the interrelations and potential structure in the data (Anthony, 2011). Based on factor
analysis, separate dimensions of the structure can be identified and each variable is then
explained by each dimension. Factor analysis can be conducted with a set of data over 100
units. Eigen values, communalities, factor loadings of the variables, Bartlett’s test and
Kaiser-Meyer-Olkin (KMO) test are the criterions and normally combined to evaluate the
appropriateness of factor analysis.
Which socio-demographic factors affect Chinese consumers’ choices of children's furniture?
Purpose of analysis (Research questions)
How important do Chinese consumers perceive different product and supplier attributes of children's furniture?
Product attributes Supplier attributes
What attributes make children's furniture environmentally friendly from the perspective of Chinese consumers?
Environmental characteristics
Methods of analysis
Frequencies Means
Cross-tabulation One-way ANOVA
Frequencies Means Mode
Cross-tabulation Factor analysis
One-way ANOVA Cluster analysis
Frequencies Means Mode
Cross-tabulation Factor analysis
One-way ANOVA Cluster analysis
45
Eigen values demonstrate the degree factors explain the variance of the variables and with
value greater than 1 is considered significant. Communalities signify the reliability of the
variables that range from 0 to 1. The higher the communality, the better the factor explains
the variance and the more accurate the item in the question (Tarkkonen, 1987). Factor
loading implies the correlation between the original variable and its factor. Generally,
loadings should be greater than 0.3 and loadings over 0.5 are considered practically
significant. The Bartlett test of sphericity is a measure that examines the entire correlation
matrix. (Hair et al., 1998) It should be significant (P < 0.05) for factor analysis to be
considered appropriate (Tabachnick and Fidell, 2001). Moreover, the KMO test is used to
measure sampling adequacy and with the value over 0.5 being considered sufficient (Sinclair
et al., 1993). In terms of the reliability and validation of factor analysis, the Cronbach’s Alpha
is most widely used method, which is based on the mean of the correlation of a set of
variables (Metsämuuronen, 2012), and a value of 0.5 or higher is considered as indicating
sufficient scale consistency (Sinclair et al., 1993).
The answers to Question 5 (importance of multiple attributes of children’s furniture) were
analyzed with the factor analysis method for the sake of exploring how many factors of the
16 variables could be identified. The factor dimensions were used for further analysis of the
relationships with other variables.
46
6. Results
6.1 Description of the respondents
In total, 299 questionnaires (with 146 respondents from Shanghai and 153 respondents from
Shenzhen) were used in the analysis. The majority of the respondents were females (67%)
and the rest was made up of males (33%). Age distribution of the respondents focused on
31-40 years old (63%). The major respondents were covered by company employees (60%),
living in urban area (91%), with college/university undergraduate educational level (71%)
and married status (95%). In addition, the monthly income of the respondents was centered
between 10,000-20,000 RMB (35%). A summary of the respondents’ demographics is
illustrated in Table 6-4 below. This set of data is essential for the following analysis,
especially for the comparisons between different respondent groups and cluster analysis.
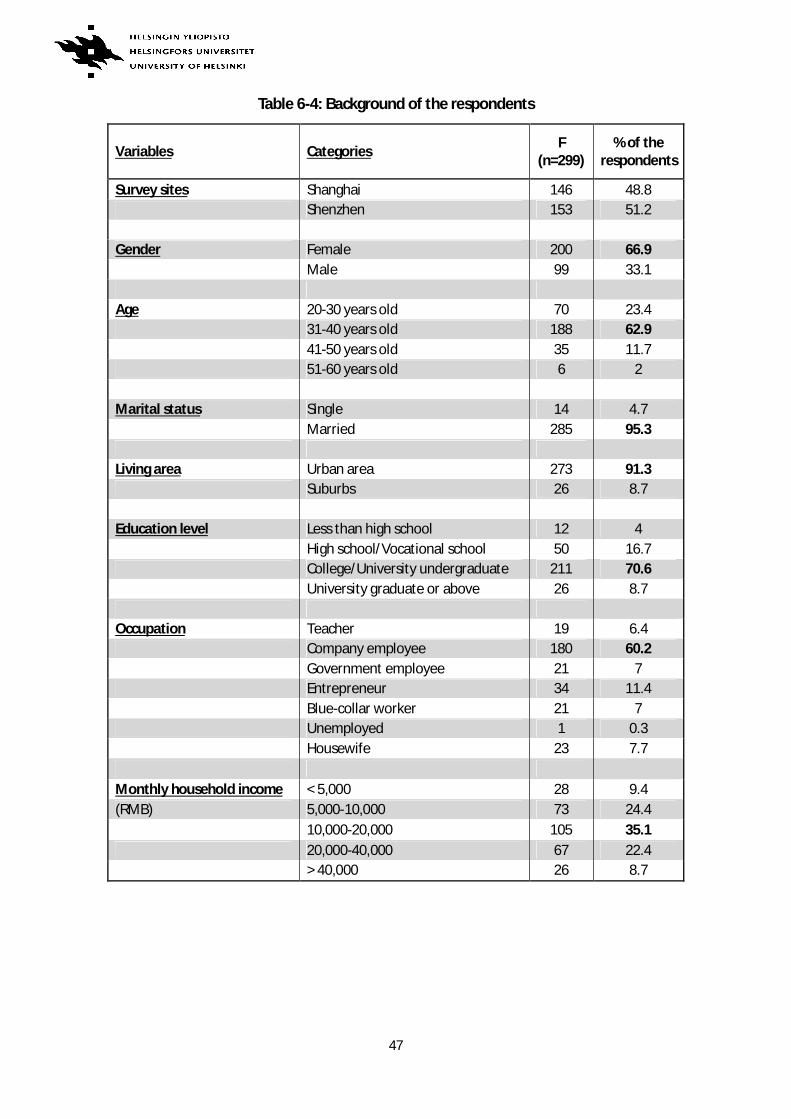
47
Table 6-4: Background of the respondents
Variables Categories F (n=299)
% of the respondents
Survey sites Shanghai 146 48.8 Shenzhen 153 51.2 Gender Female 200 66.9 Male 99 33.1 Age 20-30 years old 70 23.4 31-40 years old 188 62.9 41-50 years old 35 11.7 51-60 years old 6 2 Marital status Single 14 4.7 Married 285 95.3 Living area Urban area 273 91.3 Suburbs 26 8.7 Education level Less than high school 12 4 High school/Vocational school 50 16.7 College/University undergraduate 211 70.6 University graduate or above 26 8.7 Occupation Teacher 19 6.4 Company employee 180 60.2 Government employee 21 7 Entrepreneur 34 11.4 Blue-collar worker 21 7 Unemployed 1 0.3 Housewife 23 7.7 Monthly household income < 5,000 28 9.4 (RMB) 5,000-10,000 73 24.4 10,000-20,000 105 35.1 20,000-40,000 67 22.4 > 40,000 26 8.7
48
6.2 Consumers’ socio-demographic factors affecting their
perceptions of children’ furniture
Demographics
Demographics of the respondents were described above in the first section of the result
part. They are crucial to the analysis in discriminating consumer’s perceptions of children’s
furniture which will be demonstrated in the following sections. Demographics describe the
respondents in terms of their age, gender, education, marital status and income.
Additionally, the significant effect of demographics on environmental issue will be
manifested in the section below.
Age and Gender
There are no apparent differences in perceiving children’s furniture between males and
females except that more females tended to change children’s furniture within longer years
(36% within 5-10 years) than males (38.4% within 3-5 years) (Figure 6-9, also see Appendix
IV, Table A1). This distinction also occurs in age groups indicating that older people were
inclined to behave more economically than younger parents (Figure 6-10, also see Appendix
IV, Table A2), and the decision to change children’s furniture until the old one is worn out is
positive with the accumulation of age.
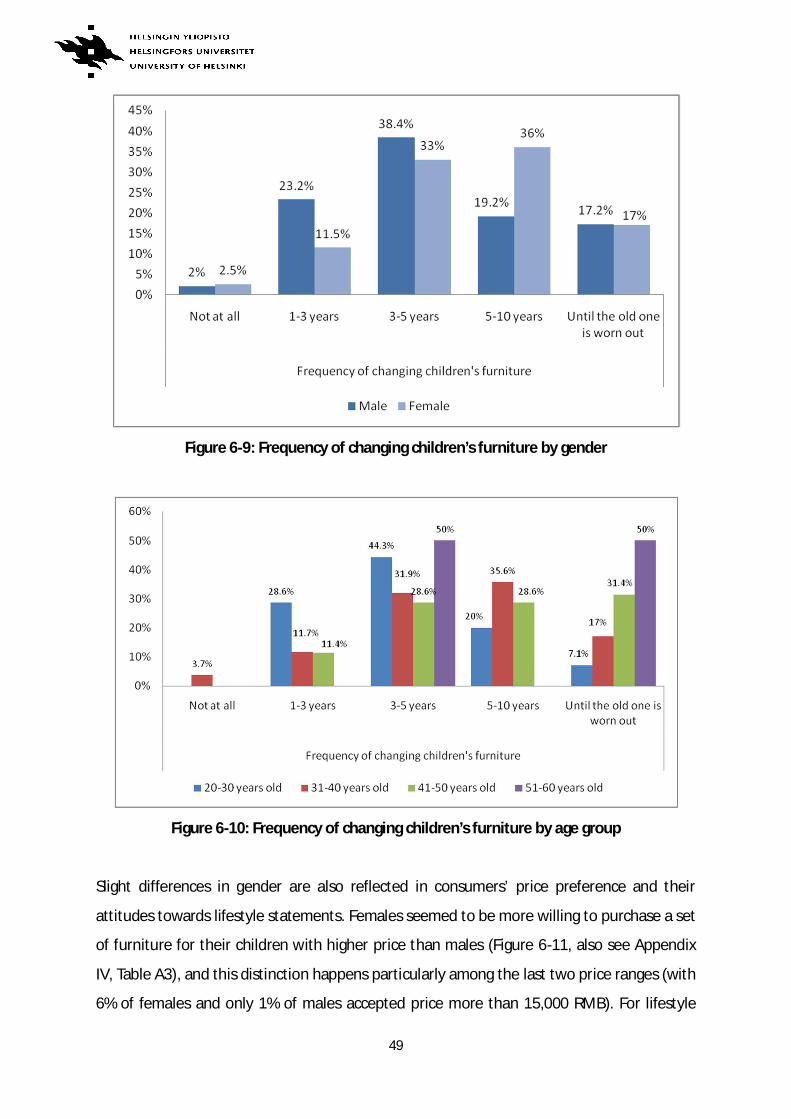
49
Figure 6-9: Frequency of changing children’s furniture by gender
Figure 6-10: Frequency of changing children’s furniture by age group
Slight differences in gender are also reflected in consumers’ price preference and their
attitudes towards lifestyle statements. Females seemed to be more willing to purchase a set
of furniture for their children with higher price than males (Figure 6-11, also see Appendix
IV, Table A3), and this distinction happens particularly among the last two price ranges (with
6% of females and only 1% of males accepted price more than 15,000 RMB). For lifestyle
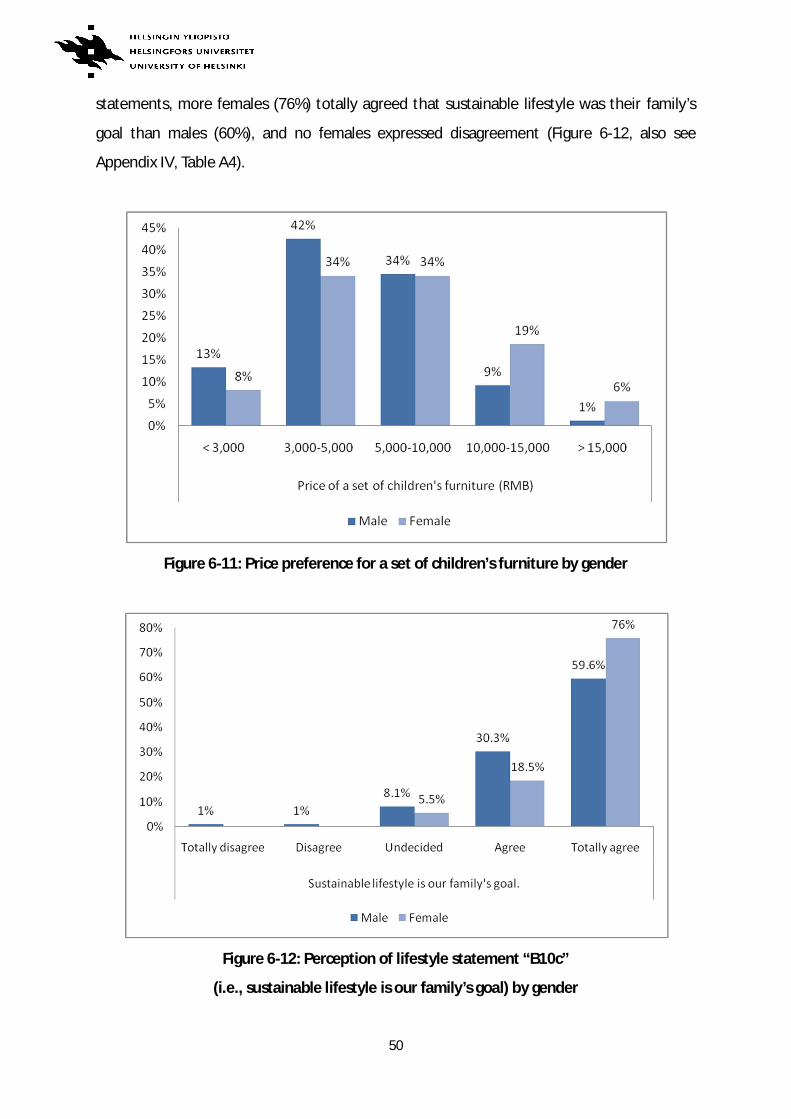
50
statements, more females (76%) totally agreed that sustainable lifestyle was their family’s
goal than males (60%), and no females expressed disagreement (Figure 6-12, also see
Appendix IV, Table A4).
Figure 6-11: Price preference for a set of children’s furniture by gender
Figure 6-12: Perception of lifestyle statement “B10c”
(i.e., sustainable lifestyle is our family’s goal) by gender
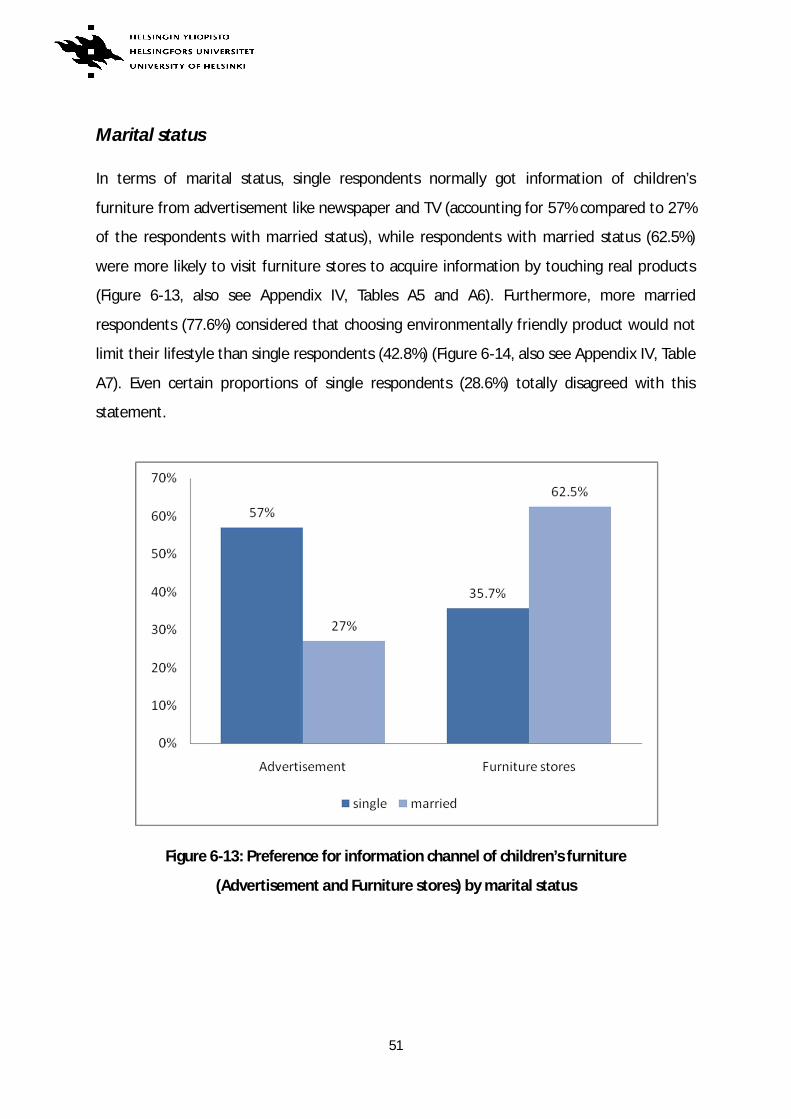
51
Marital status
In terms of marital status, single respondents normally got information of children’s
furniture from advertisement like newspaper and TV (accounting for 57% compared to 27%
of the respondents with married status), while respondents with married status (62.5%)
were more likely to visit furniture stores to acquire information by touching real products
(Figure 6-13, also see Appendix IV, Tables A5 and A6). Furthermore, more married
respondents (77.6%) considered that choosing environmentally friendly product would not
limit their lifestyle than single respondents (42.8%) (Figure 6-14, also see Appendix IV, Table
A7). Even certain proportions of single respondents (28.6%) totally disagreed with this
statement.
Figure 6-13: Preference for information channel of children’s furniture
(Advertisement and Furniture stores) by marital status
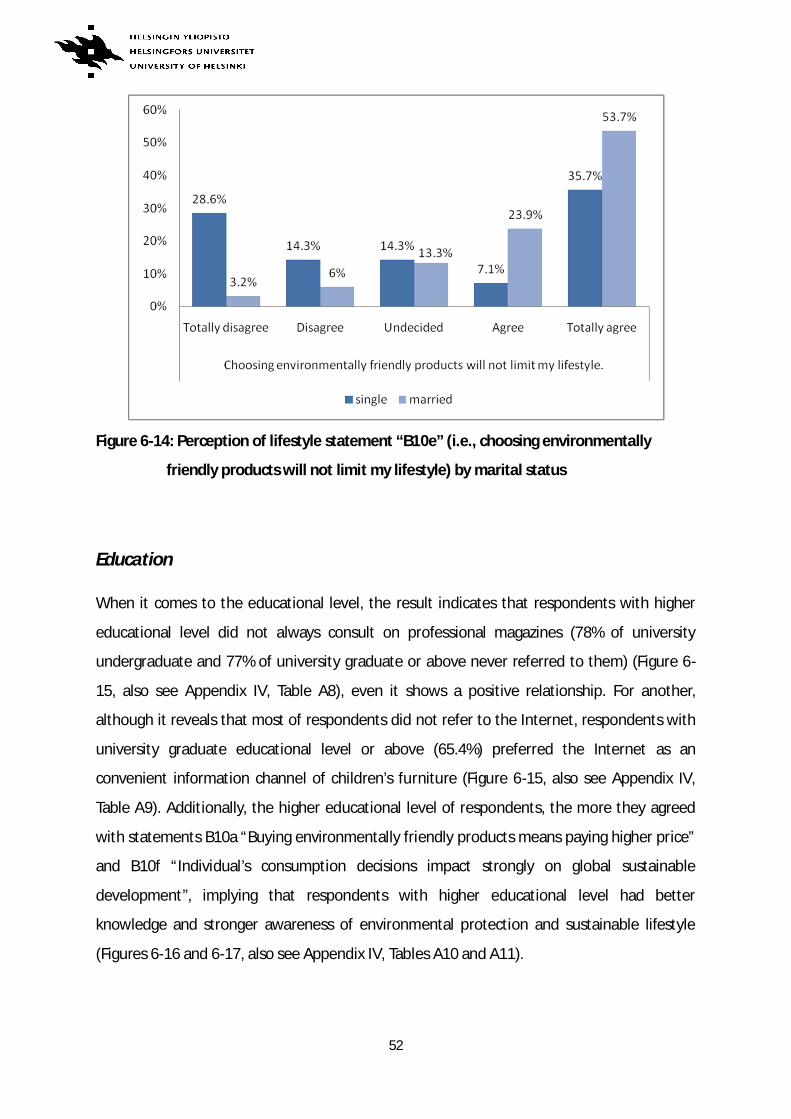
52
Figure 6-14: Perception of lifestyle statement “B10e” (i.e., choosing environmentally
friendly products will not limit my lifestyle) by marital status
Education
When it comes to the educational level, the result indicates that respondents with higher
educational level did not always consult on professional magazines (78% of university
undergraduate and 77% of university graduate or above never referred to them) (Figure 6-
15, also see Appendix IV, Table A8), even it shows a positive relationship. For another,
although it reveals that most of respondents did not refer to the Internet, respondents with
university graduate educational level or above (65.4%) preferred the Internet as an
convenient information channel of children’s furniture (Figure 6-15, also see Appendix IV,
Table A9). Additionally, the higher educational level of respondents, the more they agreed
with statements B10a “Buying environmentally friendly products means paying higher price”
and B10f “Individual’s consumption decisions impact strongly on global sustainable
development”, implying that respondents with higher educational level had better
knowledge and stronger awareness of environmental protection and sustainable lifestyle
(Figures 6-16 and 6-17, also see Appendix IV, Tables A10 and A11).
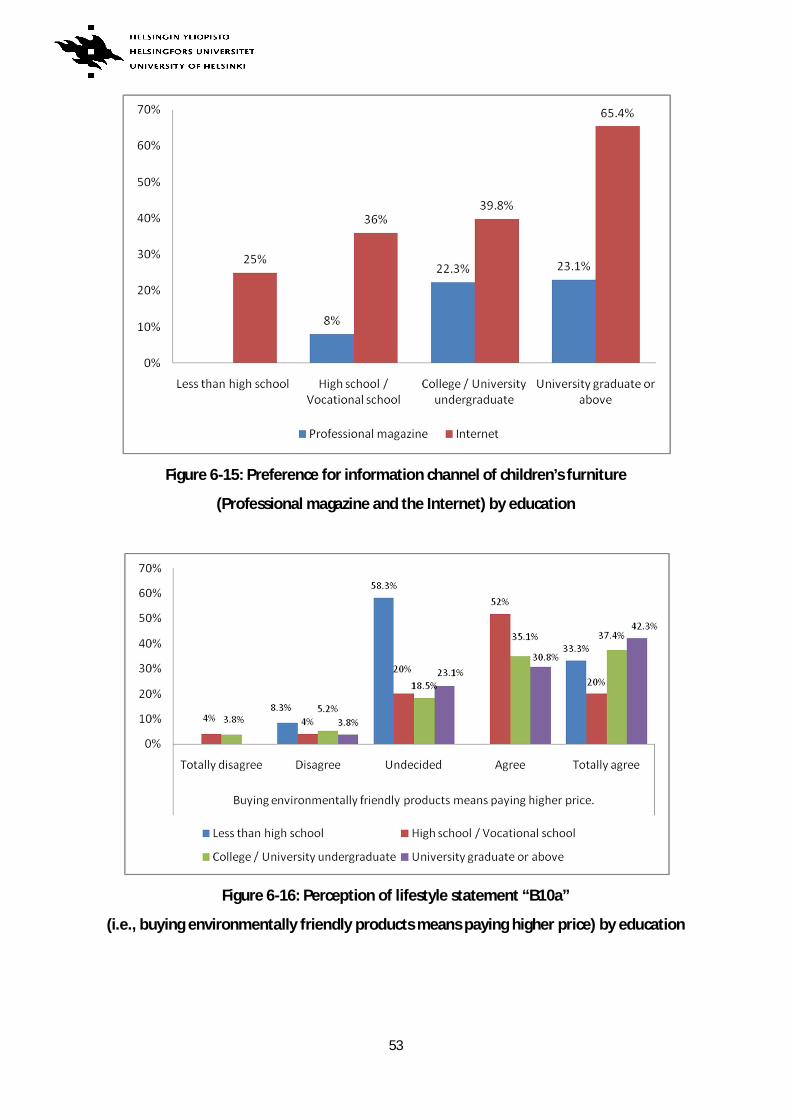
53
Figure 6-15: Preference for information channel of children’s furniture
(Professional magazine and the Internet) by education
Figure 6-16: Perception of lifestyle statement “B10a”
(i.e., buying environmentally friendly products means paying higher price) by education
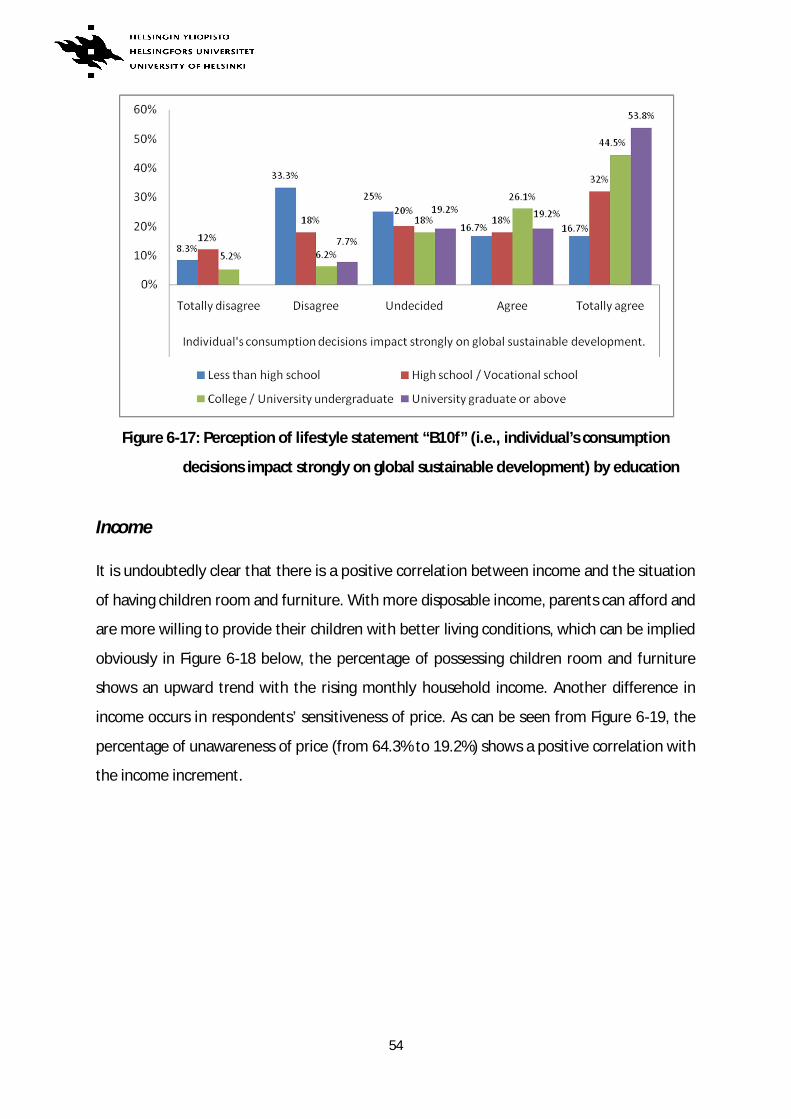
54
Figure 6-17: Perception of lifestyle statement “B10f” (i.e., individual’s consumption
decisions impact strongly on global sustainable development) by education
Income
It is undoubtedly clear that there is a positive correlation between income and the situation
of having children room and furniture. With more disposable income, parents can afford and
are more willing to provide their children with better living conditions, which can be implied
obviously in Figure 6-18 below, the percentage of possessing children room and furniture
shows an upward trend with the rising monthly household income. Another difference in
income occurs in respondents’ sensitiveness of price. As can be seen from Figure 6-19, the
percentage of unawareness of price (from 64.3% to 19.2%) shows a positive correlation with
the income increment.
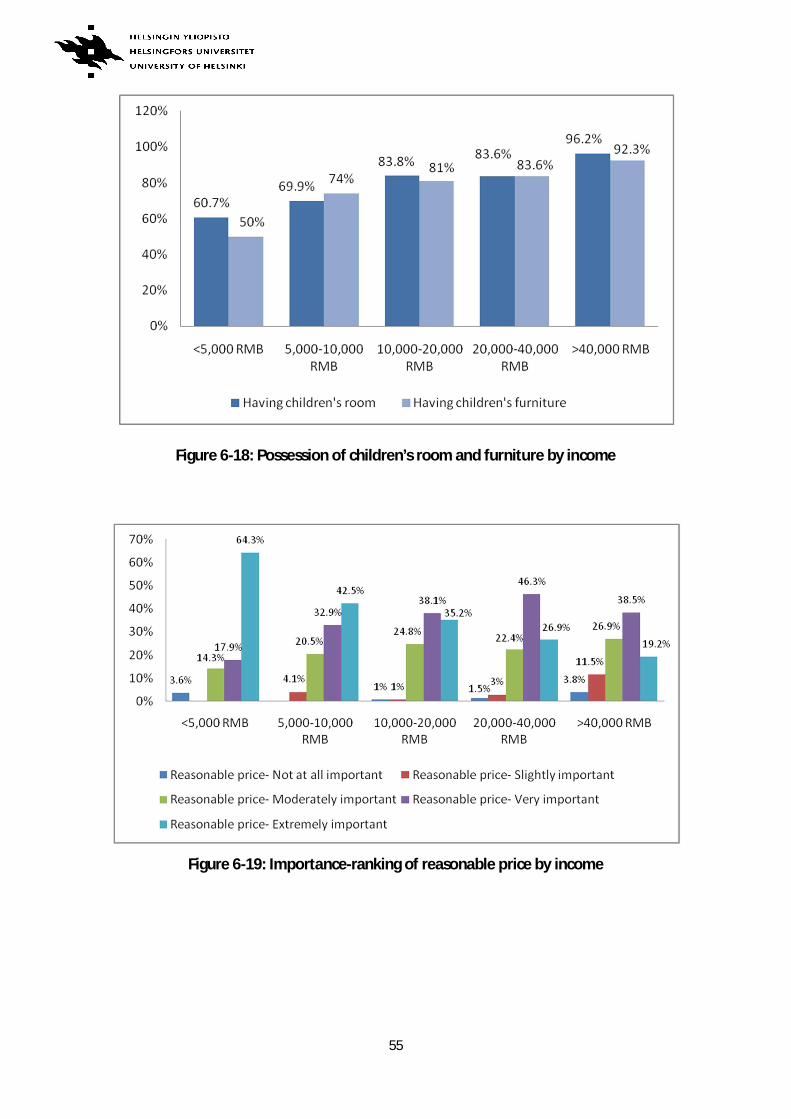
55
Figure 6-18: Possession of children’s room and furniture by income
Figure 6-19: Importance-ranking of reasonable price by income
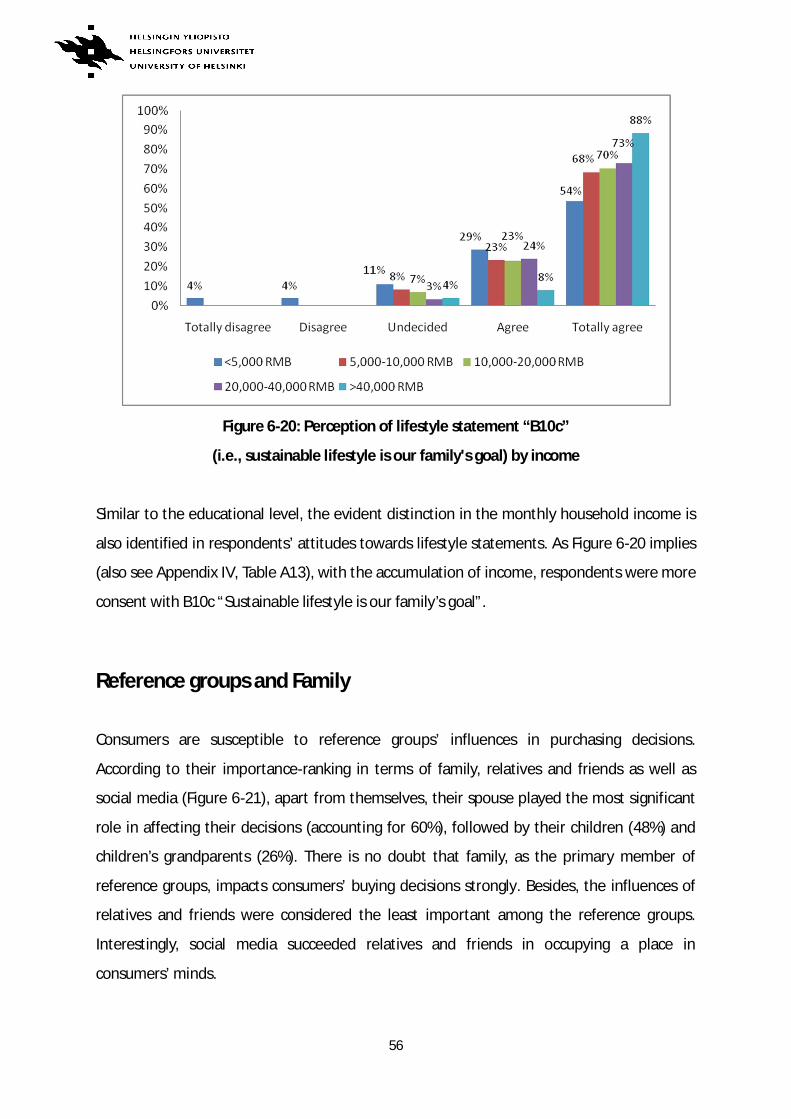
56
Figure 6-20: Perception of lifestyle statement “B10c”
(i.e., sustainable lifestyle is our family's goal) by income
Similar to the educational level, the evident distinction in the monthly household income is
also identified in respondents’ attitudes towards lifestyle statements. As Figure 6-20 implies
(also see Appendix IV, Table A13), with the accumulation of income, respondents were more
consent with B10c “Sustainable lifestyle is our family’s goal”.
Reference groups and Family
Consumers are susceptible to reference groups’ influences in purchasing decisions.
According to their importance-ranking in terms of family, relatives and friends as well as
social media (Figure 6-21), apart from themselves, their spouse played the most significant
role in affecting their decisions (accounting for 60%), followed by their children (48%) and
children’s grandparents (26%). There is no doubt that family, as the primary member of
reference groups, impacts consumers’ buying decisions strongly. Besides, the influences of
relatives and friends were considered the least important among the reference groups.
Interestingly, social media succeeded relatives and friends in occupying a place in
consumers’ minds.
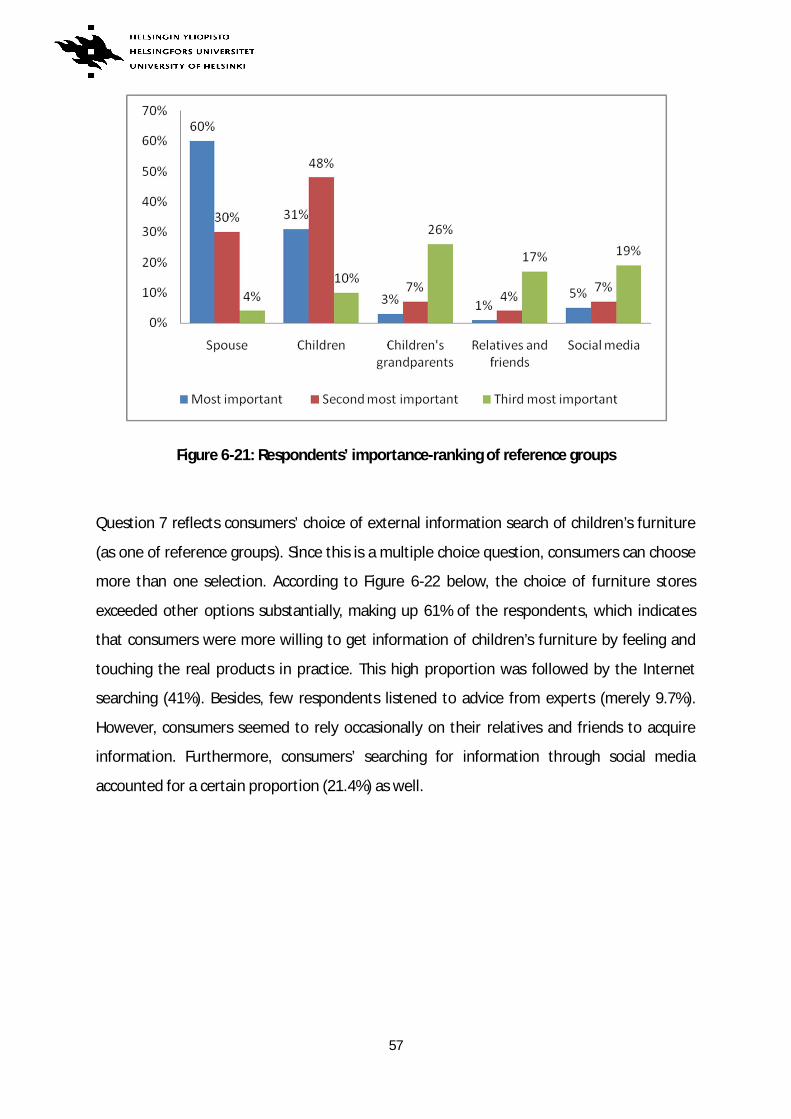
57
Figure 6-21: Respondents’ importance-ranking of reference groups
Question 7 reflects consumers’ choice of external information search of children’s furniture
(as one of reference groups). Since this is a multiple choice question, consumers can choose
more than one selection. According to Figure 6-22 below, the choice of furniture stores
exceeded other options substantially, making up 61% of the respondents, which indicates
that consumers were more willing to get information of children’s furniture by feeling and
touching the real products in practice. This high proportion was followed by the Internet
searching (41%). Besides, few respondents listened to advice from experts (merely 9.7%).
However, consumers seemed to rely occasionally on their relatives and friends to acquire
information. Furthermore, consumers’ searching for information through social media
accounted for a certain proportion (21.4%) as well.
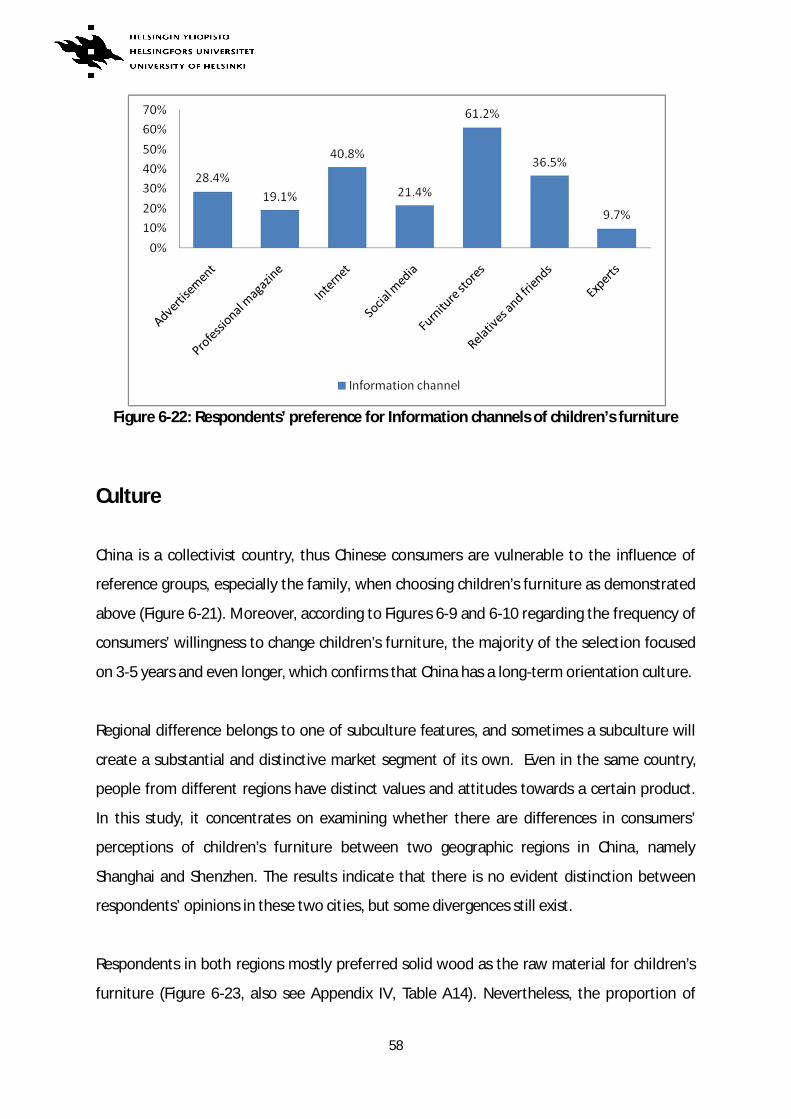
58
Figure 6-22: Respondents’ preference for Information channels of children’s furniture
Culture
China is a collectivist country, thus Chinese consumers are vulnerable to the influence of
reference groups, especially the family, when choosing children’s furniture as demonstrated
above (Figure 6-21). Moreover, according to Figures 6-9 and 6-10 regarding the frequency of
consumers’ willingness to change children’s furniture, the majority of the selection focused
on 3-5 years and even longer, which confirms that China has a long-term orientation culture.
Regional difference belongs to one of subculture features, and sometimes a subculture will
create a substantial and distinctive market segment of its own. Even in the same country,
people from different regions have distinct values and attitudes towards a certain product.
In this study, it concentrates on examining whether there are differences in consumers’
perceptions of children’s furniture between two geographic regions in China, namely
Shanghai and Shenzhen. The results indicate that there is no evident distinction between
respondents’ opinions in these two cities, but some divergences still exist.
Respondents in both regions mostly preferred solid wood as the raw material for children’s
furniture (Figure 6-23, also see Appendix IV, Table A14). Nevertheless, the proportion of
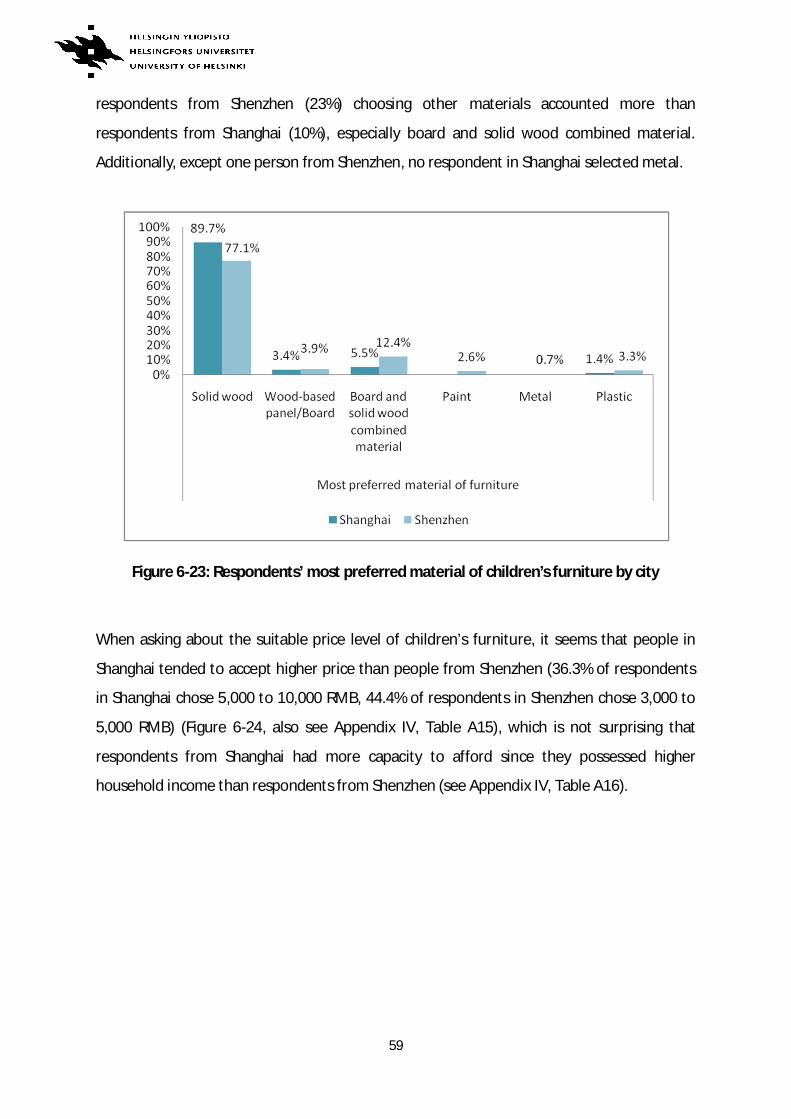
59
respondents from Shenzhen (23%) choosing other materials accounted more than
respondents from Shanghai (10%), especially board and solid wood combined material.
Additionally, except one person from Shenzhen, no respondent in Shanghai selected metal.
Figure 6-23: Respondents’ most preferred material of children’s furniture by city
When asking about the suitable price level of children’s furniture, it seems that people in
Shanghai tended to accept higher price than people from Shenzhen (36.3% of respondents
in Shanghai chose 5,000 to 10,000 RMB, 44.4% of respondents in Shenzhen chose 3,000 to
5,000 RMB) (Figure 6-24, also see Appendix IV, Table A15), which is not surprising that
respondents from Shanghai had more capacity to afford since they possessed higher
household income than respondents from Shenzhen (see Appendix IV, Table A16).
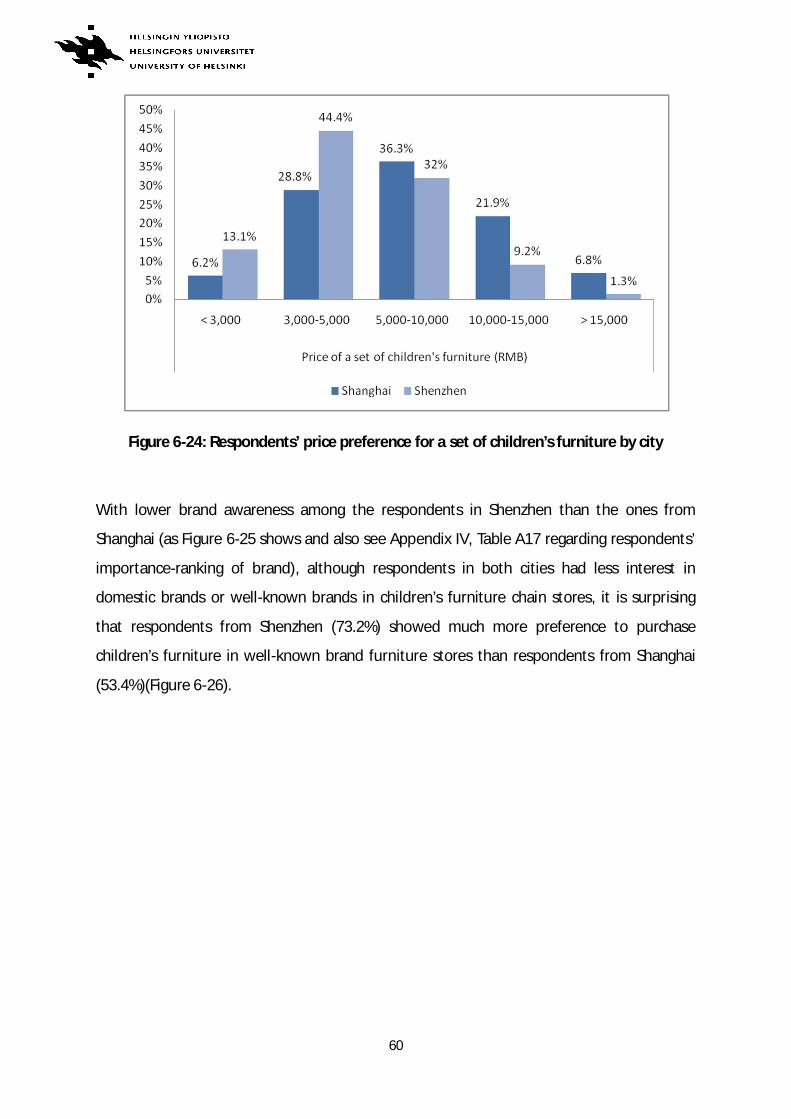
60
Figure 6-24: Respondents’ price preference for a set of children’s furniture by city
With lower brand awareness among the respondents in Shenzhen than the ones from
Shanghai (as Figure 6-25 shows and also see Appendix IV, Table A17 regarding respondents’
importance-ranking of brand), although respondents in both cities had less interest in
domestic brands or well-known brands in children’s furniture chain stores, it is surprising
that respondents from Shenzhen (73.2%) showed much more preference to purchase
children’s furniture in well-known brand furniture stores than respondents from Shanghai
(53.4%)(Figure 6-26).
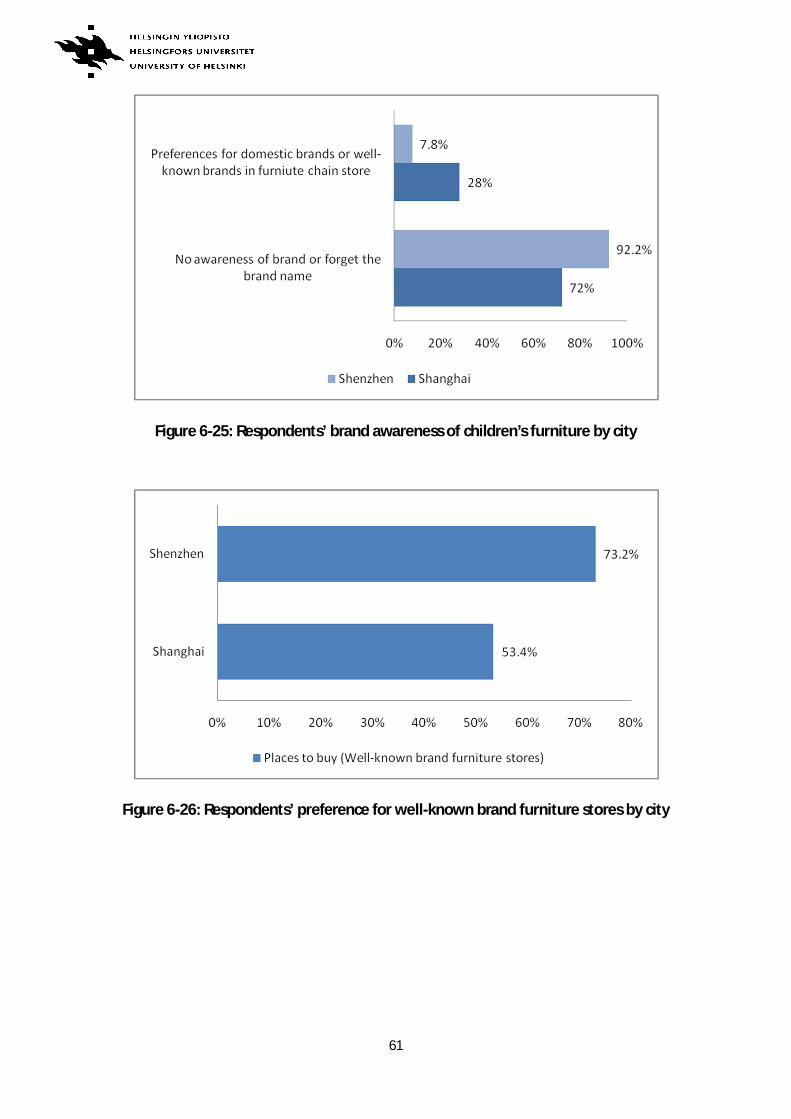
61
Figure 6-25: Respondents’ brand awareness of children’s furniture by city
Figure 6-26: Respondents’ preference for well-known brand furniture stores by city
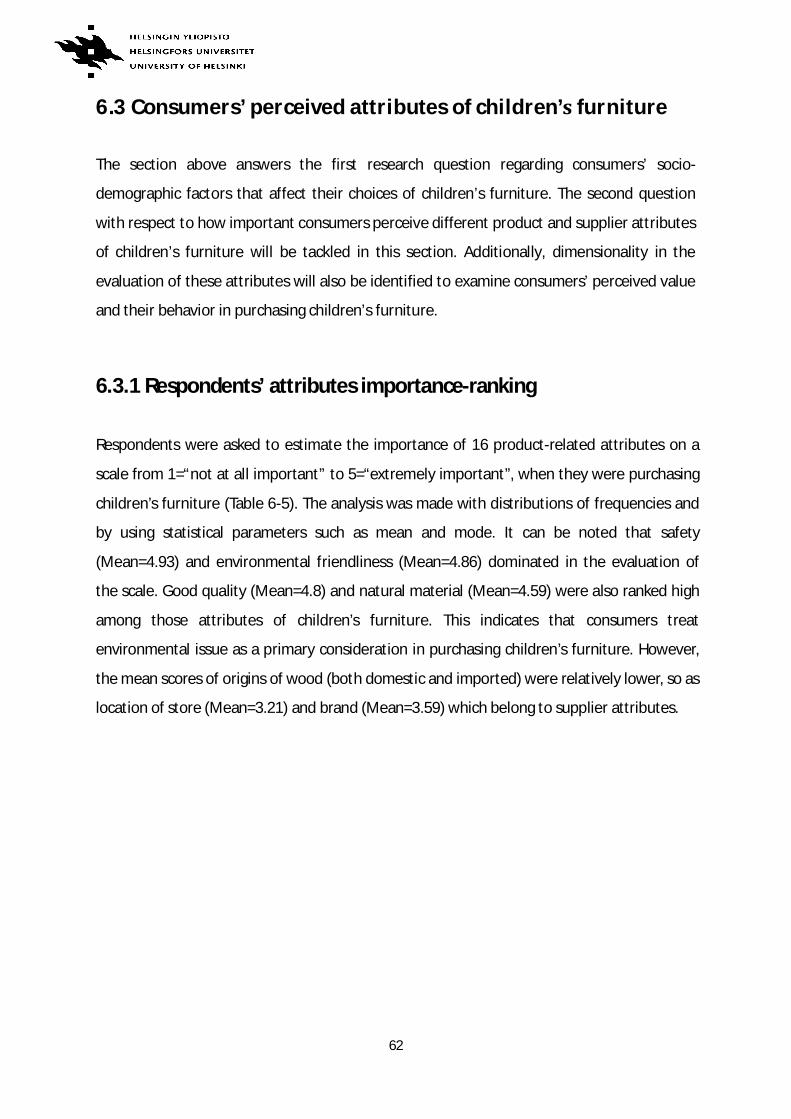
62
6.3 Consumers’ perceived attributes of children’ furniture
The section above answers the first research question regarding consumers’ socio-
demographic factors that affect their choices of children’s furniture. The second question
with respect to how important consumers perceive different product and supplier attributes
of children’s furniture will be tackled in this section. Additionally, dimensionality in the
evaluation of these attributes will also be identified to examine consumers’ perceived value
and their behavior in purchasing children’s furniture.
6.3.1 Respondents’ attributes importance-ranking
Respondents were asked to estimate the importance of 16 product-related attributes on a
scale from 1=“not at all important” to 5=“extremely important”, when they were purchasing
children’s furniture (Table 6-5). The analysis was made with distributions of frequencies and
by using statistical parameters such as mean and mode. It can be noted that safety
(Mean=4.93) and environmental friendliness (Mean=4.86) dominated in the evaluation of
the scale. Good quality (Mean=4.8) and natural material (Mean=4.59) were also ranked high
among those attributes of children’s furniture. This indicates that consumers treat
environmental issue as a primary consideration in purchasing children’s furniture. However,
the mean scores of origins of wood (both domestic and imported) were relatively lower, so as
location of store (Mean=3.21) and brand (Mean=3.59) which belong to supplier attributes.
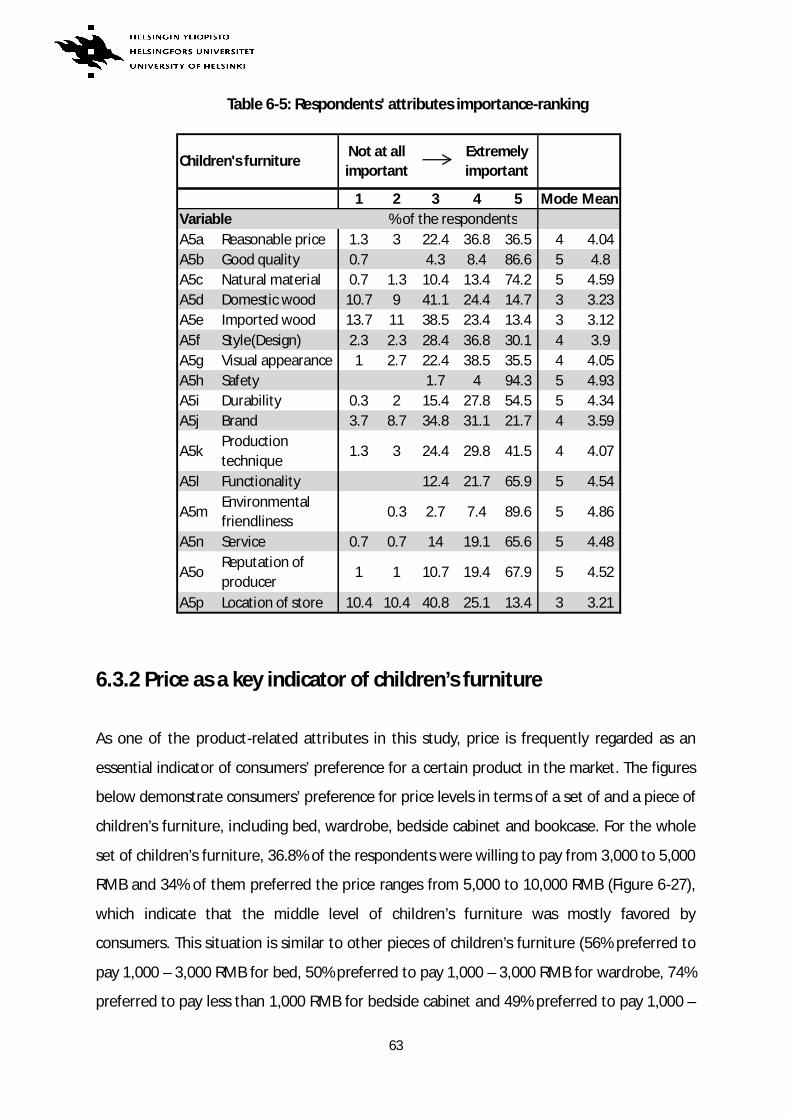
63
Table 6-5: Respondents' attributes importance-ranking
6.3.2 Price as a key indicator of children’s furniture
As one of the product-related attributes in this study, price is frequently regarded as an
essential indicator of consumers’ preference for a certain product in the market. The figures
below demonstrate consumers’ preference for price levels in terms of a set of and a piece of
children’s furniture, including bed, wardrobe, bedside cabinet and bookcase. For the whole
set of children’s furniture, 36.8% of the respondents were willing to pay from 3,000 to 5,000
RMB and 34% of them preferred the price ranges from 5,000 to 10,000 RMB (Figure 6-27),
which indicate that the middle level of children’s furniture was mostly favored by
consumers. This situation is similar to other pieces of children’s furniture (56% preferred to
pay 1,000 – 3,000 RMB for bed, 50% preferred to pay 1,000 – 3,000 RMB for wardrobe, 74%
preferred to pay less than 1,000 RMB for bedside cabinet and 49% preferred to pay 1,000 –
1 2 3 4 5 Mode MeanVariable % of the respondentsA5a Reasonable price 1.3 3 22.4 36.8 36.5 4 4.04A5b Good quality 0.7 4.3 8.4 86.6 5 4.8A5c Natural material 0.7 1.3 10.4 13.4 74.2 5 4.59A5d Domestic wood 10.7 9 41.1 24.4 14.7 3 3.23A5e Imported wood 13.7 11 38.5 23.4 13.4 3 3.12A5f Style(Design) 2.3 2.3 28.4 36.8 30.1 4 3.9A5g Visual appearance 1 2.7 22.4 38.5 35.5 4 4.05A5h Safety 1.7 4 94.3 5 4.93A5i Durability 0.3 2 15.4 27.8 54.5 5 4.34A5j Brand 3.7 8.7 34.8 31.1 21.7 4 3.59
A5kProductiontechnique
1.3 3 24.4 29.8 41.5 4 4.07
A5l Functionality 12.4 21.7 65.9 5 4.54
A5mEnvironmentalfriendliness
0.3 2.7 7.4 89.6 5 4.86
A5n Service 0.7 0.7 14 19.1 65.6 5 4.48
A5oReputation ofproducer
1 1 10.7 19.4 67.9 5 4.52
A5p Location of store 10.4 10.4 40.8 25.1 13.4 3 3.21
Not at allimportant
Children's furnitureExtremelyimportant
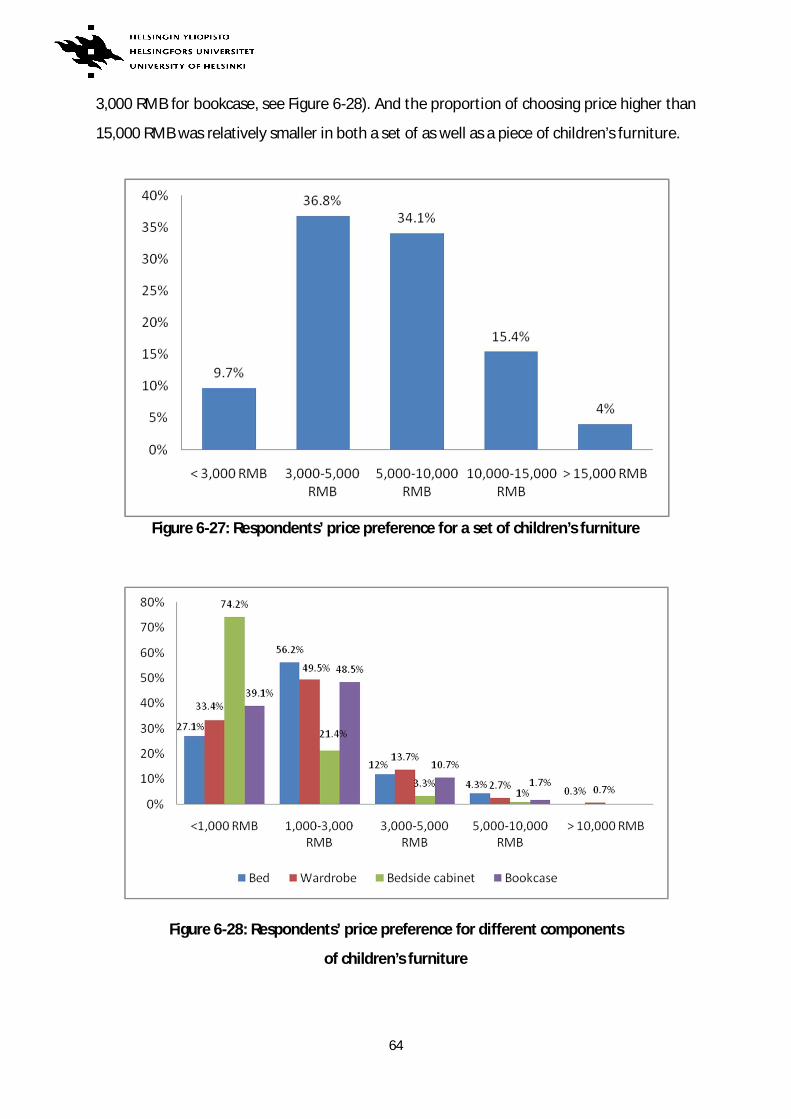
64
3,000 RMB for bookcase, see Figure 6-28). And the proportion of choosing price higher than
15,000 RMB was relatively smaller in both a set of as well as a piece of children’s furniture.
Figure 6-27: Respondents’ price preference for a set of children’s furniture
Figure 6-28: Respondents’ price preference for different components
of children’s furniture
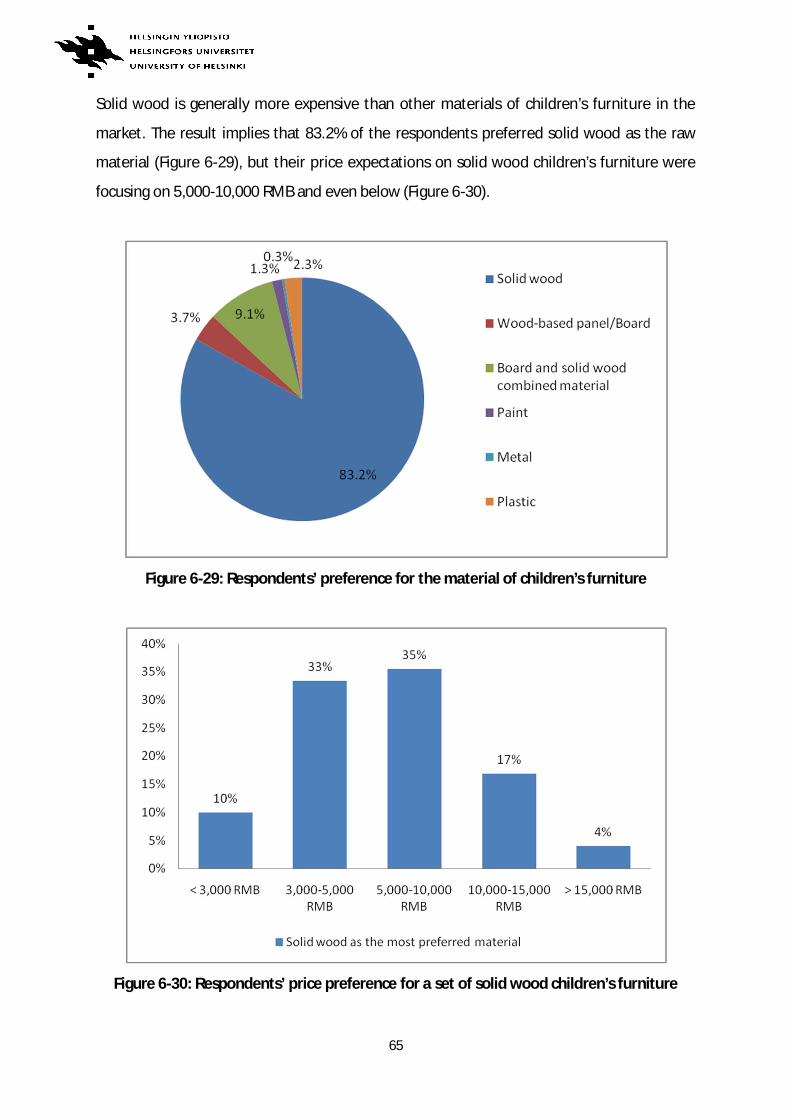
65
Solid wood is generally more expensive than other materials of children’s furniture in the
market. The result implies that 83.2% of the respondents preferred solid wood as the raw
material (Figure 6-29), but their price expectations on solid wood children’s furniture were
focusing on 5,000-10,000 RMB and even below (Figure 6-30).
Figure 6-29: Respondents’ preference for the material of children’s furniture
Figure 6-30: Respondents’ price preference for a set of solid wood children’s furniture
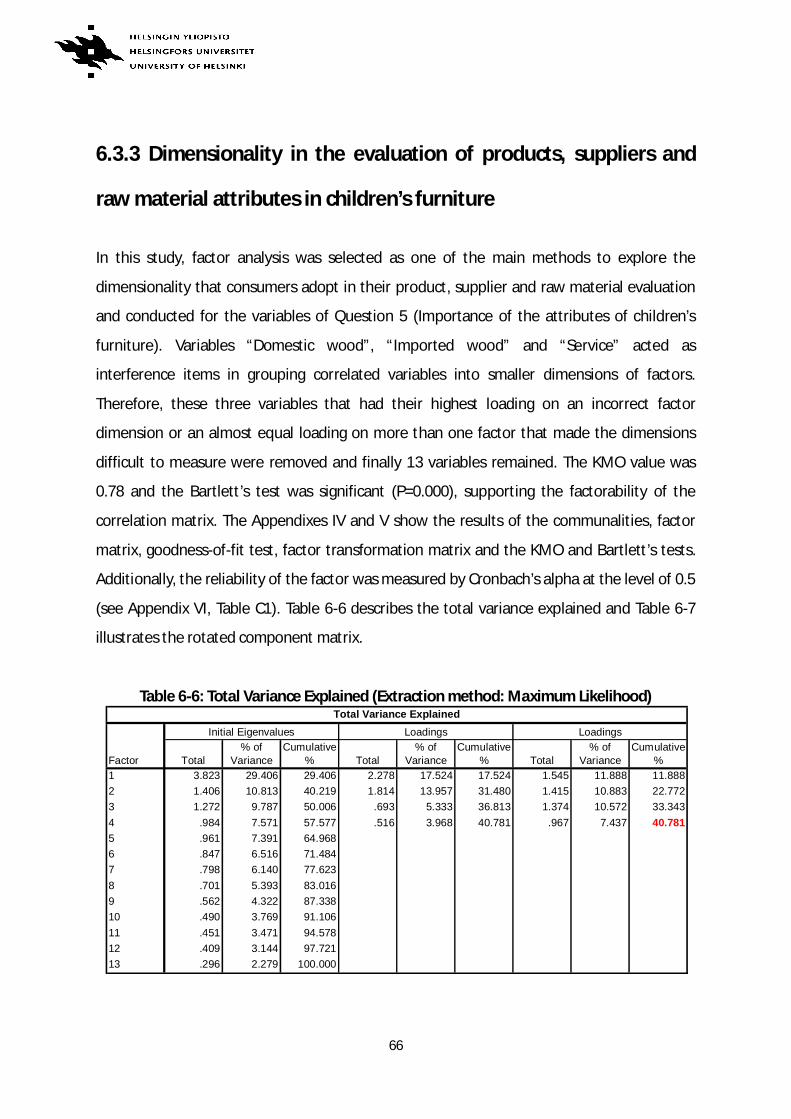
66
6.3.3 Dimensionality in the evaluation of products, suppliers and
raw material attributes in children’s furniture
In this study, factor analysis was selected as one of the main methods to explore the
dimensionality that consumers adopt in their product, supplier and raw material evaluation
and conducted for the variables of Question 5 (Importance of the attributes of children’s
furniture). Variables “Domestic wood”, “Imported wood” and “Service” acted as
interference items in grouping correlated variables into smaller dimensions of factors.
Therefore, these three variables that had their highest loading on an incorrect factor
dimension or an almost equal loading on more than one factor that made the dimensions
difficult to measure were removed and finally 13 variables remained. The KMO value was
0.78 and the Bartlett’s test was significant (P=0.000), supporting the factorability of the
correlation matrix. The Appendixes IV and V show the results of the communalities, factor
matrix, goodness-of-fit test, factor transformation matrix and the KMO and Bartlett’s tests.
Additionally, the reliability of the factor was measured by Cronbach’s alpha at the level of 0.5
(see Appendix VI, Table C1). Table 6-6 describes the total variance explained and Table 6-7
illustrates the rotated component matrix.
Table 6-6: Total Variance Explained (Extraction method: Maximum Likelihood)
Total% of
VarianceCumulative
% Total% of
VarianceCumulative
% Total% of
VarianceCumulative
%1 3.823 29.406 29.406 2.278 17.524 17.524 1.545 11.888 11.8882 1.406 10.813 40.219 1.814 13.957 31.480 1.415 10.883 22.7723 1.272 9.787 50.006 .693 5.333 36.813 1.374 10.572 33.3434 .984 7.571 57.577 .516 3.968 40.781 .967 7.437 40.7815 .961 7.391 64.9686 .847 6.516 71.4847 .798 6.140 77.6238 .701 5.393 83.0169 .562 4.322 87.33810 .490 3.769 91.10611 .451 3.471 94.57812 .409 3.144 97.72113 .296 2.279 100.000
Total Variance Explained
Factor
Initial EigenvaluesExtraction Sums of Squared
LoadingsRotation Sums of Squared
Loadings
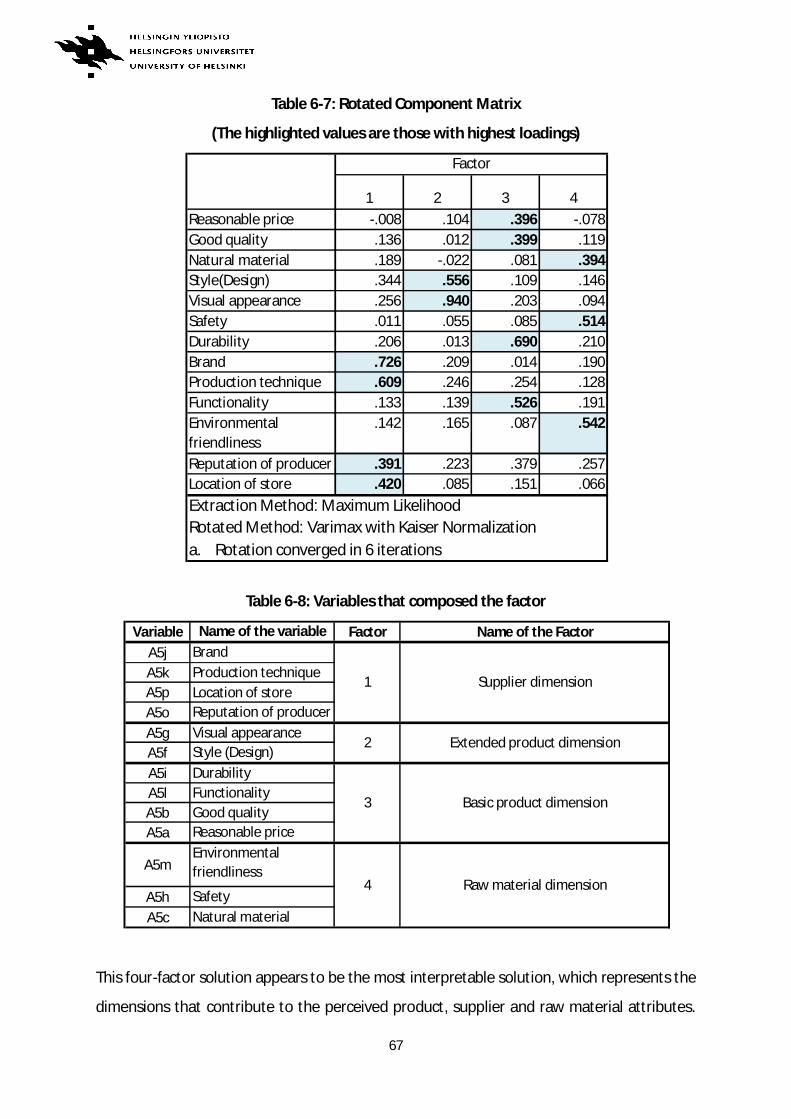
67
Table 6-7: Rotated Component Matrix
(The highlighted values are those with highest loadings)
Table 6-8: Variables that composed the factor
This four-factor solution appears to be the most interpretable solution, which represents the
dimensions that contribute to the perceived product, supplier and raw material attributes.
1 2 3 4Reasonable price -.008 .104 .396 -.078Good quality .136 .012 .399 .119Natural material .189 -.022 .081 .394Style(Design) .344 .556 .109 .146Visual appearance .256 .940 .203 .094Safety .011 .055 .085 .514Durability .206 .013 .690 .210Brand .726 .209 .014 .190Production technique .609 .246 .254 .128Functionality .133 .139 .526 .191Environmentalfriendliness
.142 .165 .087 .542
Reputation of producer .391 .223 .379 .257Location of store .420 .085 .151 .066
a. Rotation converged in 6 iterations
Factor
Extraction Method: Maximum LikelihoodRotated Method: Varimax with Kaiser Normalization
Variable Name of the variable Factor Name of the FactorA5j BrandA5k Production techniqueA5p Location of storeA5o Reputation of producerA5g Visual appearanceA5f Style (Design)A5i DurabilityA5l FunctionalityA5b Good qualityA5a Reasonable price
A5mEnvironmentalfriendliness
A5h SafetyA5c Natural material
1 Supplier dimension
2 Extended product dimension
4 Raw material dimension
3 Basic product dimension
68
These dimensions are indicated in Table 6-8 above, which are named as 1) Supplier
dimension of children’s furniture, 2) Extended product dimension of children’s furniture, 3)
Basic product dimension of children’s furniture and 4) Raw material dimension of children’s
furniture.
Factor 1: “Supplier dimension of children’s furniture”
Factor 1 explains 12% of the variance, which implies that the dimension of Factor 1 is the
strongest. It concerns variables that include supplier attributes. Brand, production technique
and location of the store have strong factor loadings, with reputation having a slightly
weaker loading (0.391), values over 0.4 illustrate that each variable correlates strongly with
the factor. However, the communality of the variable “Location of store” is less than 0.3 (see
Appendix IV, Table A22), which demonstrates that the correlation with other variables within
Factor 1 is less strong enough.
Factor 2: “Extended product dimension of children’s furniture”
Factor 2 explains 11% of the variance. Visual appearance and style/design can be regarded
as value-added attributes of the product, which belong to consumers’ higher requirement of
children’s furniture. Factor 2 involves variables visual appearance and style/design that are
both resulting in high communalities and strong loadings, especially visual appearance which
shows the highest value among all variables (0.94). This implies that they correlate strongly
with Factor 1.
Factor 3: “Basic product dimension of children’s furniture”
Factor 3 consists of variables that reflect consumers’ basic requirements when buying
children’s furniture. It explains similar variance (10.6%) with Factor 2 since both of them are
parts of product attributes. Durability and functionality show higher factor loadings than the
other two variables (good quality and reasonable price), which manifests that there exists a
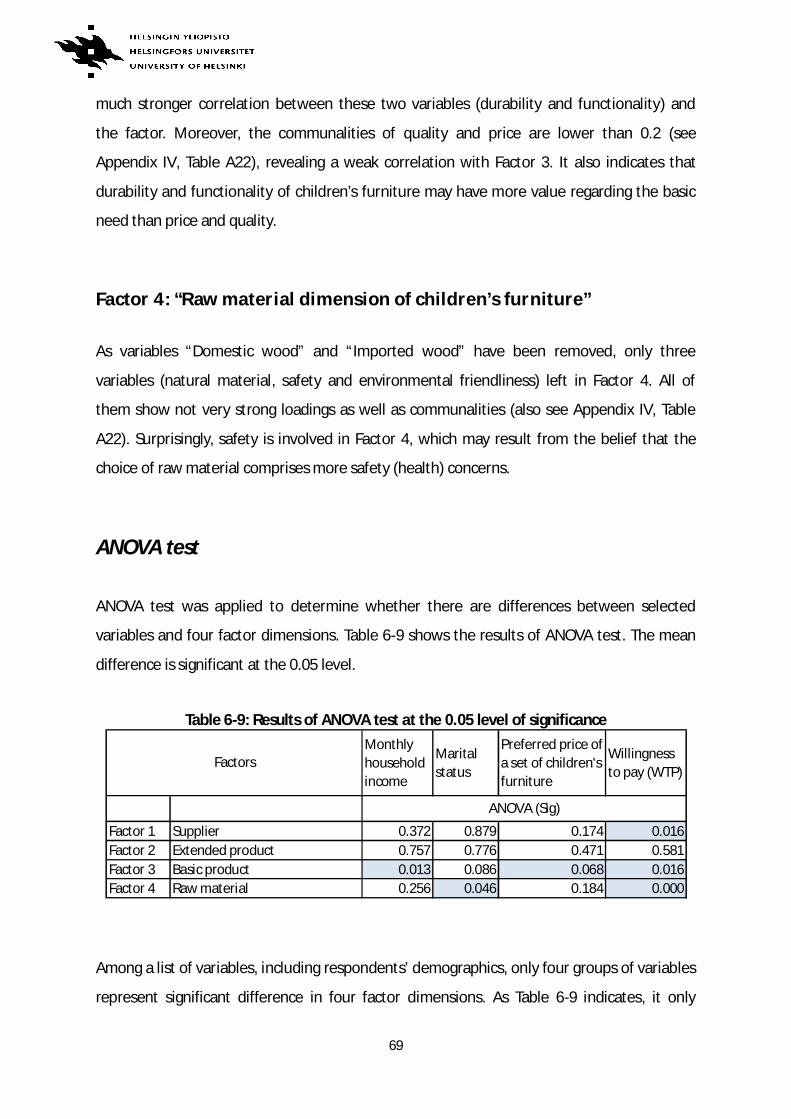
69
much stronger correlation between these two variables (durability and functionality) and
the factor. Moreover, the communalities of quality and price are lower than 0.2 (see
Appendix IV, Table A22), revealing a weak correlation with Factor 3. It also indicates that
durability and functionality of children’s furniture may have more value regarding the basic
need than price and quality.
Factor 4: “Raw material dimension of children’s furniture”
As variables “Domestic wood” and “Imported wood” have been removed, only three
variables (natural material, safety and environmental friendliness) left in Factor 4. All of
them show not very strong loadings as well as communalities (also see Appendix IV, Table
A22). Surprisingly, safety is involved in Factor 4, which may result from the belief that the
choice of raw material comprises more safety (health) concerns.
ANOVA test
ANOVA test was applied to determine whether there are differences between selected
variables and four factor dimensions. Table 6-9 shows the results of ANOVA test. The mean
difference is significant at the 0.05 level.
Table 6-9: Results of ANOVA test at the 0.05 level of significance
Among a list of variables, including respondents’ demographics, only four groups of variables
represent significant difference in four factor dimensions. As Table 6-9 indicates, it only
Monthlyhouseholdincome
Maritalstatus
Preferred price ofa set of children'sfurniture
Willingnessto pay (WTP)
Factor 1 Supplier 0.372 0.879 0.174 0.016Factor 2 Extended product 0.757 0.776 0.471 0.581Factor 3 Basic product 0.013 0.086 0.068 0.016Factor 4 Raw material 0.256 0.046 0.184 0.000
ANOVA (Sig)
Factors
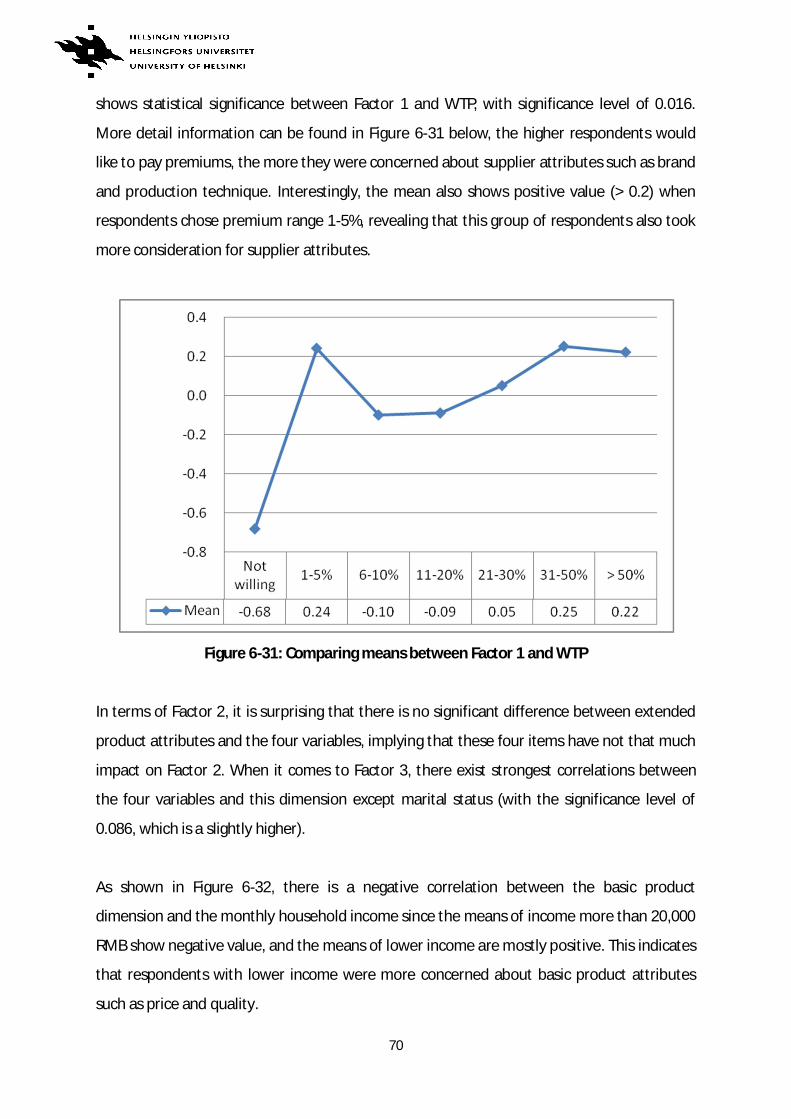
70
shows statistical significance between Factor 1 and WTP, with significance level of 0.016.
More detail information can be found in Figure 6-31 below, the higher respondents would
like to pay premiums, the more they were concerned about supplier attributes such as brand
and production technique. Interestingly, the mean also shows positive value (> 0.2) when
respondents chose premium range 1-5%, revealing that this group of respondents also took
more consideration for supplier attributes.
Figure 6-31: Comparing means between Factor 1 and WTP
In terms of Factor 2, it is surprising that there is no significant difference between extended
product attributes and the four variables, implying that these four items have not that much
impact on Factor 2. When it comes to Factor 3, there exist strongest correlations between
the four variables and this dimension except marital status (with the significance level of
0.086, which is a slightly higher).
As shown in Figure 6-32, there is a negative correlation between the basic product
dimension and the monthly household income since the means of income more than 20,000
RMB show negative value, and the means of lower income are mostly positive. This indicates
that respondents with lower income were more concerned about basic product attributes
such as price and quality.
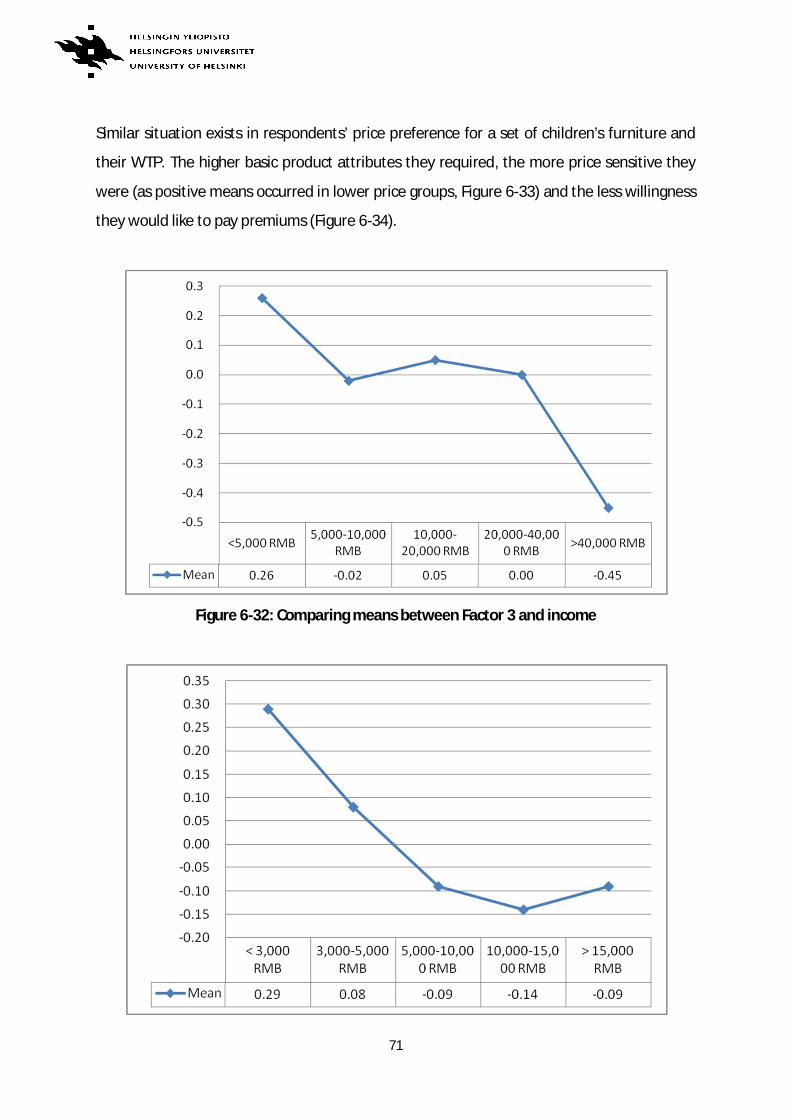
71
Similar situation exists in respondents’ price preference for a set of children’s furniture and
their WTP. The higher basic product attributes they required, the more price sensitive they
were (as positive means occurred in lower price groups, Figure 6-33) and the less willingness
they would like to pay premiums (Figure 6-34).
Figure 6-32: Comparing means between Factor 3 and income
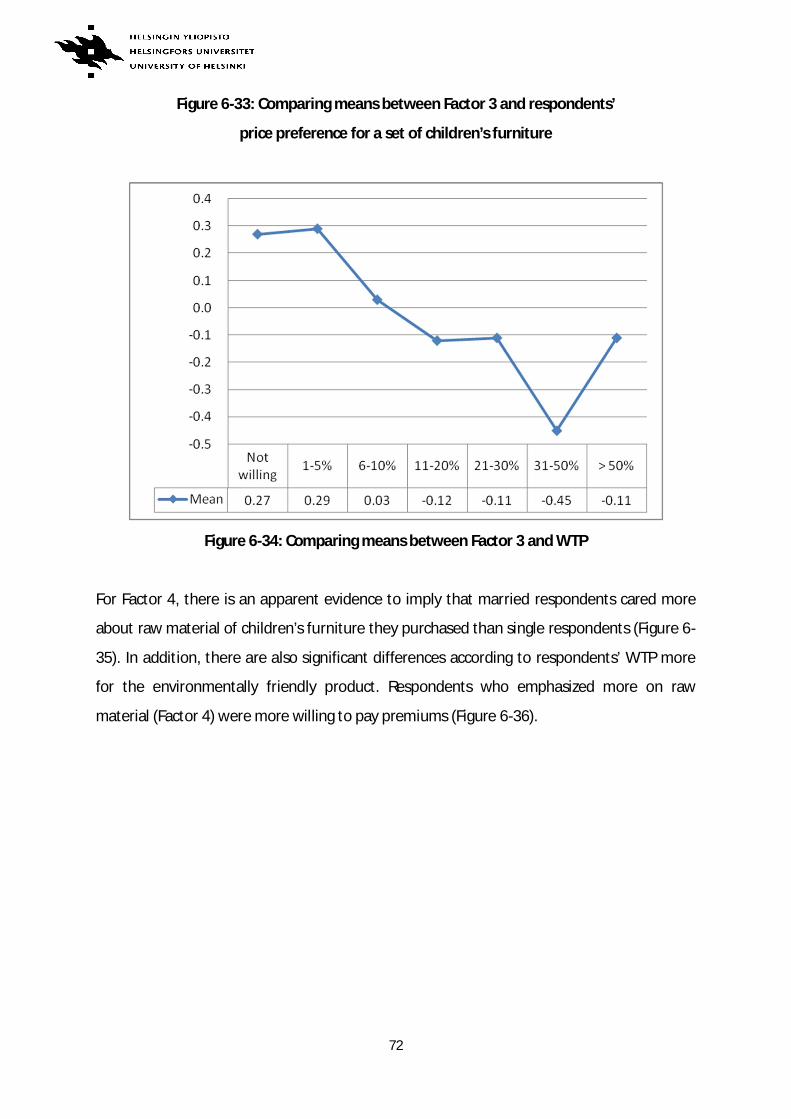
72
Figure 6-33: Comparing means between Factor 3 and respondents’
price preference for a set of children’s furniture
Figure 6-34: Comparing means between Factor 3 and WTP
For Factor 4, there is an apparent evidence to imply that married respondents cared more
about raw material of children’s furniture they purchased than single respondents (Figure 6-
35). In addition, there are also significant differences according to respondents’ WTP more
for the environmentally friendly product. Respondents who emphasized more on raw
material (Factor 4) were more willing to pay premiums (Figure 6-36).
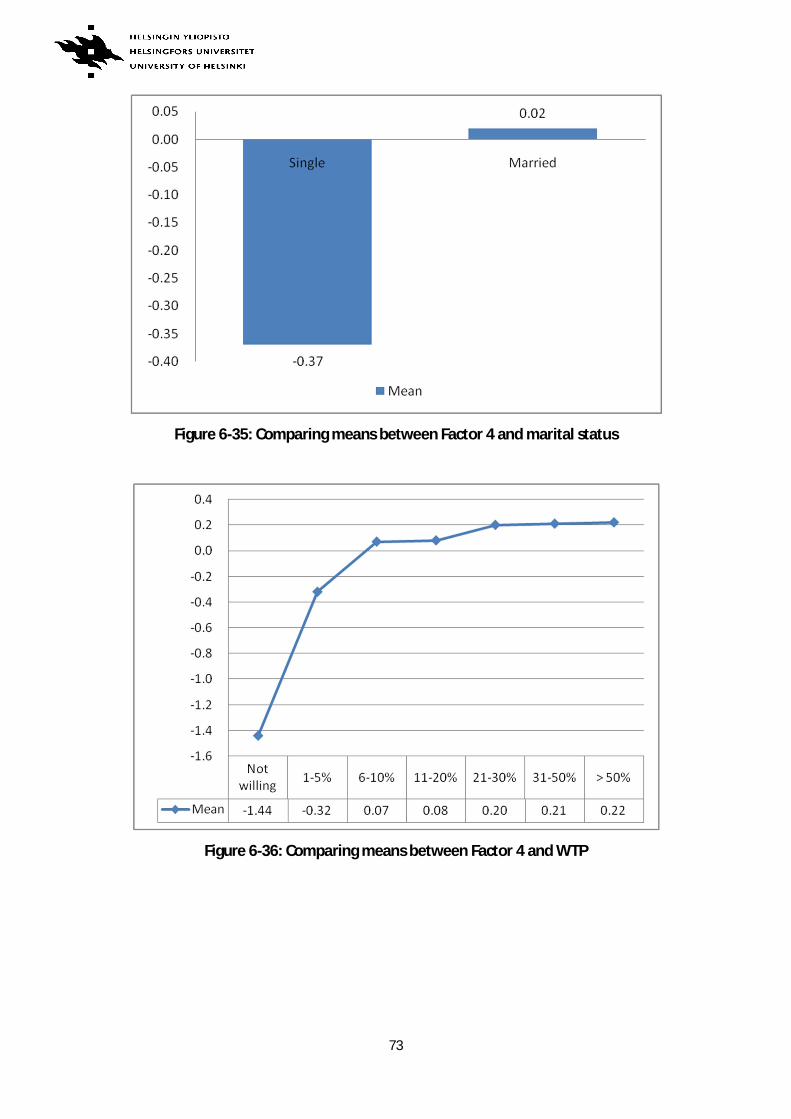
73
Figure 6-35: Comparing means between Factor 4 and marital status
Figure 6-36: Comparing means between Factor 4 and WTP
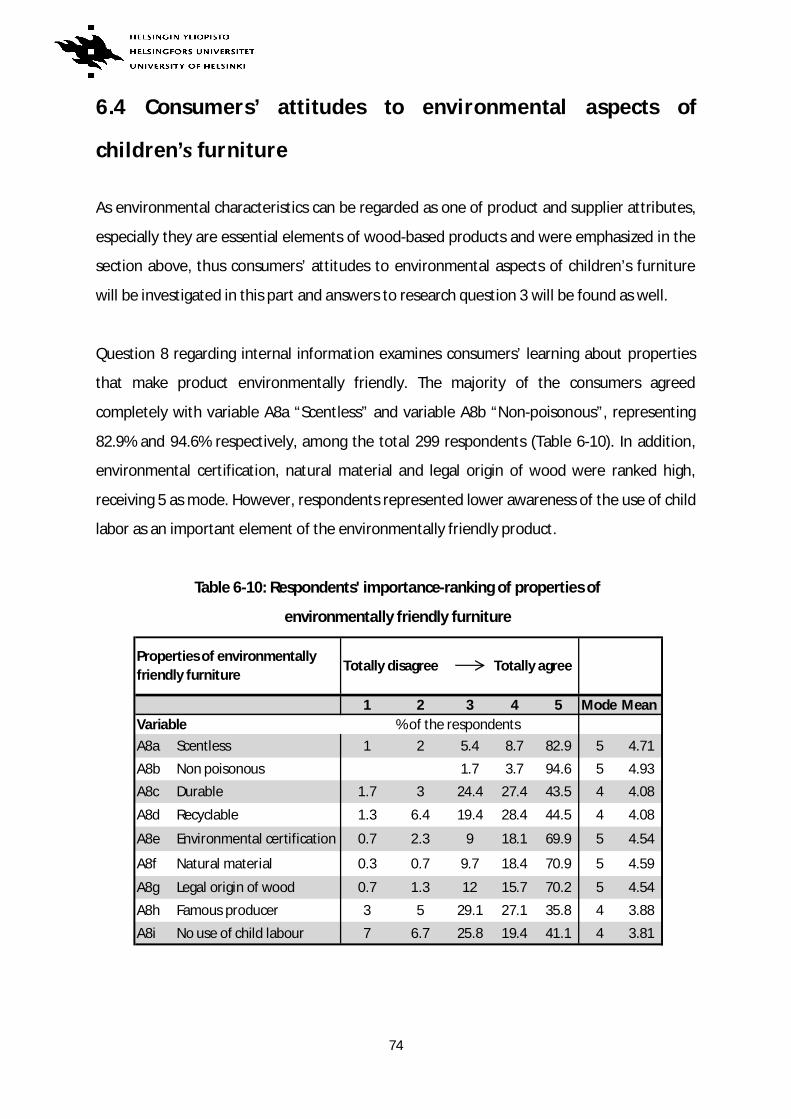
74
6.4 Consumers’ attitudes to environmental aspects of
children’ furniture
As environmental characteristics can be regarded as one of product and supplier attributes,
especially they are essential elements of wood-based products and were emphasized in the
section above, thus consumers’ attitudes to environmental aspects of children’s furniture
will be investigated in this part and answers to research question 3 will be found as well.
Question 8 regarding internal information examines consumers’ learning about properties
that make product environmentally friendly. The majority of the consumers agreed
completely with variable A8a “Scentless” and variable A8b “Non-poisonous”, representing
82.9% and 94.6% respectively, among the total 299 respondents (Table 6-10). In addition,
environmental certification, natural material and legal origin of wood were ranked high,
receiving 5 as mode. However, respondents represented lower awareness of the use of child
labor as an important element of the environmentally friendly product.
Table 6-10: Respondents' importance-ranking of properties of
environmentally friendly furniture
1 2 3 4 5 Mode MeanVariable % of the respondentsA8a Scentless 1 2 5.4 8.7 82.9 5 4.71
A8b Non poisonous 1.7 3.7 94.6 5 4.93A8c Durable 1.7 3 24.4 27.4 43.5 4 4.08
A8d Recyclable 1.3 6.4 19.4 28.4 44.5 4 4.08
A8e Environmental certification 0.7 2.3 9 18.1 69.9 5 4.54
A8f Natural material 0.3 0.7 9.7 18.4 70.9 5 4.59
A8g Legal origin of wood 0.7 1.3 12 15.7 70.2 5 4.54
A8h Famous producer 3 5 29.1 27.1 35.8 4 3.88
A8i No use of child labour 7 6.7 25.8 19.4 41.1 4 3.81
Properties of environmentallyfriendly furniture
Totally disagree Totally agree
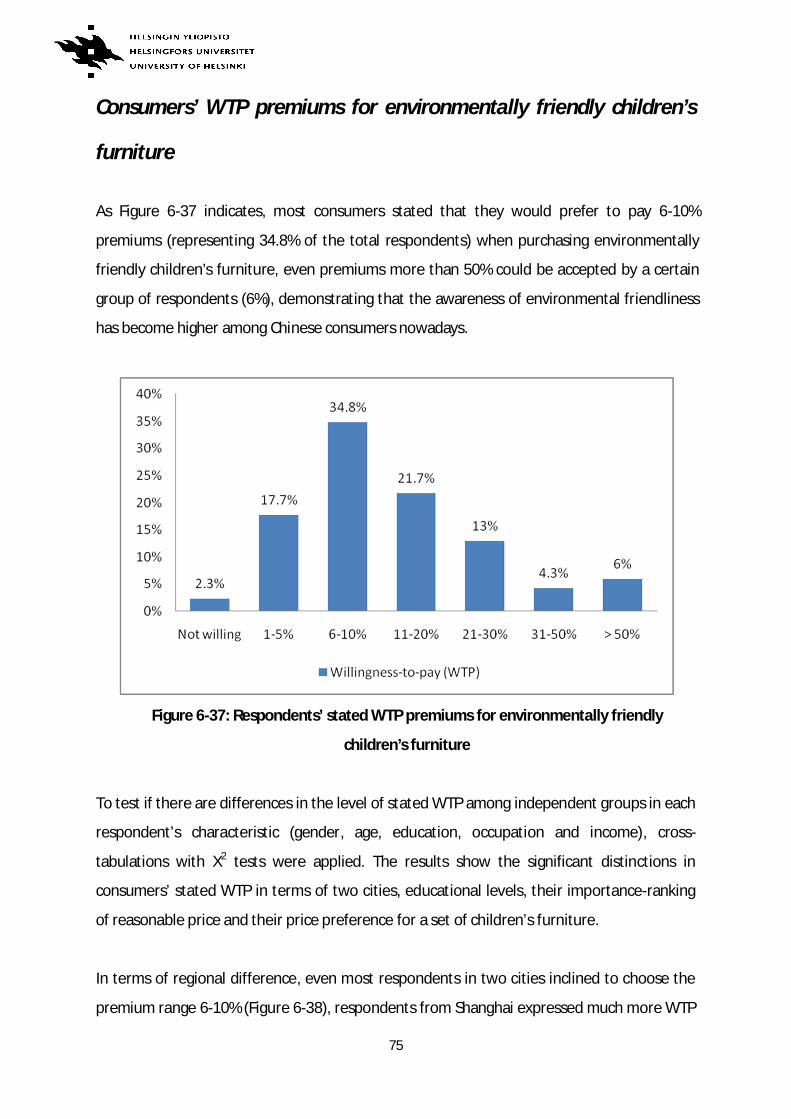
75
Consumers’ WTP premiums for environmentally friendly children’s
furniture
As Figure 6-37 indicates, most consumers stated that they would prefer to pay 6-10%
premiums (representing 34.8% of the total respondents) when purchasing environmentally
friendly children’s furniture, even premiums more than 50% could be accepted by a certain
group of respondents (6%), demonstrating that the awareness of environmental friendliness
has become higher among Chinese consumers nowadays.
Figure 6-37: Respondents’ stated WTP premiums for environmentally friendly
children’s furniture
To test if there are differences in the level of stated WTP among independent groups in each
respondent’s characteristic (gender, age, education, occupation and income), cross-
tabulations with X2 tests were applied. The results show the significant distinctions in
consumers’ stated WTP in terms of two cities, educational levels, their importance-ranking
of reasonable price and their price preference for a set of children’s furniture.
In terms of regional difference, even most respondents in two cities inclined to choose the
premium range 6-10% (Figure 6-38), respondents from Shanghai expressed much more WTP
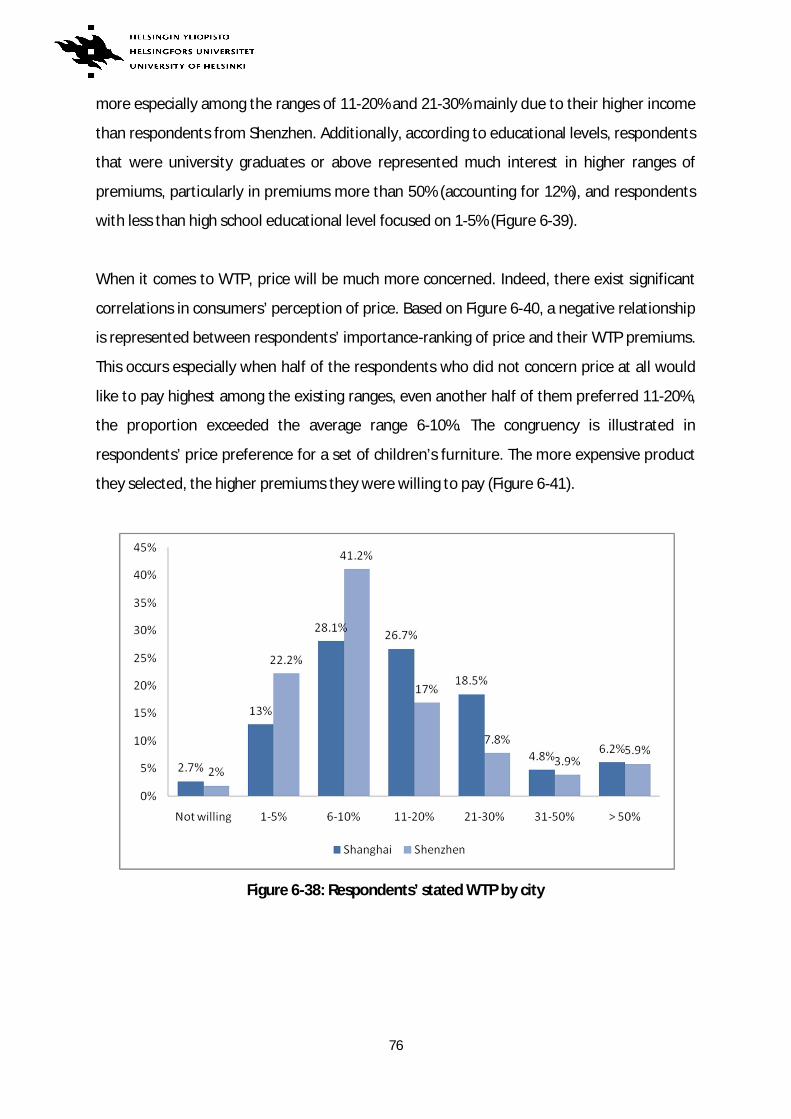
76
more especially among the ranges of 11-20% and 21-30% mainly due to their higher income
than respondents from Shenzhen. Additionally, according to educational levels, respondents
that were university graduates or above represented much interest in higher ranges of
premiums, particularly in premiums more than 50% (accounting for 12%), and respondents
with less than high school educational level focused on 1-5% (Figure 6-39).
When it comes to WTP, price will be much more concerned. Indeed, there exist significant
correlations in consumers’ perception of price. Based on Figure 6-40, a negative relationship
is represented between respondents’ importance-ranking of price and their WTP premiums.
This occurs especially when half of the respondents who did not concern price at all would
like to pay highest among the existing ranges, even another half of them preferred 11-20%,
the proportion exceeded the average range 6-10%. The congruency is illustrated in
respondents’ price preference for a set of children’s furniture. The more expensive product
they selected, the higher premiums they were willing to pay (Figure 6-41).
Figure 6-38: Respondents’ stated WTP by city
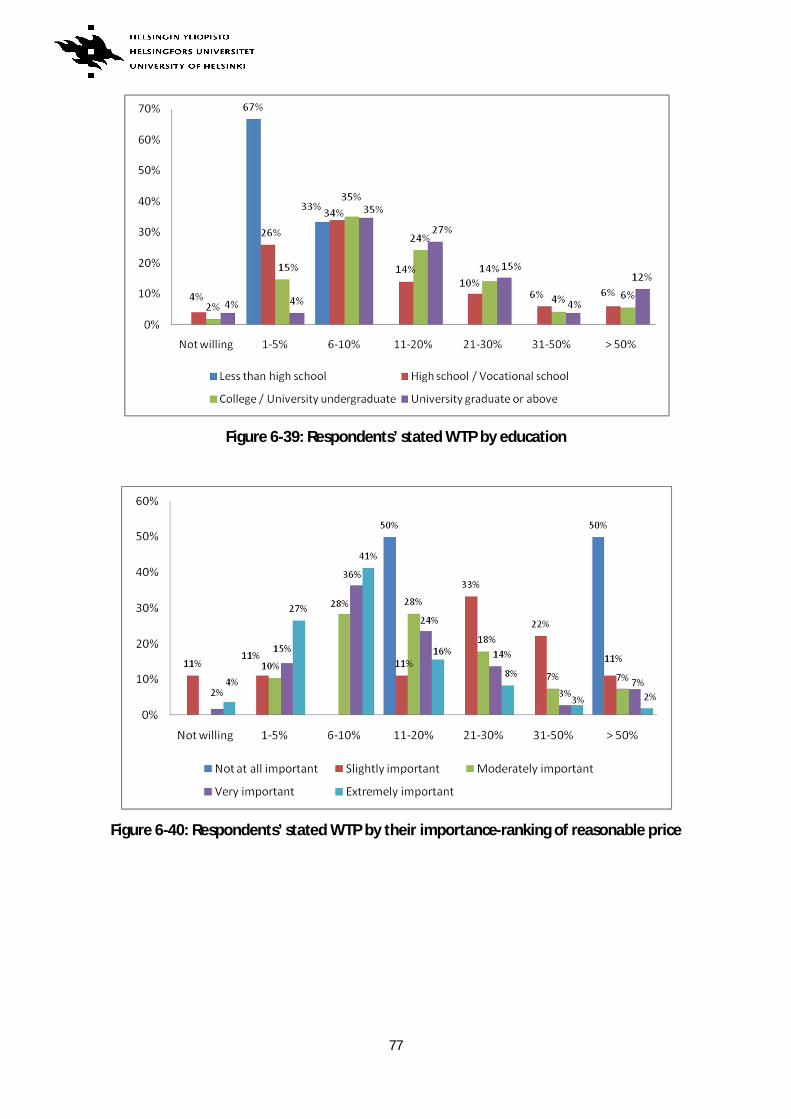
77
Figure 6-39: Respondents’ stated WTP by education
Figure 6-40: Respondents’ stated WTP by their importance-ranking of reasonable price
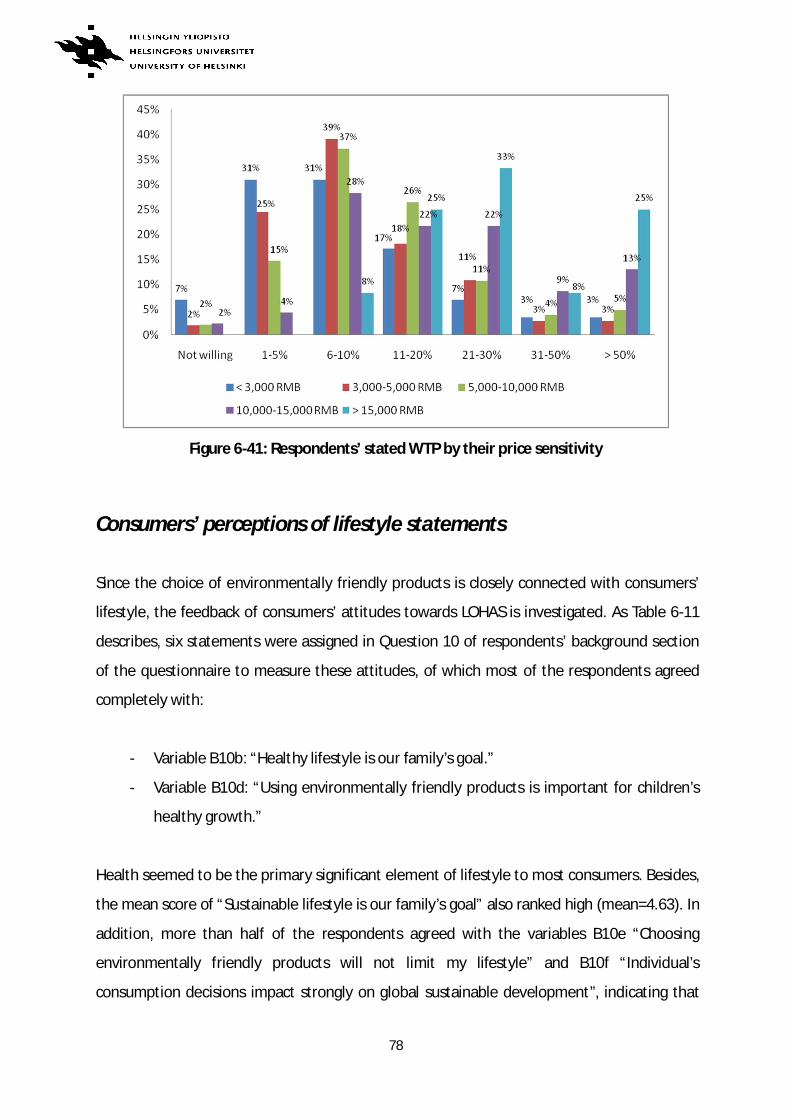
78
Figure 6-41: Respondents’ stated WTP by their price sensitivity
Consumers’ perceptions of lifestyle statements
Since the choice of environmentally friendly products is closely connected with consumers’
lifestyle, the feedback of consumers’ attitudes towards LOHAS is investigated. As Table 6-11
describes, six statements were assigned in Question 10 of respondents’ background section
of the questionnaire to measure these attitudes, of which most of the respondents agreed
completely with:
- Variable B10b: “Healthy lifestyle is our family’s goal.”
- Variable B10d: “Using environmentally friendly products is important for children’s
healthy growth.”
Health seemed to be the primary significant element of lifestyle to most consumers. Besides,
the mean score of “Sustainable lifestyle is our family’s goal” also ranked high (mean=4.63). In
addition, more than half of the respondents agreed with the variables B10e “Choosing
environmentally friendly products will not limit my lifestyle” and B10f “Individual’s
consumption decisions impact strongly on global sustainable development”, indicating that
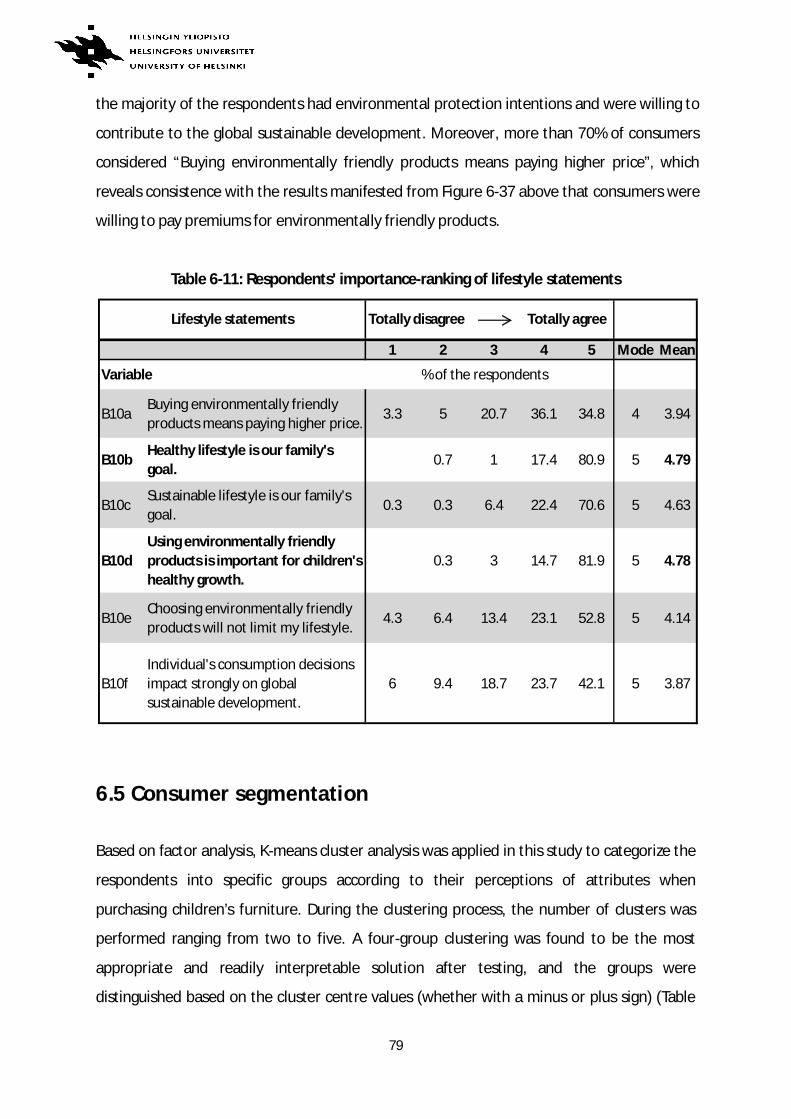
79
the majority of the respondents had environmental protection intentions and were willing to
contribute to the global sustainable development. Moreover, more than 70% of consumers
considered “Buying environmentally friendly products means paying higher price”, which
reveals consistence with the results manifested from Figure 6-37 above that consumers were
willing to pay premiums for environmentally friendly products.
Table 6-11: Respondents' importance-ranking of lifestyle statements
6.5 Consumer segmentation
Based on factor analysis, K-means cluster analysis was applied in this study to categorize the
respondents into specific groups according to their perceptions of attributes when
purchasing children’s furniture. During the clustering process, the number of clusters was
performed ranging from two to five. A four-group clustering was found to be the most
appropriate and readily interpretable solution after testing, and the groups were
distinguished based on the cluster centre values (whether with a minus or plus sign) (Table
1 2 3 4 5 Mode Mean
Variable % of the respondents
B10aBuying environmentally friendlyproducts means paying higher price.
3.3 5 20.7 36.1 34.8 4 3.94
B10bHealthy lifestyle is our family'sgoal.
0.7 1 17.4 80.9 5 4.79
B10cSustainable lifestyle is our family'sgoal.
0.3 0.3 6.4 22.4 70.6 5 4.63
B10dUsing environmentally friendlyproducts is important for children'shealthy growth.
0.3 3 14.7 81.9 5 4.78
B10eChoosing environmentally friendlyproducts will not limit my lifestyle.
4.3 6.4 13.4 23.1 52.8 5 4.14
B10fIndividual's consumption decisionsimpact strongly on globalsustainable development.
6 9.4 18.7 23.7 42.1 5 3.87
Lifestyle statements Totally disagree Totally agree
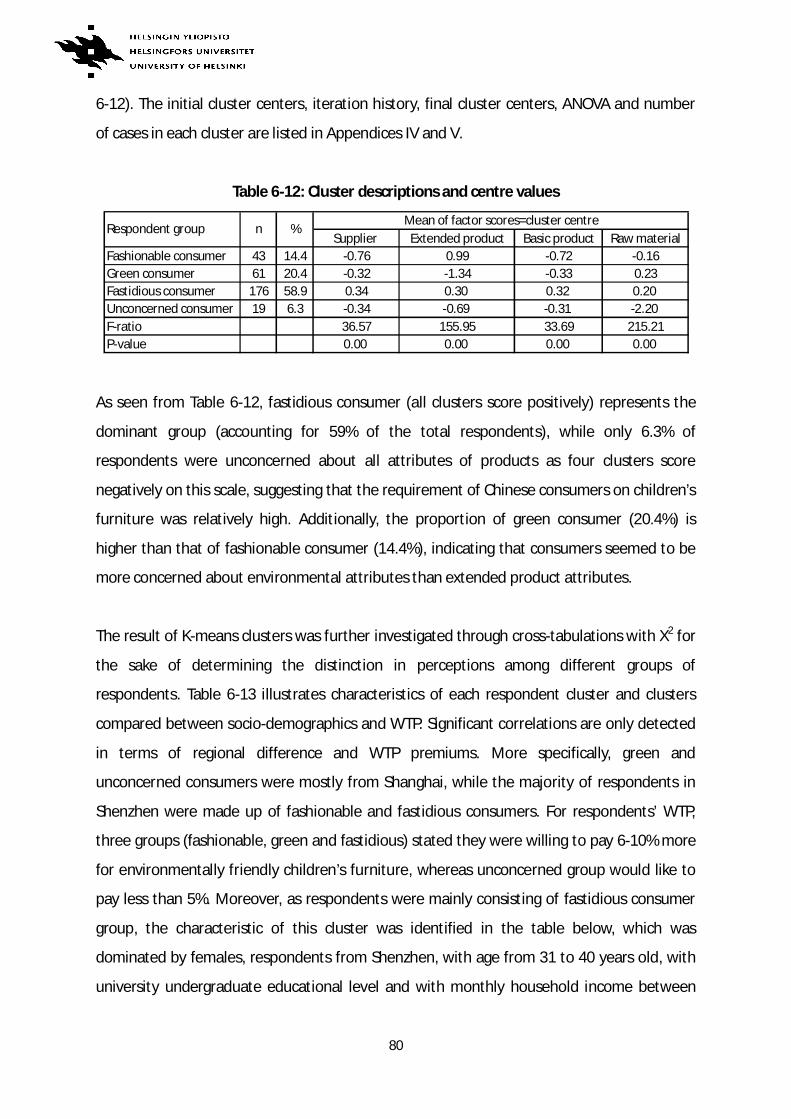
80
6-12). The initial cluster centers, iteration history, final cluster centers, ANOVA and number
of cases in each cluster are listed in Appendices IV and V.
Table 6-12: Cluster descriptions and centre values
As seen from Table 6-12, fastidious consumer (all clusters score positively) represents the
dominant group (accounting for 59% of the total respondents), while only 6.3% of
respondents were unconcerned about all attributes of products as four clusters score
negatively on this scale, suggesting that the requirement of Chinese consumers on children’s
furniture was relatively high. Additionally, the proportion of green consumer (20.4%) is
higher than that of fashionable consumer (14.4%), indicating that consumers seemed to be
more concerned about environmental attributes than extended product attributes.
The result of K-means clusters was further investigated through cross-tabulations with X2 for
the sake of determining the distinction in perceptions among different groups of
respondents. Table 6-13 illustrates characteristics of each respondent cluster and clusters
compared between socio-demographics and WTP. Significant correlations are only detected
in terms of regional difference and WTP premiums. More specifically, green and
unconcerned consumers were mostly from Shanghai, while the majority of respondents in
Shenzhen were made up of fashionable and fastidious consumers. For respondents’ WTP,
three groups (fashionable, green and fastidious) stated they were willing to pay 6-10% more
for environmentally friendly children’s furniture, whereas unconcerned group would like to
pay less than 5%. Moreover, as respondents were mainly consisting of fastidious consumer
group, the characteristic of this cluster was identified in the table below, which was
dominated by females, respondents from Shenzhen, with age from 31 to 40 years old, with
university undergraduate educational level and with monthly household income between
Supplier Extended product Basic product Raw materialFashionable consumer 43 14.4 -0.76 0.99 -0.72 -0.16Green consumer 61 20.4 -0.32 -1.34 -0.33 0.23Fastidious consumer 176 58.9 0.34 0.30 0.32 0.20Unconcerned consumer 19 6.3 -0.34 -0.69 -0.31 -2.20F-ratio 36.57 155.95 33.69 215.21P-value 0.00 0.00 0.00 0.00
Respondent group n %Mean of factor scores=cluster centre
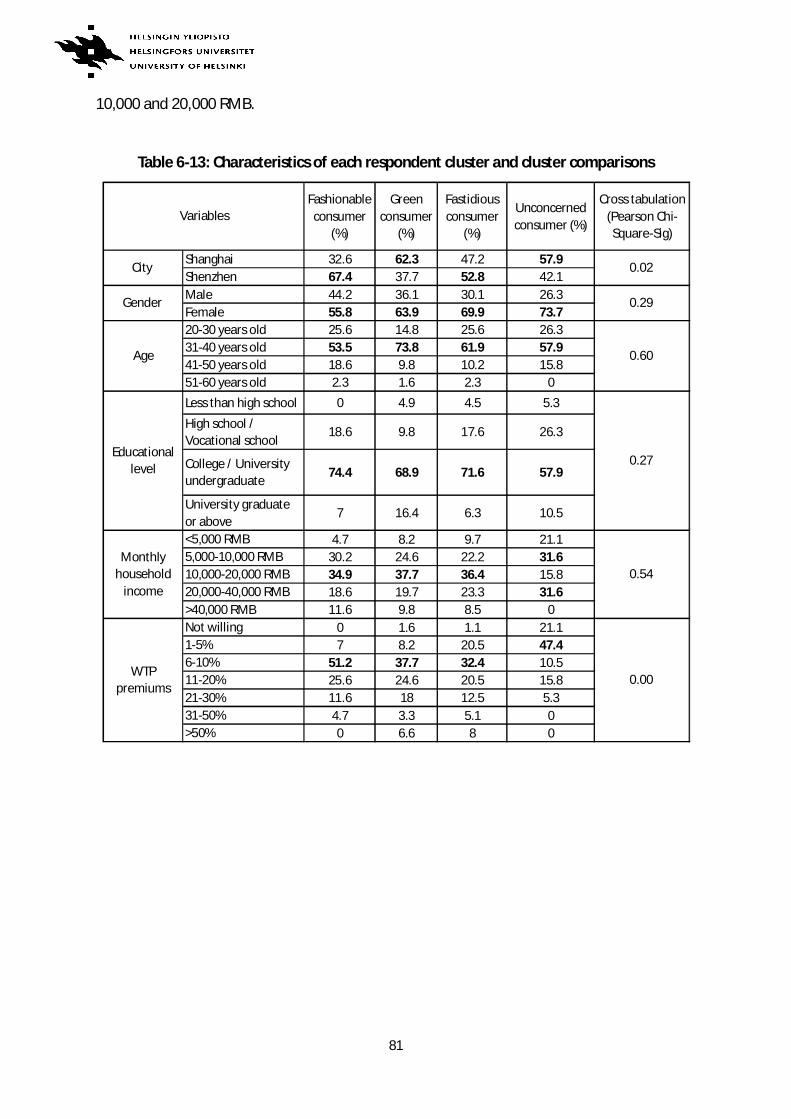
81
10,000 and 20,000 RMB.
Table 6-13: Characteristics of each respondent cluster and cluster comparisons
Fashionableconsumer
(%)
Greenconsumer
(%)
Fastidiousconsumer
(%)
Unconcernedconsumer (%)
Cross tabulation(Pearson Chi-Square-Sig)
Shanghai 32.6 62.3 47.2 57.9Shenzhen 67.4 37.7 52.8 42.1Male 44.2 36.1 30.1 26.3Female 55.8 63.9 69.9 73.720-30 years old 25.6 14.8 25.6 26.331-40 years old 53.5 73.8 61.9 57.941-50 years old 18.6 9.8 10.2 15.851-60 years old 2.3 1.6 2.3 0Less than high school 0 4.9 4.5 5.3High school /Vocational school
18.6 9.8 17.6 26.3
College / Universityundergraduate 74.4 68.9 71.6 57.9
University graduateor above
7 16.4 6.3 10.5
<5,000 RMB 4.7 8.2 9.7 21.15,000-10,000 RMB 30.2 24.6 22.2 31.610,000-20,000 RMB 34.9 37.7 36.4 15.820,000-40,000 RMB 18.6 19.7 23.3 31.6>40,000 RMB 11.6 9.8 8.5 0Not willing 0 1.6 1.1 21.11-5% 7 8.2 20.5 47.46-10% 51.2 37.7 32.4 10.511-20% 25.6 24.6 20.5 15.821-30% 11.6 18 12.5 5.331-50% 4.7 3.3 5.1 0>50% 0 6.6 8 0
WTPpremiums
0.02
0.29
0.60
0.27
0.54
0.00
Variables
City
Gender
Age
Educationallevel
Monthlyhousehold
income
82
7. Discussion and conclusions
7.1 Discussion
In this study, the research questions regarding how consumers’ perceptions of children’s
furniture are influenced by socio-demographics, product attributes and supplier attributes
were investigated respectively. The final results represent similarities as well as differences
with some of the previous research. By answering the first question regarding the socio-
demographic factors affecting Chinese consumers’ choices of children’s furniture, no strong
correlations were detected between respondents’ socio-demographics and their attitudes
towards children’s furniture. In terms of gender and age, females and older respondents
tended to be more economically than males and younger people. However, females stated
that they were more willing to buy furniture for their children with higher price, implying
that they could accept more expensive product if it met their demands for higher quality and
durability. For marital status, single respondents, a minority in this sample, generally
acquired information of children’s furniture through advertisement, while married
respondents preferred to visit furniture stores to gather product information. Nevertheless,
marital status was not considered as an important factor in this study as the main
respondents were made up of married people.
When it comes to the importance of the educational level, previous research point out
consumers with higher educational level and higher income generally rely on more
information channels when purchasing furniture (Karki, 2000). However, the results of this
study indicate no significant differences between respondents’ selection of information
channels and these two socio-demographic aspects (education and income). Respondents
with higher educational level showed less interest in printed professional magazines than
the Internet. In terms of consumers’ stated WTP, the results show a positive relationship
between the educational level and respondents’ WTP premiums for environmentally friendly
children’s furniture, which is similar to the finding by Youn and Kim (2008) that higher
educated groups are more supportive of companies’ CSR practices.
83
The results also imply that family members influenced consumers’ decisions heavily in
purchasing children’s furniture, particularly their spouse’s suggestion, which is in consistency
with the findings by a consumer study (Consumer survey report on children’s furniture,
2010), showing that the majority of the parents tended to make purchasing decisions by
themselves. In addition, social media was also an increasingly effective tool for consumers to
acquire information and product recommendations.
Apart from furniture stores, the Internet searching was the second most popular channel for
consumers to choose children’s furniture, which confirms the fact that the furniture industry
has been striding forward to the B2B e-commerce market along with the fast development
of the high-tech information industry (ITC/ITTO, 2005). Numerous furniture producers,
purchasers, salesmen and retailers in China have already started trading on the Internet, but
there is a long way to go since certain amount of consumers do not trust virtual
environment of transaction. It seems to be more practical and efficient for companies to first
build the brand image for the sake of enhancing brand loyalty in consumers and then use
the Internet as an extra supplier chain channel that aims to provide convenience and expand
the market.
For the culture influence, China is a strong collectivist country, thus Chinese consumers are
vulnerable to the influence of their reference groups. Moreover, China has a long-term
orientation culture that is reflected from the longer time span of years (average 3 to 5 years
in this sample) when consumers would like to change children’s furniture. As one potential
element of sub-culture, regional difference was investigated in two cities. More respondents
in Shanghai were found to choose solid wood as the most preferred material for children’s
furniture, and they were more willing to accept higher price and pay higher premiums for
environmental friendliness. From the economic perspective, they also have higher monthly
household income based on the survey. However, the reality is that the average income
levels in these two cities are fairly similar, even the per capita disposable income in
Shenzhen was slightly higher and growing faster than Shanghai in 2012 (Shanghai Bureau of
Statistics, 2013; Shenzhen Bureau of Statistics, 2013). Furthermore, although there were
signs of lower product-level brand awareness in Shenzhen, consumers in this location
showed much more interest to select children’s furniture in well-known brand furniture
84
stores. Due to high similarity between the data from Shanghai and the data from Shenzhen,
the overall results were given at the level of total sample collected in two cities.
Concerning the second question regarding the importance Chinese consumers perceive of
different product and supplier attributes of children’s furniture, several analysis methods
were applied. Based on the results of factor analysis, a four-factor solution was detected,
among which Factor 1 (supplier dimension) was the strongest, indicating that supplier
attributes such as brand, production technique, location of the store and reputation of
producer were considered to be the most important factors to consumers. Nevertheless, the
mean scores of environmental characteristics such as safety, environmental friendliness and
use of natural material were relatively higher when evaluating respondents’ importance-
ranking of individual attributes of children’s furniture. Such inconsistency occurs mainly due
to the selection of variables used in factor analysis as 13 factors rather than 16 factors were
finally determined in order to receive the most appropriate solution based on the statistical
goodness in factor analysis.
Moreover, results imply only few significant differences between factor score values from
four-factor solutions and respondents’ background. Respondents with lower income were
more concerned about basic product attributes such as price and quality, and they were
more price sensitive when purchasing children’s furniture. Additionally, married respondents
took more concern to the raw material dimension that is closely associated with product’s
environmental and social attributes, and consistently those who cared more about raw
material were more willing to pay premiums for environmentally friendly children’s
furniture.
As a crucial signal of product acceptability and true buying intention, respondents’ attitude
towards price was particularly examined. Lower-medium levels of price (3,000-5,000 RMB
and 5,000-10,000 RMB) were especially favored by consumers, which is in congruency with
the finding by Zhang et al. (2002) that consumers in developing nations consider price to be
more important than other product attributes. However, although solid wood was regarded
as the most preferred material by respondents, their price expectations on solid wood
children’s furniture were below the current market levels. Take Sampo and Comagic as
85
examples, the price of a set of children’s furniture made of solid wood is at least 10,000
RMB, but respondents’ preferred price focused on 5,000-10,000 RMB and even below. For
the brand awareness, only a small proportion of the respondents presented attentiveness to
domestic brands and some of them even did not have the impression of brand names.
Furthermore, a negative correlation occurs between respondents’ importance-ranking of
reasonable price and their WTP since the less important consumers perceived the price, the
higher premiums (more than the average preferred premium range 6-10%) they chose.
Based on the results of factor analysis using Factors 1 to 4, cluster analysis was conducted to
detect if there exist consumer segments. A four-group clustering solution was determined,
among which a so-called “Fastidious group” was found to be the dominant cluster. This
indicates that Chinese consumers request strict standards of children’s furniture. All the
attributes consisting of supplier, product and raw material were considered to be the
important criteria for this group to make purchasing decisions. Such group was dominated
by females, with age between 31 and 40 years old, with university undergraduate
educational level and monthly household income between 10,000 and 20,000 RMB. Further
analysis was also executed among other variables. It is also evident that “Unconcerned
group” showed lower WTP for environmentally friendly children’s furniture than other three
groups.
With regard to the third question concerning “What attributes make children’s furniture
environmentally friendly from the perspective of Chinese consumers”, scentless and non-
poisonous aspects of material were found to be extremely important when respondents
considered environmentally friendly children’s furniture. Apart from that, environmental
certification, use of natural material and legal origin of wood were also found to be crucial
elements and indicators of the environmentally friendly product by respondents. In previous
research, the use of child labor has been found as the most important ethical feature in
purchase probabilities (see e.g., Auger et al., 2003). However, in this study, respondents
represented relatively lower awareness of this issue as an important element of the
environmentally friendly product.
One of the major issues in marketing certified environmentally friendly timber products to
86
consumers is their stated or revealed WTP price premiums (Jensen et al., 2004). Compared
to previous years, as Gale (2006) indicates that consumers in Asian countries including China
show less interest in certified timber products, which is partly because they cannot afford
premiums with their limited income (Van Kempen et al., 2009). However, according to
several other studies, the awareness of choosing ethical products and the understanding of
companies’ CSR issues have been emphasized also in emerging countries (Auger et al., 2003;
Berry and McEachern, 2005, Ramasamy andYeund, 2009). Our results demonstrate that 98%
of Chinese consumers stated positive value for WTP premiums for children’s furniture that
was made of environmentally friendly materials. Most of them would like to pay 6-10%
more and some of them even considered it was worthwhile to cost 50% more if the product
was environmentally friendly and under the sustainable management. However, the true
WTP value is not easily captured by directly asking consumers’ WTP, and the ratio of
respondents with a positive WTP is likely to be highly inflated in this data. Compared to the
finding by Cha et al. (2009), the proportion of consumers in South Korea express their WTP
more for certified wood products is less than 80%.
Since the choice of environmentally friendly products is closely connected with consumers’
lifestyle, their attitudes towards general lifestyle statements were also examined. Most
respondents presented positive attitudes towards the healthy and sustainable lifestyle and
considered the use of the environmentally friendly product to be important for children’s
healthy growth. They also indicated to be willing to pay premiums for such products. Based
on the respondents’ socio-demographics, those who were females, with married status and
higher educational level expressed strong agreement with the sustainable lifestyle
statements. This offers opportunities for developing LOHAS market in China.
7.2 Conclusions
China’s furniture industry has gone through a high-speed growth and development over the
past years. Along with the economic growth and consumers’ rising disposable income as
well as the evolution in increasing urbanization and changing lifestyles, the furniture
industry is expected to provide tremendous potential in the market. This also creates
87
opportunities for the children’s furniture sector as parents have increasingly been concerned
about their children’s healthy growth. Meanwhile, the Chinese government has also taken
some initiatives and implemented a standard in August 2012 to ensure the improved
product safety and high quality of products in order to promote the healthy development of
the children’s furniture segment.
Nevertheless, challenges coexist with opportunities. As wood is the dominant material for
furniture manufacturing, the huge demand of products makes domestic children’s furniture
producers rely heavily on the import of raw materials. Other competitive threats come from
the rising costs, a lack of design originality and well-known domestic brands as well as
pressures from foreign large scale retailers and emerging competitors.
However, it can be concluded that the Chinese children’s furniture segment still presents a
tremendous high-end market potential due to its current and emerging demand. According
to the results, more than 20% of the respondents stated that their children did not have own
room and 22% of them did not have children’s furniture. Besides, the majority of the
respondents (54.8%) said that they were likely to buy children’s furniture when their
children were between 3 and 7 years old (see Appendix III, Figure A1), which is in congruent
with one survey report in 2010 that parents with children between 3 and 10 years of age
were most likely to be concerned about children’s furniture and they were regarded as the
main consumers of children’s furniture (Consumer survey report on children’s furniture,
2010). The fact is that the population in this age group is accelerating each year. In addition,
the critical time to change children’s furniture focuses on age between 3 and 5 years (34.8%)
and even more years between 5 and 10 years (30.4%) (see Appendix III, Figure A2). This
indicates that consumers were not willing to change children’s furniture too frequently but
also reflects that they preferred to choose products with high quality, durability and
recyclability.
As the focus of marketing effort, final consumers are the key target. An open-minded
consumer-oriented approach is necessary in order to identify and serve the target market.
For the sake of exploring consumers’ perceptions of children’s furniture, the impacts of their
socio-demographics, and their attitudes towards product, supplier and environmental
88
attributes have been identified in this study. In order to satisfy consumers’ changing and
advanced requirements, it is imperative for enterprises to take innovative steps to promote
Chinese children’s furniture industry in a transition from the original equipment
manufacturers (OEM) to the original design manufacturers (ODM), further to the original
brand manufacturers (OBM) (Kaplinsky et al., 2003). Brand trust building is a good option to
acquire consumers’ commitment and loyalty, which in turn can increase their price
tolerance (Delgado-Ballester and Munuera-Aléman, 2001). It is also necessary to build a
company image that emphasizes being environmentally and socially responsible corporate
citizen since health-safe and environmental friendliness were underlined by consumers in
this study. Along with the available distribution network, consumers are gradually opting for
online sales channels such as social media, which proposes task for companies to take
advantages of network as a strategic tool for both marketing and consumer service
management.
Interestingly, based on the results of the study, the development of LOHAS market as well as
market for green consumers seems possible in China. Even though more affluent and
developed countries may continue to be major markets for certified timber products, there
is a scant evidence to show that such products have no potential in a developing country
like China. Especially at present, environmental aspects such as safety and use of raw
materials have been not only attracted particular attention by children’s furniture
manufacturers but also accentuated by parents. The corresponding standards should also
be improved to provide a more fairly competitive environment and maintain the healthy
development of the children’s furniture market in China.
7.3 Limitations in the present study and recommendations
for further research
As no previous studies concerning the analysis of consumer behavior in the Chinese
children’s furniture market segment exist, there is a lack of knowledge of consumer
perceptions of environmental attributes of furniture in China. Therefore, it motivates the
conduction of this study, however, there are some limitations in the present study. For one
89
thing, the sample of respondents selected in two cities does not represent the population of
China, but potentially provides a good subset of the middle income urban group. For
another, based on the final set of data, the majority of the respondents were dominated by
particular groups such as females and company employees, which brings difficulties in
obtaining satisfactory results by comparing respondents’ perceptions of children’s furniture
in terms of their socio-demographic characteristics.
Concerning the statistical aspect, the reliability of the factor analysis was measured by
Cronbach’s alpha at the minimum level of 0.5. However, the alpha value of Factor 4 (related
to the raw material dimension) was less than 0.5, which might reduce the reliability and
accuracy of the analysis. This was mainly due to the fact that the inter-item correlation of
Factor 4 (total correlations of both natural material and safety were lower than 0.3) was not
enough to ensure the value of the reliability coefficient.
In addition, there is a high possibility that consumers’ stated intentions may differ from their
actual actions in the real market. For instance, consumers expressed preference for solid
wood as raw material for children’s furniture but their price expectation was relatively
lower. Besides, consumers stated that they were willing to pay more for environmentally
friendly products, but whether they will behave in such manner is still doubtful because
their purchase of product in the case of children’s furniture will also be influenced by other
product attributes and their economic situation. Nevertheless, there still exists a potential
for developing such high-end niche market in developing countries like China.
Further research of Chinese consumers’ actual behavior in the market is necessary. It is also
possible to further extend the sample to include other regions such as cities in northern part
of China to ensure more diversified and broad range of consumers. Moreover, as consumers
normally have difficulties in precisely evaluating the most influential feature of the product,
some other analysis methods, such as conjoint analysis or choice experiment modeling can
be applied in the future to determine the importance of specific product attributes from the
perspective of consumers and assist them to evaluate trade-offs between attributes (see
e.g., Barrio and Loureiro, 2010 (b); Cai and Aguilar, 2013).
90
References
Aguilar, F.X. and Vlosky, R.P., 2007. Consumer willingness to pay price premiums for
environmentally certified wood products in the U.S. Forest Policy and Economics 9(2007):
1100-1112.
Ainoa, J., Kaskela, A., Lahti, L., Saarikoski, N., Sivunen, A., Storgårds, J., and Zhang, H., 2009.
Future of Living. In Neuvo, Y., and Ylönen, S. (eds.). Helsinki University of Technology (TKK),
MIDE, Helsinki University Print, Helsinki, Finland, 174-204. ISBN 978-952-248-078-1.
American Society for Quality Control, 1978. Quality Systems Terminology. ANSI/ASQC A3-
1978. Milwaukee, WI.
Ann, M. F., 2008. The digital consumer valuable partner for product development and
production. Cloth. Textiles Res. J., 26 (2): 177-190.
Anthony, D., 2011, Statistics for Health, Life and Social Sciences. Ventus Publishing ApS ISBN:
978-87-7681-740-4, 1st edition. Available at:
http://bookboon.com/en/textbooks/statistics/statistics-for-health-life-and-social-sciences
[Cited 05.3.2013]
Asia home, 2012. Available at: http://www.asia-home.com.cn/zhuanti/2012-02-23/ (in
Chinese) [Cited 22.3.2013]
Auger, P., Devinney, T. M. and Louviere, J. J., 2003. What Will Consumers Pay for Social
Product Features. Journal of Business Ethics 42(3), 281–304.
Axsen, J., TyreeHageman J., and Lentz A., 2012. Lifestyle practices and pro-environmental
technology. Ecological Economics 82 (2012): 64-74
91
Baicha, 2010. Available at: http://www.baicha.me/socks-bedside-tables.html [Cited
11.04.2013]
Barrio, M. and Loureiro, M.L., 2010 (a). A meta-analysis of contingent valuation forest
studies. Ecological Economics 69 (5), 1023–1030.
Barrio, M. and Loureiro, M.L., 2010 (b). The Impact of Protest Responses in Choice
Experiments. FEEM Working Paper No. 133.2010.
Beckmann, S. (2007). Consumers and Corporate Social Responsibility. Australasia Marketing
Journal, 15(1), 27-36.
Belch, G.E. and Belch, M.A., 2007, Advertising and Promotion: An Integrated Marketing
Communication Perspective. New York: McGraw-Hill/Irwin 7th Edition
Belch, M. A. and Willis, L. A., 2001. Family Decision at the Turn of the Century: Has the
Changing Structure of Households Impacted the Family Decision-Making Process? Journal of
Consumer Behavior, Vol. 2 Issue 2, pp. 111-124
Berry, H. and McEachern, M.G., 2005. Informing Ethical Consumers, in the Ethical
Consumers, ed. R. Harrison, T. Newholm, and D. Shaw (Sage Publications, London), 69-87.
Bhattacharya, C. B. and Sen, S., 2004. Doing Better at Doing Good: When, Why, and How
Consumers Respond to Corporate Social Initiatives. California Management Review, 47(1), 9-
24.
Bolton, R. N. andDrew, J. H., 1991. A Multistage Model of Customers’ Assessments of
Service Quality and Value. Journal of Consumer Research 17 (4): 375–84.
92
Brucks, M., Zeithaml, V. and Naylor, G., 2000. Price and brand name as indicators of quality
dimensions for consumer durables. Journal of the Academy of Marketing Science 28(3): 359-
374.
Cai, Z. and Aguilar, F. X., 2013. Meta-analysis of consumer’s willingness-to-pay premiums for
certified wood products. Journal of Forest Economics, 19: 15-31.
Cao, X. Z., Hansen, E. N., Xu, M. Q. and Xu, B., 2004. China’s furniture industry today. Forest
Prod. J. 54(11):14–23.
Carrigan, M., Szmigin, I. and Wright, J., 2004. Shopping for a Better World? An Interpretive
Study of the Potential for Ethical Consumption Within the Older Market. Journal of
Consumer Marketing 21(6), 401– 417.
CFCC, 2013. Available at: http://www.cfcs.org.cn [Cited 4.5.2013]
Cha, J., Chun, J.N. and Youn, Y.C., 2009. Consumer willingness to pay price premium for
certified wood products in South Korea. Journal of Korean Forest Society. Vol. 98, No. 2, pp.
203-211.
Chang, T.-Z. and Wildt, A.R., 1994. Price, Product Information, and Purchase Intention: An
Empirical Study. Academy of Marketing Science Journal 22(1): 16–27.
Children’s furniture highlights, 2013. Available at:
http://www.szfa.com/news/201304/11/9835.html (In Chinese) [4.5.2013]
China Statistical Yearbook, 2012. Available at:
http://www.stats.gov.cn/tjsj/ndsj/2012/indexeh.htm [Cited 12.3.2013]
Chinese furniture web, 2012. Available at:
http://www.szfa.com/news/201204/01/4995.html (In Chinese) [Cited 3.5.2013]
93
Chiu, C., Ip, C. and Silverman, A., 2012. Understanding social media in China. McKinsey
Quarterly. Available at:
http://www.mckinsey.com/insights/marketing_sales/understanding_social_media_in_china
[Cited 9.5.2013]
CNFA (China National Furniture Association), 2004. China Furniture Association
Annual Report, 2004. CNFA, Beijing, China. 120 pp. (in Chinese)
CNFA (China National Furniture Association), 2011. CNFA home page. (In Chinese)
Available at: http://www.cnfa.com.cn/index.html [Cited 15.1.2013]
Comagic, 2013. Available at: http://www.comagic.com.cn/ [Cited 11.04.2013]
Comparison between four well-known solid wood children’s furniture brands, 2011.
Available at: http://wenku.baidu.com/view/f40576ff700abb68a982fb0e.html (In Chinese)
[Cited 2.5.2013]
Consumer buying behavior, 2013. Available at:
http://www.sykronix.com/tsoc/courses/sales/sls_cons.htm [Cited 15.2.2013]
Consumer survey report on children’s furniture, 2010. Available at:
http://wenku.baidu.com/view/f633514d2b160b4e767fcf68.html [Cited 21.4.2013]
Cronin, J.J., Jr., Brady, M.K. and Hult, G.T.M., 2000. Assessing the Effects of Quality, Value,
and Customer Satisfaction on Consumer Behavioral Intentions in Service Environments.
Journal of Retailing 76(2): 193–218.
CSIL, 2012. China furniture outlook. Available at:
http://www.csilmilano.com/CSILpdf/CSIL_Market-Research.pdf [Cited 20.2.2013]
Current situation of children’s furniture in China, 2011. Available at:
http://www.jiatx.com/bbs/pinpai/jc1234~-1~1637/57247952_57247952.htm (in Chinese)
94
[Cited 10.3.2013]
Delgado-Ballester, E. and Munuera-Aléman, J.L., 2001. Brand trust in the context of
consumer loyalty. European Journal of Marketing 35, 1238– 1258.
Desai, K.K. and Keller, K. L., 2002. The effects of ingredient branding strategies on host brand
extendibility. Journal of Marketing, Vol .66, Iss. 1, pp.73-93
Diamantopoulos, A., Schlegelmilch B., Sinkovics, R. and Bohlenc, G., 2003. Can socio-
demographics still play a role in profiling green consumers? A review of the evidence and an
empirical investigation. Journal of Business Research 56:465–480.
Dodoo, J., 2007. Practical Approach Towards Buying Behavior, Atlantic International
University Hawaii, September 2007.
Ellen, P. S., Webb, D. J. and Mohr, L. A., 2006. Building Corporate Associations: Consumer
Attributions for Corporate Socially Responsible Programs. Academy of Marketing Science
34(2), 147–157.
Engel, J.F., Blackwell, R. D. and Miniard, P. W., 1995, Consumer Behavior. Orlando: The
Dryden Press.
Environmental influences on consumer behavior, 2010. Available at:
http://www.scribd.com/doc/26555813/Environment-Influence-on-consumer-behaviour
[Cited 10.2.2013]
Ernst and Young, 2007. Available at:
http://www2.eycom.ch/publications/items/2008_lohas/2008_ey_LOHAS_e.pdf
[Cited 27.22013]
EUNIC (European Union National Institutes for Culture), 2011. Orientation for cultural
95
cooperation between China and Europe. Goethe-Institut. ISBN: 978-3-939670-59-9
Fennis, B. M. and Pruyn, T. H., 2006. You are what you wear: Brand personality influences on
consumer impression formation. Journal of Business Research, 60: 634-639.
Fishbein, M., 1963. An investigation of the relationships between beliefs about an object
and the attitude towards that object. Hum. Relat. 16: 233–240
FLEXA, 2013. Available at: http://www.flexa.dk/English/System.aspx [Cited 10.04.2013]
Franz R. E., Tobias L., Bernd H. S. and Patrick G., 2006. Are brands forever? How brand
knowledge and relationships affect current and future purchases. J. Prod. Brand Manage., 15
(2):98-105.
FSC, 2013. Available at: http://www.fsc.org [Cited 4.5.2013]
Future prospects of children’s furniture, 2012. Available at:
http://wenku.baidu.com/view/b7933ec2bb4cf7ec4afed0a2.html (in Chinese) [Cited
21.3.2013]
Gale, F., 2006. The political economy of sustainable development: lessons the Forest
Stewardship Council experience. In Proceedings of the Second Oceanic Conference on
International Studies (p. EJ17). Melbourne, Australia.
Garvin, D.A., 1984. What does “product quality” really mean? Sloan Management Review.
26(1):25-43.
Garvin, D. A., 1987. “Competing on the Eight Dimensions of Quality.” Harvard Business
Review 65 (November-December): 101-109
Go-Globe, 2013. Social media in China: statistics and trends. Available at:
http://www.go-globe.com/blog/social-media-china/ [Cited 9.5.2013]
96
Grant, R., Clarke, R. J., and Kyriazis, E., 2010. Research Needs for Assessing Online Value
Creation in Complex Consumer Purchase Process Behavior. Journal of Retailing and
Consumer Services, Vol. 17 Issue 1, pp.53-60
Green, T. and Peloza, J. 2011. How does corporate social responsibility create value for
consumers? Journal of Consumer Marketing 28(1):48-56.
Hair, J. F., Anderson, R. E., Tatham, R. L. and Black, W. C., 1998. Multivariate data analysis.
5th Edition. 730p.
Hansmann, R., Koellner, T. and Scholz, R. W., 2006. Influence of consumers’ socioecological
and economic orientations on preferences for wood products with sustainability labels.
Forest Policy and Economics, 8: 239-250.
Harcar, T., Spillan, J. E., and Kucukemiroglu, O., 2005. A Multi-National Study of Family
Decision-Making. Multinational Business Review, Vol. 13 No. 2, pp. 3-21
Hassan, Y., Muhammad, N. M. N. and Bakar, H. A., 2010. Influence of shopping orientation
and store image on patronage of furniture store. International Journal of Marketing Studies.
Vol. 2, No. 1: 175-184.
Hawkins, D.I., Best, R.J. and Coney, K.A., 2001, Consumer behavior: Building Marketing
Strategy. New York: McGraw-Hill/Irwin 9th Edition
Hofstede, G., Hofstede, G. J. and Minkov, M., 2010. Cultures and organizations: Software of
the mind. McGraw-Hill, 3rd Edition. 576 p.
Holbrook, M.B., 1999. Introduction to Consumer Value. In M.B. Holbrook (ed.) Consumer
Value. A Framework for Analysis and Research, pp. 1–28. London: Routledge.
House Hebei, 2012. Available at:
97
http://house.hebei.com.cn/system/2012/02/08/011705993_01.shtml [Cited 11.04.2013]
Hunter, S. L., and Li, G., 2007. Market competition forces: A study of the Chinese case goods
furniture industry. Forest Products Journal, 57(11), 21-26.
Italy Trade Commission, 2011. Furniture market in China. Available at:
http://www.ice.it [Cited 16.1.2013]
ITC/ITTO, 2005. International wooden furniture market: A review. Geneva ISBN 92-9137-284-
6
Jensen, K. L., Jakus, P. M., English, B. C., and Menard, J., 2004. Consumers’ willingness to pay
for eco-certified wood products. Journal of Agricultural and Applied Economics, 36(3), 617-
626.
Jung, J. and Shen, D., 2011. Brand equity of luxury fashion brands among Chinese and U.S.
young female consumers. Journal of East-West Business, 17: 48-69.
Kaplinsky, R., Memedovic, O., Morris, M. and Readman, J., 2003. The global wood furniture
value chain: what prospects for upgrading by developing countries, the case of South Africa.
United Nations Industrial Development Organization, Vienna, 33.
Karki, T., 2000. Species, Furniture type and market factors influencing furniture sales in
Southern Germany. Forest Products Journal, 50:85-90
Kaul, A. and Rao, V. R., 1995. Research for product positioning and design decisions: An
integrative review. International Journal of Research in Marketing 12(4): 293-320.
Keller, K. L., 2002. Branding and brand equity. Bart Weitz and Robin Wensley, eds. Handbook
of Marketing, Sage Publications, London, 151-178.
Kerin, R.A., Jain, A. and Howard, D.J., 1992. Store Shopping Experience and Consumer Price–
98
Quality–Value Perceptions. Journal of Retailing 68(4): 376–97
Kinner, T.C., Taylor, J.R. and Ahmed, S.A., 1974. Ecologically concerned consumers: Who are
they? Journal of Marketing, 11: 20-24.
Kirchler, E., Fischer, F. and Hölzl, E., 2010. Price and its Relation to Objective and Subjective
Product Quality: Evidence from the Austrian Market. Journal of Consumer Policy. On-line
publication. 12 p.
Kotler, P., 2000, Marketing Management. New Delhi, Prentice-Hall of India 10th Edition
Kotler, P. and Keller, K.L., 2005. Marketing Management. Twelfth Edition. Pearson Education
Inc. 729 p.
Lancaster, K. 1966. A new approach to consumer theory. J. Polit. Econ. 74: 132–156.
Laroche, M., J. Bergero and G. Barbarot-Forleo., 2001. Targeting consumers who are willing
to pay more for environmentally friendly products. J. Consumer Market 18: 503-520.
Levitt, T., 1980. Marketing success through differentiation – of anything. Harvard Business
Review. 58(1):83-91.
Levitt, T., 1981. Marketing intangible products and product intangibles. Harvard Business
Review. 59(3):94-102.
Li C. F., Tsai H. T. and Fu C. S., 2006. A logic deduction of expanded means-end chains. J.
inform. Sci, 32(1): 5-16
Li, N. and Toppinen, A., 2011. Corporate responsibility and sustainable competitive
advantage in forest-based industry: Complementary or conflicting goals? Forest Policy and
Economics, 13 (2011): 113-123.
Lindman, M., Scozzi, B. and Otero-Neira, C., 2008. Low-tech, small- and medium-sized
enterprises and the practice of new product development: An international comparison.
99
European Business Review, 20 (1) (2008), pp. 51-72
Luo D. Y., 2012. Market research of furniture design – the children’s furniture as a case study.
China Business and Trade, 30 (2012), pp.24-25 (in Chinese)
Maignan, I. and Ralston, D. A., 2002. Corporate Social Responsibility in Europe and the U.S.:
Insights from Businesses’ Self-Presentations. Journal of International Business Studies 33(3),
497–514.
Maslow, A. H., 1943. A theory of human motivation. Psychological review, 50, 370-396.
Merry, F. D., and Carter, D. R. (1997). Certified wood products in the US: implications for
tropical deforestation. Forest Ecology and Management, 92(1-3), 221-228.
Metsämuuronen, J., 2012. Handbook of Basics of Research Methods in Human Sciences.
(5th Ed.) Researchers’ edition. Oy International Methelp Ltd.
Miron, D., Petcu, M. and Sobolevschi, I. M., 2011. Corporate social responsibility and the
sustainable competitive advantage. The Amfiteatru Economic. Vol. 13 (29): 162-179.
Mizik, N. and Jacobson, R., 2003. Trading Off between Value Creation and Value
Appropriation: The Financial Implications of Shifts in Strategic Emphasis. Journal of
Marketing 67(1): 63–76.
Mohamed, S. and Ibrahim, M.L., 2007. Preliminary Study on Willingness to Pay for
Environmentally Certified Wood Products Among Consumers in Malaysia. J. of Applied
Sciences 7(9): 1339-1342.
Mohanty, B., Scherfler, M. and Devatha, V., 2012. Lifestyle Choices and Societal Behavior
Changes as Local Climate Strategy. ADBI Working Paper 398. Tokyo: Asian Development
Bank Institute.
100
Mohr, L. and Webb, D., 2005. The effects of corporate social responsibility and price on
consumer responses. The Journal of Consumer Affairs 39: 146.
NMI (Natural Marketing Institute), 2007. The LOHAS consumer trends report. Available at:
http://andeeknutson.com/studies/LOHAS/General%20Health%20and%20Wellness/11_LOH
AS_Whole_Foods_Version.pdf [Cited 6.5.2013]
New standard for children’s furniture, 2012. Available at:
http://english.cri.cn/7146/2012/08/01/2702s714635.htm [Cited 10.3.2013]
Nyrud, A.Q. and Roos, A. and Rodbotten, M., 2008. Product attributs affecting consumer
preference for residential deck materials. Canadian Journal of Forest Research
38(2008):1385-1396.
Oliver, R.L., 1999. Value as Excellence in the Consumption Experience. In M.B. Holbrook (ed.)
Consumer Value. A Framework for Analysis and Research, pp. 43–62. London: Routledge.
Overby, J.W., Woodruff, R.B. and Gardial, S.F., 2005. The Influence of Culture Upon
Consumers’ Desired Value Perceptions: A Research Agenda. Marketing Theory 5(2): 139–63.
Ozanne, L.K. and Vlosky R.P., 1997. Willingness to pay for environmentally certified wood
products: A consumer perspective. Forest Prod. J. 47(6): 39-47.
Ozkan-Tektas, O. and Wilson, D. T., 2010. Stage-Level Value Perceptions of Business
Customers and Affecting Factors: A Conceptual Framework. ISBM Report 02-2010. Institute
for the Study of Business Markets
Pachauri, M. 2001. Consumer behaviour: a literature review. Market. Rev. 2: 319–355
Page, G. and Fearn, H., 2005. Corporate Reputation: What do Consumers Really Care About.
Journal of Advertising Research 45(3), 305–311.
101
Pakarinen, T., 1999. Success factors of wood as a furniture material. For. Prod. J. 49 (9), 79-
85
Parikka-Alhola, K., 2008. Promoting environmentally sound furniture by green public
procurement. Ecological Economics, vol. 68, no. 1, pp. 472-485.
PEFC, 2013. Available at: http://www.pefc.org [Cited 4.5.2013]
Peter J.P. and Olson J.C., 2010, Consumer Behavior and Marketing Strategy. 9th Edition.
Maidenhead/England.
Ramasamy, B. and Yeung, M., 2009. Chinese Consumers’ Perception of Corporate
Social Responsibility (CSR). Journal of Business Ethics 88, 119-132.
Ranta E., Rita, H. and Kouki J., 1999. Biometria, tilastotiedettä ekologeille. 7th edition. p. 1-
463.
Roman, K., Maas, J. and Nisenholtz, M., 2005. How to advertise: What works, what doesn't-
and why. London: Kogan Page.
Roos, A. and Nyrud, A.Q., 2008. Description of green versus environmentally indifferent
consumers of wood products in Scandinavia: flooring and decking. Journal of wood Science
54, 402–407.
Rust, R. T. and Oliver, R. L., 1994. Service quality: insights and managerial implications from
the frontier in Service Quality: New Directions in Theory and Practice, Rust R and Oliver R
(Eds). Thousand Oaks, CA, SAGE Publications, 1-19.
Sampo, 2013. Available at: http://www.sampofurniture.cn/ [Cited 11.04.2013]
Sanchez-Fernandez, R. and Iniesta-Bonillo, M.A., 2007. The concept of perceived value: a
systematic review of the research. Marketing Theory 2007(7): 427-451.
102
Saren, M. and Tzokas, N., 1998. The Nature of the Product in Market Relationships: A Pluri-
Signified Product Concept. Journal of Marketing Management 14(5): 445-464.
Satish, J. and Peter, K., 2004. Customer Response Capability in a Sense-And-Respond Era The
role of customer knowledge process. J. Acad. Mark. Sci., 32 (3): 219-233.
Schiffman, L. G., and Kanuk, L. L., 2004. Consumer Behavior, 8th edition, Pearson Education,
Inc., US
Schiffman, L., Bednall, D., O'Cass, A., Paladino, A., Ward, S. and Kanuk, L., 2008. Consumer
Behavior (4th ed.), Pearson Education Australia, Frenchs Forest
Shanghai Bureau of Statistics, 2013. Available at: http://www.stats-sh.gov.cn/ [Cited
19.5.2013]
Shelly, J.R., 2001. Encyclopedia of Materials: Science and Technology ISBN: 0-08-0431526,
pp. 9658-9663. Available at: http://www.jrreding.com/WoodMaterials.pdf [Cited 25.2.2013]
Shenzhen Bureau of Statistics, 2013. Available at: http://www.sztj.gov.cn/ [Cited 19.5.2013]
Siegel, D. S. and Vitaliano, D. F., 2007. An Empirical Analysis of the Strategic Use of
Corporate Social Responsibility. Journal of Economics and Management Strategy 16(3), 773–
792.
Sinclair, A.S., Hansen, B. and Fern, F., 1993. Industrial forest products quality: An empirical
test of Garvin’s quality dimensions. Wood and Fibre Science 25 (1), 66–76.
SMBQTS (Shanghai Municipal Bureau of Quality and Technical Supervision), 2010. Available
at: http://www.shzj.gov.cn/art/2010/5/31/art_2383_426889.html [Cited 22.3.2013]
Snöj, B., Pisnik, K. and Mumel, D., 2004. The relationship among perceived quality, perceived
risk and perceived product value. Journal of Product and Brand Management. Vol 13(3):156-
103
167.
Solid wood children’s furniture, 2011. Available at:
http://wenku.baidu.com/view/298d7ae49b89680203d82512.html (in Chinese)
[Cited 5.4.2013]
Solomon, M. R., 2004. Consumer Behavior, Buying, Having and Being. Pearson Prentice Hall.
6th Ed.
Solomon, M., Bamossy, G., Askegaard, S. and Hogg, M.K., 2006. Consumer behaviour: A
European perspective. Essex: Pearson Education Limited.
Spiteri, J.M. and Dion, P.A., 2004. Customer Value, Overall Satisfaction, End-User Loyalty,
and Market Performance in Detail Intensive Industries. Industrial Marketing Management
33(8): 675–87.
Spreng, R. A., Dixon, A. L. and Olshavsky, R. W., 1993. The Impact of Perceived Value on
Consumer Satisfaction. Journal of Consumer Satisfaction, Dissatisfaction and Complaining
Behavior 6(1): 50–55.
Sun, X.f., Cheng, N., Canby and Kerstion, 2005. China’s forest product exports: an overview
of trends by segment and destinations. Forest Trends, 4-10
Sweeney, J.C. and Soutar, G.N., 2001. Consumer Perceived Value: The Development of a
Multiple Item Scale. Journal of Retailing 77(2): 203–220.
Tabachnick, B. G. and Fidell, L. S., 2001. Using multivariate statistics (4th Edition). New York:
HarperCollins. Chapter 13.
Tarkkonen, L., 1987. On Reliability of Composite Scales. Statistical Research Reports 7.
Finnish Statistical Society, Helsinki.
104
Teisl, M. E., Peavey, S., Newmann, F., Buono, J. A. and Herrmann, M., 2002. Consumer
reactions to environmental labels for forest products: A preliminary look. Forest Prod. J. 52
(1): 44-50.
The HOFSTEDE centre, 2013. Available at: http://geert-hofstede.com [Cited 7.5.2013]
The sixth population census of China, 2010. Available at:
http://www.stats.gov.cn/tjsj/pcsj/rkpc/6rp/indexch.htm [Cited 10.3.2013]
Toivonen R., 2011. Dimensionality of quality from a customer perspective in the wood
industry. Dissertationes Forestales 114 (9-67).
Toivonen, R. 2012. Product quality and value from the consumer perspective – An
application to woodenproducts. Journal of Forest Economics 18(2): 157-173.
Toivonen R., Järvinen R., Enroth. R-R and Rämö, A-.K., 2008. Environmnetal quality of wood
Products- Preliminary Study about the UK Market. Pellervo Research Institute. Working
papers no 111: 4-41.
Tsiotsou, R., 2005. Perceived Quality Levels and their Relation to Involvement, Satisfaction,
and Purchase Intentions. Marketing Bulletin, 2005, 16, Research Note 4.
United Nation, 2009. The Importance of China’s Forest Products Markets to the UNECE
Region. Geneva Timber and Forest Discussion Paper 57.
Van Houtven, G., Powersb, J. and Pattanayaka, S.K., 2007. Valuing water quality
improvements in the United States using meta-analysis: is the glass half-full or half-empty
for national policy analysis? Resource and Energy Economics 29 (3), 206–228.
Van Kempen, L., Muradin, R., Sandóval, C., and Castañeda, J., 2009. Too poor to be green
consumers? A field experiment on revealed preferences for firewood in Guatamela.
Ecological Economics, 68(7), 2160-2167.
105
Veisten, K. 2007. Willingness to pay for eco-labeled wood furniture: Choice-based conjoint
analysis versus open-ended conjoint valuation. Journal of Forest Economics 13(2007): 29-48.
Wang, Y., Lo, H.P., Chi, R. and Yang, Y., 2004. An Integrated Framework for Customer Value
and Customer-Relationship-Management Performance: A Customer-Based Perspective from
China. Managing Service Quality 14(2–3): 169–82.
X.M.B, 2013. Available at: http://www.xmb.biz/ [Cited 11.04.2013]
Xu, M., 2004. Phoenix in fire -- a few thoughts on the antidumping lawsuit. Everyday
Furniture Web, Beijing. Available at: www.365f.com/hylt/ltnr.asp?name=524 (in Chinese).
[Cited 14.1.2013]
Youn, S. and Kim, H., 2008. Antecedents of Consumer Attitudes Toward Cause-Related
Marketing. Journal of Advertising Research 48(1), 123–137.
Zeithaml, V. A., 1988. Consumer perceptions of price, quality and value: A Means-End Model
and Synthesis of Evidence. Journal of Marketing 52(July):2-22
Zhang, Z., Li, Y., Gong, C. and Wu, H., 2002. Casual wear product attributes: a Chinese
consumers' perspective, Journal of fashion Marketing and Management, 6(1), 53-62.
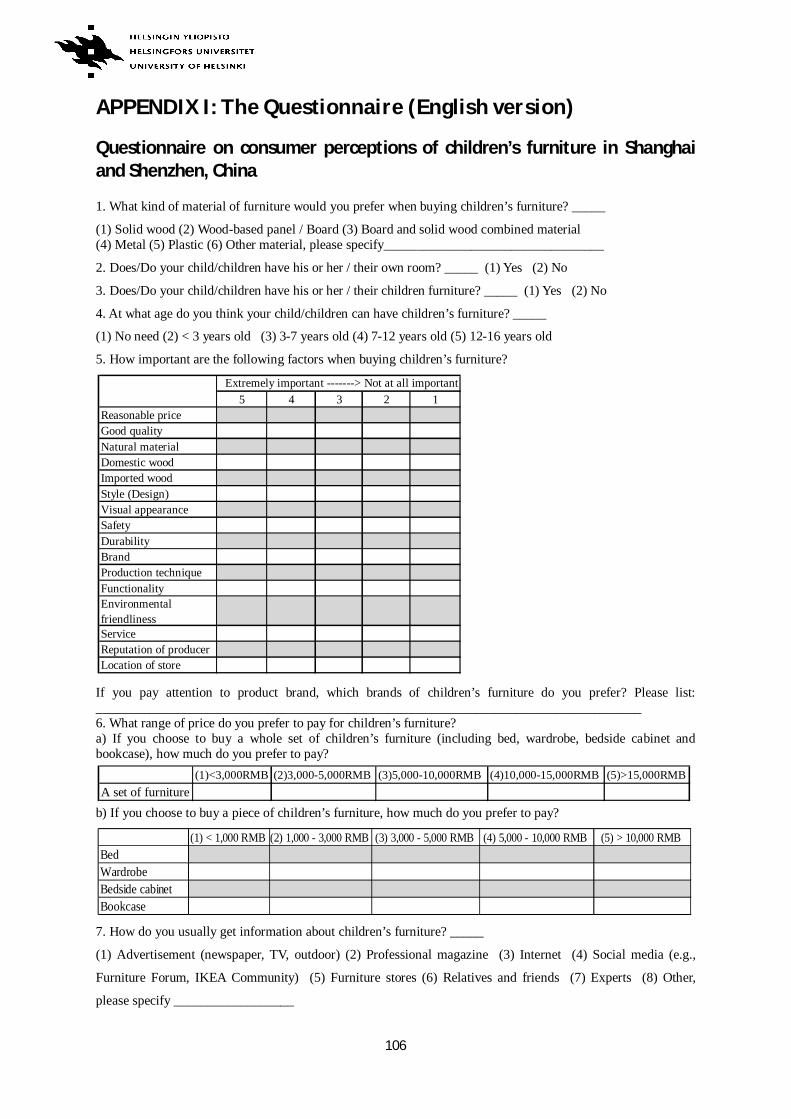
106
APPENDIX I: The Questionnaire (English version)
Questionnaire on consumer perceptions of children’s furniture in Shanghai and Shenzhen, China 1. What kind of material of furniture would you prefer when buying children’s furniture? _____
(1) Solid wood (2) Wood-based panel / Board (3) Board and solid wood combined material (4) Metal (5) Plastic (6) Other material, please specify_________________________________
2. Does/Do your child/children have his or her / their own room? _____ (1) Yes (2) No
3. Does/Do your child/children have his or her / their children furniture? _____ (1) Yes (2) No
4. At what age do you think your child/children can have children’s furniture? _____
(1) No need (2) < 3 years old (3) 3-7 years old (4) 7-12 years old (5) 12-16 years old
5. How important are the following factors when buying children’s furniture?
If you pay attention to product brand, which brands of children’s furniture do you prefer? Please list: __________________________________________________________________________________ 6. What range of price do you prefer to pay for children’s furniture? a) If you choose to buy a whole set of children’s furniture (including bed, wardrobe, bedside cabinet and bookcase), how much do you prefer to pay?
b) If you choose to buy a piece of children’s furniture, how much do you prefer to pay?
7. How do you usually get information about children’s furniture? _____
(1) Advertisement (newspaper, TV, outdoor) (2) Professional magazine (3) Internet (4) Social media (e.g.,
Furniture Forum, IKEA Community) (5) Furniture stores (6) Relatives and friends (7) Experts (8) Other,
please specify __________________
5 4 3 2 1Reasonable price Good qualityNatural materialDomestic woodImported woodStyle (Design)Visual appearanceSafetyDurabilityBrandProduction techniqueFunctionalityEnvironmentalfriendlinessServiceReputation of producerLocation of store
Extremely important -------> Not at all important
(1)<3,000RMB (2)3,000-5,000RMB (3)5,000-10,000RMB (4)10,000-15,000RMB (5)>15,000RMBA set of furniture
(1) < 1,000 RMB (2) 1,000 - 3,000 RMB (3) 3,000 - 5,000 RMB (4) 5,000 - 10,000 RMB (5) > 10,000 RMB BedWardrobeBedside cabinetBookcase
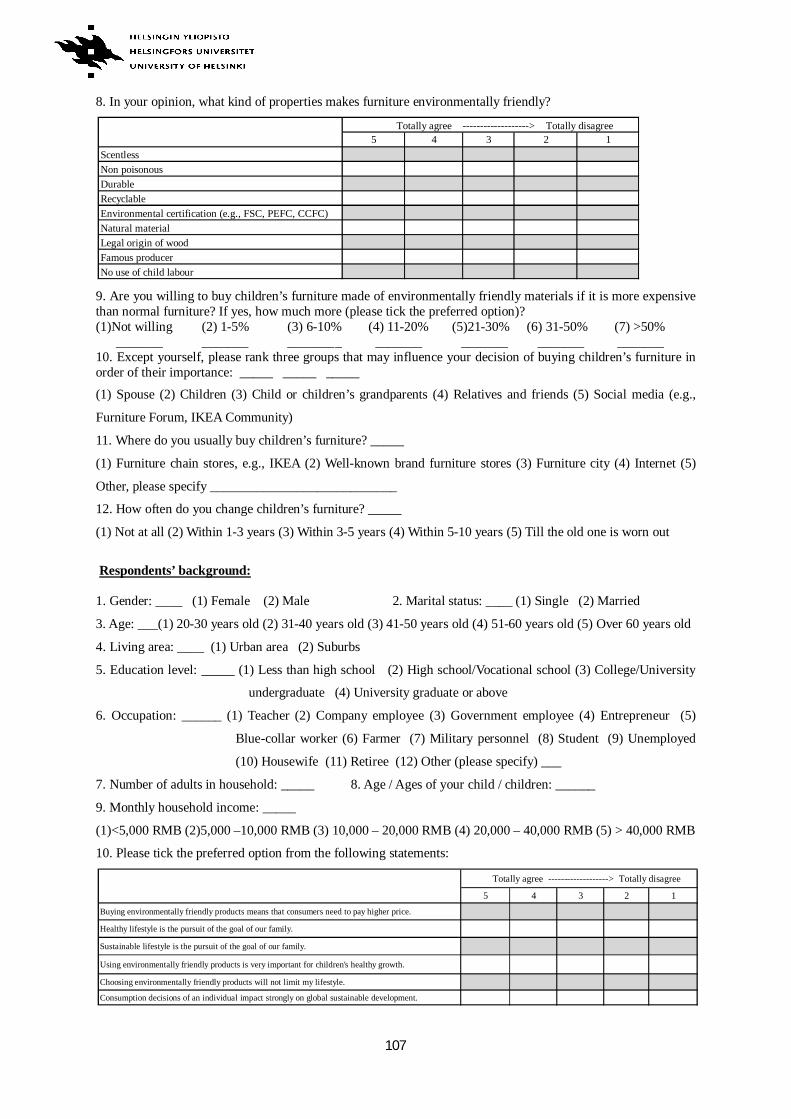
107
8. In your opinion, what kind of properties makes furniture environmentally friendly?
9. Are you willing to buy children’s furniture made of environmentally friendly materials if it is more expensive than normal furniture? If yes, how much more (please tick the preferred option)? (1)Not willing (2) 1-5% (3) 6-10% (4) 11-20% (5)21-30% (6) 31-50% (7) >50%
_______ _______ _______ _ _______ _______ _______ _______ 10. Except yourself, please rank three groups that may influence your decision of buying children’s furniture in order of their importance: _____ _____ _____
(1) Spouse (2) Children (3) Child or children’s grandparents (4) Relatives and friends (5) Social media (e.g.,
Furniture Forum, IKEA Community)
11. Where do you usually buy children’s furniture? _____
(1) Furniture chain stores, e.g., IKEA (2) Well-known brand furniture stores (3) Furniture city (4) Internet (5)
Other, please specify ____________________________
12. How often do you change children’s furniture? _____
(1) Not at all (2) Within 1-3 years (3) Within 3-5 years (4) Within 5-10 years (5) Till the old one is worn out
Respondents’ background: 1. Gender: ____ (1) Female (2) Male 2. Marital status: ____ (1) Single (2) Married
3. Age: ___(1) 20-30 years old (2) 31-40 years old (3) 41-50 years old (4) 51-60 years old (5) Over 60 years old
4. Living area: ____ (1) Urban area (2) Suburbs
5. Education level: _____ (1) Less than high school (2) High school/Vocational school (3) College/University
undergraduate (4) University graduate or above
6. Occupation: ______ (1) Teacher (2) Company employee (3) Government employee (4) Entrepreneur (5)
Blue-collar worker (6) Farmer (7) Military personnel (8) Student (9) Unemployed
(10) Housewife (11) Retiree (12) Other (please specify) ___
7. Number of adults in household: _____ 8. Age / Ages of your child / children: ______
9. Monthly household income: _____
(1)<5,000 RMB (2)5,000 –10,000 RMB (3) 10,000 – 20,000 RMB (4) 20,000 – 40,000 RMB (5) > 40,000 RMB
10. Please tick the preferred option from the following statements:
Totally agree -------------------> Totally disagree5 4 3 2 1
ScentlessNon poisonousDurableRecyclableEnvironmental certification (e.g., FSC, PEFC, CCFC) Natural materialLegal origin of woodFamous producerNo use of child labour
Totally agree -------------------> Totally disagree
5 4 3 2 1Buying environmentally friendly products means that consumers need to pay higher price.
Healthy lifestyle is the pursuit of the goal of our family.
Sustainable lifestyle is the pursuit of the goal of our family.
Using environmentally friendly products is very important for children's healthy growth.
Choosing environmentally friendly products will not limit my lifestyle.
Consumption decisions of an individual impact strongly on global sustainable development.
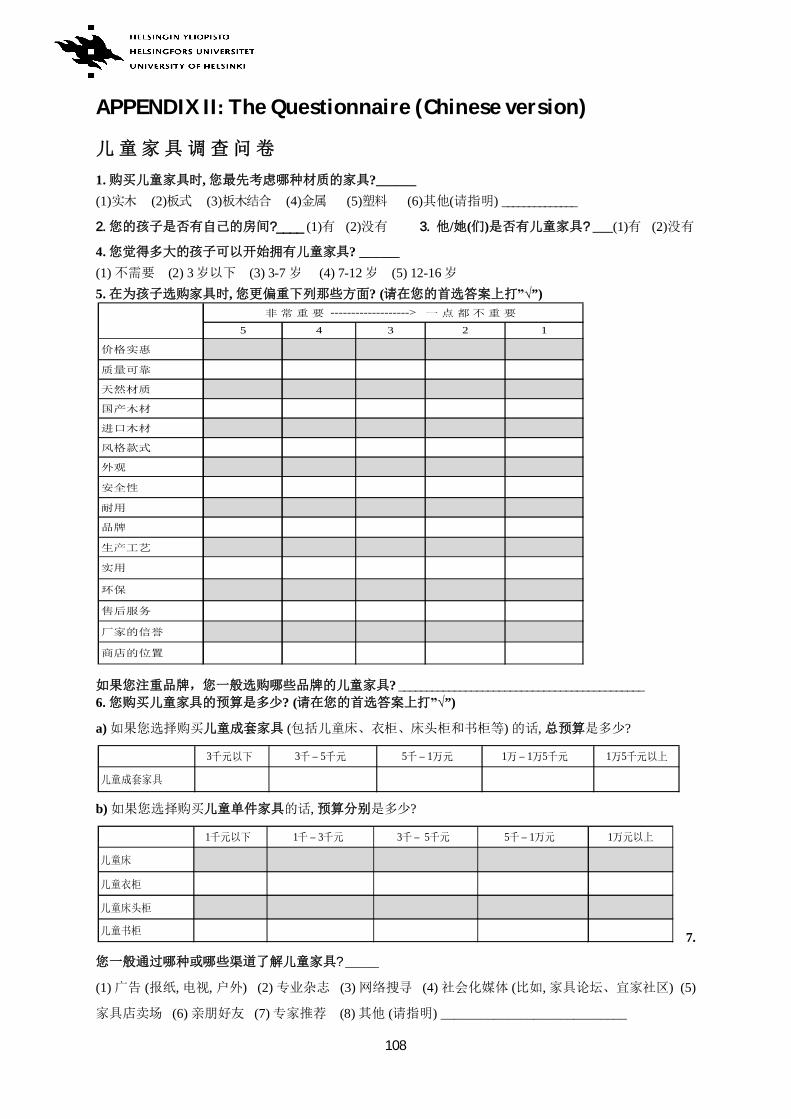
108
APPENDIX II The Questionnaire (Chinese version)
1. , ?______ (1) (2) (3) (4) (5) (6) ( ) ______________
2. ?____ (1) (2) 3. / ( ) ? ___(1) (2)
4. ? ______ (1) (2) 3 (3) 3-7 (4) 7-12 (5) 12-16 5. , ? ( ”)
? ____________________________________________
6. ? ( ”)
a) ( ) , ?
b) , ?
7.
? _____ (1) ( , , ) (2) (3) (4) ( , ) (5)
(6) (7) (8) ( ) ____________________________
------------------->
5 4 3 2 1
3 3 – 5 5 – 1 1 – 1 5 1 5
1 1 – 3 3 – 5 5 – 1 1
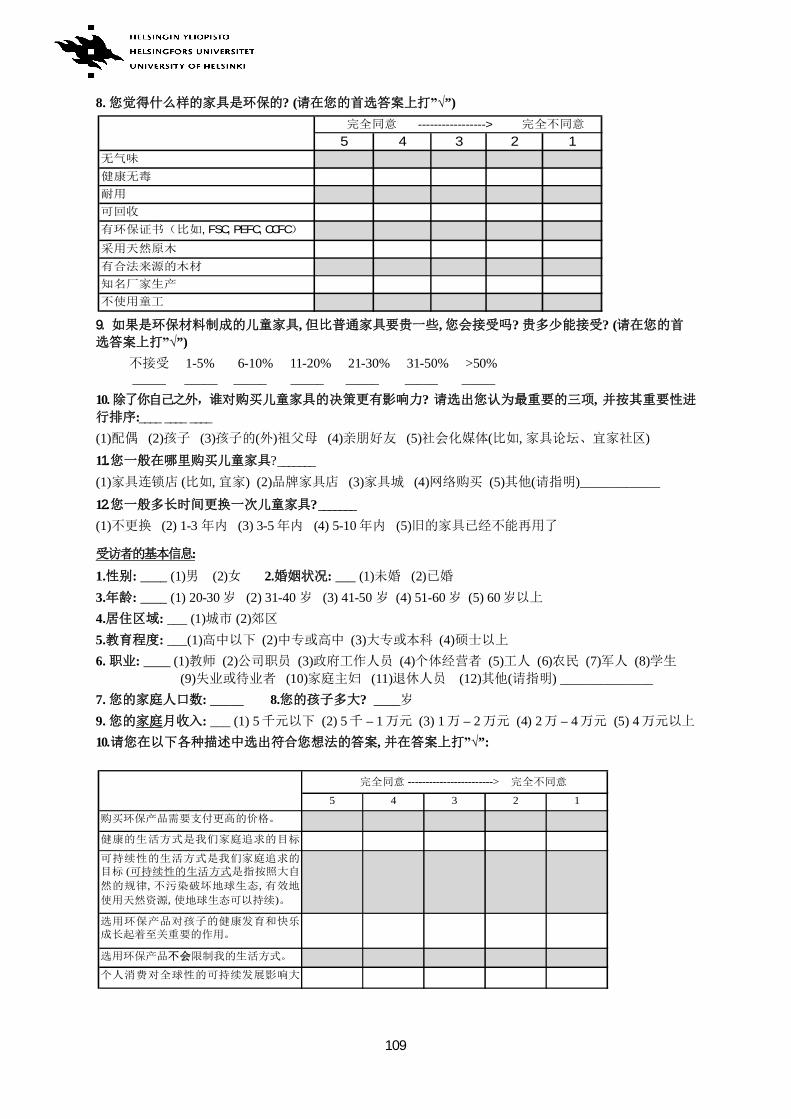
109
8. ? ( ”)
9. , , ? ? (
”) 1-5% 6-10% 11-20% 21-30% 31-50% >50%
_____ _____ _____ _____ _____ _____ _____ 10. ? ,
:____ ____ ____ (1) (2) (3) ( ) (4) (5) ( , )
11. ? _______ (1) ( , ) (2) (3) (4) (5) ( )____________
12. ? _______ (1) (2) 1-3 (3) 3-5 (4) 5-10 (5)
:
1. : ____ (1) (2) 2. : ___ (1) (2) 3. : ____ (1) 20-30 (2) 31-40 (3) 41-50 (4) 51-60 (5) 60 4. : ___ (1) (2) 5. : ___(1) (2) (3) (4)
6. : ____ (1) (2) (3) (4) (5) (6) (7) (8) (9) (10) (11) (12) ( ) ______________
7. : _____ 8. ? ____ 9. : ___ (1) 5 (2) 5 – 1 (3) 1 – 2 (4) 2 – 4 (5) 4 10. , ”:
5 4 3 2 1
,FSC,PEFC,CCFC
----------------->
5 4 3 2 1
(, ,
, )
------------------------>
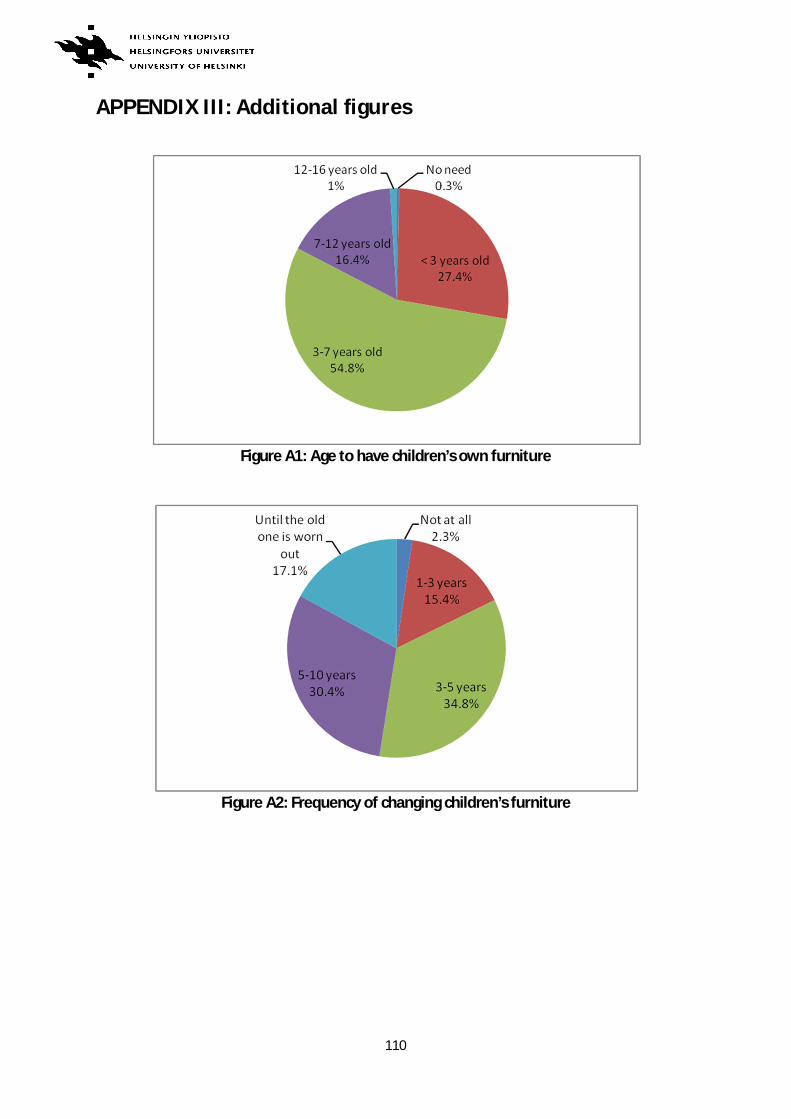
110
APPENDIX III: Additional figures
Figure A1: Age to have children’s own furniture
Figure A2: Frequency of changing children’s furniture
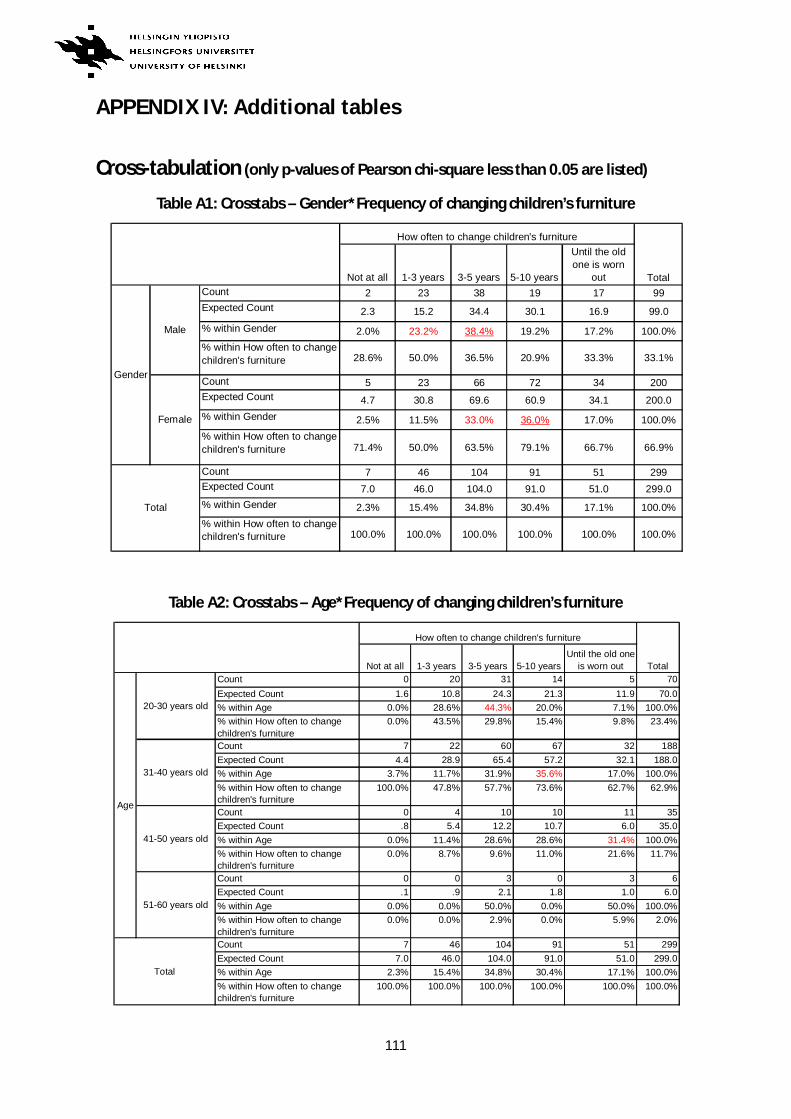
111
APPENDIX IV Additional tables
Cross-tabulation (only p-values of Pearson chi-square less than 0.05 are listed)
Table A1: Crosstabs – Gender*Frequency of changing children’s furniture
Table A2: Crosstabs – Age*Frequency of changing children’s furniture
Not at all 1-3 years 3-5 years 5-10 years
Until the oldone is worn
outCount 2 23 38 19 17 99Expected Count 2.3 15.2 34.4 30.1 16.9 99.0% within Gender 2.0% 23.2% 38.4% 19.2% 17.2% 100.0%% within How often to changechildren's furniture 28.6% 50.0% 36.5% 20.9% 33.3% 33.1%
Count 5 23 66 72 34 200Expected Count 4.7 30.8 69.6 60.9 34.1 200.0% within Gender 2.5% 11.5% 33.0% 36.0% 17.0% 100.0%% within How often to changechildren's furniture 71.4% 50.0% 63.5% 79.1% 66.7% 66.9%
Count 7 46 104 91 51 299Expected Count 7.0 46.0 104.0 91.0 51.0 299.0% within Gender 2.3% 15.4% 34.8% 30.4% 17.1% 100.0%% within How often to changechildren's furniture 100.0% 100.0% 100.0% 100.0% 100.0% 100.0%
Total
How often to change children's furniture
Total
Gender
Male
Female
Not at all 1-3 years 3-5 years 5-10 yearsUntil the old one
is worn outCount 0 20 31 14 5 70Expected Count 1.6 10.8 24.3 21.3 11.9 70.0% within Age 0.0% 28.6% 44.3% 20.0% 7.1% 100.0%% within How often to changechildren's furniture
0.0% 43.5% 29.8% 15.4% 9.8% 23.4%
Count 7 22 60 67 32 188Expected Count 4.4 28.9 65.4 57.2 32.1 188.0% within Age 3.7% 11.7% 31.9% 35.6% 17.0% 100.0%% within How often to changechildren's furniture
100.0% 47.8% 57.7% 73.6% 62.7% 62.9%
Count 0 4 10 10 11 35Expected Count .8 5.4 12.2 10.7 6.0 35.0% within Age 0.0% 11.4% 28.6% 28.6% 31.4% 100.0%% within How often to changechildren's furniture
0.0% 8.7% 9.6% 11.0% 21.6% 11.7%
Count 0 0 3 0 3 6Expected Count .1 .9 2.1 1.8 1.0 6.0% within Age 0.0% 0.0% 50.0% 0.0% 50.0% 100.0%% within How often to changechildren's furniture
0.0% 0.0% 2.9% 0.0% 5.9% 2.0%
Count 7 46 104 91 51 299Expected Count 7.0 46.0 104.0 91.0 51.0 299.0% within Age 2.3% 15.4% 34.8% 30.4% 17.1% 100.0%% within How often to changechildren's furniture
100.0% 100.0% 100.0% 100.0% 100.0% 100.0%Total
How often to change children's furniture
Total
Age
20-30 years old
31-40 years old
41-50 years old
51-60 years old
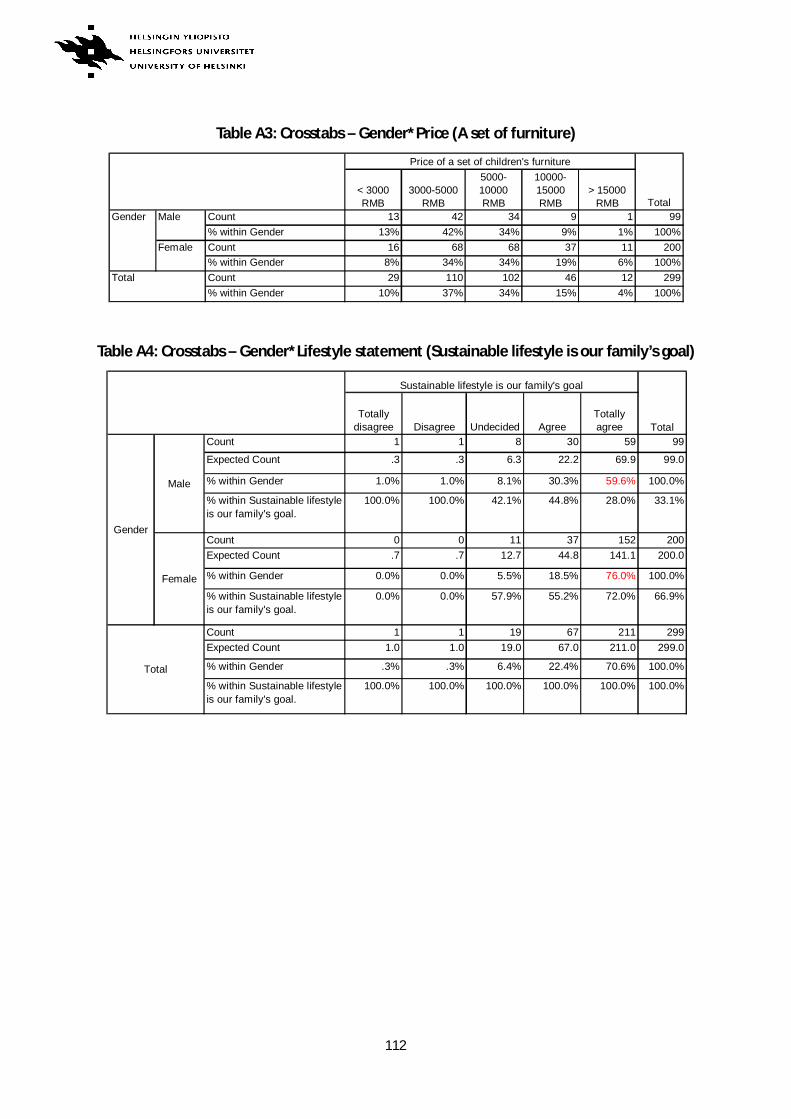
112
Table A3: Crosstabs – Gender*Price (A set of furniture)
Table A4: Crosstabs – Gender*Lifestyle statement (Sustainable lifestyle is our family’s goal)
< 3000RMB
3000-5000RMB
5000-10000RMB
10000-15000RMB
> 15000RMB
Count 13 42 34 9 1 99% within Gender 13% 42% 34% 9% 1% 100%Count 16 68 68 37 11 200% within Gender 8% 34% 34% 19% 6% 100%Count 29 110 102 46 12 299% within Gender 10% 37% 34% 15% 4% 100%
Price of a set of children's furniture
TotalGender Male
Female
Total
Totallydisagree Disagree Undecided Agree
Totallyagree
Count 1 1 8 30 59 99
Expected Count .3 .3 6.3 22.2 69.9 99.0
% within Gender 1.0% 1.0% 8.1% 30.3% 59.6% 100.0%
% within Sustainable lifestyleis our family's goal.
100.0% 100.0% 42.1% 44.8% 28.0% 33.1%
Count 0 0 11 37 152 200Expected Count .7 .7 12.7 44.8 141.1 200.0
% within Gender 0.0% 0.0% 5.5% 18.5% 76.0% 100.0%
% within Sustainable lifestyleis our family's goal.
0.0% 0.0% 57.9% 55.2% 72.0% 66.9%
Count 1 1 19 67 211 299Expected Count 1.0 1.0 19.0 67.0 211.0 299.0
% within Gender .3% .3% 6.4% 22.4% 70.6% 100.0%
% within Sustainable lifestyleis our family's goal.
100.0% 100.0% 100.0% 100.0% 100.0% 100.0%
Sustainable lifestyle is our family's goal
Total
Gender
Male
Female
Total
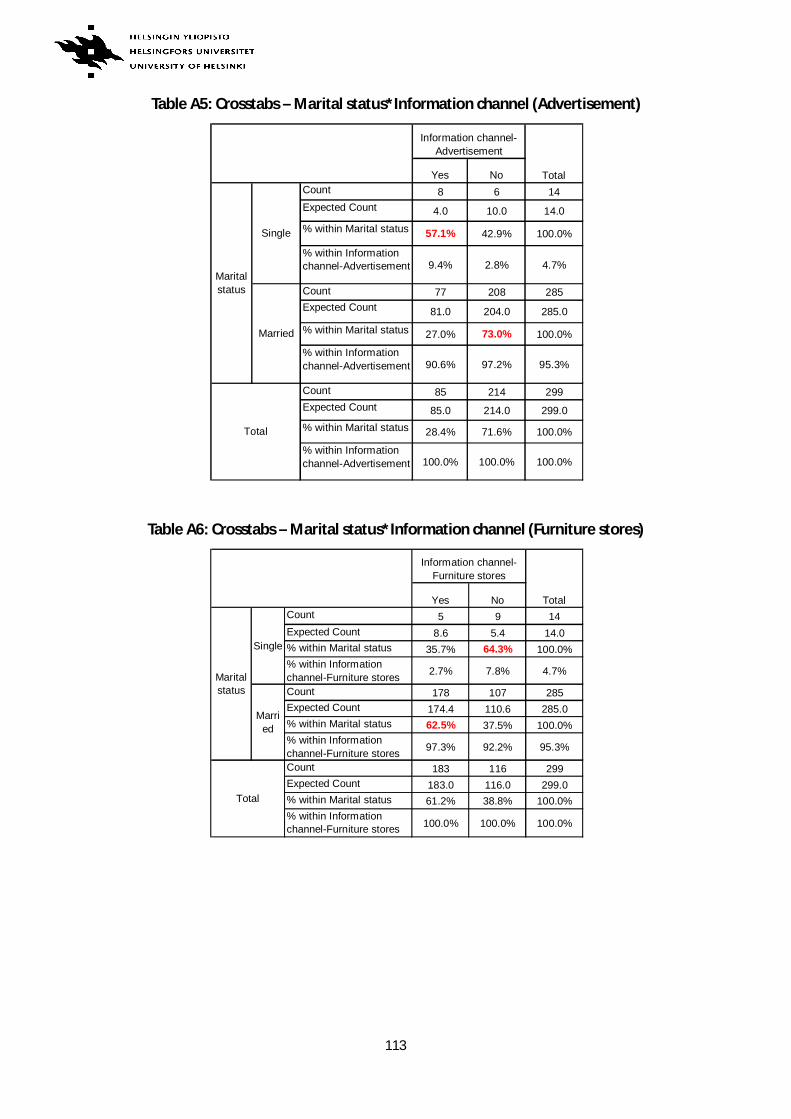
113
Table A5: Crosstabs – Marital status*Information channel (Advertisement)
Table A6: Crosstabs – Marital status*Information channel (Furniture stores)
Yes NoCount 8 6 14Expected Count 4.0 10.0 14.0% within Marital status 57.1% 42.9% 100.0%
% within Informationchannel-Advertisement 9.4% 2.8% 4.7%
Count 77 208 285Expected Count 81.0 204.0 285.0
% within Marital status 27.0% 73.0% 100.0%
% within Informationchannel-Advertisement 90.6% 97.2% 95.3%
Count 85 214 299Expected Count 85.0 214.0 299.0% within Marital status 28.4% 71.6% 100.0%
% within Informationchannel-Advertisement 100.0% 100.0% 100.0%
Married
Total
Information channel-Advertisement
Total
Maritalstatus
Single
Yes NoCount 5 9 14Expected Count 8.6 5.4 14.0% within Marital status 35.7% 64.3% 100.0%% within Informationchannel-Furniture stores 2.7% 7.8% 4.7%
Count 178 107 285Expected Count 174.4 110.6 285.0% within Marital status 62.5% 37.5% 100.0%% within Informationchannel-Furniture stores 97.3% 92.2% 95.3%
Count 183 116 299Expected Count 183.0 116.0 299.0% within Marital status 61.2% 38.8% 100.0%% within Informationchannel-Furniture stores 100.0% 100.0% 100.0%
Total
Information channel-Furniture stores
Total
Maritalstatus
Single
Married
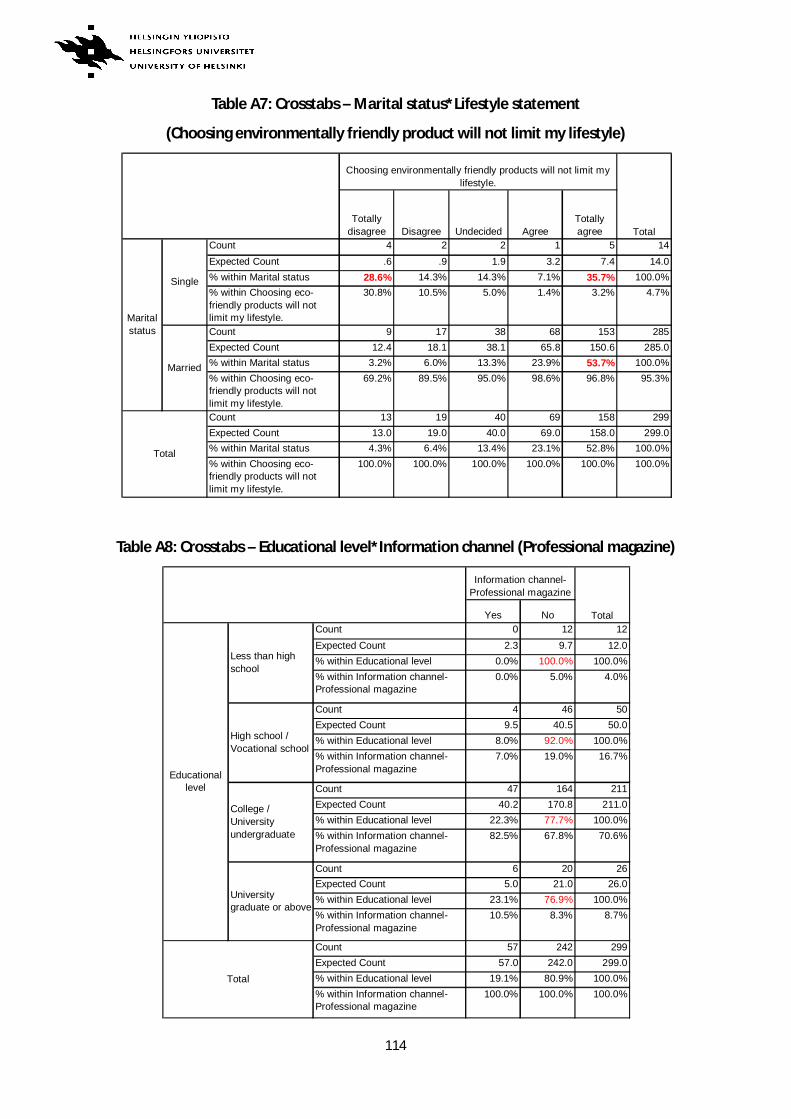
114
Table A7: Crosstabs – Marital status*Lifestyle statement
(Choosing environmentally friendly product will not limit my lifestyle)
Table A8: Crosstabs – Educational level*Information channel (Professional magazine)
Totallydisagree Disagree Undecided Agree
Totallyagree
Count 4 2 2 1 5 14Expected Count .6 .9 1.9 3.2 7.4 14.0% within Marital status 28.6% 14.3% 14.3% 7.1% 35.7% 100.0%% within Choosing eco-friendly products will notlimit my lifestyle.
30.8% 10.5% 5.0% 1.4% 3.2% 4.7%
Count 9 17 38 68 153 285Expected Count 12.4 18.1 38.1 65.8 150.6 285.0% within Marital status 3.2% 6.0% 13.3% 23.9% 53.7% 100.0%% within Choosing eco-friendly products will notlimit my lifestyle.
69.2% 89.5% 95.0% 98.6% 96.8% 95.3%
Count 13 19 40 69 158 299Expected Count 13.0 19.0 40.0 69.0 158.0 299.0% within Marital status 4.3% 6.4% 13.4% 23.1% 52.8% 100.0%% within Choosing eco-friendly products will notlimit my lifestyle.
100.0% 100.0% 100.0% 100.0% 100.0% 100.0%Total
Choosing environmentally friendly products will not limit mylifestyle.
Total
Maritalstatus
Single
Married
Yes NoCount 0 12 12Expected Count 2.3 9.7 12.0% within Educational level 0.0% 100.0% 100.0%% within Information channel-Professional magazine
0.0% 5.0% 4.0%
Count 4 46 50Expected Count 9.5 40.5 50.0% within Educational level 8.0% 92.0% 100.0%% within Information channel-Professional magazine
7.0% 19.0% 16.7%
Count 47 164 211Expected Count 40.2 170.8 211.0% within Educational level 22.3% 77.7% 100.0%% within Information channel-Professional magazine
82.5% 67.8% 70.6%
Count 6 20 26Expected Count 5.0 21.0 26.0% within Educational level 23.1% 76.9% 100.0%% within Information channel-Professional magazine
10.5% 8.3% 8.7%
Count 57 242 299Expected Count 57.0 242.0 299.0% within Educational level 19.1% 80.9% 100.0%% within Information channel-Professional magazine
100.0% 100.0% 100.0%
Information channel-Professional magazine
Total
Educationallevel
Less than highschool
High school /Vocational school
College /Universityundergraduate
Universitygraduate or above
Total
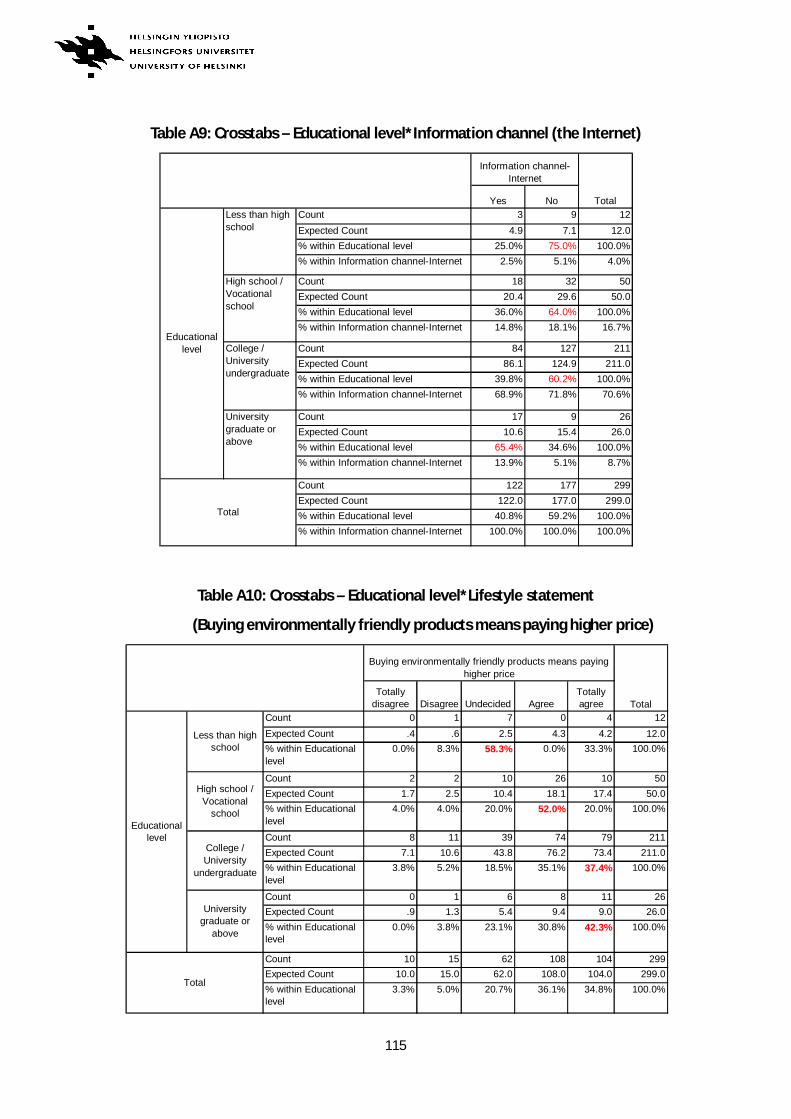
115
Table A9: Crosstabs – Educational level*Information channel (the Internet)
Table A10: Crosstabs – Educational level*Lifestyle statement
(Buying environmentally friendly products means paying higher price)
Yes NoCount 3 9 12Expected Count 4.9 7.1 12.0% within Educational level 25.0% 75.0% 100.0%% within Information channel-Internet 2.5% 5.1% 4.0%
Count 18 32 50Expected Count 20.4 29.6 50.0% within Educational level 36.0% 64.0% 100.0%% within Information channel-Internet 14.8% 18.1% 16.7%
Count 84 127 211Expected Count 86.1 124.9 211.0% within Educational level 39.8% 60.2% 100.0%% within Information channel-Internet 68.9% 71.8% 70.6%
Count 17 9 26Expected Count 10.6 15.4 26.0% within Educational level 65.4% 34.6% 100.0%% within Information channel-Internet 13.9% 5.1% 8.7%
Count 122 177 299Expected Count 122.0 177.0 299.0% within Educational level 40.8% 59.2% 100.0%% within Information channel-Internet 100.0% 100.0% 100.0%
Information channel-Internet
Total
Educationallevel
Less than highschool
High school /Vocationalschool
College /Universityundergraduate
Universitygraduate orabove
Total
Totallydisagree Disagree Undecided Agree
Totallyagree
Count 0 1 7 0 4 12Expected Count .4 .6 2.5 4.3 4.2 12.0% within Educationallevel
0.0% 8.3% 58.3% 0.0% 33.3% 100.0%
Count 2 2 10 26 10 50Expected Count 1.7 2.5 10.4 18.1 17.4 50.0% within Educationallevel
4.0% 4.0% 20.0% 52.0% 20.0% 100.0%
Count 8 11 39 74 79 211Expected Count 7.1 10.6 43.8 76.2 73.4 211.0% within Educationallevel
3.8% 5.2% 18.5% 35.1% 37.4% 100.0%
Count 0 1 6 8 11 26Expected Count .9 1.3 5.4 9.4 9.0 26.0% within Educationallevel
0.0% 3.8% 23.1% 30.8% 42.3% 100.0%
Count 10 15 62 108 104 299Expected Count 10.0 15.0 62.0 108.0 104.0 299.0% within Educationallevel
3.3% 5.0% 20.7% 36.1% 34.8% 100.0%
Buying environmentally friendly products means payinghigher price
Total
Educationallevel
Less than highschool
High school /Vocational
school
College /University
undergraduate
Universitygraduate or
above
Total
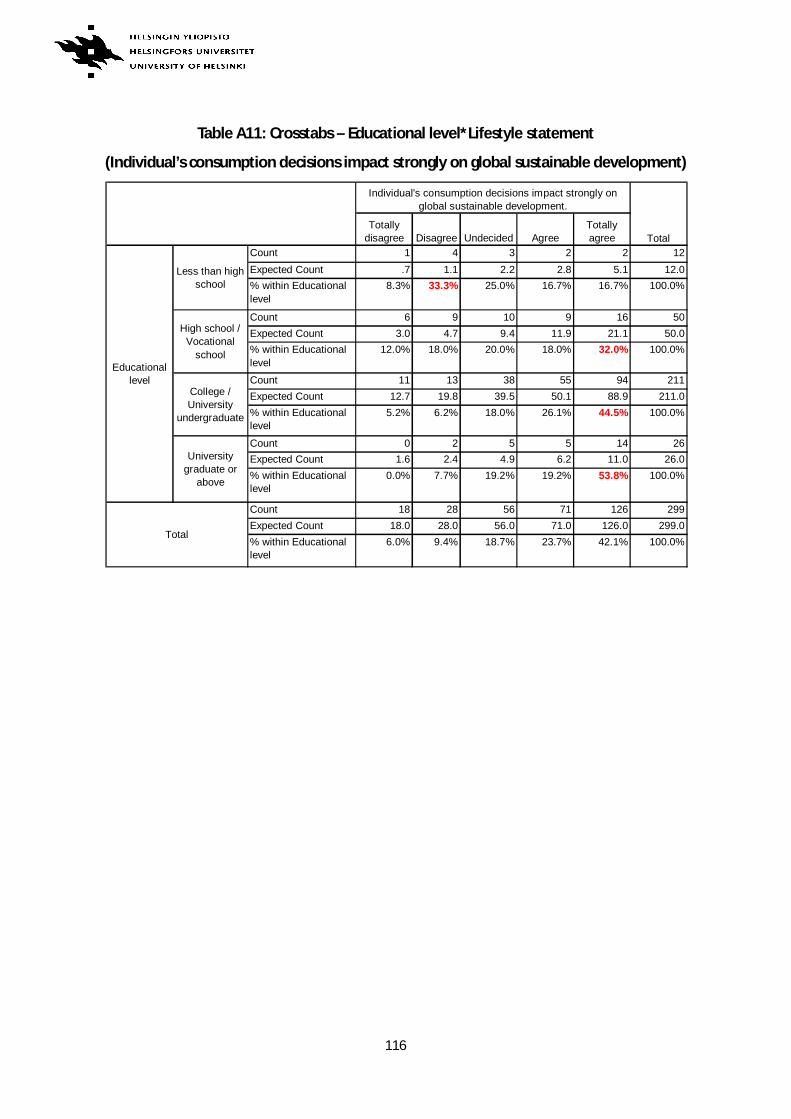
116
Table A11: Crosstabs – Educational level*Lifestyle statement
(Individual’s consumption decisions impact strongly on global sustainable development)
Totallydisagree Disagree Undecided Agree
Totallyagree
Count 1 4 3 2 2 12Expected Count .7 1.1 2.2 2.8 5.1 12.0% within Educationallevel
8.3% 33.3% 25.0% 16.7% 16.7% 100.0%
Count 6 9 10 9 16 50Expected Count 3.0 4.7 9.4 11.9 21.1 50.0% within Educationallevel
12.0% 18.0% 20.0% 18.0% 32.0% 100.0%
Count 11 13 38 55 94 211Expected Count 12.7 19.8 39.5 50.1 88.9 211.0% within Educationallevel
5.2% 6.2% 18.0% 26.1% 44.5% 100.0%
Count 0 2 5 5 14 26Expected Count 1.6 2.4 4.9 6.2 11.0 26.0% within Educationallevel
0.0% 7.7% 19.2% 19.2% 53.8% 100.0%
Count 18 28 56 71 126 299Expected Count 18.0 28.0 56.0 71.0 126.0 299.0% within Educationallevel
6.0% 9.4% 18.7% 23.7% 42.1% 100.0%
Individual's consumption decisions impact strongly onglobal sustainable development.
Total
Educationallevel
Less than highschool
High school /Vocational
school
College /University
undergraduate
Universitygraduate or
above
Total
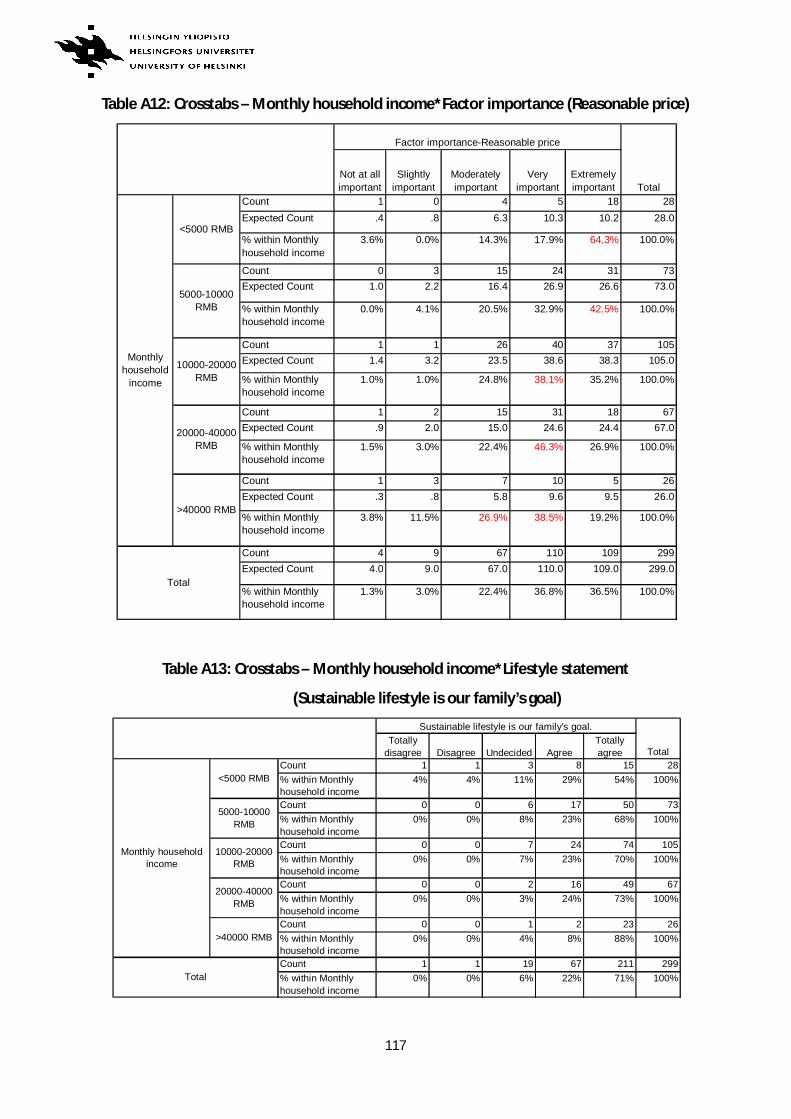
117
Table A12: Crosstabs – Monthly household income*Factor importance (Reasonable price)
Table A13: Crosstabs – Monthly household income*Lifestyle statement
(Sustainable lifestyle is our family’s goal)
Not at allimportant
Slightlyimportant
Moderatelyimportant
Veryimportant
Extremelyimportant
Count 1 0 4 5 18 28Expected Count .4 .8 6.3 10.3 10.2 28.0
% within Monthlyhousehold income
3.6% 0.0% 14.3% 17.9% 64.3% 100.0%
Count 0 3 15 24 31 73Expected Count 1.0 2.2 16.4 26.9 26.6 73.0
% within Monthlyhousehold income
0.0% 4.1% 20.5% 32.9% 42.5% 100.0%
Count 1 1 26 40 37 105Expected Count 1.4 3.2 23.5 38.6 38.3 105.0
% within Monthlyhousehold income
1.0% 1.0% 24.8% 38.1% 35.2% 100.0%
Count 1 2 15 31 18 67Expected Count .9 2.0 15.0 24.6 24.4 67.0
% within Monthlyhousehold income
1.5% 3.0% 22.4% 46.3% 26.9% 100.0%
Count 1 3 7 10 5 26Expected Count .3 .8 5.8 9.6 9.5 26.0
% within Monthlyhousehold income
3.8% 11.5% 26.9% 38.5% 19.2% 100.0%
Count 4 9 67 110 109 299Expected Count 4.0 9.0 67.0 110.0 109.0 299.0
% within Monthlyhousehold income
1.3% 3.0% 22.4% 36.8% 36.5% 100.0%
10000-20000RMB
20000-40000RMB
>40000 RMB
Total
Factor importance-Reasonable price
Total
Monthlyhousehold
income
<5000 RMB
5000-10000RMB
Totallydisagree Disagree Undecided Agree
Totallyagree
Count 1 1 3 8 15 28% within Monthlyhousehold income
4% 4% 11% 29% 54% 100%
Count 0 0 6 17 50 73% within Monthlyhousehold income
0% 0% 8% 23% 68% 100%
Count 0 0 7 24 74 105% within Monthlyhousehold income
0% 0% 7% 23% 70% 100%
Count 0 0 2 16 49 67% within Monthlyhousehold income
0% 0% 3% 24% 73% 100%
Count 0 0 1 2 23 26% within Monthlyhousehold income
0% 0% 4% 8% 88% 100%
Count 1 1 19 67 211 299% within Monthlyhousehold income
0% 0% 6% 22% 71% 100%Total
Sustainable lifestyle is our family's goal.
Total
Monthly householdincome
<5000 RMB
5000-10000RMB
10000-20000RMB
20000-40000RMB
>40000 RMB
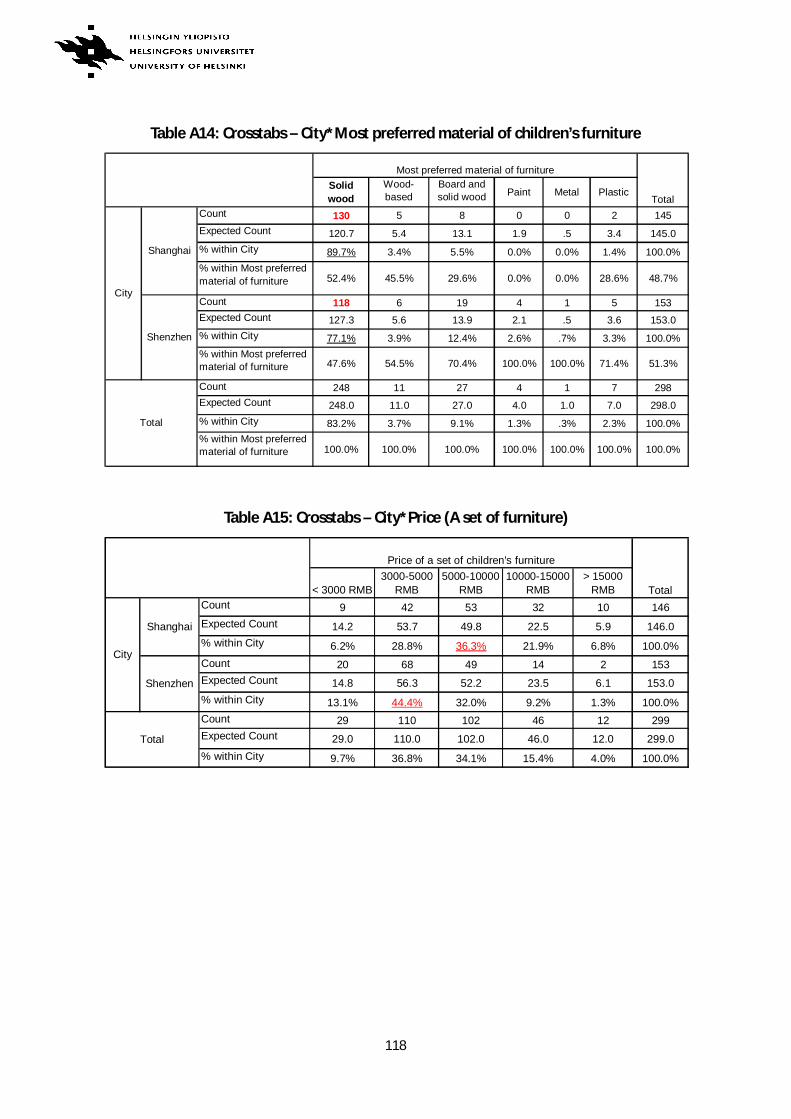
118
Table A14: Crosstabs – City*Most preferred material of children’s furniture
Table A15: Crosstabs – City*Price (A set of furniture)
Solidwood
Wood-based
panel/Board
Board andsolid woodcombined
Paint Metal Plastic
Count 130 5 8 0 0 2 145Expected Count 120.7 5.4 13.1 1.9 .5 3.4 145.0% within City 89.7% 3.4% 5.5% 0.0% 0.0% 1.4% 100.0%% within Most preferredmaterial of furniture 52.4% 45.5% 29.6% 0.0% 0.0% 28.6% 48.7%
Count 118 6 19 4 1 5 153Expected Count 127.3 5.6 13.9 2.1 .5 3.6 153.0% within City 77.1% 3.9% 12.4% 2.6% .7% 3.3% 100.0%% within Most preferredmaterial of furniture 47.6% 54.5% 70.4% 100.0% 100.0% 71.4% 51.3%
Count 248 11 27 4 1 7 298Expected Count 248.0 11.0 27.0 4.0 1.0 7.0 298.0% within City 83.2% 3.7% 9.1% 1.3% .3% 2.3% 100.0%% within Most preferredmaterial of furniture 100.0% 100.0% 100.0% 100.0% 100.0% 100.0% 100.0%
Total
City
Shanghai
Shenzhen
Total
Most preferred material of furniture
< 3000 RMB3000-5000
RMB5000-10000
RMB10000-15000
RMB> 15000
RMBCount 9 42 53 32 10 146Expected Count 14.2 53.7 49.8 22.5 5.9 146.0% within City 6.2% 28.8% 36.3% 21.9% 6.8% 100.0%Count 20 68 49 14 2 153Expected Count 14.8 56.3 52.2 23.5 6.1 153.0% within City 13.1% 44.4% 32.0% 9.2% 1.3% 100.0%Count 29 110 102 46 12 299Expected Count 29.0 110.0 102.0 46.0 12.0 299.0% within City 9.7% 36.8% 34.1% 15.4% 4.0% 100.0%
Shenzhen
Total
Price of a set of children's furniture
Total
City
Shanghai
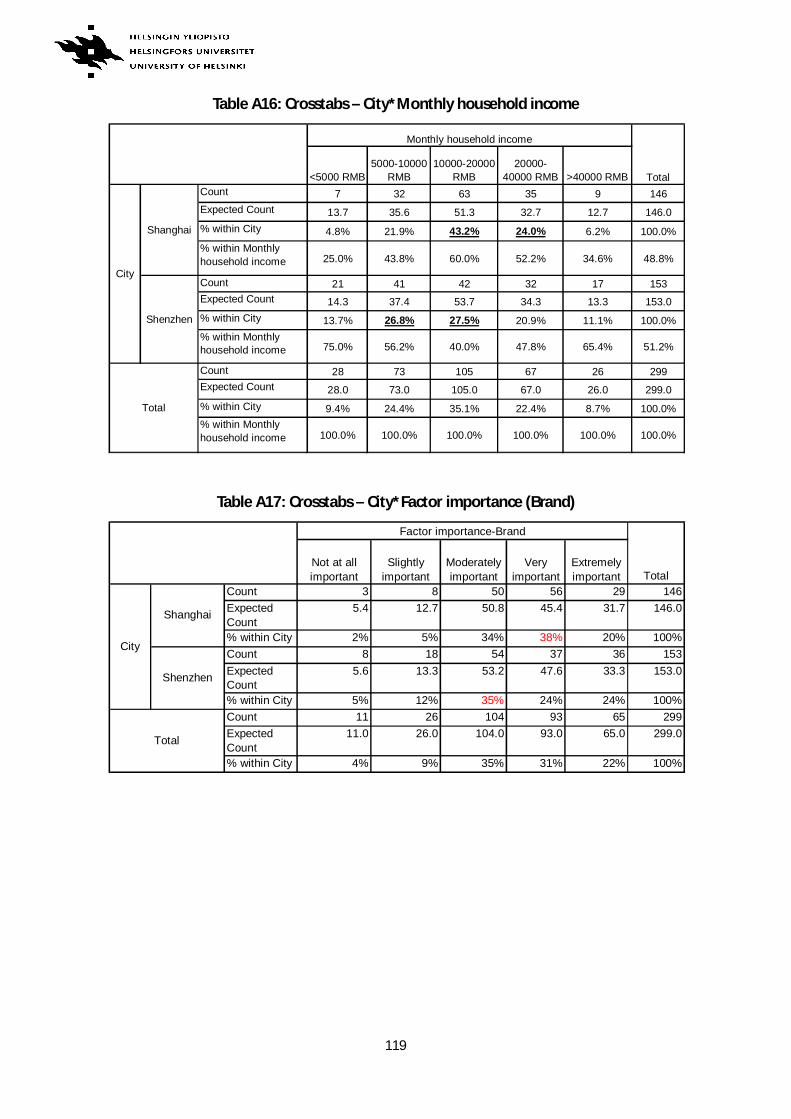
119
Table A16: Crosstabs – City*Monthly household income
Table A17: Crosstabs – City*Factor importance (Brand)
<5000 RMB5000-10000
RMB10000-20000
RMB20000-
40000 RMB >40000 RMBCount 7 32 63 35 9 146Expected Count 13.7 35.6 51.3 32.7 12.7 146.0% within City 4.8% 21.9% 43.2% 24.0% 6.2% 100.0%% within Monthlyhousehold income 25.0% 43.8% 60.0% 52.2% 34.6% 48.8%
Count 21 41 42 32 17 153Expected Count 14.3 37.4 53.7 34.3 13.3 153.0% within City 13.7% 26.8% 27.5% 20.9% 11.1% 100.0%% within Monthlyhousehold income 75.0% 56.2% 40.0% 47.8% 65.4% 51.2%
Count 28 73 105 67 26 299Expected Count 28.0 73.0 105.0 67.0 26.0 299.0% within City 9.4% 24.4% 35.1% 22.4% 8.7% 100.0%% within Monthlyhousehold income 100.0% 100.0% 100.0% 100.0% 100.0% 100.0%
Total
Monthly household income
Total
City
Shanghai
Shenzhen
Not at allimportant
Slightlyimportant
Moderatelyimportant
Veryimportant
Extremelyimportant
Count 3 8 50 56 29 146ExpectedCount
5.4 12.7 50.8 45.4 31.7 146.0
% within City 2% 5% 34% 38% 20% 100%Count 8 18 54 37 36 153ExpectedCount
5.6 13.3 53.2 47.6 33.3 153.0
% within City 5% 12% 35% 24% 24% 100%Count 11 26 104 93 65 299ExpectedCount
11.0 26.0 104.0 93.0 65.0 299.0
% within City 4% 9% 35% 31% 22% 100%
Factor importance-Brand
Total
City
Shanghai
Shenzhen
Total
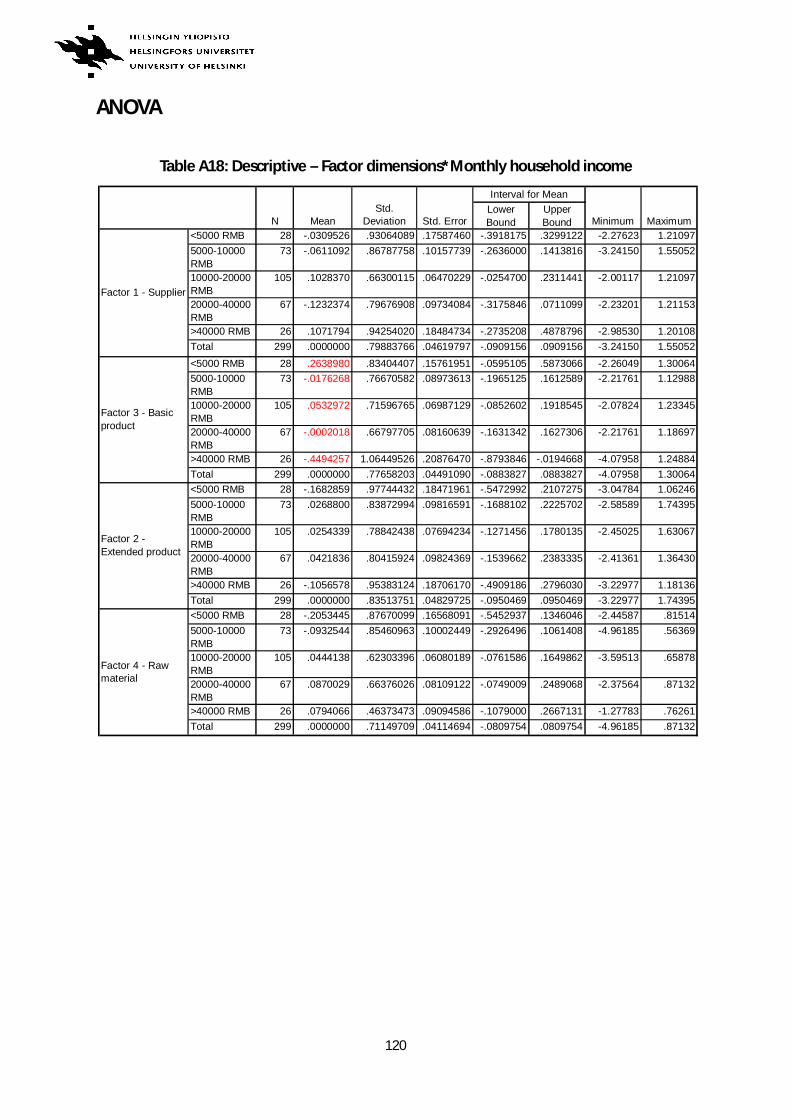
120
ANOVA
Table A18: Descriptive – Factor dimensions*Monthly household income
LowerBound
UpperBound
<5000 RMB 28 -.0309526 .93064089 .17587460 -.3918175 .3299122 -2.27623 1.210975000-10000RMB
73 -.0611092 .86787758 .10157739 -.2636000 .1413816 -3.24150 1.55052
10000-20000RMB
105 .1028370 .66300115 .06470229 -.0254700 .2311441 -2.00117 1.21097
20000-40000RMB
67 -.1232374 .79676908 .09734084 -.3175846 .0711099 -2.23201 1.21153
>40000 RMB 26 .1071794 .94254020 .18484734 -.2735208 .4878796 -2.98530 1.20108Total 299 .0000000 .79883766 .04619797 -.0909156 .0909156 -3.24150 1.55052<5000 RMB 28 .2638980 .83404407 .15761951 -.0595105 .5873066 -2.26049 1.300645000-10000RMB
73 -.0176268 .76670582 .08973613 -.1965125 .1612589 -2.21761 1.12988
10000-20000RMB
105 .0532972 .71596765 .06987129 -.0852602 .1918545 -2.07824 1.23345
20000-40000RMB
67 -.0002018 .66797705 .08160639 -.1631342 .1627306 -2.21761 1.18697
>40000 RMB 26 -.4494257 1.06449526 .20876470 -.8793846 -.0194668 -4.07958 1.24884Total 299 .0000000 .77658203 .04491090 -.0883827 .0883827 -4.07958 1.30064<5000 RMB 28 -.1682859 .97744432 .18471961 -.5472992 .2107275 -3.04784 1.062465000-10000RMB
73 .0268800 .83872994 .09816591 -.1688102 .2225702 -2.58589 1.74395
10000-20000RMB
105 .0254339 .78842438 .07694234 -.1271456 .1780135 -2.45025 1.63067
20000-40000RMB
67 .0421836 .80415924 .09824369 -.1539662 .2383335 -2.41361 1.36430
>40000 RMB 26 -.1056578 .95383124 .18706170 -.4909186 .2796030 -3.22977 1.18136Total 299 .0000000 .83513751 .04829725 -.0950469 .0950469 -3.22977 1.74395<5000 RMB 28 -.2053445 .87670099 .16568091 -.5452937 .1346046 -2.44587 .815145000-10000RMB
73 -.0932544 .85460963 .10002449 -.2926496 .1061408 -4.96185 .56369
10000-20000RMB
105 .0444138 .62303396 .06080189 -.0761586 .1649862 -3.59513 .65878
20000-40000RMB
67 .0870029 .66376026 .08109122 -.0749009 .2489068 -2.37564 .87132
>40000 RMB 26 .0794066 .46373473 .09094586 -.1079000 .2667131 -1.27783 .76261Total 299 .0000000 .71149709 .04114694 -.0809754 .0809754 -4.96185 .87132
N Mean
Std.Deviation Std. Error
95% ConfidenceInterval for Mean
Minimum Maximum
Factor 1 - Supplier
Factor 3 - Basicproduct
Factor 2 -Extended product
Factor 4 - Rawmaterial
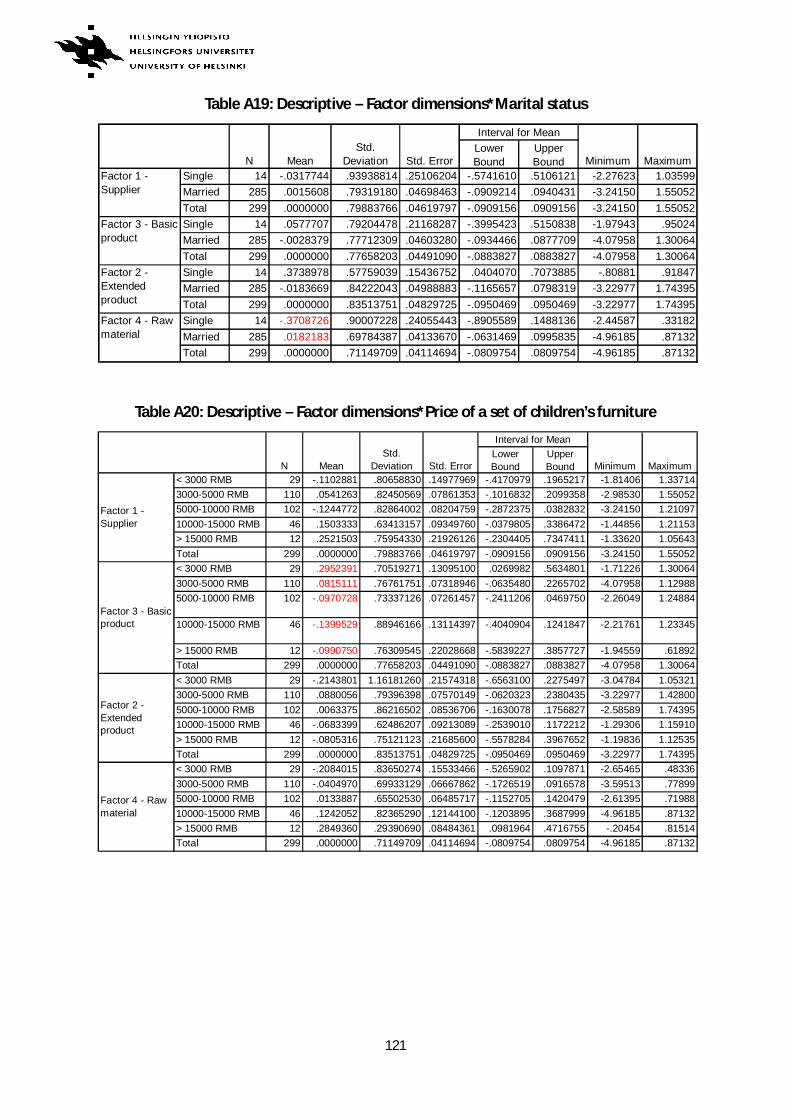
121
Table A19: Descriptive – Factor dimensions*Marital status
Table A20: Descriptive – Factor dimensions*Price of a set of children’s furniture
LowerBound
UpperBound
Single 14 -.0317744 .93938814 .25106204 -.5741610 .5106121 -2.27623 1.03599Married 285 .0015608 .79319180 .04698463 -.0909214 .0940431 -3.24150 1.55052Total 299 .0000000 .79883766 .04619797 -.0909156 .0909156 -3.24150 1.55052Single 14 .0577707 .79204478 .21168287 -.3995423 .5150838 -1.97943 .95024Married 285 -.0028379 .77712309 .04603280 -.0934466 .0877709 -4.07958 1.30064Total 299 .0000000 .77658203 .04491090 -.0883827 .0883827 -4.07958 1.30064Single 14 .3738978 .57759039 .15436752 .0404070 .7073885 -.80881 .91847Married 285 -.0183669 .84222043 .04988883 -.1165657 .0798319 -3.22977 1.74395Total 299 .0000000 .83513751 .04829725 -.0950469 .0950469 -3.22977 1.74395Single 14 -.3708726 .90007228 .24055443 -.8905589 .1488136 -2.44587 .33182Married 285 .0182183 .69784387 .04133670 -.0631469 .0995835 -4.96185 .87132Total 299 .0000000 .71149709 .04114694 -.0809754 .0809754 -4.96185 .87132
Factor 4 - Rawmaterial
Interval for Mean
Minimum MaximumFactor 1 -Supplier
Factor 3 - Basicproduct
Factor 2 -Extendedproduct
N Mean
Std.Deviation Std. Error
LowerBound
UpperBound
< 3000 RMB 29 -.1102881 .80658830 .14977969 -.4170979 .1965217 -1.81406 1.337143000-5000 RMB 110 .0541263 .82450569 .07861353 -.1016832 .2099358 -2.98530 1.550525000-10000 RMB 102 -.1244772 .82864002 .08204759 -.2872375 .0382832 -3.24150 1.2109710000-15000 RMB 46 .1503333 .63413157 .09349760 -.0379805 .3386472 -1.44856 1.21153> 15000 RMB 12 .2521503 .75954330 .21926126 -.2304405 .7347411 -1.33620 1.05643Total 299 .0000000 .79883766 .04619797 -.0909156 .0909156 -3.24150 1.55052< 3000 RMB 29 .2952391 .70519271 .13095100 .0269982 .5634801 -1.71226 1.300643000-5000 RMB 110 .0815111 .76761751 .07318946 -.0635480 .2265702 -4.07958 1.129885000-10000 RMB 102 -.0970728 .73337126 .07261457 -.2411206 .0469750 -2.26049 1.24884
10000-15000 RMB 46 -.1399529 .88946166 .13114397 -.4040904 .1241847 -2.21761 1.23345
> 15000 RMB 12 -.0990750 .76309545 .22028668 -.5839227 .3857727 -1.94559 .61892Total 299 .0000000 .77658203 .04491090 -.0883827 .0883827 -4.07958 1.30064< 3000 RMB 29 -.2143801 1.16181260 .21574318 -.6563100 .2275497 -3.04784 1.053213000-5000 RMB 110 .0880056 .79396398 .07570149 -.0620323 .2380435 -3.22977 1.428005000-10000 RMB 102 .0063375 .86216502 .08536706 -.1630078 .1756827 -2.58589 1.7439510000-15000 RMB 46 -.0683399 .62486207 .09213089 -.2539010 .1172212 -1.29306 1.15910> 15000 RMB 12 -.0805316 .75121123 .21685600 -.5578284 .3967652 -1.19836 1.12535Total 299 .0000000 .83513751 .04829725 -.0950469 .0950469 -3.22977 1.74395< 3000 RMB 29 -.2084015 .83650274 .15533466 -.5265902 .1097871 -2.65465 .483363000-5000 RMB 110 -.0404970 .69933129 .06667862 -.1726519 .0916578 -3.59513 .778995000-10000 RMB 102 .0133887 .65502530 .06485717 -.1152705 .1420479 -2.61395 .7198810000-15000 RMB 46 .1242052 .82365290 .12144100 -.1203895 .3687999 -4.96185 .87132> 15000 RMB 12 .2849360 .29390690 .08484361 .0981964 .4716755 -.20454 .81514Total 299 .0000000 .71149709 .04114694 -.0809754 .0809754 -4.96185 .87132
Factor 1 -Supplier
Factor 3 - Basicproduct
Factor 2 -Extendedproduct
Factor 4 - Rawmaterial
N Mean
Std.Deviation Std. Error
95% ConfidenceInterval for Mean
Minimum Maximum
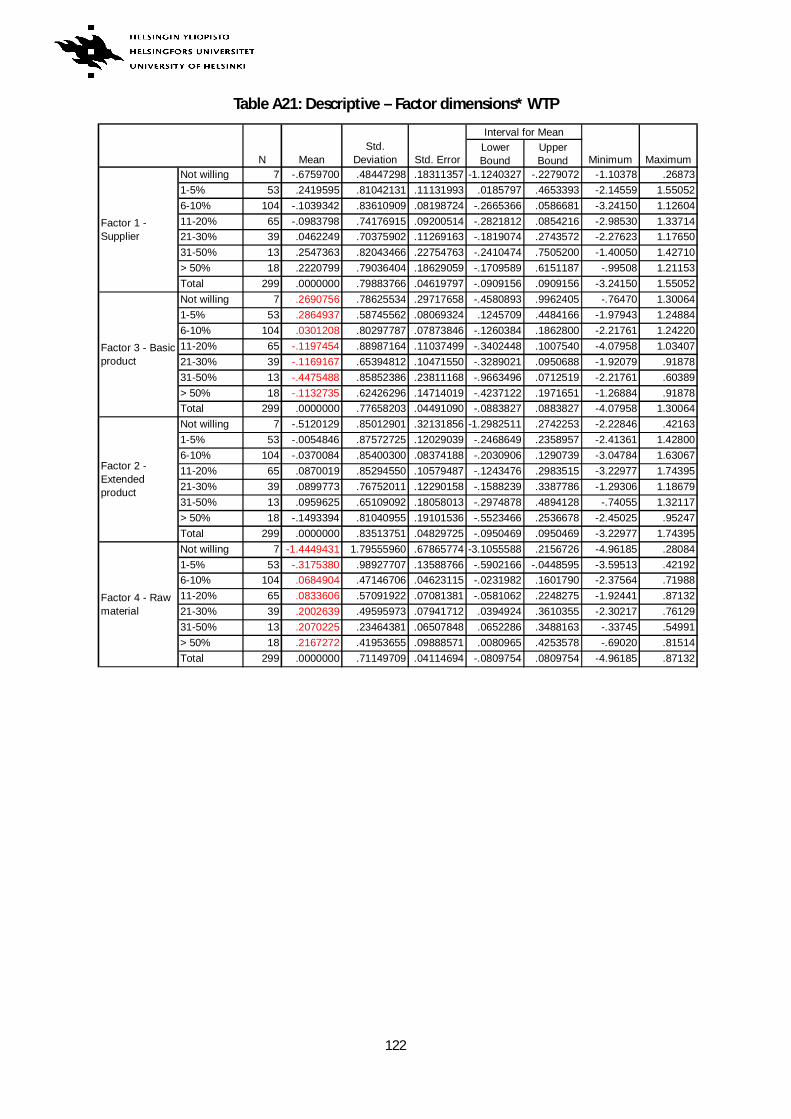
122
Table A21: Descriptive – Factor dimensions* WTP
LowerBound
UpperBound
Not willing 7 -.6759700 .48447298 .18311357 -1.1240327 -.2279072 -1.10378 .268731-5% 53 .2419595 .81042131 .11131993 .0185797 .4653393 -2.14559 1.550526-10% 104 -.1039342 .83610909 .08198724 -.2665366 .0586681 -3.24150 1.1260411-20% 65 -.0983798 .74176915 .09200514 -.2821812 .0854216 -2.98530 1.3371421-30% 39 .0462249 .70375902 .11269163 -.1819074 .2743572 -2.27623 1.1765031-50% 13 .2547363 .82043466 .22754763 -.2410474 .7505200 -1.40050 1.42710> 50% 18 .2220799 .79036404 .18629059 -.1709589 .6151187 -.99508 1.21153Total 299 .0000000 .79883766 .04619797 -.0909156 .0909156 -3.24150 1.55052Not willing 7 .2690756 .78625534 .29717658 -.4580893 .9962405 -.76470 1.300641-5% 53 .2864937 .58745562 .08069324 .1245709 .4484166 -1.97943 1.248846-10% 104 .0301208 .80297787 .07873846 -.1260384 .1862800 -2.21761 1.2422011-20% 65 -.1197454 .88987164 .11037499 -.3402448 .1007540 -4.07958 1.0340721-30% 39 -.1169167 .65394812 .10471550 -.3289021 .0950688 -1.92079 .9187831-50% 13 -.4475488 .85852386 .23811168 -.9663496 .0712519 -2.21761 .60389> 50% 18 -.1132735 .62426296 .14714019 -.4237122 .1971651 -1.26884 .91878Total 299 .0000000 .77658203 .04491090 -.0883827 .0883827 -4.07958 1.30064Not willing 7 -.5120129 .85012901 .32131856 -1.2982511 .2742253 -2.22846 .421631-5% 53 -.0054846 .87572725 .12029039 -.2468649 .2358957 -2.41361 1.428006-10% 104 -.0370084 .85400300 .08374188 -.2030906 .1290739 -3.04784 1.6306711-20% 65 .0870019 .85294550 .10579487 -.1243476 .2983515 -3.22977 1.7439521-30% 39 .0899773 .76752011 .12290158 -.1588239 .3387786 -1.29306 1.1867931-50% 13 .0959625 .65109092 .18058013 -.2974878 .4894128 -.74055 1.32117> 50% 18 -.1493394 .81040955 .19101536 -.5523466 .2536678 -2.45025 .95247Total 299 .0000000 .83513751 .04829725 -.0950469 .0950469 -3.22977 1.74395Not willing 7 -1.4449431 1.79555960 .67865774 -3.1055588 .2156726 -4.96185 .280841-5% 53 -.3175380 .98927707 .13588766 -.5902166 -.0448595 -3.59513 .421926-10% 104 .0684904 .47146706 .04623115 -.0231982 .1601790 -2.37564 .7198811-20% 65 .0833606 .57091922 .07081381 -.0581062 .2248275 -1.92441 .8713221-30% 39 .2002639 .49595973 .07941712 .0394924 .3610355 -2.30217 .7612931-50% 13 .2070225 .23464381 .06507848 .0652286 .3488163 -.33745 .54991> 50% 18 .2167272 .41953655 .09888571 .0080965 .4253578 -.69020 .81514Total 299 .0000000 .71149709 .04114694 -.0809754 .0809754 -4.96185 .87132
Factor 2 -Extendedproduct
Factor 4 - Rawmaterial
Interval for Mean
Minimum Maximum
Factor 1 -Supplier
Factor 3 - Basicproduct
N Mean
Std.Deviation Std. Error
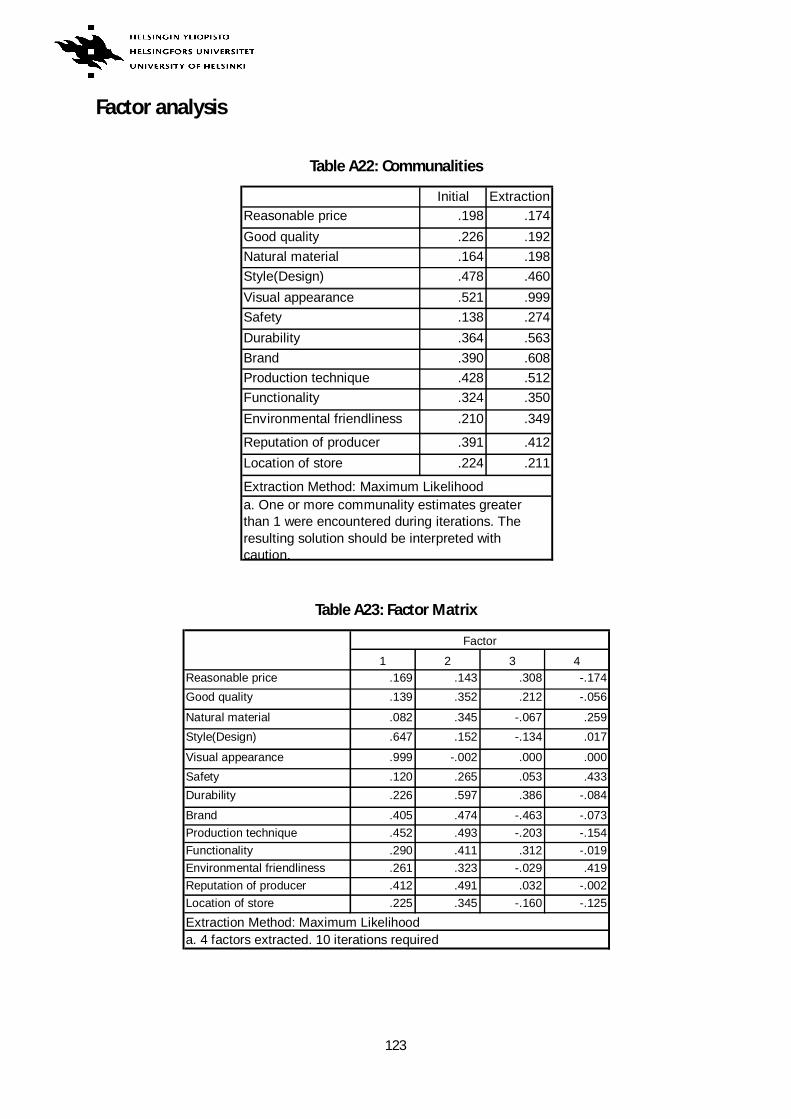
123
Factor analysis
Table A22: Communalities
Table A23: Factor Matrix
Initial ExtractionReasonable price .198 .174Good quality .226 .192Natural material .164 .198Style(Design) .478 .460Visual appearance .521 .999Safety .138 .274Durability .364 .563Brand .390 .608Production technique .428 .512Functionality .324 .350Environmental friendliness .210 .349
Reputation of producer .391 .412Location of store .224 .211
Extraction Method: Maximum Likelihooda. One or more communality estimates greaterthan 1 were encountered during iterations. Theresulting solution should be interpreted withcaution.
1 2 3 4Reasonable price .169 .143 .308 -.174Good quality .139 .352 .212 -.056
Natural material .082 .345 -.067 .259Style(Design) .647 .152 -.134 .017
Visual appearance .999 -.002 .000 .000Safety .120 .265 .053 .433Durability .226 .597 .386 -.084
Brand .405 .474 -.463 -.073Production technique .452 .493 -.203 -.154Functionality .290 .411 .312 -.019Environmental friendliness .261 .323 -.029 .419Reputation of producer .412 .491 .032 -.002Location of store .225 .345 -.160 -.125
Factor
Extraction Method: Maximum Likelihooda. 4 factors extracted. 10 iterations required
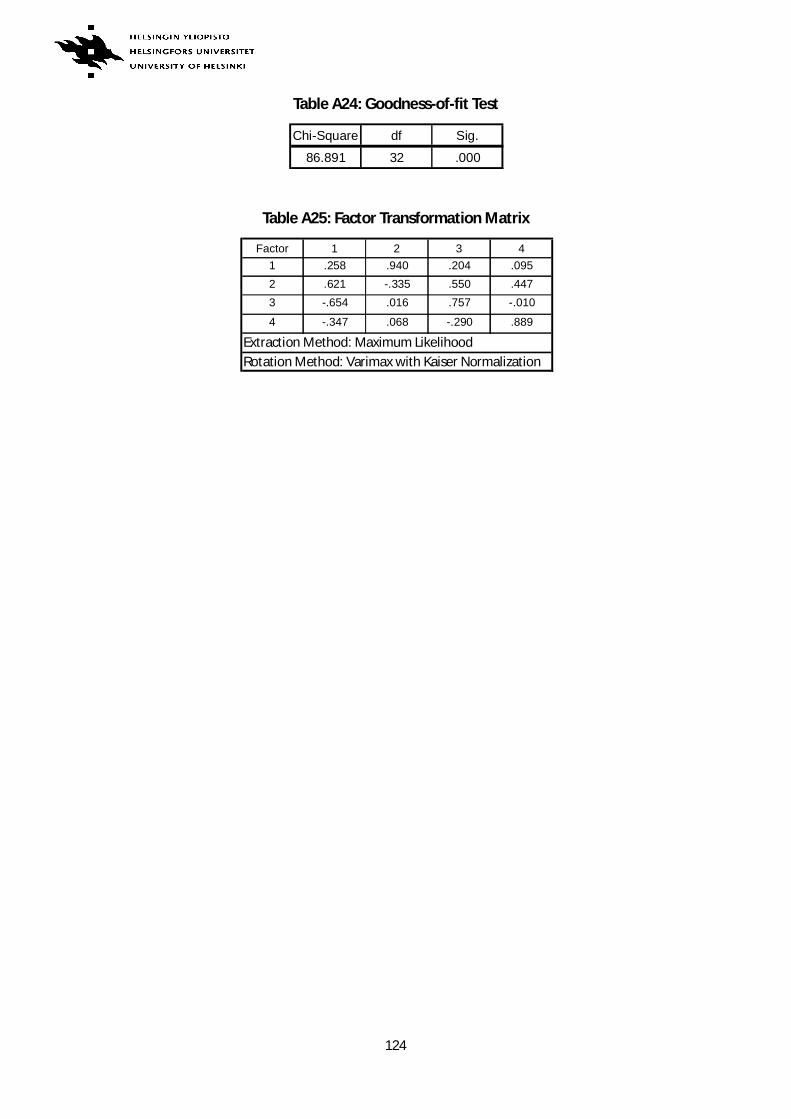
124
Table A24: Goodness-of-fit Test
Table A25: Factor Transformation Matrix
Chi-Square df Sig.
86.891 32 .000
Factor 1 2 3 41 .258 .940 .204 .0952 .621 -.335 .550 .4473 -.654 .016 .757 -.010
4 -.347 .068 -.290 .889
Extraction Method: Maximum LikelihoodRotation Method: Varimax with Kaiser Normalization
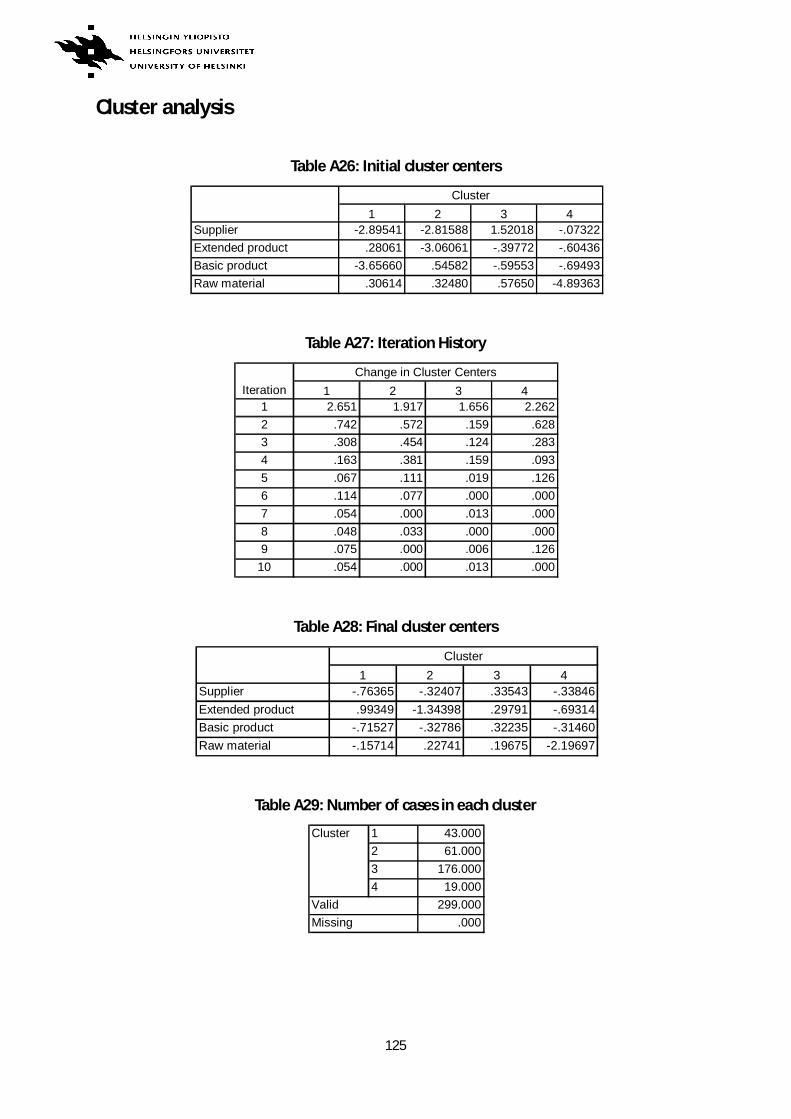
125
Cluster analysis
Table A26: Initial cluster centers
Table A27: Iteration History
Table A28: Final cluster centers
Table A29: Number of cases in each cluster
1 2 3 4Supplier -2.89541 -2.81588 1.52018 -.07322Extended product .28061 -3.06061 -.39772 -.60436Basic product -3.65660 .54582 -.59553 -.69493Raw material .30614 .32480 .57650 -4.89363
Cluster
1 2 3 41 2.651 1.917 1.656 2.2622 .742 .572 .159 .6283 .308 .454 .124 .2834 .163 .381 .159 .0935 .067 .111 .019 .1266 .114 .077 .000 .0007 .054 .000 .013 .0008 .048 .033 .000 .0009 .075 .000 .006 .126
10 .054 .000 .013 .000
IterationChange in Cluster Centers
1 2 3 4Supplier -.76365 -.32407 .33543 -.33846Extended product .99349 -1.34398 .29791 -.69314Basic product -.71527 -.32786 .32235 -.31460Raw material -.15714 .22741 .19675 -2.19697
Cluster
1 43.0002 61.0003 176.0004 19.000
299.000.000Missing
Cluster
Valid
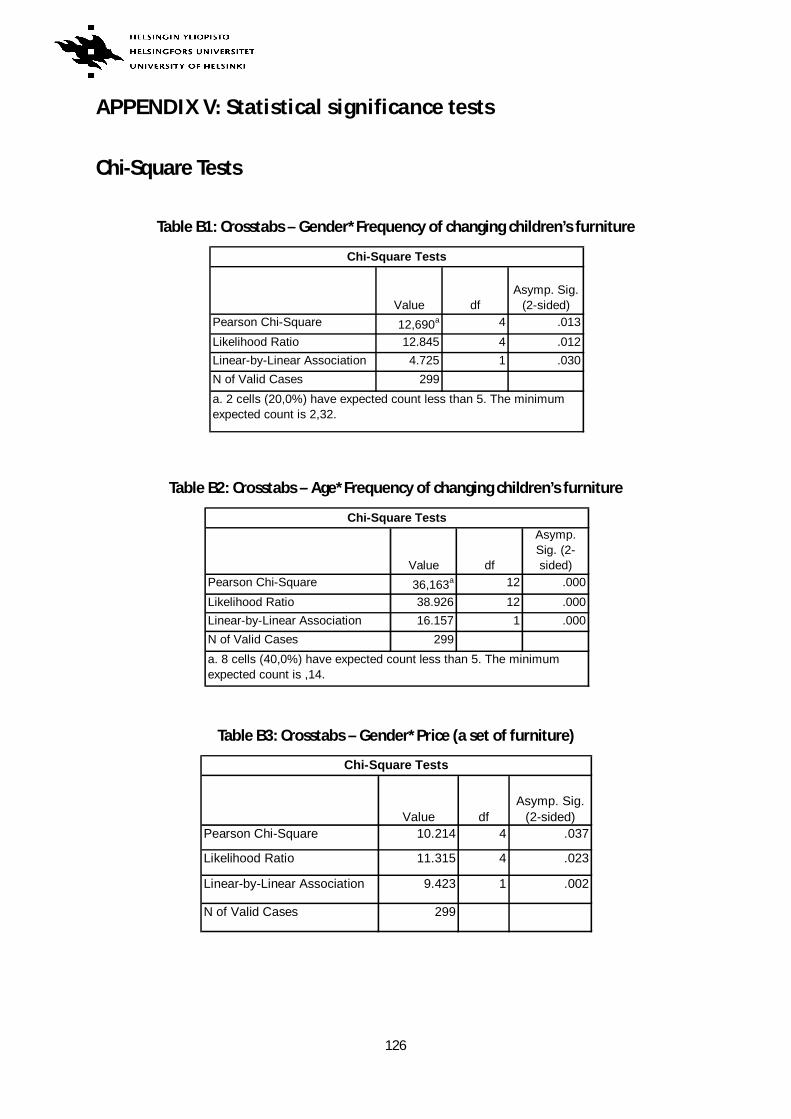
126
APPENDIX V Statistical significance tests
Chi-Square Tests
Table B1: Crosstabs – Gender*Frequency of changing children’s furniture
Table B2: Crosstabs – Age*Frequency of changing children’s furniture
Table B3: Crosstabs – Gender*Price (a set of furniture)
Value dfAsymp. Sig.
(2-sided)Pearson Chi-Square 12,690a 4 .013Likelihood Ratio 12.845 4 .012Linear-by-Linear Association 4.725 1 .030N of Valid Cases 299
Chi-Square Tests
a. 2 cells (20,0%) have expected count less than 5. The minimumexpected count is 2,32.
Value df
Asymp.Sig. (2-sided)
Pearson Chi-Square 36,163a 12 .000Likelihood Ratio 38.926 12 .000Linear-by-Linear Association 16.157 1 .000N of Valid Cases 299a. 8 cells (40,0%) have expected count less than 5. The minimumexpected count is ,14.
Chi-Square Tests
Value df
Asymp. Sig.(2-sided)
Pearson Chi-Square 10.214 4 .037
Likelihood Ratio 11.315 4 .023
Linear-by-Linear Association 9.423 1 .002
N of Valid Cases 299
Chi-Square Tests
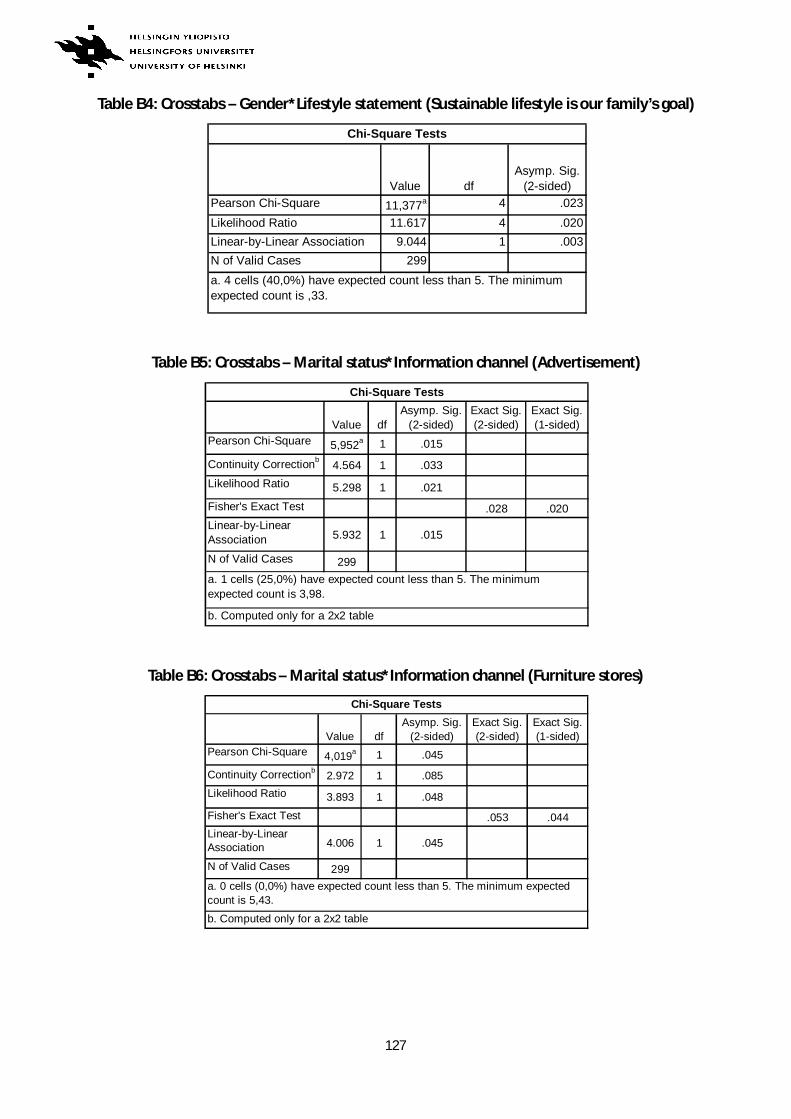
127
Table B4: Crosstabs – Gender*Lifestyle statement (Sustainable lifestyle is our family’s goal)
Table B5: Crosstabs – Marital status*Information channel (Advertisement)
Table B6: Crosstabs – Marital status*Information channel (Furniture stores)
Value dfAsymp. Sig.
(2-sided)Pearson Chi-Square 11,377a 4 .023Likelihood Ratio 11.617 4 .020Linear-by-Linear Association 9.044 1 .003N of Valid Cases 299
Chi-Square Tests
a. 4 cells (40,0%) have expected count less than 5. The minimumexpected count is ,33.
Value dfAsymp. Sig.
(2-sided)Exact Sig.(2-sided)
Exact Sig.(1-sided)
Pearson Chi-Square 5,952a 1 .015
Continuity Correctionb 4.564 1 .033Likelihood Ratio 5.298 1 .021Fisher's Exact Test .028 .020Linear-by-LinearAssociation 5.932 1 .015
N of Valid Cases 299
Chi-Square Tests
a. 1 cells (25,0%) have expected count less than 5. The minimumexpected count is 3,98.
b. Computed only for a 2x2 table
Value dfAsymp. Sig.
(2-sided)Exact Sig.(2-sided)
Exact Sig.(1-sided)
Pearson Chi-Square 4,019a 1 .045
Continuity Correctionb 2.972 1 .085Likelihood Ratio 3.893 1 .048
Fisher's Exact Test .053 .044Linear-by-LinearAssociation 4.006 1 .045
N of Valid Cases 299
Chi-Square Tests
a. 0 cells (0,0%) have expected count less than 5. The minimum expectedcount is 5,43.
b. Computed only for a 2x2 table
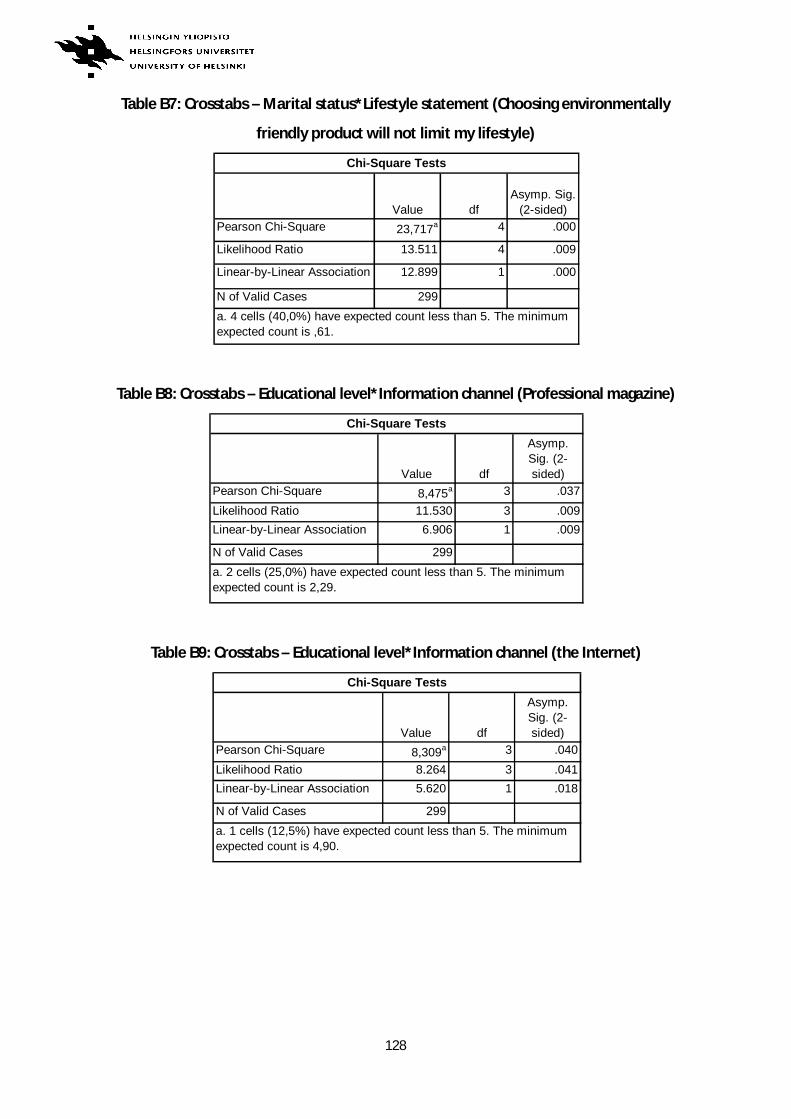
128
Table B7: Crosstabs – Marital status*Lifestyle statement (Choosing environmentally
friendly product will not limit my lifestyle)
Table B8: Crosstabs – Educational level*Information channel (Professional magazine)
Table B9: Crosstabs – Educational level*Information channel (the Internet)
Value dfAsymp. Sig.
(2-sided)Pearson Chi-Square 23,717a 4 .000
Likelihood Ratio 13.511 4 .009
Linear-by-Linear Association 12.899 1 .000
N of Valid Cases 299
Chi-Square Tests
a. 4 cells (40,0%) have expected count less than 5. The minimumexpected count is ,61.
Value df
Asymp.Sig. (2-sided)
Pearson Chi-Square 8,475a 3 .037Likelihood Ratio 11.530 3 .009Linear-by-Linear Association 6.906 1 .009
N of Valid Cases 299
Chi-Square Tests
a. 2 cells (25,0%) have expected count less than 5. The minimumexpected count is 2,29.
Value df
Asymp.Sig. (2-sided)
Pearson Chi-Square 8,309a 3 .040Likelihood Ratio 8.264 3 .041Linear-by-Linear Association 5.620 1 .018
N of Valid Cases 299
Chi-Square Tests
a. 1 cells (12,5%) have expected count less than 5. The minimumexpected count is 4,90.
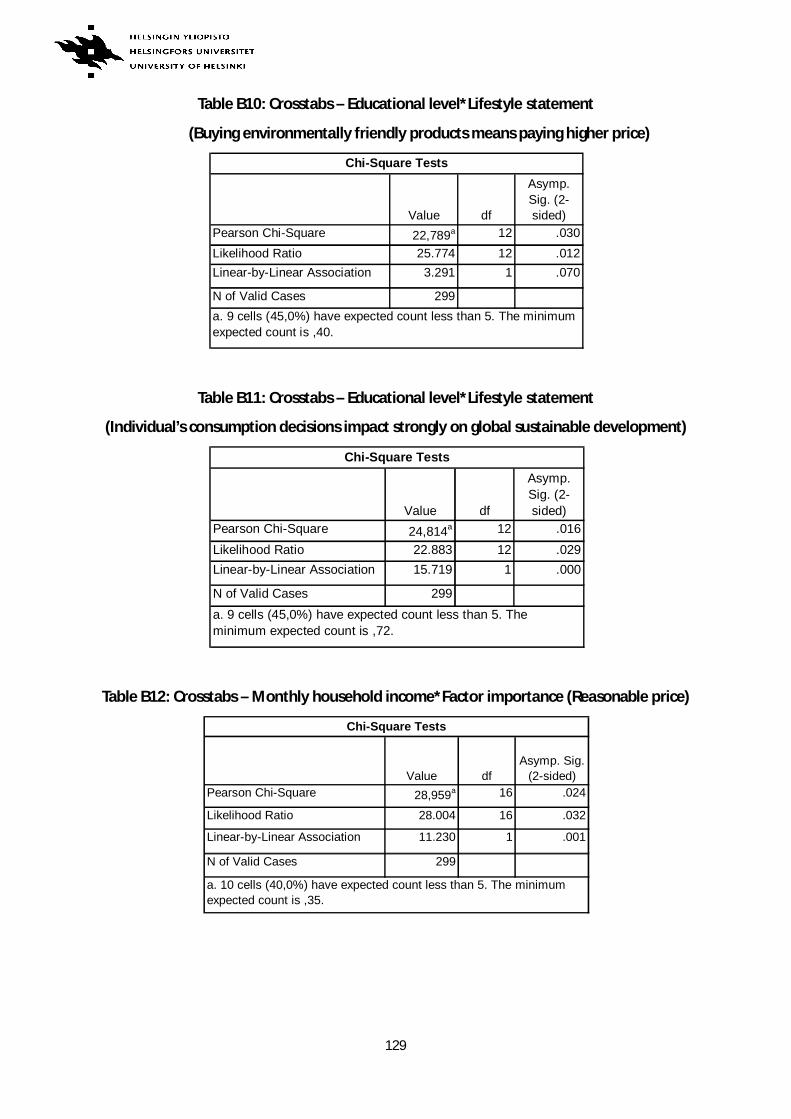
129
Table B10: Crosstabs – Educational level*Lifestyle statement
(Buying environmentally friendly products means paying higher price)
Table B11: Crosstabs – Educational level*Lifestyle statement
(Individual’s consumption decisions impact strongly on global sustainable development)
Table B12: Crosstabs – Monthly household income*Factor importance (Reasonable price)
Value df
Asymp.Sig. (2-sided)
Pearson Chi-Square 22,789a 12 .030Likelihood Ratio 25.774 12 .012Linear-by-Linear Association 3.291 1 .070
N of Valid Cases 299
Chi-Square Tests
a. 9 cells (45,0%) have expected count less than 5. The minimumexpected count is ,40.
Value df
Asymp.Sig. (2-sided)
Pearson Chi-Square 24,814a 12 .016Likelihood Ratio 22.883 12 .029Linear-by-Linear Association 15.719 1 .000
N of Valid Cases 299
Chi-Square Tests
a. 9 cells (45,0%) have expected count less than 5. Theminimum expected count is ,72.
Value dfAsymp. Sig.
(2-sided)Pearson Chi-Square 28,959a 16 .024
Likelihood Ratio 28.004 16 .032
Linear-by-Linear Association 11.230 1 .001
N of Valid Cases 299
Chi-Square Tests
a. 10 cells (40,0%) have expected count less than 5. The minimumexpected count is ,35.
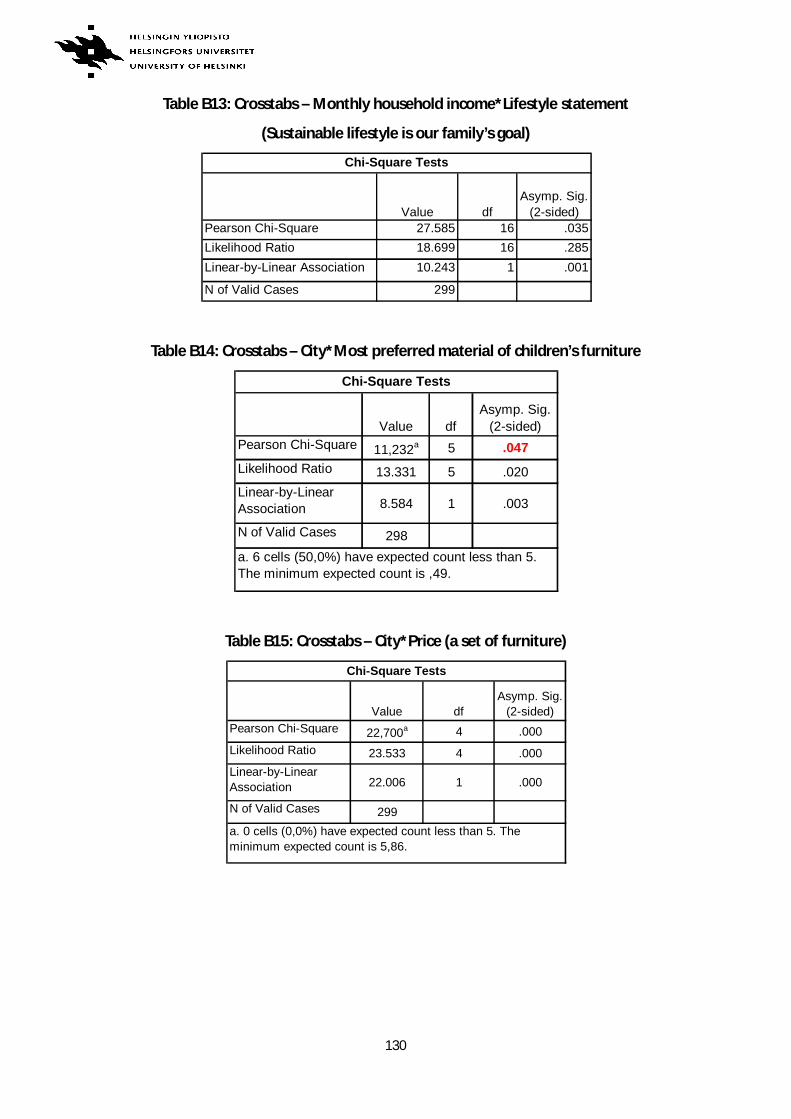
130
Table B13: Crosstabs – Monthly household income*Lifestyle statement
(Sustainable lifestyle is our family’s goal)
Table B14: Crosstabs – City*Most preferred material of children’s furniture
Table B15: Crosstabs – City*Price (a set of furniture)
Value df
Asymp. Sig.(2-sided)
Pearson Chi-Square 27.585 16 .035Likelihood Ratio 18.699 16 .285Linear-by-Linear Association 10.243 1 .001
N of Valid Cases 299
Chi-Square Tests
Value dfAsymp. Sig.
(2-sided)Pearson Chi-Square 11,232a 5 .047Likelihood Ratio 13.331 5 .020Linear-by-LinearAssociation 8.584 1 .003
N of Valid Cases 298a. 6 cells (50,0%) have expected count less than 5.The minimum expected count is ,49.
Chi-Square Tests
Value dfAsymp. Sig.
(2-sided)Pearson Chi-Square 22,700a 4 .000Likelihood Ratio 23.533 4 .000Linear-by-LinearAssociation 22.006 1 .000
N of Valid Cases 299
Chi-Square Tests
a. 0 cells (0,0%) have expected count less than 5. Theminimum expected count is 5,86.
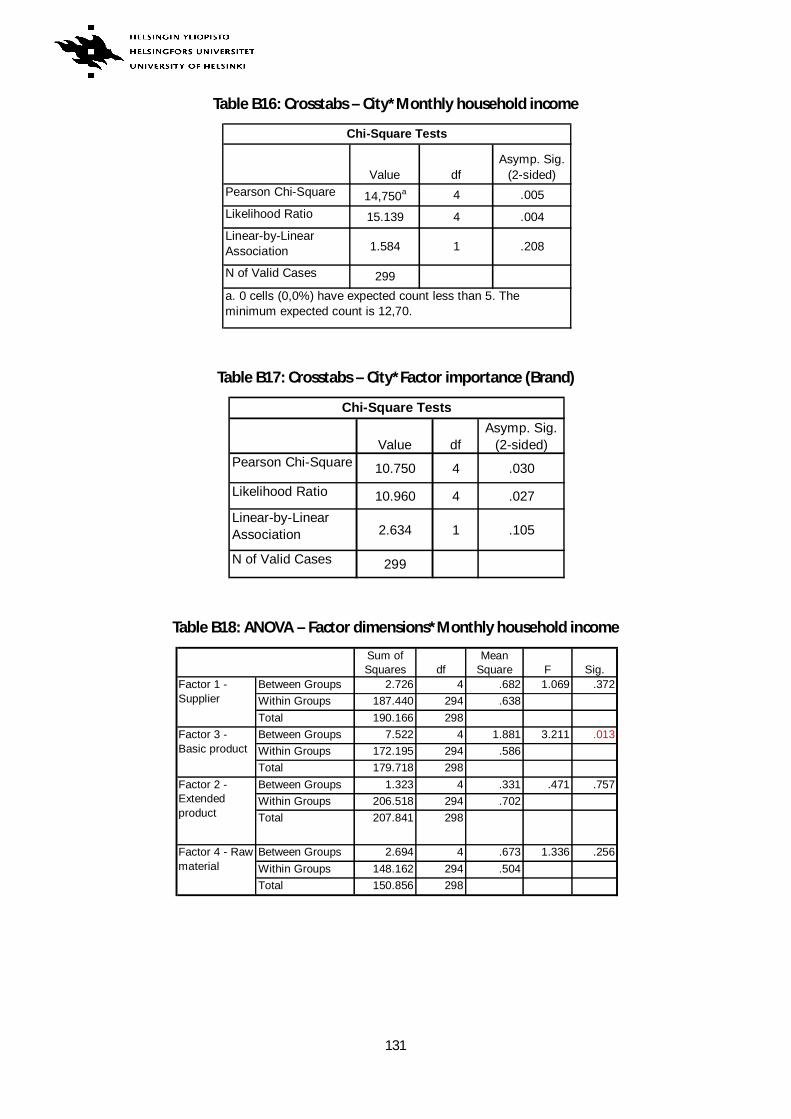
131
Table B16: Crosstabs – City*Monthly household income
Table B17: Crosstabs – City*Factor importance (Brand)
Table B18: ANOVA – Factor dimensions*Monthly household income
Value dfAsymp. Sig.
(2-sided)Pearson Chi-Square 14,750a 4 .005Likelihood Ratio 15.139 4 .004Linear-by-LinearAssociation 1.584 1 .208
N of Valid Cases 299
Chi-Square Tests
a. 0 cells (0,0%) have expected count less than 5. Theminimum expected count is 12,70.
Value dfAsymp. Sig.
(2-sided)Pearson Chi-Square 10.750 4 .030
Likelihood Ratio 10.960 4 .027Linear-by-LinearAssociation 2.634 1 .105
N of Valid Cases 299
Chi-Square Tests
Sum ofSquares df
MeanSquare F Sig.
Between Groups 2.726 4 .682 1.069 .372Within Groups 187.440 294 .638Total 190.166 298Between Groups 7.522 4 1.881 3.211 .013Within Groups 172.195 294 .586Total 179.718 298Between Groups 1.323 4 .331 .471 .757Within Groups 206.518 294 .702Total 207.841 298
Between Groups 2.694 4 .673 1.336 .256Within Groups 148.162 294 .504Total 150.856 298
Factor 2 -Extendedproduct
Factor 4 - Rawmaterial
Factor 1 -Supplier
Factor 3 -Basic product
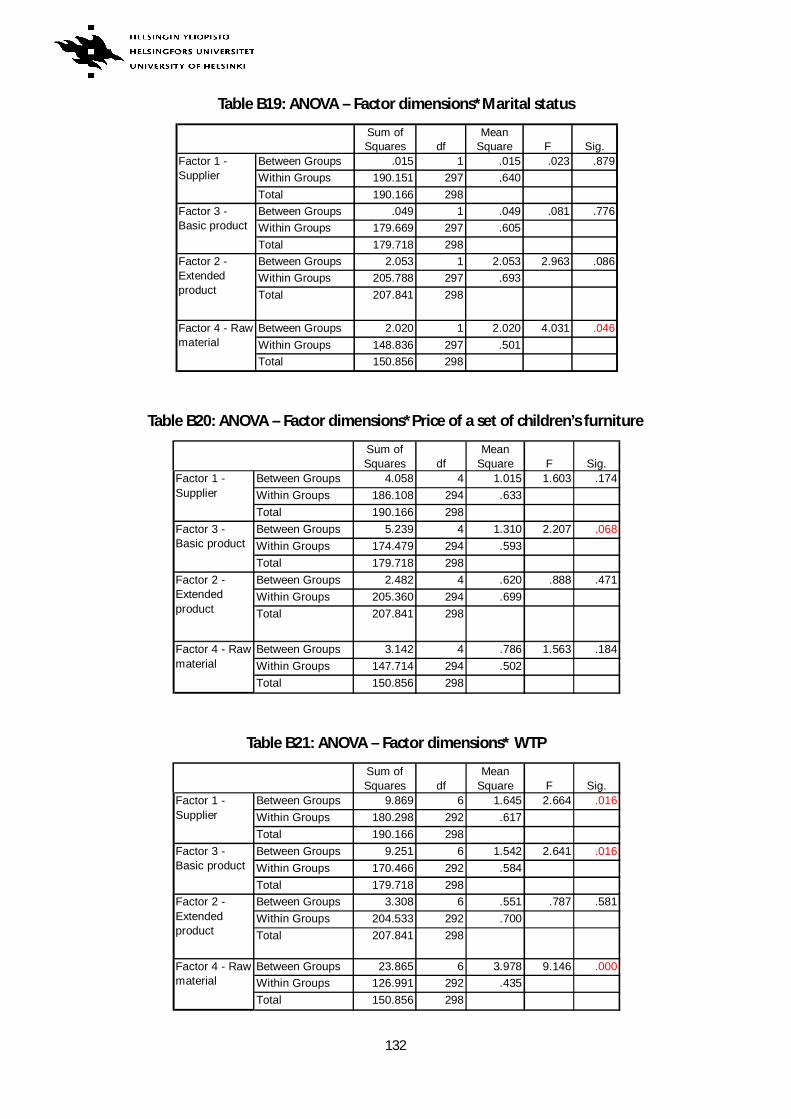
132
Table B19: ANOVA – Factor dimensions*Marital status
Table B20: ANOVA – Factor dimensions*Price of a set of children’s furniture
Table B21: ANOVA – Factor dimensions* WTP
Sum ofSquares df
MeanSquare F Sig.
Between Groups .015 1 .015 .023 .879Within Groups 190.151 297 .640Total 190.166 298Between Groups .049 1 .049 .081 .776Within Groups 179.669 297 .605Total 179.718 298Between Groups 2.053 1 2.053 2.963 .086Within Groups 205.788 297 .693Total 207.841 298
Between Groups 2.020 1 2.020 4.031 .046Within Groups 148.836 297 .501Total 150.856 298
Factor 4 - Rawmaterial
Factor 1 -Supplier
Factor 3 -Basic product
Factor 2 -Extendedproduct
Sum ofSquares df
MeanSquare F Sig.
Between Groups 4.058 4 1.015 1.603 .174Within Groups 186.108 294 .633Total 190.166 298Between Groups 5.239 4 1.310 2.207 .068Within Groups 174.479 294 .593Total 179.718 298Between Groups 2.482 4 .620 .888 .471Within Groups 205.360 294 .699Total 207.841 298
Between Groups 3.142 4 .786 1.563 .184Within Groups 147.714 294 .502Total 150.856 298
Factor 1 -Supplier
Factor 3 -Basic product
Factor 2 -Extendedproduct
Factor 4 - Rawmaterial
Sum ofSquares df
MeanSquare F Sig.
Between Groups 9.869 6 1.645 2.664 .016Within Groups 180.298 292 .617Total 190.166 298Between Groups 9.251 6 1.542 2.641 .016Within Groups 170.466 292 .584Total 179.718 298Between Groups 3.308 6 .551 .787 .581Within Groups 204.533 292 .700Total 207.841 298
Between Groups 23.865 6 3.978 9.146 .000Within Groups 126.991 292 .435Total 150.856 298
Factor 2 -Extendedproduct
Factor 4 - Rawmaterial
Factor 1 -Supplier
Factor 3 -Basic product
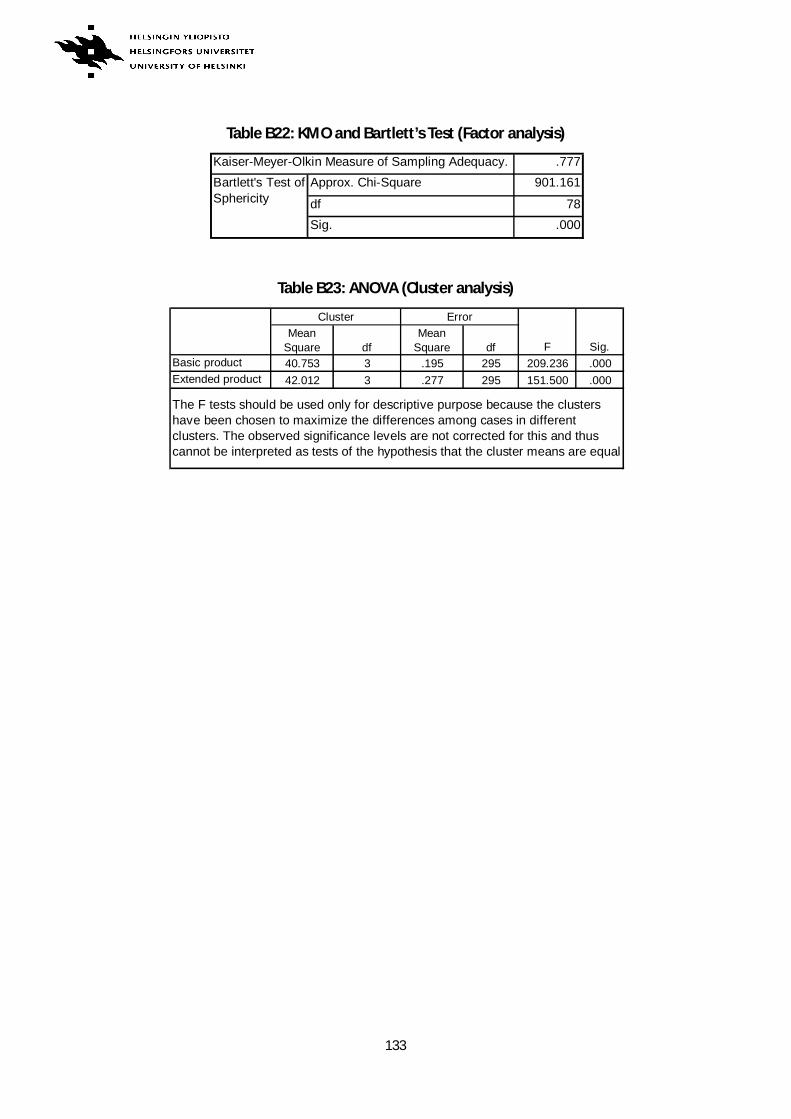
133
Table B22: KMO and Bartlett’s Test (Factor analysis)
Table B23: ANOVA (Cluster analysis)
.777Approx. Chi-Square 901.161
df 78Sig. .000
Kaiser-Meyer-Olkin Measure of Sampling Adequacy.Bartlett's Test ofSphericity
MeanSquare df
MeanSquare df
Basic product 40.753 3 .195 295 209.236 .000Extended product 42.012 3 .277 295 151.500 .000
Cluster Error
F Sig.
The F tests should be used only for descriptive purpose because the clustershave been chosen to maximize the differences among cases in differentclusters. The observed significance levels are not corrected for this and thuscannot be interpreted as tests of the hypothesis that the cluster means are equal
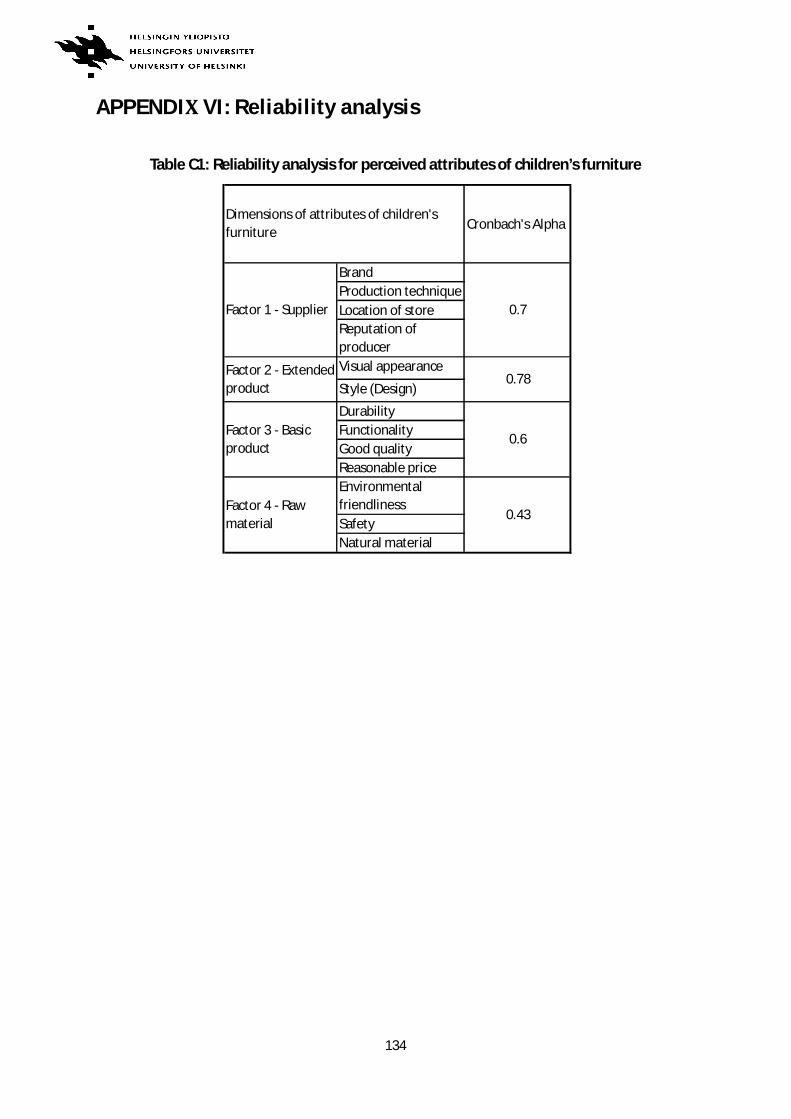
134
APPENDI VI: Reliability analysis
Table C1: Reliability analysis for perceived attributes of children’s furniture
Cronbach's Alpha
BrandProduction techniqueLocation of storeReputation ofproducerVisual appearance
Style (Design)
DurabilityFunctionalityGood qualityReasonable priceEnvironmentalfriendlinessSafetyNatural material
0.7
0.78
0.6
0.43
Dimensions of attributes of children'sfurniture
Factor 2 - Extendedproduct
Factor 1 - Supplier
Factor 4 - Rawmaterial
Factor 3 - Basicproduct