construction and building materials - ugrgrupo179/pdf/constr build mat 2013.pdf · porous...
TRANSCRIPT

Construction and Building Materials 41 (2013) 868–878
Contents lists available at SciVerse ScienceDirect
Construction and Building Materials
journal homepage: www.elsevier .com/locate /conbui ldmat
Evaluation of the petrophysical properties of sedimentary building stones in orderto establish quality criteria
P. Vázquez a,b,⇑, F.J. Alonso b, L. Carrizo b, E. Molina c, G. Cultrone c, M. Blanco d, I. Zamora d
a Groupe d’Etudes sur les Géomatériaux et les Environnements Naturels, Anthropiques et Archéologiques (GEGENAA, EA 3795), Université de Reims Champagne – Ardenne, Centre deRecherches en Environnement et Agronomie, 2, Esplanade Roland Garros, 51100 Reims, Franceb Department of Geology, University of Oviedo. C/Jesús Arias de Velasco s/n, 33005 Oviedo, Asturias, Spainc Department of Mineralogy and Petrology, University of Granada, Avda. Fuentenueva s/n, 18002 Granada, Spaind Department of Earth Sciences, University of Zaragoza, C/Pedro Cerbuna 12, 50009 Zaragoza, Spain
h i g h l i g h t s
" Stones are divided in low, intermediate and high quality." Limestones with high porosity and low coherence show low quality." Sandstones with similar porosity but different composition show intermediate quality." Stones with low porosity show the highest quality." Differences in composition and pore distribution influence the quality.
a r t i c l e i n f o
Article history:Received 4 April 2012Received in revised form 30 November 2012Accepted 19 December 2012
Keywords:Sedimentary stonesPetrographyPorous systemPetrophysical propertiesDurability
0950-0618/$ - see front matter � 2013 Elsevier Ltd. Ahttp://dx.doi.org/10.1016/j.conbuildmat.2012.12.026
⇑ Corresponding author at: Groupe d’Etudes suEnvironnements Naturels, Anthropiques et ArchéoloUniversité de Reims Champagne – Ardenne, Centre dment et Agronomie, 2, Esplanade Roland Garros, 5110026 77 36 85; fax: +33 (0)3 26 77 36 94.
E-mail address: [email protected] (P.
a b s t r a c t
Porous sedimentary stones are frequently used in the construction of many different kinds of buildings. Inorder to assess the quality of each stone as a building material, it is important to analyse its particularpetrographic characteristics and physical properties, as these affect its behaviour when exposed to agentsof decay. We selected six stone types with different petrophysical characteristics that are commonly usedas construction materials in Spain. Two limestones with high porosity and notable textural differencesperformed worst. The bioclastic limestone from Santa Pudia showed poor mechanical behaviour, whilethe micritic limestone from Huesca had the worst response to water flow. Two sandstones performedbetter. They had medium porosity, a similar texture and certain differences in composition. The calcare-ous sandstone from Uncastillo performed worse in terms of hydric and mechanical behaviour and con-sequently is less durable than the siliciclastic sandstone from Villaviciosa. The highest quality stones,in terms of their hydric behaviour and mechanical properties are the crystalline dolostone from Boñarand the travertine from Albox, both of which have relatively low porosity.
� 2013 Elsevier Ltd. All rights reserved.
1. Introduction texture) and especially to their porous system. It is therefore very
Porous sedimentary stones have been used as building materi-als throughout history. They are easy to work, are readily availableon the earth’s surface and have a high aesthetic value at a relativelylow cost. However, when exposed to the environment they fre-quently perform worse than crystalline stones with low porosity[1,2]. This is largely due to their petrography (mineralogy and
ll rights reserved.
r les Géomatériaux et lesgiques (GEGENAA, EA 3795),
e Recherches en Environne-Reims, France. Tel.: +33 (0)3
Vázquez).
important to find out how these characteristics affect stone decay,so that we can reasonably predict how each stone will perform whenused in construction [3–5]. For example, clay minerals, which arepresent as cementing material in many sedimentary stones [6,7],can cause powdering and swelling phenomena when they interactwith water [8]. Textural anisotropy is another factor that can influ-ence stone decay [9,10]. The detection of the presence of clay miner-als is therefore vital when it comes to laying the stones correctly inthe building so as to prevent flaking and spalling.
Water is a crucial weathering agent, both when stationary in-side the stone and when in circulation [11–14]. The characteristicsof the porous system affect the way the water flows through thestone. Different physical and chemical reactions take placedepending on the stone composition (i.e., the presence of swelling

P. Vázquez et al. / Construction and Building Materials 41 (2013) 868–878 869
clays or of preferred orientation planes). When comparing the de-cay in different stones, the most important factor to assess is theporous system. By analysing the stone’s hydric properties we canbetter understand the way water circulates through the poroussystem, and how this affects the decay of the stone [15–20].
The decay suffered by the construction and decorative materialsused in our buildings is often caused by environmental agents,which may be of natural origin or produced by humans [21]. Forthis reason, when choosing a particular building stone we mustalso consider its ability to resist attack by decay agents [22,23].Accelerated ageing tests are a practical way of observing materialdecay in a short space of time, a process which under normal envi-ronmental conditions would take years [24]. These are normallycycle-based tests carried out in the laboratory with varying dura-tion and complexity. Unfortunately, in most cases the decay isnot produced by one single agent but results from a combinationof two or more factors [25]. The ageing test we used does not al-ways enable researchers to observe and characterise the decay,due to the short testing time and the variables measured, such asthe variation in wave propagation parameters [26,27], or surfacevariations [28]. It is therefore not easy to select which decay testshould be carried out to assess the quality of a particular stone.Moreover, they only give an approximate reproduction of the nat-ural conditions to which the stones are exposed [29,30]. Despitethese drawbacks, this is currently the only standard method thatallows us to compare decay in different stones. Another way of pre-dicting stone durability is through petrophysical characterisation,an indirect way of relating the stone’s physical properties to itspetrography [31–34]. This is possible thanks to the extensive bib-liography and the experience acquired during research into thedamage suffered by these kinds of stone in buildings [35–37].
The aim of this research is to determine the best petrophysicalparameters to enable us to predict the durability of these porousbuilding stones. We selected six types of sedimentary stone. Theydiffer in terms of both mineralogy (limestones and sandstones)and texture (granular, micritic and crystalline) and therefore havedifferent porous systems. These stones are good examples of thewide range of stones used in building in different parts of Spain[38]. We made petrographic and physical characterisations andcompared the results with those obtained in salt crystallisationand freeze–thaw ageing tests. The parameters thus obtained wereused to establish quality criteria for building materials, taking intoaccount the relation between the parameters, the complexity ofthe data and their importance in decay processes.
2. Description of the materials
Six stone types were selected on the basis of petrographic crite-ria from a wide variety of ornamental stones used in buildings thatbelong to Spain’s architectural heritage. Geographical distribution,geological setting and differences in the environment were alsoimportant criteria in the selection process. In the end we selectedVillaviciosa sandstone (AV) and Boñar dolostone (DB) from the Can-tabrian area, Uncastillo sandstone (AU) and Fraga limestone (CF)from the Ebro basin and Santa Pudia limestone (SP) and Albox trav-ertine (TA) from the Betic Cordillera (Fig. 1). Samples were selectedand monitored during their extraction and preparation in the quar-ry in order to maintain the same orientation during our studies.
2.1. Geographical and geological framework
Villaviciosa sandstone (AV), known commercially as La Marinasandstone, comes from Asturias (N Spain). This sandstone datesfrom the Upper Jurassic Age and has been quarried and used inbuilding-work historically. This formation has a heterogeneous
lithology with alternating grey and yellow sandstones in layersof variable width (1–4 m), together with marlstones, shales andlimestones. The samples we studied belong to the grey variety[39]. This stone is mainly used locally, in restoration work inVillaviciosa and Gijón (Asturias), although it has also been usedin some new constructions. A number of important historicalbuildings were built with this sandstone including the Revillagige-do Palace and the Laboral University in Gijón, and the churches ofSanta Maria de la Oliva and Santa María de Valdedios, both inVillaviciosa.
Uncastillo sandstone (AU) dates back to the Lower Miocene Ageand originates from the village of the same name near Zaragoza (NESpain) in the northern part of the Ebro Valley region. This formationis composed of clay and sandstone alternating in sinusoidal patches.The sandstone layers vary in width (1–3 m) and facies can be distin-guished by grain size [40]. The specimens we studied had medium-sized grains. This stone can be found in Roman monuments in thearea around Uncastillo (Los Bañales baths and the Los Atilios mau-soleum), and in mediaeval and other buildings in the region.
Fraga limestone (CF), also named Campanil limestone, is quar-ried close to Huesca (NE Spain). This stone formed in the LowerMiocene is located in the centre-east of the Ebro basin together withbioclastic limestones and marlstones, typical of lacustrine environ-ments. Limestones are found in subhorizontal beds, of around 1 min width, with organic matter and intercalated with grey marlstones[40]. This stone has been used in both religious and secular build-ings and is frequently combined with other materials.
Santa Pudia limestone (SP) is quarried in Escuzar, Granada, inthe Granada basin (S Spain), a depression that forms an intra-mountain Neogene basin. Calcareous lithoarenites and bioclasticlimestones from the Miocene age outcrop on its southern and east-ern edges [41]. This stone is a whitish calcarenite with coarsegrains and high porosity. It is easy to work and as a result has beenwidely used in the historic buildings of Granada, such as the cathe-dral, the palace of Carlos V in the Alhambra and the Royal Hospital.Today it is mainly used in restoration work.
Boñar dolostone (DB) is quarried close to León (N Spain). Thisstone dates back to the Upper Cretaceous. The formation is locatedin the Cantabrian area and runs East–West. It has limestones, marl-stones and in the upper part, crystalline dolostones. These dolo-stones appear in 80 cm banks, and have an earthy aspect andslight differences in colour and compactness [42]. This stone iswidely used all over Spain in ancient and modern constructions.Good examples are León cathedral, the church of San Marcos andthe palace of Los Guzmanes.
Albox travertine (TA) originates in Albox, Almeria, (S Spain) andis also known as Travertino Amarillo or Travertino Oro. This stonebelongs to the Pleistocenic travertines located in the north of theAlbox depression, in the intern Betic area related to paleo-sourcesassociated with faults [43]. The samples we studied were brownishin colour, and had prominent bands and high porosity that wasclearly visible when the rock was cut perpendicular to the bands.Travertines are frequently used as ornamental stone in Granada’shistorical buildings.
3. Methodology
Petrography involves the macroscopic and microscopic analysis of stones in or-der to assess their mineralogy and texture (including the porous system) [44,45].Special attention is paid to the minerals and to the distribution and orientation ofthe pores.
3.1. Chemical and petrographic properties
Chemical composition was determined by X-ray fluorescence (Philips PW2404,XRF), while the mineralogical composition of bulk samples and clay content (i.e.,fraction with grain size below 2 lm) was obtained by X-ray diffraction (Philips

Fig. 1. Geographic location of the rocks: Villaviciosa sandstone (AV) and Boñar dolostone (DB) from the Cantabrian area, Uncastillo sandstone (AU) and Fraga limestone (CF)from the Ebro basin, and Santa Pudia limestone (SP) and Albox travertine (TA) from the Betic Cordillera.
870 P. Vázquez et al. / Construction and Building Materials 41 (2013) 868–878
X’PERT PRO, XRD). The powder diffraction method was used for the mineralogicalanalysis of the powder selected from 200 g of bulk samples. Oriented aggregateswere prepared for the study of the clay fraction in which carbonates were elimi-nated using a 0.2 N acetic acid solution and a Kubota 2000 centrifuge was used toseparate the fraction below 2 lm. The working conditions were Cu Ka radiation(k = 1.5405 Å), a voltage of 40 kV and current intensity of 40 mA. The goniometerspeed was 0.1 2h/s and the angle ranged from 4 to 70� 2h for the bulk samples,and 4 to 30� 2h for the clay fraction. Diffraction data were recorded and interpretedusing the XPowder program [46]. Residual Insoluble content (RI) was determinedafter dissolution in hydrochloric acid at 10%.
We analysed the pore system at different scales using three different methods:macroscopic observation (>1 mm), polarized optical microscopy (Zeiss Jenapol,POM) (1 mm to 10 lm) and scanning electron microscopy (Jeol-6100, SEM) witha carbon-coated polished thin section (<10 lm). From the textural model, pore typecan be defined in relation to its distribution, abundance, shape and size [44]. As re-gards size, we measured the diameter of the pores by direct observation, which isexpressed with the centil maximum DM and mode Dm. Pore access radii were ob-tained using a Hg intrusion porosimeter (MIP) Micromeritics Autopore III 9410,which reaches 414 MPa pressure and can measure pore radii sizes from 0.003 to360 lm. Three samples of each stone type were analysed. The distribution curvesenabled us to calculate median pore access radius (Rm), the dispersion coefficient(Cd) and the percentage of pores in three different pore access radius ranges, large(>10 lm), medium (10–0.1 lm) and small (<0.1 lm) [47,48]. Dispersion coefficient(Cd) measures size range amplitude around the median including 50% of the sam-ples and it is expressed in order of magnitude.
3.2. Physical properties
The tests were carried out on nine cubes of 5 � 5 � 5 cm for each stone type.Real and apparent density and total and open porosity were obtained using differ-ent techniques. Real density (qr) was determined theoretically from the mineralcomposition of each stone:
qr ¼Xðci � piÞ=100 ðkg=m3Þ
where ‘‘ci’’ is the mineral percentage and ‘‘pi’’ is the mineral density for each mineral‘‘i’’ of the stone.
Apparent density (qb) was calculated using geometrical methods based on thevolume of the specimens (ISRM 1979) [47]. Open porosity (po) and once moreapparent density (qb) were calculated using the hydrostatic method, followingthe UNE-EN 1936 standard [48]:
qb ¼ mo=ðms �mhÞ � qa ðkg=m3Þ
po ¼ ððms �moÞ=ðms �mhÞÞ � 100 ð%Þ
where ‘‘mo’’ is the dry weight of the specimen, ‘‘ms’’ is the saturation weight, ‘‘mh’’ isthe hydrostatic weight (immersed in water) and ‘‘qa’’ the water density.
Total (p) and closed porosity (pc) were calculated as follows:
p ¼ ððqr � qbÞ=qrÞ � 100 ð%Þ
pc ¼ p� po ð%Þ
We also carried out of the following hydric tests: free and forced water absorp-tion, drying, capillary absorption and water vapour permeability. Forced waterabsorption was obtained following the UNE-EN 1936 standard [48], which enablesus to calculate the saturation degree of water content (ws). The free water absorp-tion test was performed according to the UNE-EN 13755 standard [49] and dryingaccording to the NORMAL 29/88 standard [50]. These tests provide informationabout water content and saturation as a function of time.
The capillary rise test was carried out according to the UNE-EN 1925 standard[51]. This test allows us to determine the capillary absorption coefficient (C) andcapillary penetration (B). These values were obtained from the linear behaviour ob-served when the square root of time was plotted against the capillary absorption ofeach stone over the first hour of the test. The theoretical penetration coefficient (BT)was also obtained from a model of cylindrical capillary pores [16]:
BT ¼ C=po ðmm=s1=2Þ
where ‘‘C’’ is the capillary coefficient and ‘‘po’’ is the open porosity.The water vapour permeability test was carried out according to the NORMAL
21/85 [52] standard. The coefficient (Kv) was determined. Water vapour transferis linear and variations in weight were measured over one week.
Water absorption and drying tests were carried out on six cubic specimens(5 � 5 � 5 cm) per stone; the capillary rise test was performed on three specimenswith similar dimensions but with different orientations (x and y parallel to thestratification and selected random); the water vapour permeability test was per-formed on 9 tablets measuring 5 � 5 � 1 cm, three in each direction.
Two mechanical parameters relating to hardness and resistance to reboundwere also obtained. For the Shore hardness test, we used 4 slabs measuring8 � 8 � 2 cm of each of the six stone types and 64 indents were made at equidistantpoints in each slab [53]. The Schmidt hardness test was carried out using a hammertype L with low energy impact (0.735 N m) on a plate of 16 � 16 � 2 cm, and 25measurements were taken at equidistant points [54]. As the slabs were not verythick, some samples broke before the tests had finished. The hardness is measuredby the height of rebound after each blow of the hammer. We then calculated theaverage value and the standard deviation in order to enable us to characterise thecomparative hardness of the different materials.
Freeze–thaw and salt crystallization are among the most frequently used labo-ratory tests in our field of research because they reproduce the effects of some ofthe most common decay agents affecting historical buildings and because theycan cause damage after just a few cycles in weak stones [55,56]. Four 5-cm sidecubes per stone were used for each test. In the case of the freeze–thaw test, whichassesses the effect of ice on the stones when temperature oscillates around 0� caus-ing alternate freezing and thawing, 25 cycles were performed according to the EN12371 standard [57]. In the case of the salt crystallization test, which studies the
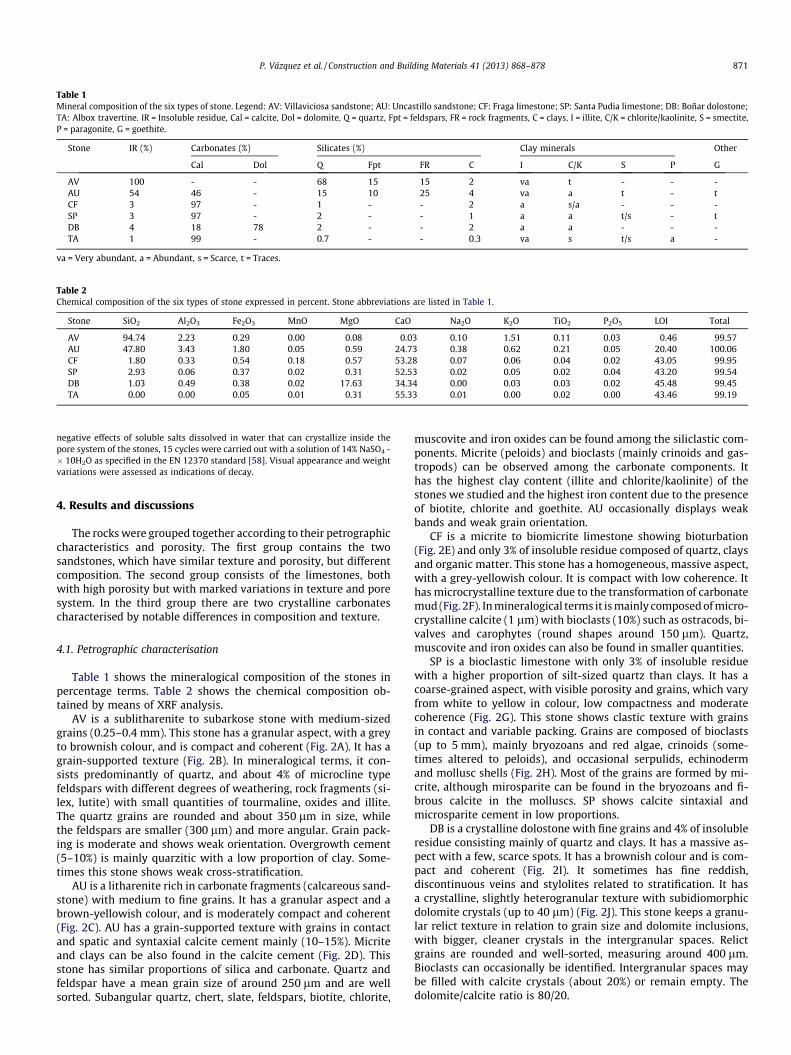
Table 1Mineral composition of the six types of stone. Legend: AV: Villaviciosa sandstone; AU: Uncastillo sandstone; CF: Fraga limestone; SP: Santa Pudia limestone; DB: Boñar dolostone;TA: Albox travertine. IR = Insoluble residue, Cal = calcite, Dol = dolomite, Q = quartz, Fpt = feldspars, FR = rock fragments, C = clays, I = illite, C/K = chlorite/kaolinite, S = smectite,P = paragonite, G = goethite.
Stone IR (%) Carbonates (%) Silicates (%) Clay minerals Other
Cal Dol Q Fpt FR C I C/K S P G
AV 100 - - 68 15 15 2 va t - - -AU 54 46 - 15 10 25 4 va a t - tCF 3 97 - 1 - - 2 a s/a - - -SP 3 97 - 2 - - 1 a a t/s - tDB 4 18 78 2 - - 2 a a - - -TA 1 99 - 0.7 - - 0.3 va s t/s a -
va = Very abundant, a = Abundant, s = Scarce, t = Traces.
Table 2Chemical composition of the six types of stone expressed in percent. Stone abbreviations are listed in Table 1.
Stone SiO2 Al2O3 Fe2O3 MnO MgO CaO Na2O K2O TiO2 P2O5 LOI Total
AV 94.74 2.23 0.29 0.00 0.08 0.03 0.10 1.51 0.11 0.03 0.46 99.57AU 47.80 3.43 1.80 0.05 0.59 24.73 0.38 0.62 0.21 0.05 20.40 100.06CF 1.80 0.33 0.54 0.18 0.57 53.28 0.07 0.06 0.04 0.02 43.05 99.95SP 2.93 0.06 0.37 0.02 0.31 52.53 0.02 0.05 0.02 0.04 43.20 99.54DB 1.03 0.49 0.38 0.02 17.63 34.34 0.00 0.03 0.03 0.02 45.48 99.45TA 0.00 0.00 0.05 0.01 0.31 55.33 0.01 0.00 0.02 0.00 43.46 99.19
P. Vázquez et al. / Construction and Building Materials 41 (2013) 868–878 871
negative effects of soluble salts dissolved in water that can crystallize inside thepore system of the stones, 15 cycles were carried out with a solution of 14% NaSO4 -� 10H2O as specified in the EN 12370 standard [58]. Visual appearance and weightvariations were assessed as indications of decay.
4. Results and discussions
The rocks were grouped together according to their petrographiccharacteristics and porosity. The first group contains the twosandstones, which have similar texture and porosity, but differentcomposition. The second group consists of the limestones, bothwith high porosity but with marked variations in texture and poresystem. In the third group there are two crystalline carbonatescharacterised by notable differences in composition and texture.
4.1. Petrographic characterisation
Table 1 shows the mineralogical composition of the stones inpercentage terms. Table 2 shows the chemical composition ob-tained by means of XRF analysis.
AV is a sublitharenite to subarkose stone with medium-sizedgrains (0.25–0.4 mm). This stone has a granular aspect, with a greyto brownish colour, and is compact and coherent (Fig. 2A). It has agrain-supported texture (Fig. 2B). In mineralogical terms, it con-sists predominantly of quartz, and about 4% of microcline typefeldspars with different degrees of weathering, rock fragments (si-lex, lutite) with small quantities of tourmaline, oxides and illite.The quartz grains are rounded and about 350 lm in size, whilethe feldspars are smaller (300 lm) and more angular. Grain pack-ing is moderate and shows weak orientation. Overgrowth cement(5–10%) is mainly quarzitic with a low proportion of clay. Some-times this stone shows weak cross-stratification.
AU is a litharenite rich in carbonate fragments (calcareous sand-stone) with medium to fine grains. It has a granular aspect and abrown-yellowish colour, and is moderately compact and coherent(Fig. 2C). AU has a grain-supported texture with grains in contactand spatic and syntaxial calcite cement mainly (10–15%). Micriteand clays can be also found in the calcite cement (Fig. 2D). Thisstone has similar proportions of silica and carbonate. Quartz andfeldspar have a mean grain size of around 250 lm and are wellsorted. Subangular quartz, chert, slate, feldspars, biotite, chlorite,
muscovite and iron oxides can be found among the siliclastic com-ponents. Micrite (peloids) and bioclasts (mainly crinoids and gas-tropods) can be observed among the carbonate components. Ithas the highest clay content (illite and chlorite/kaolinite) of thestones we studied and the highest iron content due to the presenceof biotite, chlorite and goethite. AU occasionally displays weakbands and weak grain orientation.
CF is a micrite to biomicrite limestone showing bioturbation(Fig. 2E) and only 3% of insoluble residue composed of quartz, claysand organic matter. This stone has a homogeneous, massive aspect,with a grey-yellowish colour. It is compact with low coherence. Ithas microcrystalline texture due to the transformation of carbonatemud (Fig. 2F). In mineralogical terms it is mainly composed of micro-crystalline calcite (1 lm) with bioclasts (10%) such as ostracods, bi-valves and carophytes (round shapes around 150 lm). Quartz,muscovite and iron oxides can also be found in smaller quantities.
SP is a bioclastic limestone with only 3% of insoluble residuewith a higher proportion of silt-sized quartz than clays. It has acoarse-grained aspect, with visible porosity and grains, which varyfrom white to yellow in colour, low compactness and moderatecoherence (Fig. 2G). This stone shows clastic texture with grainsin contact and variable packing. Grains are composed of bioclasts(up to 5 mm), mainly bryozoans and red algae, crinoids (some-times altered to peloids), and occasional serpulids, echinodermand mollusc shells (Fig. 2H). Most of the grains are formed by mi-crite, although mirosparite can be found in the bryozoans and fi-brous calcite in the molluscs. SP shows calcite sintaxial andmicrosparite cement in low proportions.
DB is a crystalline dolostone with fine grains and 4% of insolubleresidue consisting mainly of quartz and clays. It has a massive as-pect with a few, scarce spots. It has a brownish colour and is com-pact and coherent (Fig. 2I). It sometimes has fine reddish,discontinuous veins and stylolites related to stratification. It hasa crystalline, slightly heterogranular texture with subidiomorphicdolomite crystals (up to 40 lm) (Fig. 2J). This stone keeps a granu-lar relict texture in relation to grain size and dolomite inclusions,with bigger, cleaner crystals in the intergranular spaces. Relictgrains are rounded and well-sorted, measuring around 400 lm.Bioclasts can occasionally be identified. Intergranular spaces maybe filled with calcite crystals (about 20%) or remain empty. Thedolomite/calcite ratio is 80/20.

Fig. 2. (A) Villaviciosa sandstone (AV), macroscopic aspect; (B) microscopic image (POM, crossed polars, �10). AV is a siliciclastic sandstone (subarkose to sublitharenite)with medium-sized grains; (C) Uncastillo sandstone (AU), macroscopic aspect; (D) microscopic image (POM, crossed polars, �10). AU is a calcareous sandstone (litharenite)with medium to fine grains; (E) Fraga limestone (CF), macroscopic aspect; (F) microscopic image (POM, crossed polars, �10). CF is a micrite to biomicrite limestone, withostracods and carophytes; (G) Santa Pudia limestone (SP) macroscopic aspect; (H) microscopic image (POM, crossed polars, �10). SP is a bioclastic limestone (biosparite tobiorrudite), with bryozoa and red algae; (I) Boñar dolostone (DB) macroscopic aspect; (J) microscopic image (POM, crossed polars,�10). DB is a crystalline dolostone with finecrystals (40 lm); (K) Albox travertine (TA) macroscopic aspect; and (L) microscopic image (POM, crossed polars, �10). TA is a heterogranular crystalline limestone typetravertine.
872 P. Vázquez et al. / Construction and Building Materials 41 (2013) 868–878
TA is a heterogranular crystalline limestone-type travertinewith 1% of insoluble residue composed mainly of quartz. This stonehas a yellow-brownish colour, low compactness and high coher-ence (Fig. 2K). It has an anisotropic crystalline texture with bandsof different colour and composition alternating with large elon-gated, oriented pores. TA has grains of different shapes and sizes(micrite, sparite, fibrous) (Fig. 2L). The crystals have an average sizeof 300 lm, and appear either elongated in bands or filling pores.There are also areas with dark crystals due to plant precursorsand Mg and Fe oxides/hydroxides. Very fine stratification surfaceswith silt-sized quartz crystals and muscovite can be observed.
4.2. Density and porous system
Table 3 shows the real density, calculated theoretically, and theapparent density and the open porosity obtained using the hydro-
static method. With density values we then calculated total andclosed porosity. In TA only the geometric method values were con-sidered as water can drop quickly by gravity in the largest poresmaking it impossible to measure using the hydrostatic method. Ta-ble 4 shows the different parameters of the porous system ob-tained by direct observation and mercury porosimetry, and thepercentage of pores in three different pore access radius ranges,large (>10 lm), medium (10–0.1 lm) and small (<0.1 lm).
Of the six stones, DB has the highest real density, as might beexpected due to the high density of dolomite (2860 kg/m3). The den-sity values for the limestones were similar to that of calcite (2710 kg/m3). Due to its high iron mineral content (see Table 2), the densityvalue for AU was closer to that of limestone than AV, which haddensity values in line with its quartz content (2650 kg/m3).
Apparent density is related to porosity. DB has the highestvalues due to its high real density and low porosity. SP shows

Table 3Density and porosity (average and standard deviation of nine specimens for each stone type).
Stone Density (kg/m3) Porosity (%)
Real density (qr) Apparent density (qb) Total porosity (p) Open porosity (po) Closed porosity (pc)
AV 2648 2130 ± 3 19.6 ± 0.1 19.5 ± 0.2 0.1 ± 0.1AU 2708 2084 ± 11 23.0 ± 0.4 22.6 ± 0.3 0.4 ± 0.1CF 2694 1901 ± 15 29.4 ± 0.5 29.3 ± 0.5 0.1 ± 0.2SP 2710 1741 ± 6 35.8 ± 0.2 35.7 ± 0.3 0.1 ± 0.1DB 2820 2509 ± 9 11.0 ± 0.3 10.9 ± 0.3 0.1 ± 0.1TA 2710 2323 ± 8 14.3 ± 0.4 11.2 ± 0.1a 3.1 ± 0.4b
Stone abbreviations are listed in Table 1.a Excluding open pores in which water flows quickly by gravity.b Including closed and open pores in which water flows quickly by gravity.
P. Vázquez et al. / Construction and Building Materials 41 (2013) 868–878 873
the lowest apparent density due to its high porosity. Open porosity(accessible to water) varies between 10 and 35% and closed poros-ity is very low in all these stone types. TA has large well-connectedmillimetric pores in which water flows freely by gravity, or closed(unconnected) pores.
The sandstones showed intermediate porosity levels (�20%). AVhas intergranular pores with a mode size of about 0.2 mm, withmoderate communication due to partial cementation. The distribu-tion of the pore access radii is unimodal with the median at 8 lmand low dispersion (Cd: 0.9). AV shows a slight trend to higher val-ues (Fig. 3A), with a predominance of medium (9.4%) and large (8%)pore access radii over small ones (2.1%).
AU has intergranular pores with a mode size of about 0.1 mm,although smaller, well-connected pores associated with micriteare also present. The distribution of pore radii is also unimodalwith a median of 6 lm and low dispersion (Cd: 0.7). There is aslight predominance of small sizes (Fig. 3A), which is indicativeof the gradual transition from intergranular pores to matrix pores.The percentage of pore access radii in the medium range (1.5%) ishigher than in the large (4.9%) and small ranges (1.6%).
Limestones show the highest porosity (�30–35%) and high poretype variability. CF shows moldic pores, sometimes expanded bydissolution to a diameter of 1 mm, together with matrix pores,which also expanded so producing good connection. Distributionis unimodal with a median at 0.2 lm and low dispersion (Cd:0.4). This stone shows a slight trend to large pores in relation tomatrix porosity overgrowth (Fig. 3B). Medium pore access sizespredominate (24.6%) over small (4%) and large ones (0.7%).
SP shows intergranular pores of around 1 mm, larger moldicpores of up to 4 mm, small intergranular pores (0.1 mm) and gen-erally well-connected matrix porosity. Pore access radius distribu-tion is bimodal with a mode at 70 lm, which belongs tointergranular pores, and another mode at 0.2 lm in relation tointragranular and matrix porosity with a median of 1 lm(Fig. 3B). Dispersion was therefore wide (Cd: 1.85), with a predom-inance of medium-sized (19.8%) and large (>10.4%) pore access ra-dii and relatively few small ones (3.4%). This stone is slightly more
Table 4Porous system parameters. Stone abbreviations are listed in Table 1. Pore diameter by diintrusion porosimetry: median (Rm), variation coefficient (Cd). Range amplitude around th
Stone Pore diameter (mm) Mercury intrusion porosimetry
Pore access radii (lm) Dispersion c
DM Dm Rm Cd
AV 0.5 0.2 8 0.94AU 0.2 0.1 6 0.73CF 1 0.5 0.2 0.41SP 4 1 1 1.85DB 0.1 0.05 0.09 0.72TA 5 2 0.07 0.91
a Contains some pores bigger than the maximum threshold for mercury intrusion por
porous than other calcarenites from the same area used as orna-mental stone in Andalusia, but all are characterised by a bimodalpore size distribution [59,60].
DB has low porosity (�10%), the largest pores are intergranularin relation to the relict texture and are always smaller than0.1 mm. DB also shows intercrystalline pores of less than 10 lmwith poor interconnection. The pore access radius distribution isunimodal with a small median (0.09 lm), low dispersion (Cd: 0.7)and a slight trend towards smaller sizes due to the intercrystallineporosity (Fig. 3C). Small pore access radii are more common (7.6%)than medium (2.8%) and large (0.4%).
TA has low porosity (�15%) with pores of variable size, rangingfrom elongated pores and millimetric capillaries concentrated inbands to small equidimensional pores with good distribution. Porecommunication is weak due to the calcite disposed as palisade,which closes the pore surface. The pore access radii distributionis bimodal (Fig. 3C), with one peak of large pores (80 lm), the cap-illaries, and another peak of small pores (0.02 lm), which are prob-ably intercrystalline spaces, where water flow is limited. Most ofthe larger pores are out of range of mercury intrusion porosimetry,which explains why most pore access radii fall within the lowrange (0.07 lm) and prevail small pores (4.6%) rather than themedium (2.5%) and large ranges (>0.8%). Travertines are heteroge-neous stones, and porosity levels between 8% and 21% can be foundin the same extraction area. The pore access radii determined byMIP also vary with peaks from 0.02 to 1 lm [63].
4.3. Hydric properties
Absorption and drying tests were used to evaluate the kineticsof water flow within the stones over the course of a week(Fig. 4). Table 5 shows the water content and the degree of satura-tion after the first hour and at the end of the test.
CF and SP show high water absorption due to the fact that theyhave the highest porosity (�30–35%) and the largest pore size (1–4 mm). These stones have the best connected pores. As a result, ini-tial absorption is very fast and saturation reaches high values at the
rect observation: centil (DM), mode (Dm). Pore access radii calculated using mercurye median which includes 50% of the population.
oefficient Size distribution. Absolute (relative) porosity
>10 10–0.1 <0.1 Total
8.0 (41%) 9.4 (48%) 2.1 (11%) 19.5 ± 0.64.9 (27%) 11.5 (64%) 1.6 (9%) 18.0 ± 1.40.7 (2.5%) 24.6 (84%) 4.0 (13.5%) 29.1 ± 0.2
10.4 (31%)a 19.8 (59%) 3.4 (10%) 33.5 ± 1.00.3 (3%) 5.7 (52%) 5.0 (45%) 10.6 ± 2.90.8 (10%)a 2.5 (31.5%) 4.6 (58.5%) 7.9 ± 1.5
osimetry.

Fig. 3. Distribution of pore access radii obtained using a mercury intrusionporosimeter: (A) Villaviciosa sandstone (AV) and Uncastillo sandstone (AU), (B)Fraga limestone (CF) and Santa Pudia limestone (SP), and (C) Boñar dolostone (DB)and Albox travertine (TA).
Fig. 4. Curves of water absorption above and desorption below, showing theevolution of water content (w) against time (t1/2) for the six stone types: SantaPudia limestone (SP), Fraga limestone (CF), Uncastillo sandstone (AU) and Villavic-iosa sandstone (AV), Albox travertine (TA) and Boñar dolostone (DB).
874 P. Vázquez et al. / Construction and Building Materials 41 (2013) 868–878
beginning of the test (CF: 84% SP: 68% during the first hour). Inaddition, both limestones have small matrix pores (3.6% and 4%).Consequently the absorption continues increasing slowly for morethan one week (saturation after one week is 93% and 80%). As re-gards drying, due to the good connection between the pores, thesestones are almost completely dry and in equilibrium with their
environment by the fifth day (0.05–0.02%) and show the lowestwater content at the end of the test. Similar absorption and desorp-tion values for calcarenite were found by Urosevic et al. [60] in astone with similar porosity values.
The two sandstones had similar porosity (�20%) and pore sizedistribution. However, they behaved differently. AU waterabsorption is double that of AV, fast at the beginning but witha slower rate over the week (AU is 72% vs. AV 41%). This differ-ence is attributed to the fact that AU is a calcareous sandstonewith micrite in the carbonatic fraction, matrix pores and a high-er proportion of medium-sized pore access radii (AU is 14.4%and AV is 9.4%), which enhance the capillary processes. Duringdrying the two stones behave similarly: most of the water is lostduring the two first days, they reach equilibrium after the fifthday and they have similar water content at the end of the test(0.15%).
TA and DB absorb less water and their initial absorption isslower and more prolonged than in the other stones. Absorptionin TA is faster than in DB. TA has large pores (80 lm) with somewell-connected fractions, which explains the initial absorption,and other pores that are too small for water to enter (0.05 lm).DB has smaller pores (50 lm) than TA, with larger pore access(0.1 lm) and high porosity in the medium range. This justifiesthe slow but constant absorption. During drying the two stones be-have in similar fashion. Their low porosity, small pore access radiiand low number of medium-range pores produce a poorly inter-connected system, which explains the slow evaporation and thehigh water content in these stones at the end of the test (0.25%).The variability in the pore size distribution and connectivity oftravertines leads to huge differences in water absorption results,compared with stones from the same source [60] or from othercountries [61].
Table 6 shows capillary water absorption and water vapour per-meability coefficients. The samples were tested in the three direc-tions, and although some anisotropy trends were observed, thestandard deviation between samples did not allow us to confirm
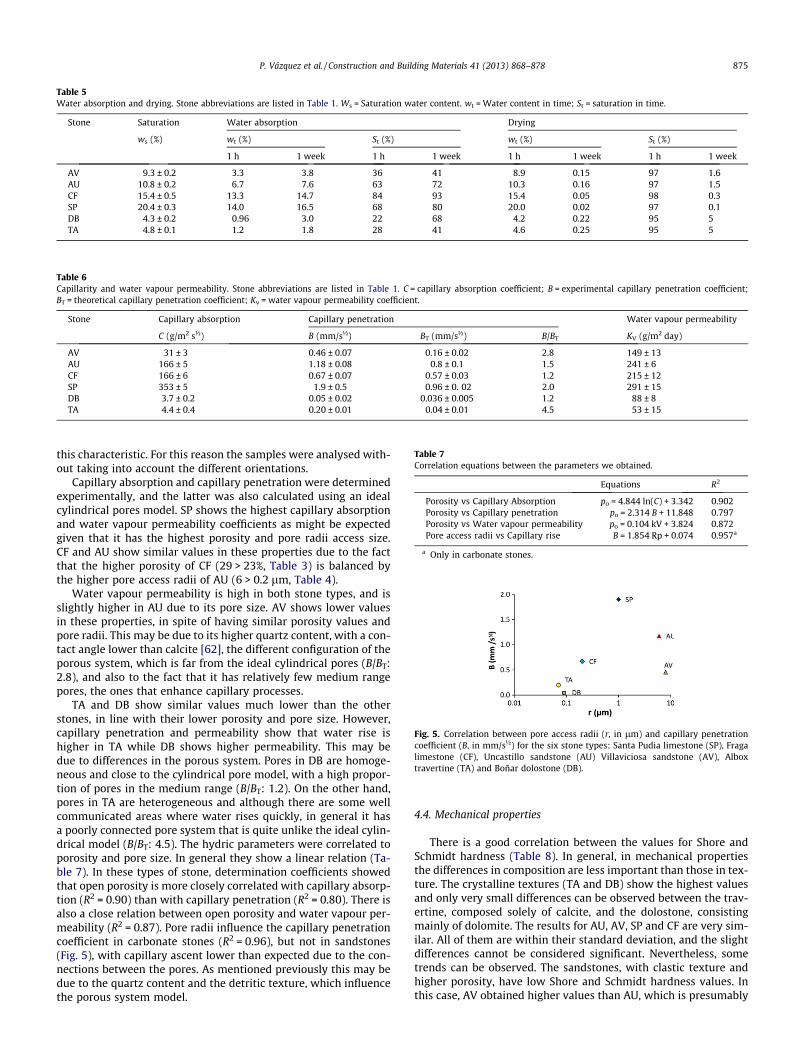
Table 5Water absorption and drying. Stone abbreviations are listed in Table 1. Ws = Saturation water content. wt = Water content in time; St = saturation in time.
Stone Saturation Water absorption Drying
ws (%) wt (%) St (%) wt (%) St (%)
1 h 1 week 1 h 1 week 1 h 1 week 1 h 1 week
AV 9.3 ± 0.2 3.3 3.8 36 41 8.9 0.15 97 1.6AU 10.8 ± 0.2 6.7 7.6 63 72 10.3 0.16 97 1.5CF 15.4 ± 0.5 13.3 14.7 84 93 15.4 0.05 98 0.3SP 20.4 ± 0.3 14.0 16.5 68 80 20.0 0.02 97 0.1DB 4.3 ± 0.2 0.96 3.0 22 68 4.2 0.22 95 5TA 4.8 ± 0.1 1.2 1.8 28 41 4.6 0.25 95 5
Table 6Capillarity and water vapour permeability. Stone abbreviations are listed in Table 1. C = capillary absorption coefficient; B = experimental capillary penetration coefficient;BT = theoretical capillary penetration coefficient; Kv = water vapour permeability coefficient.
Stone Capillary absorption Capillary penetration Water vapour permeability
C (g/m2 s½) B (mm/s½) BT (mm/s½) B/BT KV (g/m2 day)
AV 31 ± 3 0.46 ± 0.07 0.16 ± 0.02 2.8 149 ± 13AU 166 ± 5 1.18 ± 0.08 0.8 ± 0.1 1.5 241 ± 6CF 166 ± 6 0.67 ± 0.07 0.57 ± 0.03 1.2 215 ± 12SP 353 ± 5 1.9 ± 0.5 0.96 ± 0. 02 2.0 291 ± 15DB 3.7 ± 0.2 0.05 ± 0.02 0.036 ± 0.005 1.2 88 ± 8TA 4.4 ± 0.4 0.20 ± 0.01 0.04 ± 0.01 4.5 53 ± 15
Table 7Correlation equations between the parameters we obtained.
Equations R2
Porosity vs Capillary Absorption po = 4.844 ln(C) + 3.342 0.902Porosity vs Capillary penetration po = 2.314 B + 11.848 0.797Porosity vs Water vapour permeability po = 0.104 kV + 3.824 0.872Pore access radii vs Capillary rise B = 1.854 Rp + 0.074 0.957a
a Only in carbonate stones.
Fig. 5. Correlation between pore access radii (r, in lm) and capillary penetrationcoefficient (B, in mm/s½) for the six stone types: Santa Pudia limestone (SP), Fragalimestone (CF), Uncastillo sandstone (AU) Villaviciosa sandstone (AV), Alboxtravertine (TA) and Boñar dolostone (DB).
P. Vázquez et al. / Construction and Building Materials 41 (2013) 868–878 875
this characteristic. For this reason the samples were analysed with-out taking into account the different orientations.
Capillary absorption and capillary penetration were determinedexperimentally, and the latter was also calculated using an idealcylindrical pores model. SP shows the highest capillary absorptionand water vapour permeability coefficients as might be expectedgiven that it has the highest porosity and pore radii access size.CF and AU show similar values in these properties due to the factthat the higher porosity of CF (29 > 23%, Table 3) is balanced bythe higher pore access radii of AU (6 > 0.2 lm, Table 4).
Water vapour permeability is high in both stone types, and isslightly higher in AU due to its pore size. AV shows lower valuesin these properties, in spite of having similar porosity values andpore radii. This may be due to its higher quartz content, with a con-tact angle lower than calcite [62], the different configuration of theporous system, which is far from the ideal cylindrical pores (B/BT:2.8), and also to the fact that it has relatively few medium rangepores, the ones that enhance capillary processes.
TA and DB show similar values much lower than the otherstones, in line with their lower porosity and pore size. However,capillary penetration and permeability show that water rise ishigher in TA while DB shows higher permeability. This may bedue to differences in the porous system. Pores in DB are homoge-neous and close to the cylindrical pore model, with a high propor-tion of pores in the medium range (B/BT: 1.2). On the other hand,pores in TA are heterogeneous and although there are some wellcommunicated areas where water rises quickly, in general it hasa poorly connected pore system that is quite unlike the ideal cylin-drical model (B/BT: 4.5). The hydric parameters were correlated toporosity and pore size. In general they show a linear relation (Ta-ble 7). In these types of stone, determination coefficients showedthat open porosity is more closely correlated with capillary absorp-tion (R2 = 0.90) than with capillary penetration (R2 = 0.80). There isalso a close relation between open porosity and water vapour per-meability (R2 = 0.87). Pore radii influence the capillary penetrationcoefficient in carbonate stones (R2 = 0.96), but not in sandstones(Fig. 5), with capillary ascent lower than expected due to the con-nections between the pores. As mentioned previously this may bedue to the quartz content and the detritic texture, which influencethe porous system model.
4.4. Mechanical properties
There is a good correlation between the values for Shore andSchmidt hardness (Table 8). In general, in mechanical propertiesthe differences in composition are less important than those in tex-ture. The crystalline textures (TA and DB) show the highest valuesand only very small differences can be observed between the trav-ertine, composed solely of calcite, and the dolostone, consistingmainly of dolomite. The results for AU, AV, SP and CF are very sim-ilar. All of them are within their standard deviation, and the slightdifferences cannot be considered significant. Nevertheless, sometrends can be observed. The sandstones, with clastic texture andhigher porosity, have low Shore and Schmidt hardness values. Inthis case, AV obtained higher values than AU, which is presumably

Table 8Mechanical and dynamic properties. Stone abbreviations arelisted in Table 1.
Stone Shore value Schmidt value
AV 85 ± 5 13 ± 3AU 80 ± 3 12 ± 2CF 82 ± 6 13 ± 3a
SP 60 ± 16 11 ± 3a
DB 93 ± 2 19 ± 2b
TA 92 ± 7 20 ± 5b
a Sample broke early.b Sample broke late.
876 P. Vázquez et al. / Construction and Building Materials 41 (2013) 868–878
due to the differences in composition, with a higher presence ofcalcite in AU and of silicates in AV. The limestones (CF and SP)had similar composition and porous volume, so the differences be-tween them must be due to their texture and in particular theirgrain size. The lowest hardness values in both tests were measuredin SP, a rock with a very coarse-grained clastic texture. This rockhas poorly cemented grains, and is therefore susceptible to granu-lar disintegration, which explains why it had the lowest hardnessand coherence values.
4.5. Ageing test
After the tests, there were hardly any changes in the visualappearance of samples AV, AU, DB and TA. CF and SP suffered sub-stantial loss of material in both tests, although this effect was morepronounced in the salt crystallisation test.
Fig. 6A and B shows the histograms highlighting both the in-creases and decreases in weight (albeit minimal) in the six stones.In these histograms, each weight gain measured in a stone duringthe cycles for the freeze thaw (6A) and salt crystallization tests (6B)was added along the blue bar (labelled as G), while its weightlosses were added along the red bar (labelled as L). In this way,the length of each bar shows the sum of all the weight gained bysamples due to the crystallization of ice or salt inside pores and fis-sures during the tests, and the sum of all weight losses due to pres-sure from ice or salt crystallization that causes fragments of stoneto break off.
In the case of the freeze–thaw cycles (Fig. 6A), it is clear that SPis the stone that suffers most. The loss of material started with sur-face clasts and eventually reached almost 40% of its originalweight. Tests carried out by other researchers showed a range ofbehaviour, varying from substantial decay [26,59,63] to hardlyany change [64] Next comes CF, which lost up to 15% due to samplefragmentation. According to [65], the highest risk of serious decayin stones used in historical buildings is when pore throat size is be-tween 0.1 and 10 lm. In this study, CF is the stone with the highestproportion of this pore fraction, however SP shows more decay dueto its lack of cohesion. The other materials (apart from TA) behavesimilarly to each other with a gain of 2–3% due to the presence of
Fig. 6. Behaviour of the samples after freeze–thaw (A) and salt crystallization tests (B). Tstones and the weight loss after washing the samples at the end of salt crystallization tPudia limestone (SP), Fraga limestone (CF), Boñar dolostone (DB) and Albox travertine (
ice crystals in new pores and/or fissures followed by a very smallloss. In the case of TA the initial weight gain is followed by a lossmainly due to the water escaping from the big pores. The stonethat performed best was DB, which remained practically un-changed throughout the test, with only a small weight gain fol-lowed by a negligible loss. The weight of the sandstonesincreased, which means new fissures were formed. Although satu-ration increased, the good cementation between the minerals pre-vented decohesion and material loss. In summary, weight gainsclearly suggest that new fissures must have developed in all thestones. These are visible in CF and SP and evidenced by weight gainin TA, DB, AU and AV.
There were some differences in the salt crystallization test(Fig. 6B). SP and CF also fared worse than the other stones, but thistime CF was in last position as the only stone to gain almost 10% inweight and then lose almost the same amount. Tests developed by[59,64] in similar stones but with only 20% porosity revealed a gainof 2.5% during the first cycles and a slight loss thereafter. In SP theloss of material was in the form of isolated clasts and not in bigfragments as occurred in the freeze–thaw test. In CF the loss wasfocused on the surface in the form of consecutive layer detach-ments, giving the sample a rounded shape by the end of the test.This is due to the fact that SP had bigger pores, which were notas exposed to crystallisation pressure as the CF micropores. Atthe end of the test we submerged samples in distilled water towash off any salt trapped in the pores and/or fissures and to mea-sure their real weight loss (LS value, Fig. 6B). The dissolution ofsalts in water was controlled by a conductivity meter and washingwas repeated whenever the conductivity descended to values sim-ilar to that of distilled water. CF was the only stone to lose morethan 15% of its weight. AU also behaved differently. Although itapparently performed better than SP during the decay test, afterthe samples were washed it lost more fragments, due to the disso-lution of the salt that was acting as a cement between the grains.This behaviour was also observed by a previous author in granites[28]. The reason for the different behaviour of AU (broken) and AV(almost intact) lies in their hydric properties. AU absorbs water fas-ter than AV, so during immersion AU will have twice the watercontent and the salt will crystallise in more voids than in AV. AUalso has smaller pore radii and higher carbonate and clay content,which can also affect its durability. DB was once again the stonethat performed best.
Hence, when we compare Fig. 6A and B, it is evident that TA, DBand AV behave in a similar way in the two ageing tests becausealthough their weight changed, they did not suffer any visibledamage. The varying susceptibility to decay of the different sam-ples, in particular SP and CF, may be due to their texture and highporosity. In SP, the main decay factor is the low cohesion betweenthe clasts and in CF, its high percentage of pores around 0.2 lm,especially important in the case of the pressure exerted by crystal-lizing mirabilite. In fact, both stones had poor mechanical behav-iour, in that they broke quickly. Lastly, AU behaved differently in
he histograms show the total weight gain (G, in %) and loss (L, in %) suffered by theest (LS, in %). Legend: Villaviciosa sandstone (AV), Uncastillo sandstone (AU), SantaTA).

P. Vázquez et al. / Construction and Building Materials 41 (2013) 868–878 877
each test, suffering greater decay in the salt crystallization test.Compared to AV, which has similar structure, the determining fac-tor behind their different performance is their mineralogy. AU con-tains calcite cement, in which the dissolution rate in presence of asaline solution plays an important role in stone decay.
5. Conclusions
We carried out a petrophysical characterisation of six porousbuilding stones. A detailed petrographic characterisation in whichcompositional (petrography and mineralogy) and textural (grainsize, distribution) parameters and in particular porous systemproperties (volume, size, shape and distribution) were evaluated.Physical properties (density, porosity, hydric and mechanical prop-erties) were also determined. The relationship between the differ-ent parameters was also assessed and linked with the behaviour ofthe stone when subjected to ageing tests.
The stones can be divided into three main groups on the basis oftheir durability as construction materials: low quality (Santa Pudia– SP and Fraga limestones – CF), intermediate quality (Uncastillo –AU and Villaviciosa sandstones – AV) and high quality (travertinefrom Albox – TA and Boñar dolostone – DB).
The limestones (SP and CF) are quite similar in compositionwith high calcite content (97%) although, as accessory phases therewas predominance of quartz in SP and of clays in CF. Texturally,both stones are very different. SP is a bioclastic limestone withcoarse grains and CF is a micritic limestone. Both stones are lowquality mainly due to their high porosity (30–35%) and low coher-ence. As regards the porous system, SP shows large well-connectedinter- and intragranular pores and low cohesion, while CF has con-nected moldic and regrowth matrix pores with a size more favour-able to decay. As a result, SP has poor mechanical behaviour and CFresponds worse to ice and salt crystallisation. CF’s high degree ofsaturation (93%) and high pore proportion within the size rangemakes it the most susceptible to damage by salt crystallisation,and also more susceptible to salt-induced decay.
AV and AU sandstones have intermediate quality. The differ-ences between them are mainly due to their mineral composition,silicates and carbonates in AU and mainly silicates (quartz) in AV.Both stones have a clastic texture with medium grain size and sim-ilar pore system distribution, with around 20% porosity volume. AUhas a slightly lower pore size and pore radii access size than AV,due to the different content and nature of the cement betweenthe grains. In consequence, AU has a poorer response to water-re-lated decay than AV and also fares worse in the salt crystallisationand freeze–thaw tests.
TA and DB are the highest quality stones although there arehuge differences between them in terms of composition, textureand porous system. TA is formed by heterogeneous calcite grainswith a wide range of pore sizes and bad interconnections. In DBthe main component is dolomite with a homogeneous crystallinetexture and mainly intercrystalline porosity, characterised bysmall, homogeneous pores and pore radii access sizes. Neverthe-less, both stones have quite similar pore distribution. The highquality of these stones is due to their low porosity (10%), crystal-line texture and high coherence. The hydric behaviour is similardespite the differences in their petrographic characteristics. Theirhigh quality is confirmed by the results obtained for their mechan-ical properties. After the ageing tests, both stones remained almostundamaged.
The durability test cannot predict the behaviour of the stonewhen exposed to the environment. Nevertheless it is a useful toolfor comparing the durability of different stones, establishing theirquality in relative terms and assessing the best way to lay themwhen used in building. Petrophysical characterisation is essential
for predicting stone durability, and is useful even when comparingthe same kinds of stone as there may be differences in the poroussystem and the mineralogy.
Acknowledgments
This research has been supported by the Research Projects MEC:MAT 2008-06799-C03-01/02/03. We are grateful to Nigel Walking-ton for the English revision of the manuscript.
References
[1] Esbert RM, Ordaz J, Alonso FJ, Montoto M, González T, Álvarez M. Manual dediagnosis y tratamiento de materiales pétreos y cerámicos. Barcelona: Colegiode Aparejadores y Arquitectos Técnicos; 1997.
[2] Siegesmund S, Snethlage R. Stone in architecture. Springer; 2011.[3] Benavente D, García del Cura MA, Fort R, Ordónez S. Durability estimation of
porous building stones from pore structure and strength. Eng Geol2004;74:113–27.
[4] Alonso FJ, Esbert RM, Ordaz J, Vázquez P. Análisis del deterioro de losmateriales pétreos de edificación. ReCoPar 2006;3:23–32.
[5] Cultrone G, Russo LG, Calabro C, Urosevic M, Pezzino A. Influence of poresystem characteristics on limestone vulnerability: a laboratory study. EnvironGeol 2008;54:1271–81.
[6] Snethlage R, Wendler E. Moisture cycles and sandstone degradation. In: BaerNS, Snethlage R, editors. Saving our architectural heritage: the conservation ofhistoric stone structures. Chichester: John Wiley & Sons Ltd.; 1997. p. 7–24.
[7] Anania L, Badalà A, Barone G, Belfiore CM, Calabrò C, La Russa MF, et al. Thestones in monumental masonry buildings of the ‘‘Val di Noto’’ area: new dataon the relationships between petrographic characters and physical–mechanical properties. Constr Build Mater 2012;33:122–32.
[8] Sebastián E, Cultrone G, Benavente D, Linares Fernandez L, Elert K, RodriguezNavarro C. Swelling damage in clay-rich sandstones used in the church of SanMateo in Tarifa (Spain). J Cult Herit 2008;9:66–76.
[9] Rivas T, Prieto B, Silva B. Influence of rift and bedding plane on the physic-mechanical properties of granitic rocks. Implications for the deterioration ofgranitic monuments. Build Environ 2000;35:387–96.
[10] Beck K, Al-Mukhtar M, Rozenbaum O, Rautureau M. Characterization, watertransfer properties and deterioration in tuffeau: building material in the Loirevalley – France. Build Environ 2003;38:1151–62.
[11] Camuffo D. Microclimate for cultural heritage. Amsterdam: Elsevier; 1998.[12] Pender RJ. The behavior of water in porous building materials and structures.
Rev Conserv 2004;5:49–62.[13] Pavlík Z, Michálek P, Pavlíková M, Kopecká I, Maxová I, Cerny R. Water and salt
transport and storage properties of msené sandstone. Constr Build Mater2008;22:1736–48.
[14] Ruedrich J, Bartelsen T, Dohrmann R, Siegesmund S. Moisture expansion as adeterioration factor for sandstone used in buildings. Environ Earth Sci2011;63:1545–64.
[15] Santos TP, Vaz MF, Pinto ML, Carvalho AP. Porosity characterization of oldPortuguese ceramic tiles. Constr Build Mater 2012;28:104–10.
[16] Alonso FJ, Esbert RM, Ordaz J. Comportamiento hídrico de calizas y dolomías.Boletín Geológico y Minero 1987;98:555–76.
[17] Franzen C, Mirwald PW. Moisture content of natural stone: static and dynamicequilibrium with atmospheric humidity. Environ Geol 2004;46:391–401.
[18] Butenuth C, Hamm T, de Freitas MH. The kinetic response of rock to watervapour. Bull Eng Geol Environ 2004;63:179–89.
[19] Collet F, Bart M, Serres L, Miriel J. Porous structure and water vapour sorptionof hemp-based materials. Constr Build Mater 2008;22:1271–80.
[20] Zeki Karaca Z. Water absorption and dehydration of natural stones versustime. Constr Build Mater 2010;24:786–90.
[21] Charola AE. Stone deterioration in historic buildings and monuments. In:Proceedings of the 10th international congress on deterioration andconservation of stone, vol. 1; 2004. p. 3–14.
[22] Esbert RM, Montoto M, Ordaz J. Rock as construction material: durability,deterioration and conservation. Mater de Constr 1991;41:61–73.
[23] Benavente D, García del Cura MA, Fort R, Ordóñez S. Durability estimation ofporous building stones from pore structure and strength. Eng Geol2004;74:113–27.
[24] Cultrone G, Luque A, Sebastián E. Petrophysical and durability tests onsedimentary stones to evaluate their quality as building materials. Q J EngHydroge 2012. http://dx.doi.org/10.1144/1470-236/12-0.
[25] Weiss T, Siegesmund S, Kirchner D, Sippel J. Insolation weathering and hygricdilatation: two competitive factors in stone degradation. Environ Geol2004;46:402–13.
[26] Martínez-Martínez J, Benavente D, Gomez-Heras M, Marco-Castaño L. García-del-Cura MA non-linear decay of building stones during freeze–thawweathering processes. Constr Build Mater 2013;38:443–54.
[27] Martínez-Martínez J, Benavente D, García-del-Cura MA. Spatial attenuation:the most sensitive ultrasonic parameter for detecting petrographic featuresand decay processes in carbonate rocks. Eng Geol 2011;119(3–4):84–95.

878 P. Vázquez et al. / Construction and Building Materials 41 (2013) 868–878
[28] Vázquez P, Luque A, Alonso FJ, Grossi C.M., Surface changes on crystallinestones due to salt crystallization. Environ Earth Sci, in press.
[29] Török Á, Prikryl R. Current methods and future trends in testing, durabilityanalyses and provenance studies of natural stones used in historicalmonuments. Eng Geol 2010;115:139–42.
[30] Ruedrich J, Kirchner D, Siegesmund S. Physical weathering of building stonesinduced by freeze–thaw action: a laboratory long-term study. Environ EarthSci 2011;63:1573–86.
[31] Esbert RM, Alonso FJ, Ordaz J. La petrofísica en la interpretación del deterioro yla conservación de la piedra de edificación. Trabajos de Geología2008;28:87–95.
[32] Smith BJ, Gomez-Heras M, McCabe S. Understanding the decay of stone-builtcultural heritage. Prog Phys Geog 2008;32:439–61.
[33] Figueiredo MO, Silva TP, Veiga JP. Analysis of degradation phenomena inancient, traditional and improved building materials of historical monuments.Appl Phys A-Mater 2008;92:151–4.
[34] Veniale F, Setti M, Lodola S. Diagnosing stone decay in built heritage. Facts andperspectives. Mater Constr 2008;58(289–290):11–32.
[35] Tim P. Understanding the weathering behaviour of Caen stone. J ArchitConserv 2008;14:43–54.
[36] Graue B, Siegesmund S, Middendorf B. Quality assessment of replacementstones for the cologne cathedral: mineralogical and petrophysicalrequirements. Environ Earth Sci 2011;63:1799–822.
[37] Stück H, Siegesmund S, Rüdrich J. Weathering behaviour and constructionsuitability of dimension stones from the Drei Gleichen area (Thuringia,Germany). Environ Earth Sci 2011;63:1763–86.
[38] La piedra natural en España. RocMáquina. Bilbao; 2008.[39] Suárez del Río LM, Calleja L, Díez Sarriá I, Ruiz de Argandoña VG, Rodríguez Rey
A, Alonso FJ. Características tecnológicas de las rocas ornamentales deAsturias. Trabajos de Geología 2002;23:73–84.
[40] Buj O, Gisbert J. Caracterización petrofísica de tres variedades comerciales deareniscas miocenas del valle del Ebro. Mater Constr 2007;287:63–74.
[41] Braga JC, Martín JM, Alcalá B. Coral reefs in coarse-terrigenous sedimentaryenvironments (Upper Tortonian, Granada Basin, Southern Spain). SedimentGeol 1990;66:135–50.
[42] Gómez F, Méndez AJ, Bahamonde JR. La formación Boñar (Cretácico superior,norte de León): estratigrafía, geoquímica y potencial productor de rocaornamental. Rev de la Soc Geol de España 2003;16:61–71.
[43] García del Cura MA, La Iglesia A, Benavente D, Bernabéu A. Mineralogía de lostravertinos pleistocenos de Albox (Almería), importante recurso de materiaprima de rocas ornamentales. Macla 2007;7:89.
[44] Choquette P, y Pray LC. Geologic nomenclature and classification of porosity insedimentary carbonates. Am Ass Pet Geol Bull 1970;5:207–50.
[45] Tucker M. Sedimentary petrology. Oxford: Blackwell; 2001.[46] Martin JD. XPowder: a software package for powder X-ray diffraction analysis.
Lgl. Dep. GR 2004:1001/04.
[47] ISRM. Suggested methods for determining: water content, porosity density,absorption and related properties. Int J Rock Mech Min Sci 1979;16:143–56.
[48] UNE-EN 1936. Métodos de ensayo para piedra natural. Determinación de ladensidad real y aparente y de la porosidad abierta y total. AENOR, Madrid;2007.
[49] UNE-EN 13755. Métodos de ensayo para piedra natural. Determinación de laabsorción de agua a presión atmosférica. AENOR, Madrid; 2002.
[50] NORMAL 29/88. Misura dell’indice di asciugamento (drying index). CNR-ICR.Rome; 1988.
[51] UNE-EN 1925. Métodos de ensayo para piedra natural. Determinación delcoeficiente de absorción de agua por capilaridad. AENOR, Madrid; 1999.
[52] NORMAL 21/85. Permeabilità al vapor d’acqua. CNR-ICR, Rome; 1985.[53] ISRM. Suggested methods for determination of the Shore scleroscope
hardness. Int J Rock Mech Min Sci 1978;15:102–3.[54] ISRM. Suggested methods for determination of the Schmidt rebound hardness.
Int J Rock Mech Min Sci 1978;15:101–2.[55] Flatt RJ. Salt damage in porous materials: how high supersaturations are
generated. J Cryst Growth 2002;242:435–54.[56] Rodriguez Navarro C, Doehne E. Salt weathering: influence of evaporation rate,
supersaturation and crystallization pattern. Earth Surf Proc Land1999;24:191–209.
[57] UNE-EN 12371. Métodos de ensayo para piedra natural. Determinación de laresistencia a la heladicidad.AENOR, Madrid; 2002.
[58] UNE-EN 12370. Métodos de ensayo para piedra natural. Determinación de laresistencia a la cristalización de sales. AENOR, Madrid; 1999.
[59] Urosevic M, Sebastian Pardo E, Ruiz-Agudo E, Cardell C. Physical properties ofcarbonate rocks used as a modern and historic construction material inEastern Andalusia, Spain. Mater Constr 2011;61(301):93–114.
[60] Ruiz-Agudo E, Mees F, Jacobs P, Rodriguez-Navarro C. The role of salinesolution properties on porous limestone salt weathering by magnesium andsodium sulfates. Environ Geol 2007;52(2):305–17.
[61] Luque A, Cultrone G, Sebastián E, Cazalla O. Effectiveness of stone treatmentsin enhancing the durability of bioclastic calcarenite in (Granada, Spain). MaterConstr 2008;58(292):115–28.
[62] Benavente D. Why pore size is important in the deterioration of porous stonesused in the built heritage. Macla 2011;15:41–2.
[63] Karaca Z. Water absorption and dehydration of natural stones versus time.Constr Build Mater 2010;24:786–90.
[64] Ethington EF. Interfacial contact angle measurements of water, mercury, and20 organic liquids on quartz, calcite, biotite, and Ca-montmorillonitesubstrates. Open_File Report 90–409. Geological Survey, Colorado, USA; 1990.
[65] Arizzi A, Belfiore CM, Cultrone G, Rodriguez-Navarro C, Sebastian Pardo E,Triscari M. Petro-chemical and physical investigations on the ‘‘Santa PudiaCalcarenite’’ (Andalusia, Spain): New hints for the prevention andconservation of calcarenitic building materials. In: Goldschmidt ConferenceAbstracts A35; 2007.