constructing padi measurement models for the bear ... researchers have developed a software...
TRANSCRIPT

Robert Mislevy University of Maryland
PADI Technical Report 7 | November 2005
Report Series Published by SRI International
P A D I
PADI | Principled Assessment Designs for Inquiry
Constructing PADI Measurement Models for the BEAR Scoring Engine
Cathleen A. Kennedy, University of California, Berkeley

SRI InternationalCenter for Technology in Learning333 Ravenswood AvenueMenlo Park, CA 94025-3493650.859.2000http://padi.sri.com
PADI Technical Report Series EditorsAlexis Mitman Colker, Ph.D., Project ConsultantGeneva D. Haertel, Ph.D., Co-Principal InvestigatorRobert Mislevy, Ph.D., Co-Principal InvestigatorKlaus Krause, Technical Writer/EditorLynne Peck Theis, Documentation Designer
Copyright © 2005 SRI International and University of California, Berkeley. All Rights Reserved.

Acknowledgments
This material is based on work supported by the National Science Foundation under grant REC-0129331 (PADI Implementation Grant). I also would like to thank those who provided thoughtful feedback to help make this report more accessible to readers with differing backgrounds in science education, assessment, and measurement: Han Bao, Karen Draney, Geneva Haertel, Larry Hamel, Andrea Hayes, Bob Mislevy, Mark Wilson, and Futoshi Yumoto. Disclaimer Any opinions, findings, and conclusions or recommendations expressed in this material are those of the author and do not necessarily reflect the views of the National Science Foundation.
P R I N C I P L E D A S S E S S M E N T D E S I G N S F O R I N Q U I R Y
T E C H N I C A L R E P O R T 7
Constructing PADI Measurement Models for the BEAR Scoring Engine
Prepared by:
Cathleen A. Kennedy, University of California, Berkeley

ii
C O N T E N T S
Abstract v
1.0 Introduction 1
2.0 Assessment Design and the Four-Process Model 4
3.0 The PADI Design System 7 3.1 Student Model 9 3.2 Evaluation Procedures 11 3.3 Measurement Models 14
4.0 The BEAR Scoring Engine 17
5.0 PADI Measurement Model Examples 19 5.1 Modeling One Observable Variable 20
5.1.1 Unidimensional Dichotomous Model 20 5.1.2 Unidimensional Partial Credit Model 21 5.1.3 Unidimensional Rating Scale Model. 22 5.1.4 Within-Item Multidimensional Partial Credit Model. 25
5.2 Modeling Observable Variables That Are Not Conditionally Independent 31 5.2.1 A Simple Bundling Example 31 5.2.2 Between-Item Multidimensional Bundle 33 5.2.3 Within-Item Multidimensional Bundle 36
5.3 Modeling a Complete Assessment 36 5.3.1 Unidimensional Dichotomous Model 37 5.3.2 Unidimensional Partial Credit Model 38 5.3.3 Unidimensional Rating Scale Model 39 5.3.4 Between-Item Multidimensional Model 40 5.3.5 Within-Item Multidimensional Partial Credit Model 41
6.0 Conclusions 42
References 43
Appendix A —Input and Output XML Documents for the BEAR Scoring Engine 45 A.1 Input Documents 45
A.1.1 Model Document 45 A.1.2 Student Results Document 48
A.2 Output Document 48
Appendix B —Background Information about Item Response Modeling (IRM) 51 B.1 Item Response Probability 51 B.2 Measurement Models 53

iii
F I G U R E S
Figure 1. NRC assessment triangle. 1 Figure 2. Example of qualitatively different levels on the “ability to build an explanation from evidence”
Student Model Variable. The measure for a particular respondent at a particular time is shown as an X on the continuum. 4
Figure 3. Relationship of an assessment design system, delivery system, and scoring engine in an integrated assessment application. Shaded components constitute the PADI design system. 5
Figure 4. Four-process assessment delivery architecture highlighting location of Scoring Engine interface.1 6
Figure 5. PADI design system template object components and associations. 7 Figure 6. Excerpt from the “FOSS Force & Motion Task” template. 9 Figure 7. Excerpt of the Student Model “FOSS DSA + Math” containing two Student Model Variables,
“Distance-Speed-Acceleration” and “FOSS Math Inquiry.” Student Models are contained in template objects, and their Student Model Variables are referenced in Measurement Model objects. 10
Figure 8. Examples of Covariance Matrix and Means Matrix attributes of the “FOSS DSA + Math” Student Model. 11
Figure 9. Example of the “FOSS Practice Problem Evaluation” Evaluation Procedure containing several Evaluation Phases. Evaluation Procedures are contained in Activity objects and link Work Products to Observable Variables. 12
Figure 10. Example of the “FOSS Bundle DSA Pilot Item 1” Evaluation Phase, which bundles several Observable Variables into a final Observable Variable to be used in proficiency estimation. 13
Figure 11. Example of how Observable Variables are bundled in the “FOSS Bundle DSA Pilot Item 1” Activity. 13
Figure 12. Example of a Measurement Model object with its associated Observable Variable object. Measurement Model objects are contained in Activity objects. 14
Figure 13. Scoring Matrix for the “FOSS DSA Bundle MM Pilot Item 1” Measurement Model. 15 Figure 14. Design Matrix for the “FOSS DSA Bundle MM Pilot Item 1” Measurement Model. 15 Figure 15. Calibration Parameters from the “FOSS DSA Bundle MM Pilot Item 1” Measurement Model. 15 Figure 16. Chain of reasoning from student Work Products to Observable Variables to Student Model
Variables to assessment objectives as articulated in a design pattern, as implemented in the PADI design system. 16
Figure 17. Example of within-item multidimensionality from BioKIDS Item 5.1 26 Figure 18. Measurement Model from the PADI design system for BioKIDS Item 5. 27 Figure 19. PADI design system Scoring Matrix for BioKIDS Item 5. 28 Figure 20. PADI design system Design Matrix for BioKIDS Item 5. 30 Figure 21. A between-item multidimensional bundle.1 34 Figure A-1. Student Model information in the XML model file. 45 Figure A-2. Measurement Model part of XML model specification file showing the Observable Variable
elements for the “FOSS DSA MM Pilot Item 1” Observable Variable. 46

iv
Figure A-3. Measurement Model part of XML model specification file showing the Scoring Matrix, Design Matrix, and Calibration Parameter elements for the “FOSS DSA MM Pilot Item 1” Observable Variable. 47
Figure A-4. Student results input file. 49 Figure A-5. Output student results file. 50 Figure B-1. Item characteristic curves for a dichotomous (two-category) item. 51 Figure B-2. Category probability curves and δij values for a three-category polytomous item. 52 Figure B-3. Cumulative probability curves and Thurstonian thresholds for a four-category polytomous
item. 53 Figure B-4. δi, τ1, and τ2 representations for the polytomous case with three categories. 55
T A B L E S
Table 1. Examples of unidimensional and multidimensional means vectors and covariance matrices. 17

Introduction v
A B S T R A C T
Representing complex science inquiry tasks for item response modeling (IRM) presents a number of challenges
for the assessment designer. Typically, such tasks provide evidence of multiple aspects of learning and involve
sequential or interdependent responses. The BEAR Scoring Engine is introduced as a software tool to compute
proficiency estimates for such tasks. In addition, reusable data structures containing measurement model
specifications are presented as a technique to enhance internal assessment coherence, improve the
interpretability of statistical analyses of student responses, and speed the process of developing new assessment
tasks that are consistent with articulated learning goals. This report begins by defining an assessment system as
comprising task design and delivery components. The Principled Assessment Designs for Inquiry (PADI) design
system is then introduced and positioned within the assessment system framework. Next, we describe the role
of measurement models in operationalizing the manner in which inferences are drawn from observations and
interpreted in an assessment system. Connections among the task design, student work products, evaluation,
and inferential reasoning are highlighted, and the BEAR Scoring Engine is presented as one example of how
multidimensional item response modeling can be integrated with the PADI design system. Finally, several
examples of assessment tasks common to science inquiry are developed to illustrate how they would be
implemented with this particular scoring engine.


Introduction 1
1.0 Introduction
Advances in science education, cognitive science, educational measurement, and computer
technologies have matured to the point that powerful tools are emerging to support the
development of high-quality assessments in science inquiry. In 2001, the National Research
Council (NRC) Committee on the Foundations of Assessment published Knowing What Students
Know: The Science and Design of Educational Assessment to integrate developments in our
understanding of human learning with innovations in assessment practice. The report
concludes:
Every assessment, regardless of its purpose, rests on three pillars: a model of how students
represent knowledge and develop competence in the subject domain, tasks or situations that
allow one to observe students’ performance, and an interpretation method for drawing
inferences from the performance evidence thus obtained. (NRC, 2001, p. 2)
The NRC assessment triangle, shown in Figure 1, is a model of the essential connections and
dependencies present in a coherent and useful assessment system. Meaningful connections
among the three vertices—cognition, observation, and interpretation—are deemed essential
for assessment to have a positive impact on learning. Thus, assessment activities (the
observation vertex) must be aligned with the knowledge and cognitive processes (the cognition
vertex) one wishes to affect through the instructional process, and the scoring and
interpretation of student work (the interpretation vertex) must reflect sound measures of the
same knowledge and cognitive processes.
Figure 1. NRC assessment triangle.
One example of the need for more and better science assessment comes from the No Child Left
Behind Act of 2001 (NCLB). As the deadline approaches for putting state science assessments
into place for the 2007-08 academic year, assessment developers are under increasing pressure
to produce high-quality tests that conform to state and national science standards.
Increasingly, these standards include science inquiry skills, as well as expectations for content
knowledge (e.g., Connecticut DOE, 2005; NRC, 1996; Wisconsin DPI, 2005). Educators are called
to develop not only new large-scale assessments but also new classroom assessments that can
be used diagnostically so that steps can be taken to improve student outcomes. As the U.S.
Department of Education puts it:
Observation Interpretation
Cognition
Assessment Triangle

2 Introduction
States are to develop rigorous academic standards . . . and those standards should drive the
curriculum, which, in turn, must drive instruction. Annual statewide assessments will be aligned
with the curriculum to provide an external, independent measure of what is going on in the
classroom, as well as an early indicator showing when a student needs extra help. (U. S.
Department of Education, n.d.)
A key challenge in educational measurement, unlike in measuring height or weight, is making
inferences about cognitive processes, such as knowledge, that are not directly observable and
to do so from a limited set of observations. Efforts to develop science assessments that reveal
complex understandings of science that go beyond recitation of isolated science facts can be
resource intensive. Comprehensive and coherent sets of assessment items must be developed,
student responses elicited from these items must be evaluated in a consistent manner, and
then this evidence must be interpreted to inform classroom teaching and support individual
student learning. A complicating factor faced by assessment developers is differences in
science standards from state to state and at the national level. In addition, many standards are
broadly defined, do not identify specific competencies linked to the types of activities that
students should engage in to produce evidence of those competencies, and do not guide how
evaluation of student work should proceed to provide useful inferences about competence
and learning needs. Faced with these challenges, assessment developers need support in
designing new high-quality assessments.
To address this need, the NSF-funded Principled Assessment Designs for Inquiry (PADI) project
is developing technologies to facilitate the design and development of assessment tasks that
are consistent with the model of high-quality assessment advanced by the NRC. In particular,
PADI researchers have developed a software application to assist developers in designing and
building assessment tasks from reusable components. The practice of reusing components
helps ensure consistency throughout an assessment system and also speeds the development
process. The system takes advantage of advances in educational measurement by anticipating
the need for multidimensional item response modeling (IRM) to draw inferences from the
evidence generated from student responses. The use of multidimensional IRM can enhance the
interpretability of assessment evidence by relating it to multiple learning goals.1 It also can
improve the reliability and validity of comparisons made over time and among student groups,
particularly when students do not complete the same assessment tasks, through the use of
consistent scaling at the task level (Rasch, 1960; Wright, 1993).
The assessment design framework developed in the PADI project is based on the evidence-
centered assessment design (ECD) model developed by Almond, Steinberg, and Mislevy (2002).
Key features of the PADI design system include design patterns, task templates, and design
tools. Design patterns capture assessment arguments describing how the alignment of
cognitive objectives for performance, observations, and interpretation are operationalized for a
specific (narrow or broad) domain of knowledge. Task templates lay out the components of an
assessment task and specify the chain of reasoning from gathering evidence to drawing
inferences. Design tools assist developers in designing and constructing assessment tasks that
will produce interpretable results. The framework and tools developed for this project could be
1 By “interpretability” we mean facilitating the alignment of an assessment measure, such as proficiency, with an assessment purpose or goal, such as improvement in a particular domain of knowledge or a specific level of competence. The measure that is produced from an assessment should make sense in the context of why the assessment was administered.

Introduction 3
applied to assessment in any subject area, although the focus of the current grant is on the
assessment of science inquiry.
This report begins by defining an assessment system as comprising task design and delivery
components. The PADI design system is then introduced and positioned within the assessment
system framework. Next, we describe the role of measurement models in operationalizing the
manner in which inferences are drawn from observations and interpreted in an assessment
system. Connections among the task design, student work products, evaluation, and inferential
reasoning are highlighted, and the BEAR Scoring Engine is introduced as one example of how
multidimensional IRM can be integrated with the PADI design system. Finally, several examples
of assessment tasks common to science inquiry are developed to illustrate how they would be
implemented with this particular scoring engine.

4 Assessment Design and the Four-Process Model
2.0 Assessment Design and the Four-Process Model
An assessment comprises a series of tasks that are administered to a respondent to elicit
evidence about particular aspects of his or her knowledge, skill, or ability. These targeted
cognitive processes are referred to as Student Model Variables, and the collection of variables
for a given assessment purpose is referred to as a Student Model. A Student Model Variable can
be represented as a continuum from having less of the knowledge, skill, or ability to having
more of it, and although a particular assessment may target a narrow range on the continuum,
the Student Model Variable itself is theoretically without bounds. Examples of Student Model
Variables in the domain of science inquiry include “ability to build an explanation from
evidence,” “creating hypotheses and predictions,” and “interpreting data.” Figure 2 is a
graphical representation of the “ability to build an explanation from evidence” Student Model
Variable showing descriptions of qualitatively different levels of ability. When we speak of
measuring, we mean identifying the location of a particular respondent at some point on the
Student Model Variable continuum (shown as an X in Figure 2). Aligning all items and
respondents on the same continuum enables valid and reliable comparisons among
respondents at a specific point in time, and for a given respondent at different time points
(Embretson, 1996; Wright, 1968, 1977).
Figure 2. Example of qualitatively different levels on the “ability to build an explanation
from evidence” Student Model Variable. The measure for a particular respondent at a
particular time is shown as an X on the continuum.
The PADI project encourages a principled approach to assessing proficiency with a detailed
model of how assessments are related to the specific competencies one is interested in
measuring. As illustrated in Figure 3, an assessment design system manages the principled
design and representation of assessment task specifications. An assessment delivery system is
also needed to instantiate assessment tasks, deliver them to students, gather and evaluate
student work, compute the analytics to arrive at estimates of student proficiency, and report
Unable to match/compose any parts of explanation.
Able to match evidence to claims.
Able to form claim and evidence statements with some guidance.
Able to compose explanation (claim and evidence) without assistance.
Ability to build an explanation from evidence
Direction of more ability
Direction of less ability
X A particular respondent’s location
Descriptions of levels:

Assessment Design and the Four-Process Model 5
back to teachers, students, and other interested parties. Note that the delivery system may
access previously designed task specifications through the design system, as shown in the
figure, or may keep a local copy of the task specifications and/or instantiated tasks and access
them directly. The delivery system is also responsible for maintaining the longitudinal database
of student response data and proficiency estimates. A scoring engine is used by the assessment
delivery system to produce estimates of student proficiencies in the domains of interest from
response data gathered during assessment delivery. A computerized assessment system,
composed of integrated design and delivery modules, can facilitate the construction of high-
quality assessments. This is accomplished by maintaining the connections among the
cognition, observation, and interpretation vertices of the NRC assessment triangle.
Figure 3. Relationship of an assessment design system, delivery system, and scoring
engine in an integrated assessment application. Shaded components constitute the PADI
design system.
An assessment delivery system, whether computerized or manual, comprises four interrelated
processes, as described in the Four Process Model developed by Almond et al., (2002): (1)
assessment tasks are selected for delivery to the respondent, (2) the tasks are rendered and
presented to the respondent and respondent work products are collected, (3) the Work
Products are evaluated and categorized into evidence associated with the targeted Student
Model Variables, and (4) the evidence is used to draw inferences about the Student Models of
individual respondents. In an integrated assessment system, both the design and delivery
modules access the same repository of assessment task specifications. These task specifications
define how tasks are to be generated and rendered to respondents, how work products are to
Task Specifications
Repository
Assessment Design System
Student Database
Assessment Delivery System
Scoring Engine

6 Assessment Design and the Four-Process Model
be gathered and evaluated, and how inferences are to be drawn about respondents’
knowledge, skills, or abilities.
A scoring engine is used to implement the interpretation model applied in the inferential
process (step 4). This Measurement Model, as we call it here, defines the way evidence is used
to produce estimates of each respondent’s locations on the Student Model Variables at the
time of participating in the assessment. As shown in Figure 4, the assessment delivery system
evaluates student work (in the Evidence Identification Process) prior to calling the scoring engine
to produce proficiency estimates. The evaluated response data and associated Measurement
Models for each assessment task (accessed from the task specifications repository) are then sent
to the scoring engine, and the scoring engine computes and returns proficiency estimates for
each respondent. The assessment delivery system then produces summary feedback or may use
intermediate proficiency estimates as input into the selection process for the next task.
Figure 4. Four-process assessment delivery architecture highlighting location of Scoring
Engine interface.1
1Adapted from Mislevy, Almond, and Lukas (2004).
Note that development of an assessment delivery system is beyond the scope of the PADI
project, but understanding the interfaces between the delivery system and the other
components is central to the principled design approach.
Task Specifications
Repository
Administrator Respondent
Activity SelectionProcess
PresentationProcess
Summary Feedback Task Level FeedbackEvidence Accumulation
Process
Evidence Identification
Process
Scoring Engine

The PADI Design System 7
3.0 The PADI Design System
The PADI design system consists of an assessment design system and a task specifications
repository, as illustrated in Figure 3. The assessment design system manages the design and
representation of assessment task specifications. It is a software application comprising a series
of object models constituting a framework that can be used to represent the interrelated
components of assessment: (1) a theory of how students develop targeted knowledge, skills,
and abilities; (2) designs of task templates and tasks that would allow one to observe students
exercising those proficiencies; and (3) evaluation and interpretation methodologies that define
the manner in which the observations are associated with the proficiencies to be measured.
Design pattern objects are used to represent a rationale for assessing a particular aspect of
science inquiry, such as designing and conducting scientific investigations. They tie curricular
learning goals and standards to a description of how student work products are connected to
inferences about the student knowledge, skills, and abilities one wishes to advance in the
curriculum. Template objects are used to represent task specifications that conform to the
assessment objectives of one or more design patterns. As implied in Figure 5, the linkage
between a template and its guiding design patterns is the mechanism that ensures consistency
between learning goals and assessment tasks.
Figure 5. PADI design system template object components and associations.
The PADI design system manages the representation of design patterns, task templates, and
related objects and relationships to support the design of assessment tasks. Figure 5 shows the
logical components of the system. Design patterns are prominent, providing in narrative form
the assessment argument that provides the foundation for the development of templates. The
components of a template allow an assessment designer to specify what an assessment task
will look like to a student, how the student work generated from the task will be evaluated, and
how that evaluation will be used to draw inferences about the student proficiencies of interest.
A template contains a Student Model object to define the proficiencies of interest and one or
more Activity objects to define how information will be elicited from students as evidence of
those proficiencies. A template may also contain one or more Task Model Variables to define
the assessment environment. In the context of an Activity, information about the appearance
Design Patterns
Activity
Measurement Models
Student Model
SM Variables
Observable Variables
Evaluation Phases
Materials & Presentation
Work Products
Evaluation Procedures
TM Variables
Task Model
TEMPLATE

8 The PADI Design System
of assessment tasks when rendered to students is contained in the Work Products and
Materials and Presentation components, while information about how student Work Products
are evaluated and transformed into observations is contained in the Evaluation Procedures. An
Evaluation Procedure may include multiple Evaluation Phases. The observations, called
Observable Variables, are associated with statistical rules defined in Measurement Models.
These rules are used to draw inferences about the assessment measures of interest from the
evidence contained in the Observable Variables. These design system components help ensure
the consistency of an assessment, from the learning goals articulated in the design patterns to
the evaluation of the Work Products to drawing inferences about student proficiencies.
Figure 6 shows a template for a science assessment task that is to be delivered in an interactive
online system. The “FOSS Force & Motion Task” template contains all the components identified
in Figure 5. In Figure 6, the labels along the left margin are called the template attributes, and
the entries to the right are the attribute values. In this report, we focus on three components of
a task template: the Student Models, Evaluation Procedures, and Measurement Models. These
are the components that operationalize the chain of reasoning from gathering evidence to
drawing inferences about what students know and can do.

The PADI Design System 9
Figure 6. Excerpt from the “FOSS Force & Motion Task” template.
3.1 Student Model
In Figure 6, the Student Models attribute is defined as “FOSS DSA + Math,” a multivariate model
of aspects of physics knowledge the curriculum targets. “DSA” represents the physics content
area of distance, speed, and acceleration treated as a single cognitive element, and “Math”
represents general knowledge of mathematics applied to solving science problems. An
assessment designer typically determines these knowledge areas from examining the
Knowledge, Skills, and Abilities attribute of the associated design patterns (Mislevy, Hamel,
Fried, Gaffney, Haertel, Hafter, et al., 2003). The design patterns relevant to this template are also

10 The PADI Design System
shown in Figure 6. They include “Distance (Change of Position),” “Speed and Rate,”
“Acceleration,” and “Using mathematics to answer science-related problems.”
The presence of the “FOSS DSA + Math” Student Model in the template requires all the
observations associated with the template to provide evidence of either DSA content
knowledge or mathematics knowledge. Observations are associated with a template through
the Activity objects contained by the template. Figure 7 shows the “FOSS DSA + Math” Student
Model components. Note that the Distribution Type attribute describes the population
distribution for the Student Model—in this case, a multivariate normal distribution. The
Covariance Matrix and Means Matrix attributes, shown in Figure 8, define the values to be used
in the population distribution function to estimate EAP (expected a-posteriori) student
proficiencies (expected a-posteriori and maximum likelihood proficiency estimates are
described in Section 4.0 The BEAR Scoring Engine). The specific values in the covariance and
means matrices may not be known at the time of template development; they may be
determined during a calibration study of pilot data, or they may be set to default values and
updated as assessment data are gathered by the assessment delivery system.
Figure 7. Excerpt of the Student Model “FOSS DSA + Math” containing two Student
Model Variables, “Distance-Speed-Acceleration” and “FOSS Math Inquiry.” Student
Models are contained in template objects, and their Student Model Variables are
referenced in Measurement Model objects.

The PADI Design System 11
Figure 8. Examples of Covariance Matrix and Means Matrix attributes of the “FOSS DSA +
Math” Student Model.
3.2 Evaluation Procedures
We also see in Figure 6 a summary of the Evaluation Procedures that are to be applied to
transform student work into the Observable Variables that constitute the evidence we need to
draw inferences about student competencies. Evaluation Procedures are elaborated in more
detail in Activity objects. The “FOSS Force & Motion Task” template contains a generic activity
that can be customized for a specific problem to be presented to a student. This activity,
named “FOSS DSA + Math,” is shown in the Activities attribute in Figure 6. The Evaluation
Procedure shown in Figure 9 describes the steps, or Evaluation Phases, that will be taken to
evaluate student work from this type of Activity. The Evaluation Phases indicate that the
equation selected by the student is evaluated first, followed by the values the student entered
into the equation, the units entered into the equation, the mathematical calculation, and then
the units entered into the final response. Note that each of these Evaluation Phases results in
individual scores2 of 0 or 1 for an Observable Variable. After these individual scores are
determined, the scores associated with the DSA variable are bundled together into a
comprehensive single score in the “FOSS Bundle DSA” Evaluation Phase, and the scores
associated with the mathematics variable are bundled in the “FOSS Bundle Math” Evaluation
Phase. Bundling scores is a process used to combine conditionally dependent responses into a
single composite score. This step is required for certain item response models to meet the
assumption of conditional independence among the Observable Variables used to produce
proficiency estimates (Hoskens & deBoeck, 1997; Wang, Wilson, & Cheng, 2000; Wilson &
Adams, 1995).
2 The term “score” has several meanings in assessment. The usage here and following is that a score on a performance is an evaluation of that performance, expressed as a value of an observable variable.

12 The PADI Design System
Figure 9. Example of the “FOSS Practice Problem Evaluation” Evaluation Procedure
containing several Evaluation Phases. Evaluation Procedures are contained in Activity
objects and link Work Products to Observable Variables.
Figure 10 shows more detail as to how the DSA scores are to be bundled. Four Input
Observable Variable values are examined to determine the value of a single Output Observable
Variable. Only the value of the Output Observable Variable will ultimately be used to estimate
student proficiencies. Figure 11 shows the Translation Chart for Bundling of the Evaluation
Phase shown in Figure 10 (this screen is obtained by selecting the View option of the
Evaluation Action attribute of the Evaluation Phase). It contains the rules to be followed in
determining the value of the Output Observable Variable. The first four columns show possible
values for each of the Input Observable Variables, and the last column shows the value to be
assigned to the Output Observable Variable for that row. For example, a student who gets the
equation correct (i.e., a score of 1 on the Equation Choice Observable Variable) but enters an
incorrect value somewhere in the equations (i.e., a score of 0 on the Equation Fill-in Observable
Variable) will receive a score of 2 on the Output Observable Variable, regardless of whether the
units were entered correctly or incorrectly in the equation and in the final result. Bundling rules
are usually determined by substantive experts who examine student responses to rank each of
the possible response patterns. An ordered partition model (Wilson, 1992) in which multiple
patterns result in the same score value is frequently implemented by assessment designers.
Bundling approaches are described in more detail in Section 5.0, PADI Measurement Model
Examples.

The PADI Design System 13
Figure 10. Example of the “FOSS Bundle DSA Pilot Item 1” Evaluation Phase, which
bundles several Observable Variables into a final Observable Variable to be used in
proficiency estimation.
Figure 11. Example of how Observable Variables are bundled in the “FOSS Bundle DSA
Pilot Item 1” Activity.

14 The PADI Design System
3.3 Measurement Models
The Measurement Model summary shown in Figure 6 provides a narrative of how the
observations associated with the template will be used as evidence in a statistical model to
draw inferences about the targeted proficiencies of students. Individual Measurement Models,
one for each Observable Variable, are defined in the Activities. Figure 12 provides an example
of one Measurement Model for an Activity. Note that this Measurement Model is associated
with the “FOSS DSA Bundle Final OV Pilot Item 1” Output Observable Variable from the “FOSS
Bundle DSA” Evaluation Phase shown in Figure 10. This Measurement Model defines the
Observable Variable as a partial credit, or polytomous, score. It also indicates that the
Observable Variable provides evidence about the “Distance-Speed-Acceleration” Student
Model Variable only. The Scoring Matrix, Design Matrix, and Calibration Parameters attributes
complete the Measurement Model specification to completely define how inferences about
the Student Model are to be ascertained from this Observable Variable. The Scoring Matrix,
shown in Figure 13, relates responses in particular levels of the Observable Variable to scores
on the “Distance-Speed-Acceleration” Student Model Variable. The Design Matrix, shown in
Figure 14, relates responses in particular levels of the Observable Variable to the relevant item
parameters (i.e., item difficulties and step difficulties). The Calibration Parameters, shown in
Figure 15, are the values to be used in computing item response probabilities when estimating
student proficiencies. Calibration Parameters are usually generated from a sample of student
responses to the activity or from expectations of relative item difficulty and anticipated student
performance. As was the case for the covariance and means matrices for the Student Model,
the specific values of the Calibration Parameters may not be known at the time of template
development.
Figure 12. Example of a Measurement Model object with its associated Observable
Variable object. Measurement Model objects are contained in Activity objects.

The PADI Design System 15
Figure 13. Scoring Matrix for the “FOSS DSA Bundle MM Pilot Item 1” Measurement
Model.
Figure 14. Design Matrix for the “FOSS DSA Bundle MM Pilot Item 1” Measurement
Model.
Figure 15. Calibration Parameters from the “FOSS DSA Bundle MM Pilot Item 1”
Measurement Model.

16 The PADI Design System
The Student Model, Evaluation Procedures, and Measurement Models, through their contained
attributes, provide the linkages needed to maintain consistency throughout an assessment
system. The PADI design system components that operationalize these linkages are shown
graphically in Figure 16. Design patterns inspire the Work Products (WPs) that will be gathered
from students. Evaluation Procedures transform the content of student Work Products into
Observable Variables (OVs), which provide the evidence from which inferences are drawn
about what students know and can do. The details of how those inferences are to be drawn are
contained in Measurement Models, which connect the Observable Variables to the Student
Model Variables (SMVs). And those Student Model Variables are directly related to the
knowledge, skills, and abilities (KSAs) targeted by the originating design pattern.
Figure 16. Chain of reasoning from student Work Products to Observable Variables to
Student Model Variables to assessment objectives as articulated in a design pattern, as
implemented in the PADI design system.
As explained earlier, an assessment delivery system manages the actual delivery of assessment
tasks to students and the gathering and evaluation of student response data. The delivery
system may include the analytics for drawing inferences from the data to produce estimates of
student proficiencies on the measures of interest. Part of the PADI project, however, is
development of multidimensional item response modeling software that can be called by an
assessment delivery system to produce these estimates.
Design Pattern
Student Model
Measurement Model
Evaluation Procedures
KSAs
SMVs OVs
WPs

The BEAR Scoring Engine 17
4.0 The BEAR Scoring Engine
The BEAR Scoring Engine uses the Multidimensional Random Coefficients Multinomial Logit
(MRCML) model (Adams, Wilson, & Wang, 1997), which provides a generalized solution for a
family of multidimensional, polytomous, Rasch-based models to produce inferences about
student proficiencies. The model is flexible in that it can fit assessments with a wide range of
item types and gives the designer control of how parameters are defined and applied at the
category level on each item. Assessment developers specify the model by defining a prior
multivariate distribution, scoring and design matrices, and item parameters. These
components, which typically are defined in task specifications generated by the PADI design
system, are sent to the Scoring Engine, along with the evaluated student response data, in XML
(Extensible Markup Language) documents. The assessment delivery system accesses the Scoring
Engine through a URL (uniform resource locator) address. The Scoring Engine applies the
values from the XML documents to the proficiency algorithm, computes student proficiency
estimates and covariance data, and returns updated information to the requesting application
in another XML document. Excerpts from the input and output XML documents are illustrated
in Appendix A.
The Scoring Engine estimates student proficiencies by using two methods: expected a-
posteriori (EAP) and maximum likelihood (ML) estimation. The EAP is a Bayesian estimation
procedure using information from both the respondents’ scores (i.e., values of observable
variables) and the distribution of the respondents, whereas the ML approach uses only the
respondents’ scores. As described earlier, a PADI Student Model describes the prior distribution
by defining a means matrix (actually, a one-row matrix, so we may also think of it as a vector)
and a covariance matrix across all the Student Model Variables. Table 1 provides examples of
means vectors and covariance matrices for unidimensional and multidimensional models. For a
unidimensional model, the means vector contains a single value and the variance-covariance
matrix contains only the variance cell. For a multidimensional model, a mean is entered for
each dimension and the complete variance-covariance matrix is entered.
Table 1. Examples of unidimensional and multidimensional means vectors and
covariance matrices.
Unidimensional Multidimensional
Means Vector SMV1
[ ]652.0
SMV1 SMV2
[ ]865.0542.0
Covariance Matrix SMV1
SMV1 [ ]954.0
SMV1 SMV2
SMV1
SMV2 ⎥⎦
⎤⎢⎣
⎡812.0783.0783.0260.1

18 The BEAR Scoring Engine
The assessment delivery system can request either EAP or ML estimates and can also specify a
number of other parameters that the Scoring Engine uses in executing the estimation
procedure, such as the integration method, the number of nodes, and convergence criteria.
Through MRCML modeling and the PADI design system structure, the Scoring Engine
accommodates assessments that measure multiple aspects of proficiency and that can be
defined at the category level. In the PADI environment, we consider each Observable Variable
separately, so Measurement Models also are defined at the Observable Variable, or item, level.
The following section, PADI Measurement Model Examples, elaborates on a number of
Measurement Models that can be implemented with this system, including between- and
within-item multidimensionality and bundling examples.

PADI Measurement Model Examples 19
5.0 PADI Measurement Model Examples
Designing a coherent assessment—that is, one that reliably measures a specific set of
proficiencies—is a complex process. Items must elicit responses that, when evaluated, produce
evidence that can be used to draw inferences about the proficiencies of interest. The data must
fit the statistical model and conform to model assumptions. In the case of multidimensional
IRM, the standard assumptions include unidimensionality of each Student Model Variable,
monotonicity over the variable, and local independence of the items. Unidimensionality refers
to the degree to which items measure the same Student Model Variable. Monotonicity refers to
the situation in which persons with more of the Student Model Variable have greater
probabilities of responding at higher score levels on the items than do persons with less of the
Student Model Variable. Local independence means that a person’s response on one item does
not influence his or her responses on any other items. These assumptions are usually tested
and confirmed during the calibration phase of task development.
The MRCML Measurement Model specified in the PADI system describes response probability
equations by defining a Scoring Matrix to associate items with Student Model Variables, a
Design Matrix to associate items with item parameters, and calibrated item parameters. These
probabilities are used to determine the likelihood of responses to items for persons with
specific abilities. Using this information, we can infer an ability from response data. The general
MRCML formulation for the probability of a response pattern, x, is
[ ]
[ ]∑Ω∈
−′−′
=
zAξBθzAξBθxθ|ξx;
)(exp)(exp)(P
where θ is the vector of Student Model Variables, ξ is the vector of calibrated item parameters,
and Ω is the set of all possible response patterns (Adams, Wilson & Wang, 1997). We use z to
denote a pattern coming from the full set of response patterns while x denotes the one of
interest (z′ and x′ are transpositions of z and x). The response pattern, x, is comprised of vectors
for each item with one element in the vector for each item category, x = {x1, x2, ..., xI} = {x11, x12, ...,
x1m1, x21, x22, ..., x2m2, ..., xImI} for mi = number of categories for item i, and I = number of items. Note
that in this formulation the item parameters are considered known and conditioned on θ. The
Scoring Matrix, B, is used to construct the θ component of the probability equations, and the
Design Matrix, A, is used to construct the ξ component. Specific probability equations
generated from the Scoring and Design Matrices are shown in the following set of examples.
Background information about item response modeling is presented in Appendix B.
When an assessment is intended to measure multiple Student Model Variables, individual
items may measure a single Student Model Variable or multiple variables. We refer to the case
in which each item provides evidence about a single variable as between-item
multidimensionality and the case in which a single item provides evidence about multiple
variables as within-item multidimensionality. In the PADI design system, a case of between-item
multidimensionality occurs when the Student Model contains multiple Student Model
Variables but each Observable Variable maps to only one of them. When an Observable
Variable maps to more than one Student Model Variable, we have a case of within-item
multidimensionality.

20 PADI Measurement Model Examples
In the sections that follow, we first provide examples of IRM models, both unidimensional and
multidimensional, that could be used to describe a single Observable Variable within the PADI
system when the assumptions of IRT are met. We then show how PADI and the Scoring Engine
can be used to model Observable Variables that are not conditionally independent through a
process called “bundling.” The final section shows how modeling Observable Variables within
PADI and the Scoring Engine compares with approaches used to model full tests consisting of a
collection of conditionally independent Observable Variables.
5.1 Modeling One Observable Variable
These examples describe the modeling of assessment tasks in which individual responses to
multiple items are conditionally independent.
5.1.1 Unidimensional Dichotomous Model
This model is useful for representing responses that are either correct or incorrect and that
measure only one Student Model Variable. Examples include making a selection from a list,
responding to a true/false or multiple-choice question, and fill-in-the-blank items that have a
single correct response.
Scoring Matrix (one Student Model Variable, so one column):
SMV1
Category 1
Category 2 ⎥⎦
⎤⎢⎣
⎡10
Design Matrix (one observable variable, so one column):
δ1
Category 1
Category 2 ⎥⎦
⎤⎢⎣
⎡10
In addition to the Scoring and Design Matrices, the Scoring Engine requires calibrated item
parameters to compute response probabilities. These are provided as vectors in which the
number of elements is equal to the number of columns in the Design Matrix. In this example,
we have one column in the Design Matrix and one element in the calibrated parameters
vector.3
Calibrated Parameters Vector:
δ1
Item difficulty [ ]05.1
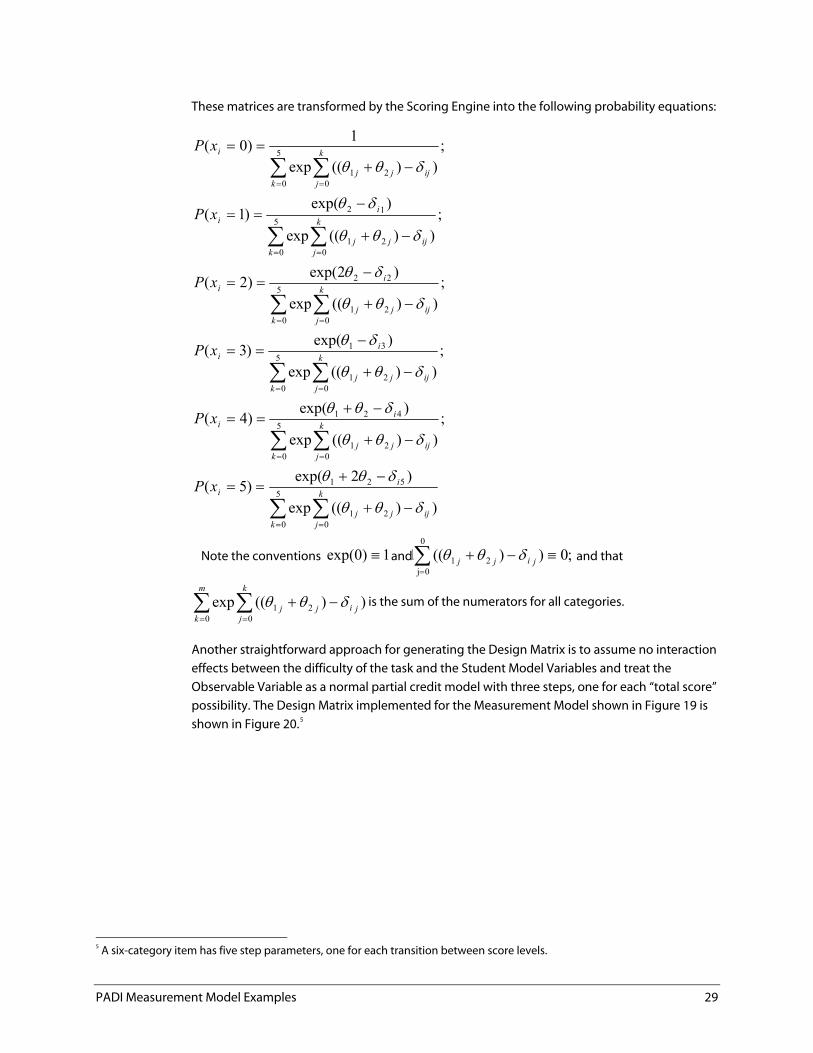
These matrices are transformed by the Scoring Engine into the following probability equations:
3 The calibrated parameter vector values in these examples are hypothetical.

PADI Measurement Model Examples 21
)exp(11)0(
1δθ −+==xP and
)exp(1)exp()1(1
1
δθδθ−+
−==xP , where δ1 = 1.05.
5.1.2 Unidimensional Partial Credit Model
This model is used to represent responses that can be scored at more than two levels. A scoring
rubric is usually required to describe what a score at each level means relative to the Student
Model Variable being measured. Essay questions are typically scored with this approach, with
scores ranging from 0 to 10, for example.
The Scoring and Design Matrices below represent an Observable Variable with four categories.
In this Scoring Matrix, a response in the third category is represented by a score of 2. Note that
the response data sent to the Scoring Engine indicate which category the response is in, using
integral values beginning at 0. Thus, a response in the second category is sent to the Scoring
Engine as the value 1. The response categories are always positive integers. For simple models,
such as that shown below, it is quite common for the response category value to be the same
as the score value. However, it is permissible for the Scoring Matrix to include negative or
fractional values.
Scoring Matrix (one SMV, so one column):
SMV1
Category 1
Category 2
Category 3
Category 4 ⎥⎥⎥⎥
⎦
⎤
⎢⎢⎢⎢
⎣
⎡
3210
Design Matrix (four categories means three steps, so three columns):
δ1 δ2 δ3
Category 1
Category 2
Category 3
Category 4 ⎥⎥⎥⎥
⎦
⎤
⎢⎢⎢⎢
⎣
⎡
111011001000
In this Design Matrix, the difficulty of achieving a response in the third category is computed
from the difficulty of advancing from the first category to the second category (the first
column) and the difficulty of advancing from the second category to the third category (the
second column). That is, the difficulty of achieving a response in the third category is
conditioned on being able to earn the lower scores also. This approach requires scores to be
hierarchically ordered such that each score represents a higher level of proficiency than the

22 PADI Measurement Model Examples
score before. Just as for Scoring Matrices, entries in the Design Matrix may also be negative or
fractional values.
Calibrated Parameters Vector:
δ1 δ2 δ3 [ ]86.025.035.1
Note that the number of elements in the calibrated parameters vector is equal to the number
of columns in the Design Matrix.
These matrices are transformed by the Scoring Engine into the following probability equations,
where δ11 = 1.35, δ12 = 0.25, and δ13 = 0.86:
.categories allfor numerators theof sum theis )(exp
thatand ;0)(and 1)0exp( sconvention theNote
.)(exp
))(3exp(
)(exp
)(exp)3(
and;)(exp
))(2exp(
)(exp
)exp(
)(exp
)(exp)2(
;)(exp
)exp(
)(exp
)(exp)1(
;)(exp
1)0(
0 0
0
0j
3
0 0
3213
0 0
3
0
3
0 0
213
0 0
213
0 0
2
0
3
0 0
13
0 0
1
0
3
0 0
∑ ∑
∑
∑ ∑∑ ∑
∑
∑ ∑∑ ∑∑ ∑
∑
∑ ∑∑ ∑
∑
∑ ∑
= =
=
= == =
=
= == == =
=
= == =
=
= =
−
≡−≡
−
++−=
−
−==
−
+−=
−
−+−=
−
−==
−
−=
−
−==
−==
m
k
k
jij
ij
k
k
jij
iii
k
k
jij
jij
i
k
k
jij
ii
k
k
jij
ii
k
k
jij
jij
i
k
k
jij
i
k
k
jij
jij
i
k
k
jij
i
xP
xP
xP
xP
δθ
δθ
δθ
δδδθ
δθ
δθ
δθ
δδθ
δθ
δθδθ
δθ
δθ
δθ
δθ
δθ
δθ
δθ
5.1.3 Unidimensional Rating Scale Model.
This is similar to the unidimensional partial credit model except that (1) the scoring rubric must
be the same for all Observable Variables on the assessment, and (2) the step difficulties are
parameterized differently. Rating scale models are often used for questionnaires and surveys.
The following Scoring Matrix could be used for a rating scale Observable Variable with five
categories. In the example below, a response in the second category is represented by a score
of 1.
Note the conventions and that
is the sum of the numerators for all categories.
and
and

PADI Measurement Model Examples 23
Scoring Matrix (one SMV, so one column):
SMV1
Category 1
Category 2
Category 3
Category 4
Category 5 ⎥⎥⎥⎥⎥⎥
⎦
⎤
⎢⎢⎢⎢⎢⎢
⎣
⎡
43210
The Design Matrix could be constructed in the same manner as for the partial credit model. By
convention, however, we parameterize the item difficulties differently in the rating scale
model, as (δ + τ) values, so we construct the Design Matrix differently also.
Preliminary RS Design Matrix (average difficulty, δi, and four tau parameters, τ1, τ2, τ3, and τ4, so
five columns):
δ τ1 τ2 τ3 τ4 Category 1
Category 2
Category 3
Category 4
Category 5 ⎥⎥⎥⎥⎥⎥
⎦
⎤
⎢⎢⎢⎢⎢⎢
⎣
⎡
1111401113001120001100000
With this Design Matrix, the difficulty of achieving a response in the third category is computed
from the average difficulty of the Observable Variable (the first column), the deviation from the
average difficulty to get a response in the second category (the second column), and the
deviation from the average difficulty to get a response in the third category (the third column).
These tau parameters have a different interpretation, and are calibrated differently, from the
step parameters in the partial credit model, so the formulation of the Design Matrix looks
different from that for the partial credit model.

24 PADI Measurement Model Examples
Note that the total difficulty of getting a response in the third category is:
average item difficulty + difficulty in going from a category 1 response to a
category 2 response
( 1ii τδ + )
+ average item difficulty + difficulty in going from a category 2 response to a
category 3 response
( 2ii τδ + )
= 2*(average item difficulty) ( iδ2
+ difficulty in going from a category 1 response to a category 2 response 1iτ+
+ difficulty in going from a category 2 response to a category 3 response 2iτ+ )
In MRCML terms, the formulation is denoted as 2δi+τi1+τi2. The coefficients 2, 1, and 1 are
captured in the Design Matrix row denoted as “Category 3.”
Since the sum of all the tau parameters is 0, the total difficulty of getting a response in the fifth
category is 4δi + Στ = 4δi; accordingly, we simplify the Design Matrix by setting the tau
parameters in the last row to 0. Thus, we do not have to estimate τ4, and we need only the first
four columns of the Design Matrix.
Final RS Design Matrix (average OV difficulty, δi, and three tau parameters, τ1, τ2, and τ3, so four
columns):
δ τ1 τ2 τ3 Category 1
Category 2
Category 3
Category 4
Category 5 ⎥⎥⎥⎥⎥⎥
⎦
⎤
⎢⎢⎢⎢⎢⎢
⎣
⎡
00041113011200110000
Calibrated Parameters Vector:
δ τ1 τ2 τ3 [ ]64.003.126.035.1−

PADI Measurement Model Examples 25
These matrices are transformed by the Scoring Engine into the following probability equations,
where δi = -1.35, τ1 = 0.26, τ2 = 1.03, and τ3 = 0.64:
.categories allfor numerators theof sum theis ))((exp
thatand ;0))((and 1)0exp( sconvention theNote
.))((exp
))4(4exp(
))((exp
))((exp)4(
and;))((exp
))3(3exp(
))((exp
))((exp)3(
;)(exp
))2(2exp(
))((exp
))((exp)2(
;))((exp
))(exp(
))((exp
))((exp)1(
;))((exp
1)0(
0 0
0
0j
4
0 0
43214
0 0
4
0
4
0 0
3214
0 0
3
0
4
0 0
214
0 0
2
0
4
0 0
14
0 0
1
0
4
0 0
∑ ∑
∑
∑ ∑∑ ∑
∑
∑ ∑∑ ∑
∑
∑ ∑∑ ∑
∑
∑ ∑∑ ∑
∑
∑ ∑
= =
=
= == =
=
= == =
=
= == =
=
= == =
=
= =
+−
≡+−≡
+−
++++−=
+−
+−==
+−
+++−=
+−
+−==
−
++−=
+−
+−==
+−
+−=
+−
+−==
+−==
m
k
k
jji
ji
k
k
jji
i
k
k
jji
jji
i
k
k
jji
i
k
k
jji
jji
i
k
k
jij
i
k
k
jji
jji
i
k
k
jji
i
k
k
jji
jji
i
k
k
jji
i
xP
xP
xP
xP
xP
τδθ
τδθ
τδθ
ττττδθ
τδθ
τδθ
τδθ
τττδθ
τδθ
τδθ
δθ
ττδθ
τδθ
τδθ
τδθ
τδθ
τδθ
τδθ
τδθ
5.1.4 Within-Item Multidimensional Partial Credit Model.
This model is used to represent a single Observable Variable that is associated with more than
one Student Model Variable. For example, a single response to an open-ended problem may
provide evidence of a student’s content knowledge and his or her ability to formulate an
explanation. One way to evaluate this type of response is to produce two scores for the
Observable Variable, one for the content knowledge SMV and one for the building explanations
SMV. An example of this type of assessment task from the BioKIDS curriculum
(<http://www.biokids.umich.edu/>) is shown in Figure 17.
and that
is the sum of the numerators for all categories.
and
and Note the conventions

26 PADI Measurement Model Examples
Figure 17. Example of within-item multidimensionality from BioKIDS Item 5.1
1For information on the BioKIDS project, see http://www.biokids.umich.edu/
In this example, the selection of the zone is considered an indicator of content knowledge (in
this case, biodiversity) and the explanation is an indicator of knowledge about building an
explanation. A single Observable Variable provides evidence of the student’s location on both
Student Model Variables.
Each Student Model Variable may have a different number of categories. For example, content
knowledge may have two categories (correct and incorrect) and building explanations may have
three categories, resulting in six unique combinations of responses on the task overall.
The first category of the overall task represents the situation in which the student has a
response in the first category on the first Student Model Variable and a response in the first
category on the second Student Model Variable. We construct the complete set of overall task
categories by building permutations of the combinations of responses on the two Student
Model Variables. For proficiency estimation purposes, we do not consider the initial response
categories again; only the overall response category information is sent to the Scoring Engine.
5. Using the graph below, predict which zone most likely has a tree in it and give one reason to support your prediction.
Schoolyard Animals
0
5
10
15
20
25
Zone A Zone B
Num
ber
of A
nim
als
SquirrelsBirdsAntsPillbugs
I think that zone ____________ has a tree in it because

PADI Measurement Model Examples 27
The Measurement Model for the task shown in Figure 17 is shown in Figure 18. Note that the
Measurement Model contains one Observable Variable, BioKIDS pre/post item 5, and two
Student Model Variables, Biodiversity content and BioKIDS overall inquiry.
Figure 18. Measurement Model from the PADI design system for BioKIDS Item 5.
OV1 SMV1
SMV2

28 PADI Measurement Model Examples
Scoring Matrix:
SMV1 SMV2
Category 1 (0,0)
Category 2 (0,1)
Category 3 (0,2)
Category 4 (1,0)
Category 5 (1,1)
Category 6 (1,2)
⎥⎥⎥⎥⎥⎥⎥⎥
⎦
⎤
⎢⎢⎢⎢⎢⎢⎢⎢
⎣
⎡
211101201000
The Scoring Matrix for the Measurement Model shown in Figure 18 is shown in Figure 19.4
Figure 19. PADI design system Scoring Matrix for BioKIDS Item 5.
There are a number of options for generating Design Matrices for this example. The simplest is
to assume the saturated model, shown below.
Saturated Design Matrix:
δ1 δ2 δ3 δ4 δ5 Category 1 (0,0)
Category 2 (0,1)
Category 3 (0,2)
Category 4 (1,0)
Category 5 (1,1)
Category 6 (1,2) ⎥⎥⎥⎥⎥⎥⎥⎥
⎦
⎤
⎢⎢⎢⎢⎢⎢⎢⎢
⎣
⎡
100000100000100000100000100000
4 Note that the PADI design system automatically numbers categories beginning with 0, rather than 1.
PADI Measurement Model Examples 29
These matrices are transformed by the Scoring Engine into the following probability equations:
.categories allfor numerators theof sum theis ))((exp
thatand ;0))((and 1)0exp( sconvention theNote
))((exp
)2exp()5(
;))((exp
)exp()4(
;))((exp
)exp()3(
;))((exp
)2exp()2(
;))((exp
)exp()1(
;))((exp
1)0(
0 021
0
0j21
5
0 021
521
5
0 021
421
5
0 021
31
5
0 021
22
5
0 021
12
5
0 021
∑ ∑
∑
∑ ∑
∑ ∑
∑ ∑
∑ ∑
∑ ∑
∑ ∑
= =
=
= =
= =
= =
= =
= =
= =
−+
≡−+≡
−+
−+==
−+
−+==
−+
−==
−+
−==
−+
−==
−+==
m
k
k
jjijj
jijj
k
k
jijjj
ii
k
k
jijjj
ii
k
k
jijjj
ii
k
k
jijjj
ii
k
k
jijjj
ii
k
k
jijjj
i
xP
xP
xP
xP
xP
xP
δθθ
δθθ
δθθ
δθθ
δθθ
δθθ
δθθ
δθ
δθθ
δθ
δθθ
δθ
δθθ
Another straightforward approach for generating the Design Matrix is to assume no interaction
effects between the difficulty of the task and the Student Model Variables and treat the
Observable Variable as a normal partial credit model with three steps, one for each “total score”
possibility. The Design Matrix implemented for the Measurement Model shown in Figure 19 is
shown in Figure 20.5
5 A six-category item has five step parameters, one for each transition between score levels.
and that
is the sum of the numerators for all categories.
and Note the conventions

30 PADI Measurement Model Examples
Partial Credit Design Matrix:
δ1 δ2 δ3 Category 1 (0,0)
Category 2 (0,1)
Category 3 (0,2)
Category 4 (1,0)
Category 5 (1,1)
Category 6 (1,2) ⎥⎥⎥⎥⎥⎥⎥⎥
⎦
⎤
⎢⎢⎢⎢⎢⎢⎢⎢
⎣
⎡
111011001011001000
Figure 20. PADI design system Design Matrix for BioKIDS Item 5.
Another approach is to create parameters associated with the Student Model Variables. For
example, a response in the second category may be associated with the difficulty of achieving
a response at step 1 on the second Student Model Variable for the aggregate item, denoted
δD2,1 in the Design Matrix below. In this case, the Design Matrix parameters simply reflect the
combined difficulty of getting the two response categories, one for each Student Model
Variable. For example, to achieve an overall response in the third category, the respondent
needs enough ability to achieve at the third category level on the second Student Model
Variable (δD2,1 + δD2,2), but no incremental ability for the first Student Model Variable is required.
Design Matrix for Parameters Associated with Student Model Variables:
δD1,1 δD2,1 δD2,2 Category 1 (0,0)
Category 2 (0,1)
Category 3 (0,2)
Category 4 (1,0)
Category 5 (1,1)
Category 6 (1,2) ⎥⎥⎥⎥⎥⎥⎥⎥
⎦
⎤
⎢⎢⎢⎢⎢⎢⎢⎢
⎣
⎡
111011001110010000
In some cases, the Design Matrix may need to change to reflect a more complex
conceptualization of item difficulties that includes interaction effects among multiple Student

PADI Measurement Model Examples 31
Model Variables. For example, the first item parameter may represent the difficulty of the first
Student Model Variable, conditioned on a response in the first category on the second Student
Model Variable. The second parameter may represent the difficulty of getting a response in the
second category on the second Student Model Variable, conditioned on a response in the first
category on the first Student Model Variable.
Determining whether parameters are dependent or independent usually requires empirical
analysis. An MRCML analysis can be useful in determining which model provides the best fit to
the data. Clearly, the manner in which items are calibrated must be reflected in the Scoring and
Design Matrices when proficiency estimates are subsequently requested of the Scoring Engine.
Similarly, the selection of between-item or within-item multidimensionality also should be
confirmed empirically. Although task designers may have a hypothesis about how various
Student Model Variables work together and whether responses are conditionally dependent or
independent, an analysis of alternative models may provide additional information that leads
to new insights about the processes involved in performance of the task.
5.2 Modeling Observable Variables That Are Not Conditionally Independent
These examples describe the modeling of assessment tasks in which individual responses are
considered dependent. A bundling procedure is implemented prior to generating the
Measurement Models and Observable Variables that will be sent to the Scoring Engine.
5.2.1 A Simple Bundling Example
When a single prompt leads to multiple Work Products and responses from students, it is likely
that the responses have some conditional dependencies. For example, if a prompt asks
students to compute the average distance traveled by three objects and the intermediate
responses giving the distance traveled for each object are scored, then the final response
depends to some extent on the intermediate responses.
If we use only the final response to compute proficiency estimates, conditional dependence is
not an issue; however, if we wish to capture more of the information available about student
thinking, we will want to retain the information from the intermediate responses, and the
conditional dependencies must be modeled in some way.
An item bundle can be used to model dependencies between items. The bundling is
implemented prior to sending the data to the Scoring Engine. First, individual item responses
are evaluated, and then a procedure for combining the intermediate item responses into a
new, aggregated (bundled) response is implemented. Only the final bundled response is
transmitted to the Scoring Engine and used in estimating proficiencies.
In the PADI design system, bundling is implemented in the Evaluation Phases during scoring of
the Observable Variables. First, individual Observable Variables are evaluated; then the
procedure for combining Observable Variables into a new Observable Variable is implemented,
resulting in a single “bundled” Observable Variable. As in the within-item multidimensional
case above, the intermediate Observable Variables are not sent to the Scoring Engine; only the
final bundled Observable Variable is used in estimating proficiencies.

32 PADI Measurement Model Examples
For the simple unidimensional case, consider three dichotomous Observable Variables in the
bundle, with each mapping to the same Student Model Variable. One can use a complete
model with all possible score combinations mapping to a unique final response category, or
one can use a reduced model if some of the possible response categories are not needed or if it
makes sense to collapse some categories.
The bundle, rather than individual Observable Variables, maps to the Scoring Matrix and the
Design Matrix. In this example, the bundle has eight response patterns (the number of
representations of three observable variables with two categories each), represented by eight
response categories. We refer to the case in which each pattern is associated with a unique
score as an “ordered bundle.”
Ordered Scoring Matrix:
SMV1
Category 1 (0,0,0)
Category 2 (0,0,1)
Category 3 (0,1,0)
Category 4 (0,1,1)
Category 5 (1,0,0)
Category 6 (1,0,1)
Category 7 (1,1,0)
Category 8 (1,1,1) ⎥⎥⎥⎥⎥⎥⎥⎥⎥⎥⎥
⎦
⎤
⎢⎢⎢⎢⎢⎢⎢⎢⎢⎢⎢
⎣
⎡
76543210
In this Scoring Matrix, a response pattern consisting of a response in the first category of item 1,
a response in the second category of item 2, and a response in the first category of item 3 (i.e.,
incorrect responses on items 1 and 3 and a correct response on item 2) would be associated
with the score of 2.
This item bundle can be treated like a partial credit item, and construction of the Design Matrix
would follow from the example in Section 5.1.2. The matrix would have seven columns, one for
each step.
A partially ordered Scoring Matrix (i.e., we can differentiate among bundle sum scores of 0, 1, 2,
or 3, but not among bundle categories 2, 3, and 4 or categories 5, 6, and 7) is shown below:

PADI Measurement Model Examples 33
Partially Ordered Scoring Matrix:
SMV1
Category 1 (0,0,0)
Category 2 (0,0,1)
Category 3 (0,1,0)
Category 4 (0,1,1)
Category 5 (1,0,0)
Category 6 (1,0,1)
Category 7 (1,1,0)
Category 8 (1,1,1) ⎥⎥⎥⎥⎥⎥⎥⎥⎥⎥⎥
⎦
⎤
⎢⎢⎢⎢⎢⎢⎢⎢⎢⎢⎢
⎣
⎡
32221110
This is another type of partial credit model, and the Design Matrix again would follow from the
example in Section 5.1.2. This Design Matrix could have three columns, one for each score
category. Alternatively, one could design a saturated Design Matrix with a parameter for each
response category, resulting in a matrix with seven columns.
5.2.2 Between-Item Multidimensional Bundle
In some cases, individual responses are conditionally dependent and are also indicators of
different Student Model Variables. For example, in an interactive assessment of physics
knowledge, students are required to select an appropriate equation for solving a speed
problem (OV1), place the correct values into the equation (OV2), and then compute the average
speed (OV3). An example of this type of problem is shown in Figure 21.

34 PADI Measurement Model Examples
Figure 21. A between-item multidimensional bundle.1
1 From “FOSS Middle School Course Force and Motion Practice Problems” [computer software], developed at the Lawrence
Hall of Science. Copyright 2004 by the Regents of the University of California. Reprinted with permission of the author.

PADI Measurement Model Examples 35
Clearly, the three responses are conditionally dependent because selecting the wrong
equation will usually lead to the wrong final answer, as will selecting the wrong values for the
variables in the equation. However, selecting the equation and choosing the correct values for
the variables provide evidence about the student’s knowledge of physics, while solving the
equation provides evidence of mathematical ability. In this example, Observable Variables 1
and 2 are indicators of SMV1 (physics), and Observable Variable 3 is an indicator of SMV2
(mathematics).
First, the three responses are evaluated individually as correct or incorrect or as a response in
the first category or a response in the second category. Then, the appropriate bundle category
is determined from the pattern of responses on the three items. Note that this example is
similar to the example in Section 5.1.4, but here the items are treated as conditionally
dependent.
Scoring Matrix:
SMV1 SMV2 Category 1 (0,0,0)
Category 2 (0,0,1) from OV 3 only
Category 3 (0,1,0) from OV 2 only
Category 4 (0,1,1) from OVs 2 and 3
Category 5 (1,0,0) from OV 1 only
Category 6 (1,0,1) from OVs 1 and 3
Category 7 (1,1,0) from OVs 1 and 2
Category 8 (1,1,1)
⎥⎥⎥⎥⎥⎥⎥⎥⎥⎥⎥
⎦
⎤
⎢⎢⎢⎢⎢⎢⎢⎢⎢⎢⎢
⎣
⎡
1202110111011000
from OVs 1, 2 and 3
The Design Matrix would follow any of the forms suggested in the example from this section.
SMV1
SMV2
OV1
OV2
OV3

36 PADI Measurement Model Examples
5.2.3 Within-Item Multidimensional Bundle
If, instead of associating each Observable Variable with one Student Model Variable, we were
to associate one Observable Variable with multiple Student Model Variables in the example
from Section 5.2.2, we would need to construct a within-item multidimensional bundle. For
example, we may believe that selecting the correct values to place into the equation (from the
example from Section 5.2.2) requires both physics knowledge and mathematical ability. In that
case, Observable Variable 1 is an indicator of the physics Student Model Variable, Observable
Variable 3 is an indicator of the mathematics Student Model Variable, and Observable Variable
2 is an indicator of both physics and mathematics.
Scoring Matrix:
SMV1 SMV2 Category 1 (0,0,0)
Category 2 (0,0,1) from OV 3 only
Category 3 (0,1,0) from OV 2 only
Category 4 (0,1,1) from OVs 2 and 3
Category 5 (1,0,0) from OV 1 only
Category 6 (1,0,1) from OV 1 and 3
Category 7 (1,1,0) from OVs 1 and 2
Category 8 (1,1,1)
⎥⎥⎥⎥⎥⎥⎥⎥⎥⎥⎥
⎦
⎤
⎢⎢⎢⎢⎢⎢⎢⎢⎢⎢⎢
⎣
⎡
2212110121111000
from all OVs
The associated Design Matrix would also need to capture any interaction effects between the
two dimensions (as in the example from Section 5.1.4).
5.3 Modeling a Complete Assessment
The MRCML literature generally refers to Scoring and Design Matrices for an entire assessment.
The BEAR Scoring Engine, on the other hand, expects Measurement Models to be constructed
at the Observable Variable level. This approach encourages reuse of components with similar
measurement features. The Scoring Engine constructs a complete assessment Measurement
Model from these individual Observable Variable models. The following examples of
assessment-oriented matrices are shown to assist the reader in differentiating the approach
used by the Scoring Engine from that used by assessment-oriented MRCML programs, such as
ConQuest (Wu, Adams, & Wilson, 2005) and GradeMap (Kennedy, Wilson, & Draney, 2005).
SMV1
SMV2
OV1
OV2
OV3

PADI Measurement Model Examples 37
5.3.1 Unidimensional Dichotomous Model
In the case of an assessment with 10 dichotomous Observable Variables, the associated
matrices would have the form:
Assessment Scoring Matrix:
SMV1 OV 1, category 1
OV 1, category 2
OV 2, category 1
OV 2, category 2
OV 3, category 1
OV 3, category 2
OV 4, category 1
OV 4, category 2
OV 5, category 1
OV 5, category 2
OV 6, category 1
OV 6, category 2
OV 7, category 1
OV 7, category 2
OV 8, category 1
OV 8, category 2
OV 9, category 1
OV 9, category 2
OV 10, category 1
OV 10, category 2 ⎥⎥⎥⎥⎥⎥⎥⎥⎥⎥⎥⎥⎥⎥⎥⎥⎥⎥⎥⎥⎥⎥
⎦
⎤
⎢⎢⎢⎢⎢⎢⎢⎢⎢⎢⎢⎢⎢⎢⎢⎢⎢⎢⎢⎢⎢⎢
⎣
⎡
10101010101010101010
Assessment Design Matrix:
δ1 δ2 δ3 δ4 δ5 δ6 δ7 δ8 δ9 δ10 OV 1, category 1
OV 1, category 2
OV 2, category 1
OV 2, category 2
OV 3, category 1
OV 3, category 2
OV 4, category 1
OV 4, category 2
OV 5, category 1
OV 5, category 2
OV 6, category 1
OV 6, category 2
OV 7, category 1
OV 7, category 2
OV 8, category 1
OV 8, category 2
OV 9, category 1
OV 9, category 2
OV 10, category 1
OV 10, category 2 ⎥⎥⎥⎥⎥⎥⎥⎥⎥⎥⎥⎥⎥⎥⎥⎥⎥⎥⎥⎥⎥⎥
⎦
⎤
⎢⎢⎢⎢⎢⎢⎢⎢⎢⎢⎢⎢⎢⎢⎢⎢⎢⎢⎢⎢⎢⎢
⎣
⎡
10000000000000000000010000000000000000000010000000000000000000010000000000000000000010000000000000000000010000000000000000000010000000000000000000010000000000000000000010000000000000000000010000000000

38 PADI Measurement Model Examples
5.3.2 Unidimensional Partial Credit Model
For an assessment with five Observable Variables in which OVs 1 through 3 have five categories
and OVs 4 and 5 have three categories, the matrices would take the form:
Assessment Scoring Matrix:
SMV1 OV 1, category 1
OV 1, category 2
OV 1, category 3
OV 1, category 4
OV 1, category 5
OV 2, category 1
OV 2, category 2
OV 2, category 3
OV 2, category 4
OV 2, category 5
OV 3, category 1
OV 3, category 2
OV 3, category 3
OV 3, category 4
OV 3, category 5
OV 4, category 1
OV 4, category 2
OV 4, category 3
OV 5, category 1
OV 5, category 2
OV 5, category 3 ⎥⎥⎥⎥⎥⎥⎥⎥⎥⎥⎥⎥⎥⎥⎥⎥⎥⎥⎥⎥⎥
⎦
⎤
⎢⎢⎢⎢⎢⎢⎢⎢⎢⎢⎢⎢⎢⎢⎢⎢⎢⎢⎢⎢⎢
⎣
⎡
210210432104321043210
Assessment Design Matrix: δ11 δ12 δ13 δ14 δ21 δ22 δ23 δ24 δ31 δ32 δ33 δ34 δ41 δ42 δ51 δ52 OV 1, category 1
OV 1, category 2
OV 1, category 3
OV 1, category 4
OV 1, category 5
OV 2, category 1
OV 2, category 2
OV 2, category 3
OV 2, category 4
OV 2, category 5
OV 3, category 1
OV 3, category 2
OV 3, category 3
OV 3, category 4
OV 3, category 5
OV 4, category 1
OV 4, category 2
OV 4, category 3
OV 5, category 1
OV 5, category 2
OV 5, category 3 ⎥⎥⎥⎥⎥⎥⎥⎥⎥⎥⎥⎥⎥⎥⎥⎥⎥⎥⎥⎥⎥
⎦
⎤
⎢⎢⎢⎢⎢⎢⎢⎢⎢⎢⎢⎢⎢⎢⎢⎢⎢⎢⎢⎢⎢
⎣
⎡
110000000000000001000000000000000000000000000000001100000000000000010000000000000000000000000000000011110000000000000111000000000000001100000000000000010000000000000000000000000000000011110000000000000111000000000000001100000000000000010000000000000000000000000000000011110000000000000111000000000000001100000000000000010000000000000000

PADI Measurement Model Examples 39
5.3.3 Unidimensional Rating Scale Model
The rating scale model is considered a special case of the partial credit model. All Observable
Variables of the rating scale type for a particular assessment must use the same parameter
estimates for the steps. The matrices below are appropriate for an assessment with five four-
category Observable Variables.
Assessment Scoring Matrix:
SMV1 OV 1, category 1
OV 1, category 2
OV 1, category 3
OV 1, category 4
OV 2, category 1
OV 2, category 2
OV 2, category 3
OV 2, category 4
OV 3, category 1
OV 3, category 2
OV 3, category 3
OV 3, category 4
OV 4, category 1
OV 4, category 2
OV 4, category 3
OV 4, category 4
OV 5, category 1
OV 5, category 2
OV 5, category 3
OV 5, category 4 ⎥⎥⎥⎥⎥⎥⎥⎥⎥⎥⎥⎥⎥⎥⎥⎥⎥⎥⎥
⎦
⎤
⎢⎢⎢⎢⎢⎢⎢⎢⎢⎢⎢⎢⎢⎢⎢⎢⎢⎢⎢
⎣
⎡
32103210321032103210
Assessment Design Matrix:
δ1 δ2 δ3 δ4 δ5 τ1 τ2
OV 1, category 1
OV 1, category 2
OV 1, category 3
OV 1, category 4
OV 2, category 1
OV 2, category 2
OV 2, category 3
OV 2, category 4
OV 3, category 1
OV 3, category 2
OV 3, category 3
OV 3, category 4
OV 4, category 1
OV 4, category 2
OV 4, category 3
OV 4, category 4
OV 5, category 1
OV 5, category 2
OV 5, category 3
OV 5, category 4 ⎥⎥⎥⎥⎥⎥⎥⎥⎥⎥⎥⎥⎥⎥⎥⎥⎥⎥⎥⎥
⎦
⎤
⎢⎢⎢⎢⎢⎢⎢⎢⎢⎢⎢⎢⎢⎢⎢⎢⎢⎢⎢⎢
⎣
⎡
00300001120000011000000000000003000110200001010000000000000030011002000100100000000000000301100020010001000000000000003110000201000010000000

40 PADI Measurement Model Examples
5.3.4 Between-Item Multidimensional Model
For an assessment with five Observable Variables in which OVs 1 through 3 are indicators of the
first Student Model Variable and have five categories and OVs 4 and 5 are indicators of the
second Student Model Variable and have three categories, the assessment matrices would take
the form:
Assessment Scoring Matrix: D1 OV 1, category 1
OV 1, category 2
OV 1, category 3
OV 1, category 4
OV 1, category 5
OV 2, category 1
OV 2, category 2
OV 2, category 3
OV 2, category 4
OV 2, category 5
OV 3, category 1
OV 3, category 2
OV 3, category 3
OV 3, category 4
OV 3, category 5
OV 4, category 1
OV 4, category 2
OV 4, category 3
OV 5, category 1
OV 5, category 2
OV 5, category 3 ⎥⎥⎥⎥⎥⎥⎥⎥⎥⎥⎥⎥⎥⎥⎥⎥⎥⎥⎥⎥
⎦
⎤
⎢⎢⎢⎢⎢⎢⎢⎢⎢⎢⎢⎢⎢⎢⎢⎢⎢⎢⎢⎢
⎣
⎡
201000201000040302010004030201000403020100
Assessment Design Matrix: δ11 δ12 δ13 δ14 δ21 δ22 δ23 δ24 δ31 δ32 δ33 δ34 δ41 δ42 δ51 δ52 OV 1, category 1
OV 1, category 2
OV 1, category 3
OV 1, category 4
OV 1, category 5
OV 2, category 1
OV 2, category 2
OV 2, category 3
OV 2, category 4
OV 2, category 5
OV 3, category 1
OV 3, category 2
OV 3, category 3
OV 3, category 4
OV 3, category 5
OV 4, category 1
OV 4, category 2
OV 4, category 3
OV 5, category 1
OV 5, category 2
OV 5, category 3 ⎥⎥⎥⎥⎥⎥⎥⎥⎥⎥⎥⎥⎥⎥⎥⎥⎥⎥⎥⎥⎥
⎦
⎤
⎢⎢⎢⎢⎢⎢⎢⎢⎢⎢⎢⎢⎢⎢⎢⎢⎢⎢⎢⎢⎢
⎣
⎡
110000000000000001000000000000000000000000000000001100000000000000010000000000000000000000000000000011110000000000000111000000000000001100000000000000010000000000000000000000000000000011110000000000000111000000000000001100000000000000010000000000000000000000000000000011110000000000000111000000000000001100000000000000010000000000000000
SMV1
SMV2
OV1
OV2
OV3
OV4
OV5

PADI Measurement Model Examples 41
5.3.5 Within-Item Multidimensional Partial Credit Model
For an assessment with five Observable Variables in which OVs 1 and 2 are indicators of the first
Student Model Variable with five categories, OV 3 is an indicator of the second Student Model
Variable with three categories, and OVs 4 and 5 are indicators of both Student Model Variables
with three categories, the assessment matrices would take the form:
Assess. Scoring Matrix:
SMV1 SMV2
OV 1, category 1
OV 1, category 2
OV 1, category 3
OV 1, category 4
OV 1, category 5
OV 2, category 1
OV 2, category 2
OV 2, category 3
OV 2, category 4
OV 2, category 5
OV 3, category 1
OV 3, category 2
OV 3, category 3
OV 3, category 4
OV 3, category 5
OV 4, category 1
OV 4, category 2
OV 4, category 3
OV 5, category 1
OV 5, category 2
OV 5, category 3
⎥⎥⎥⎥⎥⎥⎥⎥⎥⎥⎥⎥⎥⎥⎥⎥⎥⎥⎥⎥
⎦
⎤
⎢⎢⎢⎢⎢⎢⎢⎢⎢⎢⎢⎢⎢⎢⎢⎢⎢⎢⎢⎢
⎣
⎡
221100221100403020100004030201000403020100
Assessment Design Matrix:
δ11 δ12 δ13 δ14 δ21 δ22 δ23 δ24 δ31 δ32 δ33 δ34 δ41 δ42 δ51 δ52 OV 1, category 1
OV 1, category 2
OV 1, category 3
OV 1, category 4
OV 1, category 5
OV 2, category 1
OV 2, category 2
OV 2, category 3
OV 2, category 4
OV 2, category 5
OV 3, category 1
OV 3, category 2
OV 3, category 3
OV 3, category 4
OV 3, category 5
OV 4, category 1
OV 4, category 2
OV 4, category 3
OV 5, category 1
OV 5, category 2
OV 5, category 3 ⎥⎥⎥⎥⎥⎥⎥⎥⎥⎥⎥⎥⎥⎥⎥⎥⎥⎥⎥⎥⎥
⎦
⎤
⎢⎢⎢⎢⎢⎢⎢⎢⎢⎢⎢⎢⎢⎢⎢⎢⎢⎢⎢⎢⎢
⎣
⎡
110000000000000001000000000000000000000000000000001100000000000000010000000000000000000000000000000011110000000000000111000000000000001100000000000000010000000000000000000000000000000011110000000000000111000000000000001100000000000000010000000000000000000000000000000011110000000000000111000000000000001100000000000000010000000000000000
SMV1
SMV2
OV1
OV2
OV3
OV4
OV5

42 Conclusions
6.0 Conclusions
These examples show how a number of assessment tasks, ranging from simple true/false
questions to complex problems involving a series of constructed responses, could be modeled
with the PADI design system. The data structures of the design system, particularly the Student
Model, Evaluation Procedure, and Measurement Model objects, are used to represent the
components that contribute to the design of a coherent assessment system. In particular,
student Work Products are designed to elicit evidence about the student measures of interest
as defined in a Student Model, Evaluation Procedures define how student work is to be
evaluated and stored in Observable Variables, and Measurement Models specify how
inferences about the student measures are to be drawn from the Observable Variables. The
BEAR Scoring Engine implements a Rasch-based multidimensional item response model to
arrive at proficiency estimates by using the set of Scoring Matrices, Design Matrices, and
Calibration Parameters contained in PADI design system Measurement Models of the
Observable Variables associated with an assessment.
Assessment developers can improve the interpretability and consistency of assessment
measures by reusing PADI design system components in multiple tasks within an assessment
system. Once the inferential structures of tasks are defined, developers can specify
presentation details to generate a large number of assessment items. Different students can
then be given different assessment tasks (or they can be given the same tasks) to produce
comparable proficiency estimates. In addition, these measures can be used in a formative
feedback loop and for longitudinal analyses of student change without the consistency
problems associated with more traditional classroom testing environments, in which the tests
change with the curriculum or from one grade to another. The PADI design system, paired with
the BEAR Scoring Engine, brings advances in assessment and measurement research to an
assessment developer’s toolbox.

References 43
References
Adams, R., Wilson, M., & Wang, W. (1997). The multidimensional random coefficients
multinomial logit model. Applied Psychological Measurement, 21(1), 1-23.
Almond, R. G., Steinberg, L. S., & Mislevy, R. J. (2002). A four-process architecture for assessment
delivery with connections to assessment design. Journal of Technology, Learning, and
Assessment, 1(5), 1-64.
Connecticut State Department of Education. (2005). Core science curriculum framework: Matrix
of K-10 concept development. Retrieved 3/17/05 from
http://www.state.ct.us/sde/dtl/curriculum/science/framework/Matrix2005.doc
Embretson, S. E. (1996). The new rules of measurement. Psychological Assessment, 8(4), 341-349.
Full Option Science System (2004). Self-assessment system v1.0. [Computer software]. Berkeley,
CA: Lawrence Hall of Science.
Hoskens, M., & De Boeck, P. (1997). A parametric model for local dependence among test items.
Psychological Methods, 2, 261-277.
Kennedy, C. A., Wilson, M., & Draney, K. (2005). GradeMap v4.2 [computer program]. Berkeley,
CA: University of California, Berkeley Evaluation and Assessment Research Center.
Mislevy, R. J., Hamel, L., Fried, R., Gaffney, T., Haertel, G., Hafter, A. et al. (2003). Design patterns
for assessing science inquiry (PADI Technical Report 1). Menlo Park, CA: SRI International.
National Research Council. (2001). Knowing what students know: The science and design of
educational assessment. Committee on the Foundations of Assessment. J. W. Pellegrino, N.
Chudowsky, & R. Glaser, (Eds.). Washington, DC: National Academy Press.
National Research Council. (1996). National Science Education Standards. Committee on Science
Education Standards and Assessment. Washington, DC: National Academy Press.
Rasch, G. (1960). Probabilistic models for some intelligence and attainment tests. Copenhagen:
Danish Institute for Educational Research.
U.S. Department of Education. (n.d.). NCLB: Stronger accountability—testing for results. Retrieved
January 10, 2005, from http://www.ed.gov/nclb/accountability/ayp/testingforresults.html
Wang, W., Wilson, M., & Cheng, Y. (2000). Local dependence between latent traits when common
stimuli are used. Paper presented at the International Objective Measurement Workshop, New
Orleans, LA.
Wilson, M. (1992). The ordered partition model: An extension of the partial credit model.
Applied Psychological Measurement, 16(3), 309-325.
Wilson, M., & Adams R. J. (1995). Rasch models for item bundles. Psychometrika, 60, 181-198.
Wisconsin Department of Public Instruction. (2005). Wisconsin Model Academic Standards:
Science introduction. Retrieved March 17, 2005 from
http://www.dpi.state.wi.us/standards/sciintro.html

44 References
Wright, B. D. (1993). Equitable test equating. Rasch Measurement Transactions, 7(2), 298-299.
Wright, B. D. (1968). Sample-free test calibration and person measurement. In Proceedings of the
1967 Invitational Conference on Testing (pp. 85-101). Princeton, NJ: Educational Testing Service.
Wright, B. D. (1977). Solving measurement problems with the Rasch model. Journal of
Educational Measurement, 14, 97-116.
Wu, M., Adams, R., & Wilson, M. (2005). ACER ConQuest [computer program]. Hawthorn,
Australia: Australian Council for Educational Research.

Appendix A—Input and Output XML Documents for the BEAR Scoring Engine 45
Appendix A—Input and Output XML Documents for the BEAR Scoring Engine
A.1 Input Documents
Input to the BEAR Scoring Engine consists of two XML documents: a model document and a
student results document. The student results document is IMS/QTI compliant, while the
model document is designed specifically to transmit the information needed to construct the
MRCML algorithms used by the Scoring Engine. Complete definitions of the schemas are
available on the Scoring Engine Web page at http://bearcenter.berkeley.edu/padi/. In this
appendix, we cover the basic elements of the schemas as they relate to the MRCML information
required by the BEAR Scoring Engine.
A.1.1 Model Document
Essential Student Model information is stored in the following XML elements of the model
document, shown in Figure A-1:
<SM_DISTRIBUTION_TYPE>
<COVAR_MATRIX>
<SM_DIST_MEAN>
The distribution type specified in the figure is “Multivariate normal,” with two Student Model
Variables indicated, “Distance-Speed-Acceleration” and “FOSS Math Inquiry SMV.” The
population model consists of a covariance matrix, ⎥⎦
⎤⎢⎣
⎡75.100601.
, and a means matrix,
[ ]00 .
Figure A-1. Student Model information in the XML model file.
Measurement Model information is organized by scorable units, or Observable Variables, with
exactly one Measurement Model for each Observable Variable. The collection of Measurement
Modes received by the Scoring Engine is assembled into an assessment Measurement Model.
Each OV Measurement Model must contain the following XML elements of the model
document:
<OBSERVABLE_VARIABLE>

46 Appendix A—Input and Output XML Documents for the BEAR Scoring Engine
<SCORING_MATRIX>
<DESIGN_MATRIX>
<CALIBRATION_PARAMETERS>
Figure A-2. Measurement Model part of XML model specification file showing the
Observable Variable elements for the “FOSS DSA MM Pilot Item 1” Observable Variable.
The example shown in Figure A-2 and A-3 is a Measurement Model for the “FOSS DSA Bundle
MM Pilot Item 1” Observable Variable. We note in Figure A-2 that the Observable Variable has
five response categories. In Figure A-3 we see that the scoring matrix has a single column and is
associated with the “Distance-Speed-Acceleration” Student Model Variable. The Design Matrix
contains a <STEP–ITEM> element for each of the four step parameters (recall that the number
of step parameters is one fewer than the number of categories). All four Calibration Parameter
values are shown for the Measurement Model.

Appendix A—Input and Output XML Documents for the BEAR Scoring Engine 47
Figure A-3. Measurement Model part of XML model specification file showing the Scoring
Matrix, Design Matrix, and Calibration Parameter elements for the “FOSS DSA MM Pilot
Item 1” Observable Variable.

48 Appendix A—Input and Output XML Documents for the BEAR Scoring Engine
A.1.2 Student Results Document
Student results data are organized by student, with one or more scores (Observable Variable
values) per student. Essential results data are stored in the following XML elements of the
Results document:
<name>
<item_result>
<score>
The connection from the <score> value in the Results XML document to the
OBSERVABLE_VARIABLE measurement model fragment in the Model XML document (refer to
Figure A-2) is made via <field_name >observable_variable_id <field_value> values in the
Results XML document associated with corresponding <OBSERVABLE_VARIABLE> IDENT values
in the Model XML document. In the excerpt shown in Figure A-4, the student name is “FOSS
pretest student 1” and this student has a score of 2 on the “FOSS DSA Bundle Final OV Pilot
Item 1” Observable Variable.
A.2 Output Document
Proficiency estimates and standard errors are returned in another Student Results XML
document, which is identical to the input document with values entered in two of the fields. As
shown in Figure A-4, the file contains an <assessment_result> section for each student. The
estimated proficiency on each Student Model Variable is found in the <SM_DIST_MEANS>
element, while the standard error is found in the <COVAR_MATRIX> tag. In this case, the
student, “FOSS pretest student 1” had a proficiency estimate of 0.637 on the “Distance-Speed-
Acceleration” Student Model Variable and of .888 on the “Math Inquiry” Student Model
Variable. Standard errors of the estimates were .129 and .382, respectively.

Appendix A—Input and Output XML Documents for the BEAR Scoring Engine 49
Figure A-4. Student results input file.

50 Appendix A—Input and Output XML Documents for the BEAR Scoring Engine
Figure A-5. Output student results file.

Appendix B—Background Information about Item Response Modeling (IRM) 51
Appendix B—Background Information about Item Response Modeling (IRM)
B.1 Item Response Probability
When an item response has only two possible values, correct or incorrect, the item difficulty is
an expression of how much ability a person needs to give a correct answer. By convention, we
describe the item difficulty as the ability level at which the student is equally likely to give a
correct or incorrect response (that is, both probabilities are 0.5). In Figure B-1, for example, the
item difficulty is -0.18; this is the point on the Latent Trait (i.e., ability) axis at which the
probability curves for a correct and an incorrect response intersect.
Figure B-1. Item characteristic curves for a dichotomous (two-category) item.
When items have more than two possible outcomes, we need more information than the item
difficulty. We need to know how much more of the latent trait is needed to achieve each
possible score on the item. The partial credit case is an extension of the dichotomous case;
moving from one category to another implies a dichotomous choice between two levels. For
example, consider an item with three categories, scored 0, 1, or 2. The difficulty for step 1,
denoted as δi1, is located at the point where, if one is considering just categories 0 and 1, one is
equally likely to get the item partially correct (where x = 1) or incorrect (where x = 0). Note in
Figure B-2 that this is where the curve for getting a score of 0 intersects with the curve for
getting a score of 1. Subsequent steps in difficulty are interpreted in much the same way. The
second step difficulty, δi2, is the ability required to have equal probabilities of getting a score of
2 or a score of 1 on the item. As shown in Figure B-2, each category has its own probability
curve.

52 Appendix B—Background Information about Item Response Modeling (IRM)
Figure B-2. Category probability curves and δij values for a three-category polytomous
item.
The location at which a person has a 50% probability of achieving a score in that category or
higher is referred to as the Thurstonian threshold.6 These locations can be identified on
cumulative probability plots at the points where the curves intersect with the probability = 0.5
line, as shown in Figure B-3. These values tend to be more interpretable than δij values because
they identify ability levels where individuals are most likely to achieve specific scores. Figure B-
3 shows an item for which a person with an ability located at 0.6 is more likely to achieve a
score of 3 than a lower score, while a person with an ability located at 0 is more likely to achieve
a score of 2 or 3 than a score of 1 or 0 (the curve for a score of 0 is not displayed in Figure B-3).
This can be determined by examining the vertical lines at logit values of 0.00 and 0.60. For
example, at a logit value of 0.60 the vertical line intersects the probability = 0.5 line in the area
where the most probably score is 3. At a logit value of 0.00 the vertical line intersects the
probability = 0.5 line in the area where the most probably score is 2 or higher.
6 Wilson, M. (2005). Constructing measures: An item response modeling approach. Mahwah, NJ: Lawrence Erlbaum Associates.

Appendix B—Background Information about Item Response Modeling (IRM) 53
Figure B-3. Cumulative probability curves and Thurstonian thresholds for a four-category
polytomous item.
B.2 Measurement Models
To compute the probability of attaining a score of 1 rather than 0 on item i, given an item
difficulty parameter of δi and a specific student proficiency of θ (in the unidimensional case), we
use a Rasch formulation7 in the form:
)exp(1)exp(
)1()0()1(),|1(
i
iii xPxP
xPxPδθ
δθδθ−+
−=
=+==
== (1)
For this dichotomous case, we have two probability equations:
)exp(11)0(
1δθ −+==xP ; and
)exp(1)exp()1(1
1
δθδθ−+
−==xP .
For the polytomous case (i.e., the partial credit model8) the following equation shows the
probability that a person with ability θ will respond in category c rather than in any other
category on item i, given item difficulty parameters ξi = (δi1, δi2, … δim).
7 Rasch, G. (1980). Probabilistic models for some intelligence and attainment tests. Chicago, IL: University of Chicago Press. (Original work published in 1960) 8 Wright, B. D., & Masters, G. (1981). The measurement of knowledge and attitude (Research Memorandum 30). Chicago, IL: University of Chicago, Department of Education, Statistical Laboratory.

54 Appendix B—Background Information about Item Response Modeling (IRM)
∑ ∑
∑
= =
=
−
−== m
k
k
jij
c
jij
ii cxP
0 0
0
)(exp
)(exp),|(
δθ
δθξθ , (2)
where m is the number of steps (number of categories-1) for the item.
Thus, for a three-category item (with two steps),
)).(2exp()exp( 1 :categories allfor numerators theof sum theis )(exp
thatand ;0)(and 1)0exp( sconvention theNote
.)(exp
))(2exp(
)(exp
)exp(
)(exp
)(exp)2(
and;)(exp
)exp(
)(exp
)(exp)1(
;)(exp
1)0(
2110 0
0
0j
2
0 0
212
0 0
212
0 0
2
0
2
0 0
12
0 0
1
0
2
0 0
iii
m
k
k
jij
ij
k
k
jij
ii
k
k
jij
ii
k
k
jij
jij
k
k
jij
i
k
k
jij
jij
k
k
jij
xP
xP
xP
δδθδθδθ
δθ
δθ
δδθ
δθ
δθδθ
δθ
δθ
δθ
δθ
δθ
δθ
δθ
+−+−+−
≡−≡
−
+−=
−
−+−=
−
−==
−
−=
−
−==
−==
∑ ∑
∑
∑ ∑∑ ∑∑ ∑
∑
∑ ∑∑ ∑
∑
∑ ∑
= =
=
= == == =
=
= == =
=
= =
When using the partial credit model, we generally parameterize the difficulty of achieving a
score of j on item i and represent it with δij. That is, δij is the ability level required to expect an
equal chance of responding in category j or in category j-1 on item i. Alternatively, we might
think of the average of the δij values as an overall item difficulty and the step difficulties as each
step’s deviation from the average. In looking at item difficulties in this way, we are saying that
each δij is a composite of δi + τij, where τij is the deviation from the average item difficulty for
item i at step j. Note that in this case the last tau parameter (τ) is equal to the negative sum of
the others so that the sum of all the tau parameters equals zero, ∑−
=
−=1
1
m
kikim ττ . A graphical
representation of this alternative formulation (δi + τij,) for an item with two steps (and therefore
three categories) is shown in Figure B-4.
and that
is the sum of the numerators for all categories:
and Note the conventions
and

Appendix B—Background Information about Item Response Modeling (IRM) 55
Figure B-4. δi, τ1, and τ2 representations for the polytomous case with three categories.
The rating scale model is a special case of the partial credit model in which the tau parameters
for step j are the same for every item. That is, τ11=τ21=τ31... and τ12=τ22=τ32.... In this formulation,
our measurement model becomes
∑ ∑
∑
= =
=
+−
+−== m
k
k
jji
c
jji
ii cxP
0 0
0
)]([exp
)]([exp),|(
τδθ
τδθθξ , (3)
where ξI = (δi, τ1, τ2, ... ,τm-1). Again, the final step value, τm, is not estimated because it is
constrained to make the sum of all the steps equal to zero.
The different parameterization techniques of the step difficulties for partial credit models and
the item difficulties and tau parameters for rating scale models is an important distinction in
representing the probability equations in PADI design system Measurement Models. If a rating
scale model is to be used, all items that map to the same Student Model Variable must use the
same tau parameters. These parameterization options are discussed in more detail in the PADI
Measurement Model Examples section of this report.
The probability of a particular response pattern occurring is the continued product of the
probabilities of the individual responses on an instrument when the items are conditionally

56 Appendix B—Background Information about Item Response Modeling (IRM)
independent. When the items are not conditionally independent, item bundles9 can be
constructed during the evaluation phases. The random coefficients multinomial logit (RCML)
model10 formulates the conditional probability of a response pattern, x, as
∑Ω=
+′+′
==
zAξ(bzAξbx|xX
)exp()(exp()(
θθθP , (4)
where θ is person proficiency, b is the vector of response scores, A is the Design Matrix, ξ is the
vector of item parameters with ξ = (δ11, δ12, … , δ1m1, δ21, δ22, … , δImI), and Ω is the set of all
possible response patterns.
9 Wilson, M., & Adams R. J. (1995). Rasch models for item bundles. Psychometrika, 60, 181-198. Hoskens, M., & De Boeck, P. (1997). A parameteric model for local dependence among test items. Psychological Methods, 2, 261-277. 10 Adams, R. J., & Wilson, M. R. (1996). Formulating the Rasch model as a mixed coefficients multinomial logit. In G. Engelhard & M. Wilson (Eds.), Objective measurement: Theory into practice (Vol. 3). Norwood, NJ: Ablex.


SponsorThe National Science Foundation, Grant REC-0129331
Prime GranteeSRI International. Center for Technology in Learning
SubgranteesUniversity of Maryland
University of California, Berkeley. Berkeley Evaluation & Assessment Research (BEAR) Center and The Full Option Science System (FOSS)
University of Michigan. BioKIDs
P A D I
M I C H I G A NM I C H I G A N