constructing design methodologies using multi-agent systems fileconstructing design methodologies...
TRANSCRIPT

Constructing Design Methodologies Using Multi-agent Systems
Cirrus Shakeri
Dassault Systemes, KTI
Lexington, MA 02421
David C. Brown
Computer Science Department
Worcester Polytechnic Institute
Worcester, MA 01609
Corresponding Author:
Cirrus Shakeri
Dassault Systemes, KTI
10 Maguire Road, Suite 232
Lexington, MA 02421
Tel: 781-676-2148
Fax: 781-274-7700
manuscript pages: 32 + figures + tables
number of tables: 6
number of figures: 12
1

Constructing Design Methodologies Using Multi-agent Systems
Abstract
An innovative approach has been developed for discovering better design methodologies that is
based on simulating the design process using a multi-agent system that mimics the behavior of a
design team. The system implements a knowledge-based model of design in which highly special-
ized knowledge from expert sources is applied to synthesize a design. The agents activate the
pieces of design knowledge when they become applicable. The use of knowledge by agents is
recorded by tracing the steps that the agents have taken during a design project. Many traces are
generated by solving a large number of design projects that differ in their requirements. A set of
design methodologies is constructed by using inductive learning techniques to generalize the traces
generated. These methodologies then can be used to guide design teams through future design
projects.
Keywords: Design Process, Design Methodology, Multidisciplinary Design,
Artificial Intelligent in Design, Multi-agent System.
2

1. Introduction
This research is about the multi-disciplinary design of engineered systems. Examples of multi-dis-
ciplinary designs are aircraft, automobiles, robots, and buildings. This work extends the concept of
analysis-by-simulation to the area of engineering design research. Analyzing the behavior of phys-
ical systems in engineering applications by computer simulation has been a powerful tool in engi-
neering that has resulted in reducing costs and time in comparison to physical prototyping and
experimentation.
In this work the same concept is applied to analyzing the design process instead of the design
product. A computational model, in the form of a knowledge-based multi-agent system, simulates
the design process. By simulating under different conditions, and examining the performance,
detailed understanding of the design process is gained. Similar to simulations of physical systems,
the computational model of the design process is a simplified one in which the design activities that
are usually carried out by humans are performed by software agents in a slightly simplified manner.
We have developed these ideas using the multi-disciplinary domain of robot arm design.
1.1 Motivation
The goal of this research is to develop a systematic approach for constructing design methodolo-
gies. The needs and motivations for such a systematic approach are the following:
• Need for Continuous Improvement. In order to succeed in today’s global, competitive
market, companies need continuous design process improvements. These improvements
should result in expending fewer resources on the design process while achieving better
quality and more environmentally friendly products.
3

• Need for Rapid Incorporation of New Technologies. New technologies (e.g., new materi-
als, manufacturing processes, etc.) are emerging increasingly quickly. They not only
improve product quality but they also provide better ways to conduct the design process. We
need to incorporate new technologies and methods into design methodologies as quickly as
they appear.
• Need for Integration. Integration of multiple disciplines in design is a means to enhance
the quality of the design, reduce the cost, reduce time to market, and incorporate environ-
mental considerations into the product design. Integration reduces process failures by facili-
tating information sharing, thus saving resources. Integration also provides collaboration
between different participants, enhancing the quality of the design.
• Need for Design Assistant Tools. Design assistant tools are needed that can help designers
understand the big picture. Improvements in individual disciplines alone are not sufficient to
improve products and processes. To achieve higher quality, system-oriented, holistic, multi-
disciplinary approaches to the design of engineered systems are needed that consume fewer
resources (NSF 1996). Therefore, design research must develop new design methodologies
and tools.
• Need for Concurrency in Design. Concurrent decision making is an important component
of design methodology (Badhrinath 1996). A concurrent strategy, in contrast to sequential,
carries out some of the problem-solving activities in parallel that as a result speeds up the
design process.
4
g dif-
the
• Recent Advances in Artificial Intelligence in Design. Recent advances in the application
of AI to Design—Multi-agent Design Systems in particular—provide an opportunity to
build superior design methodologies. Recent AI theories and techniques enable engineering
design researchers to take advantage of computational power to solve their problems.
1.2 Problem
The problem is the following:
“There are no systematic approaches to building design methodologies for integratin
ferent disciplines in multi-disciplinary design so that they collaborate to contribute to
common goals of the design and also share resources”.
The current approaches for improving design processes are mostly based on intuitive observations
followed by incremental changes to the existing methodologies. Current multi-disciplinary design
practices are based on ad hoc strategies for handling the complexities that multiple points-of-view
introduce. They solve the problem of complexity at the expense of giving up the potential advan-
tages of diversity among the disciplines involved. The common methodologies for multi-disciplin-
ary design are based on compromising between different disciplines rather than collaborating
between them. These methodologies do not use a systematic, holistic approach to the problem of
multi-disciplinary design and thus they are not as efficient and effective as they could be.
One aspect of the problem that makes a systematic approach very useful is that design knowl-
edge is constantly evolving. “Designers not only must cope with a complex task, but they must
track the evolution of a domain. In this situation, designers determine whether new knowledge is
related to the body of existing knowledge, or whether the new knowledge reflects a more funda-
mental change in technology” (Reich 1991).
5

Another aspect of the problem in favor of a systematic and automated approach is that the
number of specialists is increasing, while the number of generalists, capable of doing system inte-
gration, is decreasing. At the same time, the knowledge burden on the designer keeps increasing as
more materials and more options become available (NSF 1996).
For our research we have chosen the design of robots as the test domain. The type of robot we
consider is a planar robot with revolute joints and two degrees of freedom (2-DOF) as shown in
Figure 1. Reducing the number of degrees of freedom to two reduces the computational effort
needed. However, the complexity of interactions between multiple disciplines is preserved in a 2-
DOF robot. As a result, the design methodologies that integrate disciplines for a 2-DOF robot can
provide useful guidelines to integrate disciplines in robots with higher DOF.
<Figure 1 about here>
1.3 Approach
We propose a new approach based on simulating the design process using a multi-agent system
(MAS) that mimics the behavior of a design team. The MAS implements a knowledge-based
model of design in which highly specialized knowledge from expert sources are applied to synthe-
size a design (Lander 1997). The MAS activates the pieces of design knowledge when they become
applicable. The use of knowledge by agents is recorded by tracing the steps that the agents have
taken during a design project.
Many traces are automatically generated by solving a large number of design projects that
differ in their requirements. A set of design methodologies is constructed by using inductive learn-
ing techniques to generalize the traces generated. The methodologies constructed then can be used
6

to guide design teams through future design projects. In the current stage of this work the process
of constructing the design methodologies is not yet automated.
The recorded traces of the agent activations (i.e., knowledge use) during the design process
consist of orderly patterns of different design tasks that have led to the solution. Some candidate
design methodologies are extracted by generalizing the patterns using clustering and inductive
learning techniques. Some of these candidates will be reinforced by solving more examples and
accepted as design methodologies for that particular class of problems.
The multi-agent system simulates examples of multi-disciplinary design processes while
applying integration principles to the problem. These include common design knowledge represen-
tation schemes; common communication mechanisms; design knowledge sharing among partici-
pants; cooperative problem-solving strategies among participants; simultaneous design processes
where possible; and mechanisms for conflict discovery and resolution.
2. Background
2.1 Design Methodology
A design methodology is a scheme for organizing reasoning steps and domain knowledge to con-
struct a solution (Dasgupta 1989). It provides both a conceptual framework for organizing design
knowledge and a strategy for applying that knowledge (Sobolewski 1996).
Design methodology is different from the Design itself. Design is primarily concerned with the
question of ‘what to design’ to satisfy some specified need. Design methodology, however, is pri-
marily concerned with the question of ‘how to design’. Good methodologies allow us to better
model, teach and aid/automate the finding of solutions to ‘what to design’. The ability to system-
7

atically construct design methodologies facilitates the evolution of design from an art to a science
(Kannapan 1992).
A design methodology for integrating multiple disciplines provides knowledge for:
• how to evaluate partial designs from all participants’ points-of-view;
• what should be done at each step of the process considering proposals from all participants;
• common representation schemes for design knowledge;
• common communication mechanisms for interactions;
• how to facilitate design knowledge sharing among participants;
• a cooperative strategy among participants;
• how to conduct multiple tasks in the design process concurrently;
• comprehensive mechanisms for conflict discovery and resolution.
A better design methodology has the following properties (Shakeri 1998):
• takes less time, causes fewer failures;
• produces better designs (better quality, simpler designs);
• works for a wider range of design requirements;
• integrates different disciplines;
• conducts design in a concurrent fashion;
• consumes less resources: time, money, expertise;
• requires less information.
8

2.2 Knowledge-Based Design
In this research a knowledge-based model of design is used to build a system that simulates the
design process. The system activates design methods when they become applicable, uses small
design methods, facilitates information sharing, implements control techniques for promoting col-
laboration, and gives more priority to design tasks that lead to fewer possible conflicts.
Figure 2 shows how the proposed approach works for our test domain, the design of a robot
arm. There are three different disciplines (i.e., kinematics, structure, and controls) involved in the
design process. Design methods in each discipline are broken up into small methods such that each
one of them has its own inputs, outputs, and constraints.
<Figure 2 about here>
A design project in Figure 2 is a design problem that differs from other problems in its require-
ments and constraints. As a result, design methods that become applicable during the design pro-
cess might be different for different projects. However, as we will see later in this paper, there will
be some similar design method activation patterns for different projects.
The similar activation patterns are extracted and related to the group of projects that later on
will be categorized. To reinforce and further develop the similar patterns into general methodolo-
gies, the system solves many examples by perturbing the design requirements within the given
range. In this process some of the candidate methodologies developed will be strengthened while
some will be weakened and dropped from further development. At the end there will be a finite
number of design methodologies for different types of design problems.
9

2.3 Strategies for a Knowledge-based Design System
The following sections describe the main problem-solving strategies followed to produce design
methodologies using a knowledge-based approach.
• Small Design Knowledge: In order to integrate different disciplines, one main strategy is to
cut the big segments of design knowledge accumulated in different disciplines into pieces,
breaking design methods into smaller methods. Smaller design methods means fewer deci-
sions made in each method, shorter time spent in a method, and less information produced
as a result of executing that method. Smaller design methods are simpler and consume less
resources. Decomposition of the design knowledge is a knowledge intensive process—that
is, it needs an extensive amount of domain knowledge. Figure 3 demonstrates how smaller
design methods reduce time for backtracking and at the same time increase the possibility of
parallel decision making.
<Figure 3 about here>
• Opportunistic Problem Solving: “The key idea is that decisions are made as required and if
possible. It moves the attention opportunistically between subproblems and avoids over-
specifying local decisions” (Huang 1993). Figure 4 shows the concept of an opportunistic
strategy in design. Initial design requirements provide the required inputs so that some of
the design methods can be executed and can provide more information. Other design meth-
ods get the opportunity to run after the first round of methods provide input for them. This
process continues until the design is complete. Of course, the process will not be this
straightforward, because: with the same available information there may be many applicable
design methods that could run or there may be none; some of the information produced by
10

the design methods may violate some of the constraints; the same information produced by
more than one design method may cause conflict; and there may be situations in which the
design methods get stuck in a loop by providing no new information.
<Figure 4 about here>
• Cooperative Problem-Solving: A cooperative strategy provides mechanisms by which dif-
ferent participants adopt the same goals. Implementation of this strategy in a multi-disci-
plinary design process results in favoring the common goals of the design over local goals
(Klein 1991). As a result of such a strategy different disciplines use their diverse resources
in the same direction. The strategy can be extended further to have different disciplines be
considerate of the other disciplines’ constraints when they propose their solutions. In this
work the strategy is implemented in the control mechanism of the design process.
• Least Commitment: Least commitment means deferring the decisions that constrain future
choices for as long as possible (Jackson 1990, p. 252). The least commitment strategy is
suitable for multi-disciplinary situations in which there is strong coupling between subprob-
lems. The strategy is implemented in the design process by giving priority to the design
methods that use the least information (i.e., use fewer inputs) to produce the most new infor-
mation (i.e., not producing information that already exists). The chance of using incomplete,
arbitrary, or less reliable information is lower for methods that use the least information.
• Inductive Learning: “Learning is the improvement of performance in some environment
through the acquisition of knowledge resulting from experience in that environment” (Lan-
gley 1996, p.5). An inductive learning strategy is adopted to develop categories of design
methodologies that are specialized in collaboration and sharing of resources. Inductive
learning learns from examples. The form of inductive learning used in this work is descrip-
11

tive generalization. “In descriptive generalization, one is given a set of instances which
belong to a particular class, and the task is to derive the most parsimonious description
which applies to each member of that class” (Jackson 1990, p. 433). Descriptive generaliza-
tion uses examples of design traces and produce classes of design methodologies.
• Means-Ends-Analysis: Means-ends-analysis (MEA) is a general search mechanism. In
MEA each operation should reduce the difference between the current state and the goal
state (Jackson 1990, p. 68). MEA is implemented by choosing design methods that, com-
pared to other methods, push the current state closer to the final state.
• Concurrency: A concurrent strategy carries out some of the problem-solving activities in
parallel. Concurrent design is the main theme of the well-established concurrent engineering
field. In a concurrent design process, design knowledge is accumulated from all design par-
ticipants during the design process (Brown 1993).
2.4 Multi-Agent Systems (MAS)
The multi-agent paradigm captures the concept of deep, modular expertise that is at the heart of
knowledge-based design (Lander 1997). Wooldridge (1997) defines an agent as a self-contained
problem solving system capable of autonomous, reactive, pro-active, social behavior. Agents are
a powerful abstraction tool for managing the complexity of software systems. A multi-agent
system is composed of multiple interacting agents, where each agent is a coarse-grained computa-
tional system. In this research agents are used as an abstraction tool for conceptualizing, designing,
and implementing the knowledge-based design approach.
A Java-based computer program called RD (Robot Designer) has been implemented for the
design of a two degrees of freedom (2-DOF) planar robot arm. The architecture of the system is
12

shown in Figure 5. There are three different types of agents: Control Agents, Design Agents, and
Database Agents.
<Figure 5 about here>
The Designer Agents contain the knowledge for designing a 2-DOF robot. In Figure 5 each
Designer m_n agent is responsible for a specific design method n in discipline m (k stands for kine-
matics, s for structural, and c for control design of a robot arm). A Coordinator Agent decides
which one of the designer agents can act at various stages of the design process.
The Control Agents possess the knowledge of how to control and guide the design process.
They are responsible for coordination and carrying out generic design tasks such as evaluation of
the partial designs. They discover and provide the dependency between designers, and provide an
agenda for various design tasks such as backtracking.
Database Agents update data, answer the queries of the other agents, and are responsible for
gathering, storing, and providing shared knowledge. A coordinator agent manages the consistency
of the data between different database agents and synchronizes the updates and queries.
The mechanism for communication among agents is based on sending and receiving messages.
It consists of a registry and a message passing protocol. Each message has its own thread for pro-
cessing, providing concurrency between agents, and allowing each agent to handle multiple mes-
sages simultaneously.
Agent activation is triggered opportunistically. As a result, the dependency between designer
agents is discovered ‘on-the-fly’ when the design process is making progress towards completion.
13

3. Experiments
In this section we describe the experiments that we conducted using the RD system to produce
traces that were used to generate design methodologies.
3.1 Distribution of Traces
The factors that affect the distribution of traces with respect to problems are: the set of design
parameters that are defined by the requirements; their values; the selected range for requirements;
and the upper and lower limits of the constraints. Other factors are the design approaches and
domain dependencies between design parameters.
Due to the domain dependencies, design requirements affect the other design parameters with
varying strength. We have assumed that design requirements do not change during the design pro-
cess. Therefore, the traces generated are very dependent on which set of parameters have been
selected as requirements. As a result, the generated traces will be concentrated around particular
traces that are most influenced by the set of requirements. Selecting a different set of design param-
eters to be defined by requirements will produce a set of traces with concentration in different parts
of the trace space.
The upper and lower limits of the constraints directly affect the distribution of traces. This is
because the violation of constraints cause different combinations of design approaches to be tried.
Selection of the limits of most of the constraints is a domain dependent task. However, the limits
of the constraints can dynamically change as a function of design parameter values. Therefore, they
may become an important factor in the distribution of traces. In addition, some of the design con-
straint’s limits are chosen based on the engineering judgement and the specific application in mind.
14
Selection of the actual design approaches to be used directly affects the distribution of traces
of approaches. If different design approaches generate design parameters’ values that are consid-
erably apart from each other, there is more chance that the corresponding violated constraints will
be satisfied somewhere later in the process.
Note that changing the set of design requirements makes a different set of parameters and their
corresponding constraints critical. This might make the apparently less effective approaches more
effective with regard to those parameters and constraints.
Dependencies between design parameters determine whether choosing a different design
approach can resolve the violated constraints. There are two difficulties, however, in using domain
dependencies for directing the selection of one design approach over another: First, some of the
dependencies are not monotonic. Second, the violated constraints often require contradictory
changes in design approaches. In the following we will see that reduction of the deflection of the
robot’s arm is usually in contradiction with reducing control gains. The constraints on these two
parameters are of critical type, meaning that they are affected by the requirements and are violated
more often than the others.
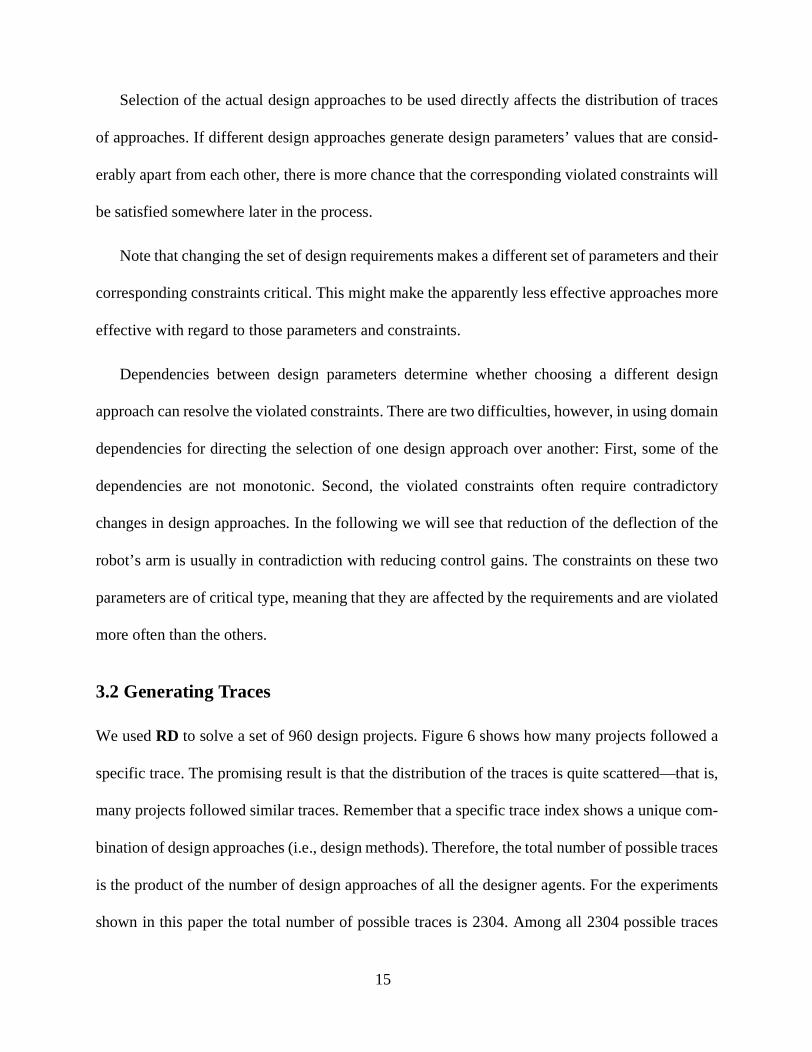
3.2 Generating Traces
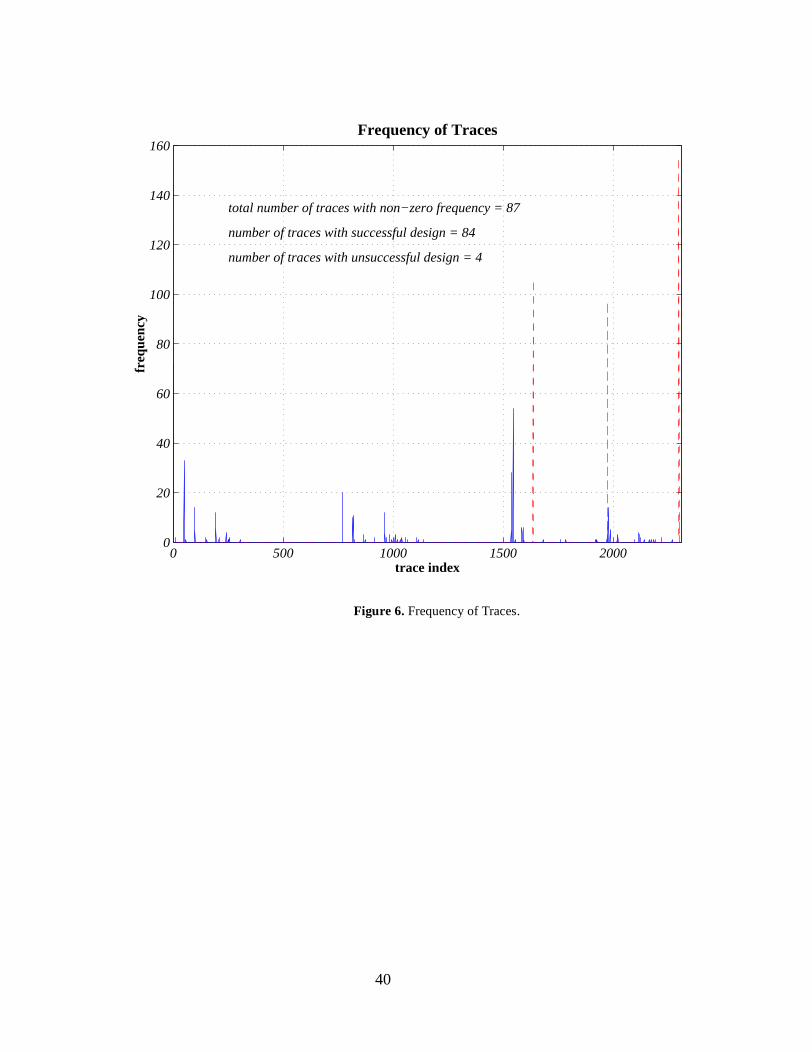
We used RD to solve a set of 960 design projects. Figure 6 shows how many projects followed a
specific trace. The promising result is that the distribution of the traces is quite scattered—that is,
many projects followed similar traces. Remember that a specific trace index shows a unique com-
bination of design approaches (i.e., design methods). Therefore, the total number of possible traces
is the product of the number of design approaches of all the designer agents. For the experiments
shown in this paper the total number of possible traces is 2304. Among all 2304 possible traces
15

only 84 were followed to generate successful designs, i.e., less than 4%. We refer to the set of traces
that produced successful designs as Successful Traces. The low percentage of successful traces
indicates that for each group of projects that followed a particular trace there is a unique combina-
tion of approaches leading to successful designs, hence there is a high chance that if similar projects
follow the same trace they will succeed in generating a successful design. As a result, the path fol-
lowed by those projects can lead us to formulating a design methodology for the projects that fol-
lowed that trace as well as for projects that are similar to those projects.
<Figure 6 about here>
We may even find traces in the set of successful traces that are close enough so that they can
be clustered together to form a generalized trace. A generalized trace covers all the projects that
followed each of the traces incorporated in the generalized trace.
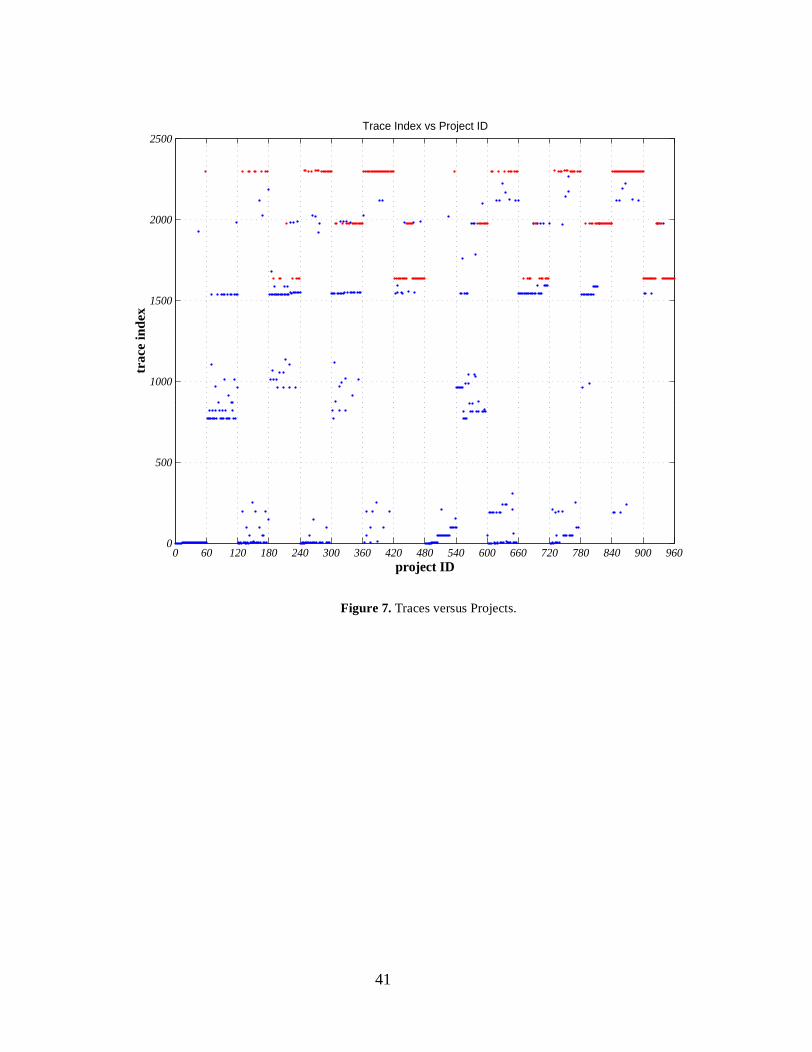
Figure 7 shows how the traces are distributed relative to the projects. It clearly shows that there
are some patterns in projects that are taking one particular trace. We have intentionally set the grid
in Figure 7 to match one of the dominate patterns that happens every 60 projects. This pattern
matches the change of requirements for the type of the workspace that the robot covers.
<Figure 7 about here>
Observing these patterns provides another promising sign of being able to formulate design
methodologies based on the traces of the system. These patterns show that the projects that fol-
lowed the same traces have common features, e.g., they have the same requirements on workspace.
This suggests generalizing the set of projects that followed the same trace based on their common
features: another step toward formulating methodologies.
16
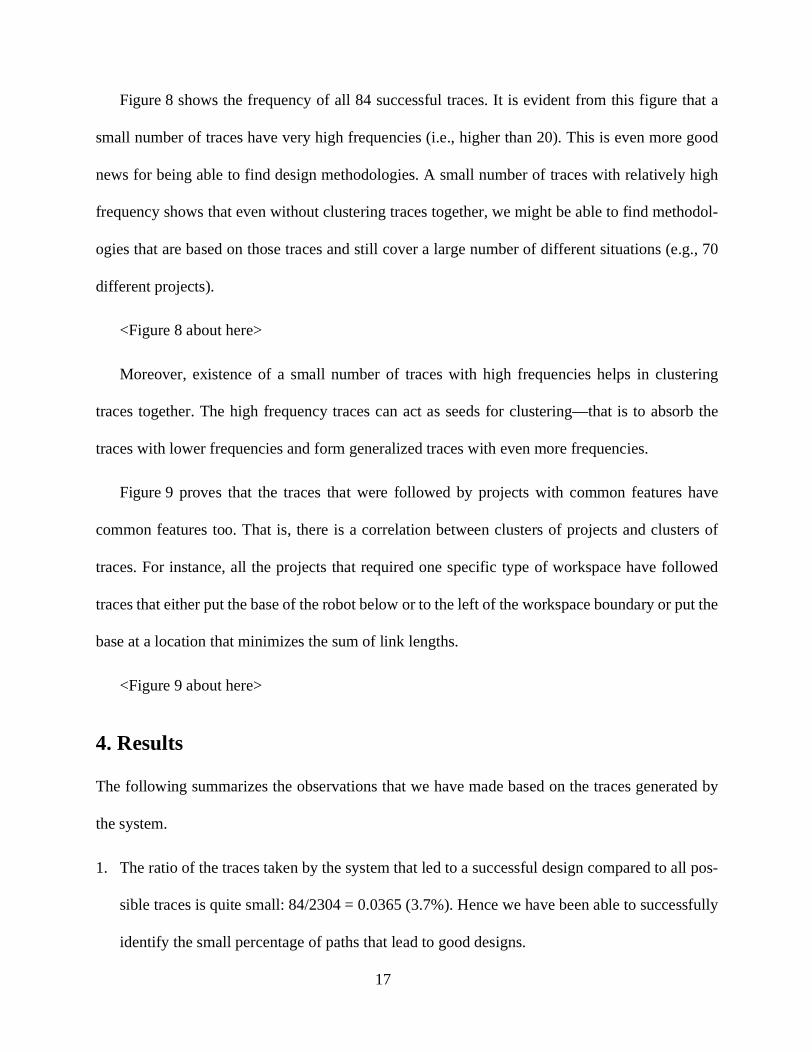
Figure 8 shows the frequency of all 84 successful traces. It is evident from this figure that a
small number of traces have very high frequencies (i.e., higher than 20). This is even more good
news for being able to find design methodologies. A small number of traces with relatively high
frequency shows that even without clustering traces together, we might be able to find methodol-
ogies that are based on those traces and still cover a large number of different situations (e.g., 70
different projects).
<Figure 8 about here>
Moreover, existence of a small number of traces with high frequencies helps in clustering
traces together. The high frequency traces can act as seeds for clustering—that is to absorb the
traces with lower frequencies and form generalized traces with even more frequencies.
Figure 9 proves that the traces that were followed by projects with common features have
common features too. That is, there is a correlation between clusters of projects and clusters of
traces. For instance, all the projects that required one specific type of workspace have followed
traces that either put the base of the robot below or to the left of the workspace boundary or put the
base at a location that minimizes the sum of link lengths.
<Figure 9 about here>
4. Results
The following summarizes the observations that we have made based on the traces generated by
the system.
1. The ratio of the traces taken by the system that led to a successful design compared to all pos-
sible traces is quite small: 84/2304 = 0.0365 (3.7%). Hence we have been able to successfully
identify the small percentage of paths that lead to good designs.
17

2. The variation of traces with respect to projects clearly shows some patterns. This is a good
indicator for being able to cluster groups of traces together.
3. There is a correlation between the patterns in groups of traces (i.e., design methods) and
groups of problems (i.e., requirements and constraints). This is a promising sign of being able
to map clusters of problems to clusters of traces—a major step toward being able to index
methodologies.
4. The frequency of the traces is not evenly distributed, thus the coverage of traces are different.
This might lead to a way to evaluate the quality of different traces. Similarly, methodologies
that are built using different traces might have different quality.
5. Due to the preferential order of the use of design approaches within agents, traces are different
with regard to the desirability of their approaches. This might lead to another measure for the
goodness of a methodology.
4.1 Dependency Graph
Discovering the dependency between designers is the first set of results that we extract from the
traces of the system. Some designers need inputs that are generated by other designers, therefore,
they have to wait until the designers that supply input to them finish. Having small designers com-
bined with an opportunistic strategy provides a way to discover dependencies among design
parameters automatically. Additionally, the possible concurrency between designers in each
design cycle can also be discovered by the system. The dependency graph resulting from the exper-
iments is shown in Figure 10.
<Figure 10 about here>
18
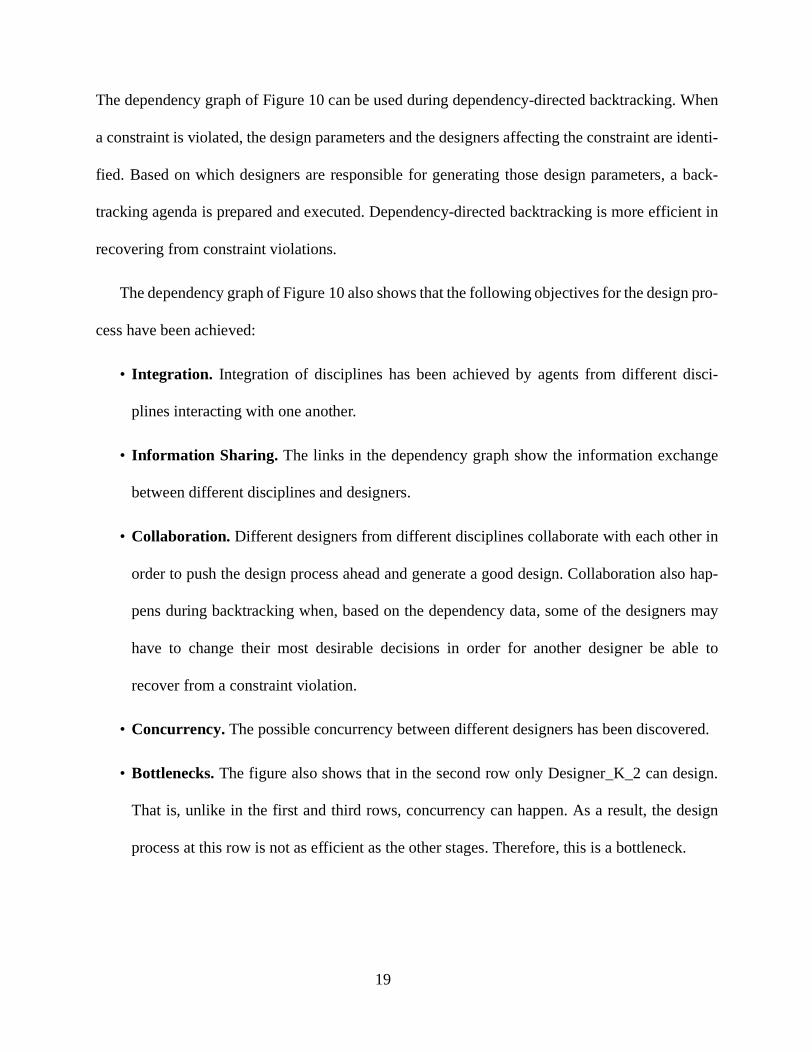
The dependency graph of Figure 10 can be used during dependency-directed backtracking. When
a constraint is violated, the design parameters and the designers affecting the constraint are identi-
fied. Based on which designers are responsible for generating those design parameters, a back-
tracking agenda is prepared and executed. Dependency-directed backtracking is more efficient in
recovering from constraint violations.
The dependency graph of Figure 10 also shows that the following objectives for the design pro-
cess have been achieved:
• Integration. Integration of disciplines has been achieved by agents from different disci-
plines interacting with one another.
• Information Sharing. The links in the dependency graph show the information exchange
between different disciplines and designers.
• Collaboration. Different designers from different disciplines collaborate with each other in
order to push the design process ahead and generate a good design. Collaboration also hap-
pens during backtracking when, based on the dependency data, some of the designers may
have to change their most desirable decisions in order for another designer be able to
recover from a constraint violation.
• Concurrency. The possible concurrency between different designers has been discovered.
• Bottlenecks. The figure also shows that in the second row only Designer_K_2 can design.
That is, unlike in the first and third rows, concurrency can happen. As a result, the design
process at this row is not as efficient as the other stages. Therefore, this is a bottleneck.
19

4.2 Clustering the Traces
In order to be able to extract design methodologies based on the traces generated by the system we
need to cluster similar traces together. The similarity of two traces can be measured based on how
their ingredient design approaches differ from each other. We will define a metric for measuring
the distance between two traces in a mathematical form later in this section. The further two traces
are from each other the less similar they will be.
A generalized trace will replace each cluster of similar traces. Later we will find a correlation
between each generalized trace and sub-sets of requirements and constraints. Suppose that the five
traces shown in Table 1 are clustered together.
<Table 1 about here>
For an explanation of the columns of Table 1 please see Section 3.2. A candidate generalized trace
for the cluster of Table 1 is shown in Table 2.
<Table 2 about here>
In some domains the collection of design approaches for each designer agent in the generalized
trace (e.g., (0 | 1 | 2) for Designer_S_3) can be generalized based on the common features of those
approaches. For instance, the collection of the design approaches might be generalized as catalog
approaches or iterative approaches. For this paper we do not do such generalization.
4.2.1 Goodness of a Cluster of Traces
The goodness of a cluster of traces can be measured based on two factors:
1. The number of projects that followed the traces clustered: coverage
Coverage is a measure of how many different design situations (i.e., projects) are covered by the
traces clustered. We can calculate the coverage of a cluster by adding the frequencies of the traces
20

clustered. Methodologies that are generated from clusters with higher coverage are applicable to a
wider range of design problems. We calculate the coverage of a cluster by adding the coverage of
traces it contains using Equation 4-1:
where, pi is the number of projects covered by trace i, and “traces” is the number of traces in the
cluster.
2. The number of variations of design approaches in the cluster: uniformity
Traces differ from each other because of the difference in the design approaches that designer
agents have used. Clustering accumulates these different approaches in one place causing some
loss of information. That is, instead of being specific about what approach should be used for the
situations covered (i.e., projects covered), the cluster suggests a collection of the possible
approaches. We refer to this measure as the uniformity of the cluster. The most uniform cluster is
the one that does not have any variation in its approaches. Two factors affect the uniformity of a
cluster:
i. the number of designers that vary their approach in the cluster, and
ii. the amount of variation for each designer that varies its approach.
We would like to give more credit to those clusters with fewer designers that vary their approach.
coverage pi
i 1=
traces
∑
=(4-1)
21

Based on the above factors we can assign a number to the uniformity of a cluster using
Equation 4-2:
where is the number of approaches accumulated for designer j in the cluster, and “designers” is
the number of designers in the generalized trace.
The goodness of a cluster of traces is defined as the product of its coverage and its uniformity,
Equation 4-3:
To be applicable to general situations the coverage and the uniformity of the cluster should be
normalized. In general situations the number of designers may vary from problem to problem. Nor-
malization is needed also when we want to compare the goodness of clusters from different sets of
experiments and across different domains. The coverage can be normalized by dividing the result-
ing number by the total number of projects in the experiment. The uniformity can be normalized
by dividing it by the maximum score for the uniformity of the cluster (equal to the number of par-
ticipant designers).
uniformity 1aj----
j 1=
designers
∑
=(4-2)
aj
GC pi
i 1=
traces
∑
1aj----
j 1=
designers
∑
×=(4-3)
22

Normalizing the goodness generates very small numbers that are hard to compare to each other.
To increase the resolution we multiply the result by 1000. The general equation for calculating the
normalized goodness of a cluster is shown in Equation 4-4:
4.3 Formulating Methodologies
To be able to formulate methodologies we need to find correlations between subsets of projects and
clusters of traces. A correlation exist between a subset of projects and a specific trace or cluster of
similar traces, if the projects have followed that trace or cluster of traces.
Selection of the final methodologies from the set of candidate methodologies is a trade-off pro-
cess. At one end you have methodologies that are very detailed but are not applicable to many
projects. On the other end there are methodologies with few details, but which are applicable to a
large number of projects.
The generality of the methodologies generated based on clusters of traces increases as the
height of the cluster in the cluster tree increases (i.e., as additional similar clusters are combined
into new clusters). On the other hand, as more clusters get grouped together the number of projects
included grows and, as a result, increases the applicability of the cluster. However, to compare
GCN
pi
i 1=
traces
∑
Tp
----------------------
1aj----
j 1=
designers
∑
Td
-----------------------------× 1000×=(4-4)
23

methodologies that are derived from clusters with the same height in the cluster tree we can use the
goodness of the clusters.
4.4 First Set of Clusters
To demonstrate the approach of extracting methodologies, in this section we use clusters at height
1 in the cluster tree. These clusters generate the most detailed methodologies (except for method-
ologies based on traces themselves). The process of extracting the methodologies can be automated
based on the approach proposed by (Reich 1991). The idea is instead of clustering the traces and
then clustering the problems that have followed each cluster, merge the traces and problems and
cluster the resulted combined trace. In this work we constructed the candidate methodologies man-
ually in order to gain better insight into the behavior of the system.
The first round of clustering traces has led to 34 clusters. The most populated clusters along
with their goodness number based on Equation 4-3 are shown in Table 3.
<Table 3 here>
In Table 3 the name of a cluster is composed of two numbers separated by a dash. The first number
is the height of the cluster in the tree. The second is the index of the cluster at the specific height.
4.4.1 Cluster 1-0
The first cluster, Cluster 1-0, covers 270 projects and includes 9 traces (see Table 4). Roughly
speaking Cluster 1-0 is the collection of projects with mostly loose constraints and requirements.
Projects that have tighter requirements and constraints have used approaches 4 and 5 of the
Designer_K_1 to reduce the length of the robot’s links.
<Table 4 here>
24

For example the first project that has taken a different path than of the Cluster 1-0 is project 45
in which Designer_K_3 has chosen a right-hand configuration for the robot arm as opposed to
a left-hand configuration. Both projects in the neighborhood of project 45 followed the path shown
in Cluster 1-0.
Let us look at the requirements and constraints for these three projects to see what has caused
for project 45 to take a different route (see Table 5).
<Table 5 here>
Project 45 has taken the trace 1926 while projects 44 and 46 both have followed the route of
trace 2 (see Table 6):
<Table 6 here>
Trace 1926, that’s followed by Project 45, is clustered with eight other traces into Cluster 1-0
which due to its small population of projects and traces will be dropped from consideration for gen-
erating methodologies at this level.
<Figure 11 about here>
Based on the correlation between the change of requirements and constraints with the change
of design approaches in Figure 11 the candidate methodology in Figure 12 is extracted:
<Figure 12 about here>
5. Evaluation of the Results
Our approach has been tailored to produce good design methodologies. The following is the list of
the features that better design methodologies should have, and how our approach produces them:
25

• Take Less Time: The methodologies generated are based on successful traces. Therefore
there is a high chance that following those methodologies takes us directly to a solution that
satisfies all the constraints along the way. That is, less iteration is needed and thus time is
saved. The system first follows the traces which have higher priority design approaches.
Giving more priority to design approaches that takes less time makes the methodologies
even more time effective.
• Cause Fewer Design Process Failures: The methodologies generated are based on traces
of the system that have succeeded in producing a successful design and thus have less
chance of encountering constraint violations.
• Produce Better Designs: Better designs are those with better quality or those that are sim-
pler. We did not consider the quality of the product in producing traces. The reason is that
this is an area of research that has been investigated thoroughly and many good approaches
have been developed for optimizing design products, e.g., the methods from multi-disciplin-
ary design optimization (MDO). One can incorporate product quality into the traces gener-
ated, by introducing global constraints that define the boundaries of near-optimal designs.
• Work for a Wide Range of Design Requirements: In producing methodologies we pick
the cluster of traces whose coverage combined with their uniformity is higher than others.
This leads to methodologies that are applicable to a wide range of different situations.
• Integrate Different Disciplines: The dependency graph generated clearly shows that dif-
ferent disciplines are integrated in the design process. For example, in the last round,
designers from all three disciplines participated in the process of design. Integration of the
disciplines is evident also from the methodologies generated.
26

• Conduct Design Concurrently: The dependency graph shows how multiple designers can
design simultaneously. Implementation of the ‘concurrency strategy’ plus the ‘opportunistic
strategy’ conducts the design process among different designers concurrently.
• Consume Less Resources: Less resources (e.g., time and money) are spent in the design
process due to features that are incorporated into the design methodologies (e.g., integration,
concurrency, less failure, etc.).
• Reduce Load on Designers: Having access to design methodologies that are built system-
atically based on the latest available technology reduces the load on designers, especially
the generalists that can now spend more time on more creative parts of the design process.
5.1 Contributions
Investigating and developing computational and knowledge-based models for the design process
has provided us with better insight into how a real design process might be conducted more effi-
ciently.
Examples include: how the design tasks should be delegated to the members of a design team
so that little overlap happens in carrying out the tasks; to reduce the number of conflicts reorganize
the teams so that all decisions about one design parameter are taken in one place, that is no two
different designer decide about the same parameter; by discovering the dependencies between
designers, dependency-directed backtracking prevents the designers that won’t have any effect on
violated constraints from having to re-do their work.
A summary of the other theoretical contributions follows:
• Extending the technique of analysis by simulation to the area of analyzing design methodol-
ogies and, in general, to synthesizing the emergent behavior of complex systems.
27

• Decomposing the design process into small designers, coordinators, databases, and other
utility agents, as is done for RD, can be used in real design processes.
• Approximating the continuous design process with a discrete process comprising of cycles
of run-analysis-update.
• Resolving conflicts between different participants in design can be aided by breaking the
design knowledge into small pieces at the decision points (i.e., a decision about assigning
values to design parameters). In these situations we will have a set of (atomic) design meth-
ods where some of them decide about the same parameter. Collect and bundle the design
methods that are about the same design parameters into one design agent. In each agent,
order and prioritize each method and let the agent decide what method it should use for
assigning a value to the associated parameter. In this situation there is no conflict between
designer agents in assigning values to design parameters. The same approach can be used
for the control knowledge in which designer agents might not agree on what the order of the
design tasks should be.
• Providing an approach for analyzing current methodologies for flaws and bottlenecks, and
suggesting necessary refinements. New methodologies can be customized so that they are
biased toward specific objectives such as manufacturability. By applying this approach the
response time for the incorporation of new technologies or new design methods into design
processes will be reduced. Methodologies can be refined as soon as a change occurs in the
market or in the organization of the company.
• Developing algorithms for backtracking lead us to an approach for how to break the design
knowledge into pieces: break the design knowledge in a way that the most expensive meth-
ods are located in the shallower depths of the dependency graph.
28

etric
c-
The experiments conducted in this research revealed some interesting results. The following is a
summary:
• An approach for discovering the dependency relations between design parameters is to use a
multi-agent design system.
• The experimental studies reveal some valuable information regarding the sensitivity of the
design to the design approaches as well as to various subsets of design parameters. The
design process simulation approach can be used as an analysis tool, and for sensitivity stud-
ies in which quantitative and qualitative measurements are formed to show the effect of
inputs (requirements/constraints) on outputs (the product attributes).
5.2 Future Work
This research could be extended in a variety of directions to increase its scope and to improve the
chances for success in real design practices:
• Applying the approach to other types of design problems other than non-routine param
design, such as configuration design. This is a direction that increases the scope of the pro-
posed approach. Obviously one important feature that should exist for these new types of
design problems is that they should be able to be automated via a multi-agent system, even
if it is only in a simplified version.
• Applying the approach to other multi-disciplinary domains such as automotive design, ele
tronics packaging design, or building design. This would help to gain better insight into the
problem and enhance the generality of the approach.
29
• Discovering the rules for simplifying the process. To be able to discover design methodolo-
gies based on simulation of the design process it is not necessary to model the design pro-
cess in full detail. Similar to the simulation of physical phenomenon in engineering analysis,
we can simulate a simplified version of the design process and still get the design methodol-
ogies that are helpful for the real situations. The rules for these simplifications and
approaches and tools should be developed for this purpose.
• Evaluation of the methodologies in real situations. The design methodologies developed by
the approach proposed should be evaluated in those real design situations in which human
designers use such methodologies, and any enhancement in the design process should be
noted. Also, the lesson we have learned with respect to the organizational side of the design
process can be tested in design processes using human designers to see whether any
improvements happen.
• The effect of scaling up the approach should be investigated. Larger design processes with
more disciplines and design parameters must be investigated.
• Enrich the design methodologies. Design methodologies can contain more knowledge about
not only the design approaches but also about control aspects.
• Biased methodologies could be generated using this approach. Design methodologies that
are biased toward manufacturability, for example, can be another area of further research.
• Change the order of approaches. It would be useful to investigate the effect of the order of
selection of the design approaches on the traces produced.
30

ys-
ts.
ng
• Convert the tool to a sensitivity analysis tool or even an optimization tool. As we used the
multi-agent design system to discover sensitive parameters as well as their boundaries, more
research can be done to convert the system to an optimization tool. Such an approach to
optimization is especially attractive for domains that do not conform to a completely mathe-
matical form allowing classical optimization tools to be used.
• Introduce new types of design approaches into the design process. Heuristic, statistical, and
probabilistic approaches could be tried.
• Close the feedback loop around the system in which the methodologies generated by the s
tem are fed back into it to further refine the methodology. That is, to force the system to use
the methodologies generated for similar problems and measure the improvement.
• Investigate the effect of changing the resolution of the set of constraints and requiremen
Using a concept similar to adaptive mesh generation in FEM (Finite Element Method) to
find the best grid and/or find the areas of high gradient. Enhance the resolution of the con-
straint-requirement grid so that the system covers more design problems.
• Investigate the effect of the design knowledge used to produce correct designs on generati
the right methodologies. That is, finding the answer to the following questions: What is the
trade-off between the design quality and correct traces (and hence correct methodologies)?
Can we remove some of the design knowledge from the system (knowing that it will pro-
duce inferior designs) but still obtain correct design methodologies? i.e., can the knowledge
engineering and implementation stages be substantially simplified?
Simulation of complex systems using agents can be a powerful tool in analyzing why those systems
behave in a certain way. Using our approach complex systems can be designed to have some
31

desired emergent behavior. Multi-disciplinary design processes are one example of complex sys-
tems whose emergent behavior is hard to anticipate. Other areas that are similar to the multi-disci-
plinary design process in having an emergent behavior are: ‘supply chains in manufacturing
enterprises’ and ‘shop floor job scheduling’.
6. Conclusions
In this paper we have shown that computers can provide us with better ways of doing design by
discovering superior design methodologies that integrate different points-of-view of multiple dis-
ciplines in the design process. Analyzing the behavior of physical systems in engineering applica-
tions by computer simulation using mathematical models has been a powerful tool in engineering,
reducing costs and time in comparison to physical prototyping and experimentation. We showed
that it is possible to use computers to simulate the design process. We can analyze the results of the
simulation to synthesize design methodologies that have superior features. The approach that we
have proposed has been developed based on a knowledge-based model of the design process for
parametric design problems. We feel that this novel approach, while requiring more investigation,
shows considerable promise.
32

Tables
Table 1. An Example Trace Cluster
trace index
Designer_K_1 approach
Designer_S_2 approach
Designer_S_3 approach
Designer_S_4 approach
Designer_K_2 approach
Designer_K_3 approach
Designer_S_1 approach
1926 5 0 0 0 0 1 2
1974 5 0 1 0 0 1 2
2018 5 0 2 0 0 0 2
2021 5 0 2 0 1 1 1
2022 5 0 2 0 0 1 2
Table 2. Generalized Trace for Trace Cluster of Table 1
generalized trace
Designer_K_1 approach
Designer_S_2 approach
Designer_S_3 approach
Designer_S_4 approach
Designer_K_2 approach
Designer_K_3 approach
Designer_S_1 approach
example 5 0 (0 | 1 | 2) 0 (0 | 1) (0 | 1) (1 | 2)
Table 3. Goodness of First Level Clusters
Cluster number of traces coverage(%)
uniformity(normalized)
goodness
1-0 9 28.12 0.7971 224.2
1-8 4 8.43 0.7857 66.3
1-16 3 3.95 0.8571 33.9
1-2 8 3.95 0.6429 25.4
1-5 4 2.70 0.7857 21.3
1-4 4 2.50 0.7857 19.6
1-6 4 2.29 0.7857 18.0
33
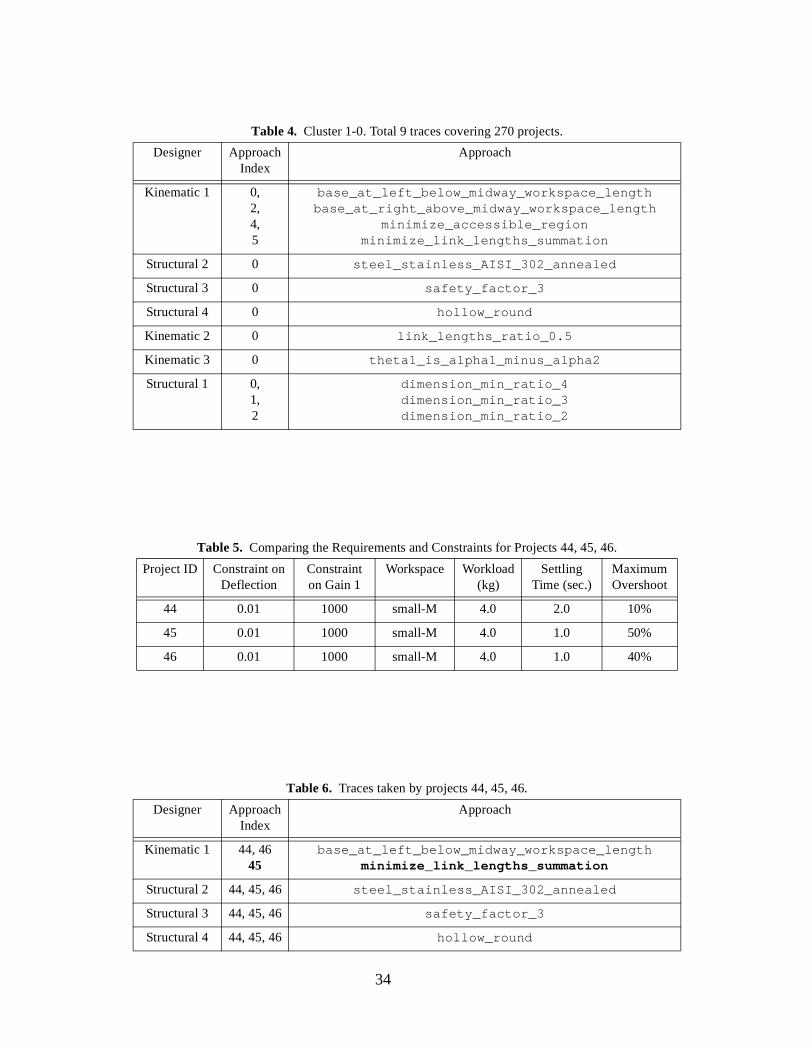
Table 4. Cluster 1-0. Total 9 traces covering 270 projects.
Designer Approach Index
Approach
Kinematic 1 0, 2,4, 5
base_at_left_below_midway_workspace_lengthbase_at_right_above_midway_workspace_length
minimize_accessible_regionminimize_link_lengths_summation
Structural 2 0 steel_stainless_AISI_302_annealed
Structural 3 0 safety_factor_3
Structural 4 0 hollow_round
Kinematic 2 0 link_lengths_ratio_0.5
Kinematic 3 0 theta1_is_alpha1_minus_alpha2
Structural 1 0,1,2
dimension_min_ratio_4dimension_min_ratio_3dimension_min_ratio_2
Table 5. Comparing the Requirements and Constraints for Projects 44, 45, 46.
Project ID Constraint on Deflection
Constraint on Gain 1
Workspace Workload (kg)
Settling Time (sec.)
Maximum Overshoot
44 0.01 1000 small-M 4.0 2.0 10%
45 0.01 1000 small-M 4.0 1.0 50%
46 0.01 1000 small-M 4.0 1.0 40%
Table 6. Traces taken by projects 44, 45, 46.
Designer Approach Index
Approach
Kinematic 1 44, 4645
base_at_left_below_midway_workspace_lengthminimize_link_lengths_summation
Structural 2 44, 45, 46 steel_stainless_AISI_302_annealed
Structural 3 44, 45, 46 safety_factor_3
Structural 4 44, 45, 46 hollow_round
34

Kinematic 2 44, 45, 46 link_lengths_ratio_0.5
Kinematic 3 44, 4645
theta1_is_alpha1_minus_alpha2theta1_is_alpha1_plus_alpha2
Structural 1 44, 45, 46 dimension_min_ratio_2
Table 6. Traces taken by projects 44, 45, 46.
Designer Approach Index
Approach
35

workspace points
workload
length
cross section dimension,thickness, and shape
control gains
accessible region
material properties
location of the base
- deflection of the tip- overshoot- settling time
joint angle limits
Figure 1. Design Parameters of a 2-DOF Planar Robot.
36

K1
K 2
Kn
S1
C1
C2
Cn
K2 C8 K1 Si...Design Project 1
S4 Cn K5 Kj...Design Project 2
K2 C10 K1 Sk...Design Project m
S2 C1
. . .
S2
K2 S5 K1 C4...
K3 Cn K5 C2...S2 C1
Design Methodology for Projects of Type 1
Design Methodology for Projects of Type 2
Generalizing: Inductive Learning
Kinematics Design Methods
S2
Sn
Structural Design Methods
Control Design Methods
Use Knowledge Methodologies
Use of Design Methods
Figure 2. Knowledge-based Approach to Generating Design Methodologies.
Tim
e
Decisions
d1 d2 d3 d4 d5 d6 d7 d8 d9 d10 d11 d12
t1
t2
t3
t4
t5t6
t7t8
t9
t10
t11
t12
Discipline 1 Discipline 2 Discipline 3
Tim
e
Decisions
d1 d2 d3 d4 d5 d6 d7 d8 d9 d10 d11 d12
t1
t2
t3
t4
t5
t6
t7
t8
t9
t10
t11
t12
Discipline 1 Discipline 2 Discipline 3
(a) Design Knowledge in Large Segments (b) Cutting Knowledge into Pieces
Decision Points Design Methods
Figure 3. Integration by Breaking up the Knowledge into Smaller Segments.
37

Des
ign
Req
uire
men
ts
Design Method
a
Design Method
b
Design Method
c
Des
ign
Spec
ific
atio
ns
Figure 4. The Opportunistic Strategy in Activating Design Methods.
38

Figure 5. The Architecture of the Multi-agent Design System
39
0 500 1000 1500 20000
20
40
60
80
100
120
140
160
trace index
freq
uenc
yFrequency of Traces
total number of traces with non−zero frequency = 87
number of traces with successful design = 84
number of traces with unsuccessful design = 4
Figure 6. Frequency of Traces.
40
0 60 120 180 240 300 360 420 480 540 600 660 720 780 840 900 9600
500
1000
1500
2000
2500Trace Index vs Project ID
project ID
trac
e in
dex
Figure 7. Traces versus Projects.
41

0 1 2 9 10 48 49 50 57 97 98 146 153 192 193 194 205 209 240 249 2540
20
40
60
80Frequency of Successful Traces
304 769 770 816 817 818 825 864 866 872 874 914 960 961 962 970 984 994 1009 1010 10180
20
40
60
80
1032 1040 1057 1065 1105 1113 1137 1536 1537 1538 1545 1546 1554 1585 1586 1593 1594 1681 1761 1785 19220
20
40
60
80
1926 1969 1974 1977 1978 1986 2018 2021 2022 2097 2116 2117 2118 2125 2141 2164 2173 2186 2192 2220 22680
20
40
60
80
trace index
Figure 8. Frequency of Successful Traces.
42

0 60 120 180 240 300 360 420 480 540 600 660 720 780 840 900 9600
500
1000
1500
2000
2500all traces generated for the "Small−M" workspace
trac
e In
dex
0 60 120 180 240 300 360 420 480 540 600 660 720 780 840 900 9600
500
1000
1500
2000
2500all traces in which Designer−K−1 used "base−at−left−below−midway−workspace−length" approach
trac
e In
dex
0 60 120 180 240 300 360 420 480 540 600 660 720 780 840 900 9600
500
1000
1500
2000
2500all traces in which Designer−K−1 used "minimize−link−lengths−summation" approach
trac
e In
dex
project ID
Figure 9. Correlation between Requirement Space and Trace Space.
43

Designer_k_4
Designer_k_1
Designer_k_2
Designer_k_3
6 7 8 9 10 115
22 23 24 25 26 27
14 15 16 17 18 19 2120
12 13
Designer_s_2 Designer_s_3 Designer_s_4
Designer_s_1
Designer_s_5 Designer_c_1
Kinematic Designer
Structural Designer
Control Designer
32 41 Design Requirements
proportional_gain226
maximum_overshootworkspace workload settling_time
base_location
material_name material_mass_density material_yield_stress material_elasticity_modulus
structural_safety_factor link_cross_sectional_shape link1_length link2_length
theta1_min theta1_maxtheta2_min theta2_max
link1_cross_section_dimension link2_cross_section_dimension
link1_cross_section_thickness link2_cross_section_thickness
accessible_region_area tip_deflection
proportional_gain1 derivative_gain1 derivative_gain2
1 32 4
5
6 7 8 9
10 11 12 13
14 1516 17
18 19
2120
22 23
24 25 27
Design Parameters:
Figure 10. Dependency Graph for Design of a 2 DOF Robot
44

0 60 120 180 240 300 360 420 480 540 600 660 720 780
large deflectionsmall deflection
large gain small gain small−M small−L large−M large−L
1 kg 2 kg 3 kg 4 kg 5 kg 3 sec 2 sec 1 sec
50% 40% 20% 10%
Distribution of requirements and constraints for projects that followed traces of cluster 1−0
project id
requ
irem
ents
& c
onst
rain
ts
0 60 120 180 240 300 360 420 480 540 600 660 720 780
DK1−1DK1−2DK1−3DK1−4DK1−5DK1−6DS2−1DS2−2DS3−1DS3−2DS3−3DS3−4DS4−1DS4−2DK2−1DK2−2DK2−3DK3−1DK3−2DS1−1DS1−2DS1−3DS1−4
Distribution of design approaches for projects that followed traces of cluster 1−0
project id
desi
gn a
ppro
ache
s
Figure 11. Comparing the trace of constraints and requirements with the trace of design approaches for Projects that followed Cluster 1-0
45
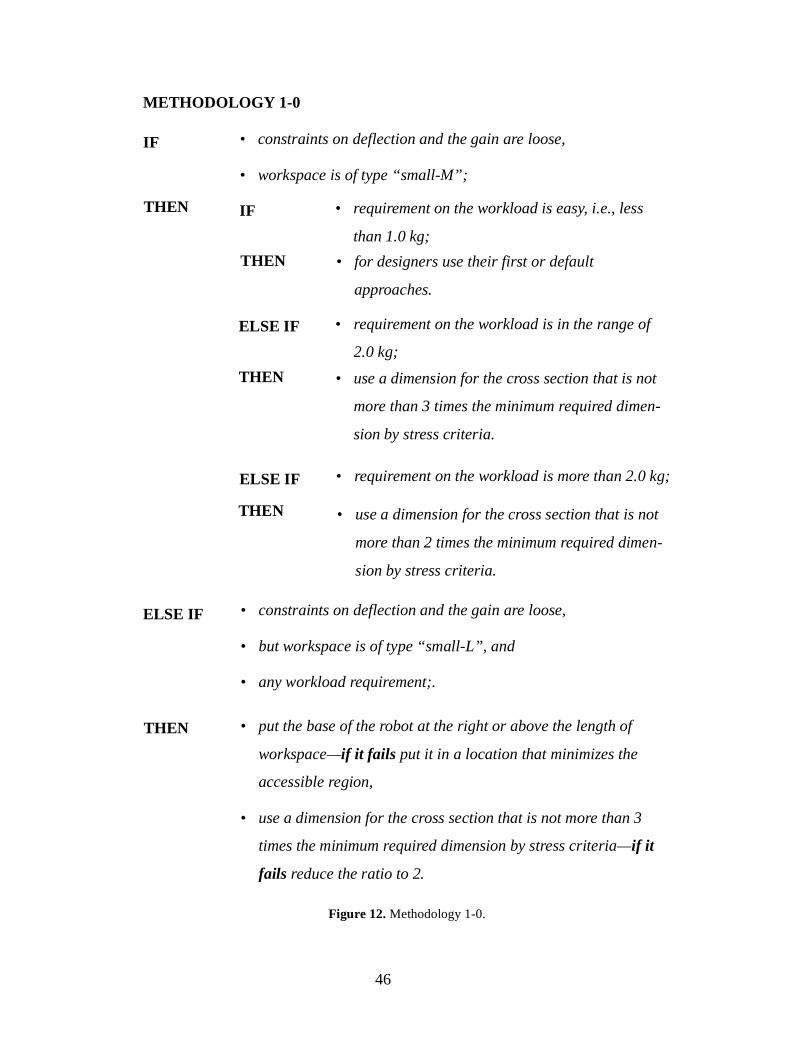
METHODOLOGY 1-0
• constraints on deflection and the gain are loose,
• workspace is of type “small-M”;
IF
THEN • for designers use their first or default
approaches.
• requirement on the workload is in the range of
2.0 kg;
ELSE IF
THEN • use a dimension for the cross section that is not
more than 3 times the minimum required dimen-
sion by stress criteria.
• requirement on the workload is more than 2.0 kg;ELSE IF
THEN • use a dimension for the cross section that is not
more than 2 times the minimum required dimen-
sion by stress criteria.
• constraints on deflection and the gain are loose,
• but workspace is of type “small-L”, and
• any workload requirement;.
ELSE IF
THEN • put the base of the robot at the right or above the length of
workspace—if it fails put it in a location that minimizes the
accessible region,
• use a dimension for the cross section that is not more than 3
times the minimum required dimension by stress criteria—if it
fails reduce the ratio to 2.
• requirement on the workload is easy, i.e., less
than 1.0 kg;
IFTHEN
Figure 12. Methodology 1-0.
46
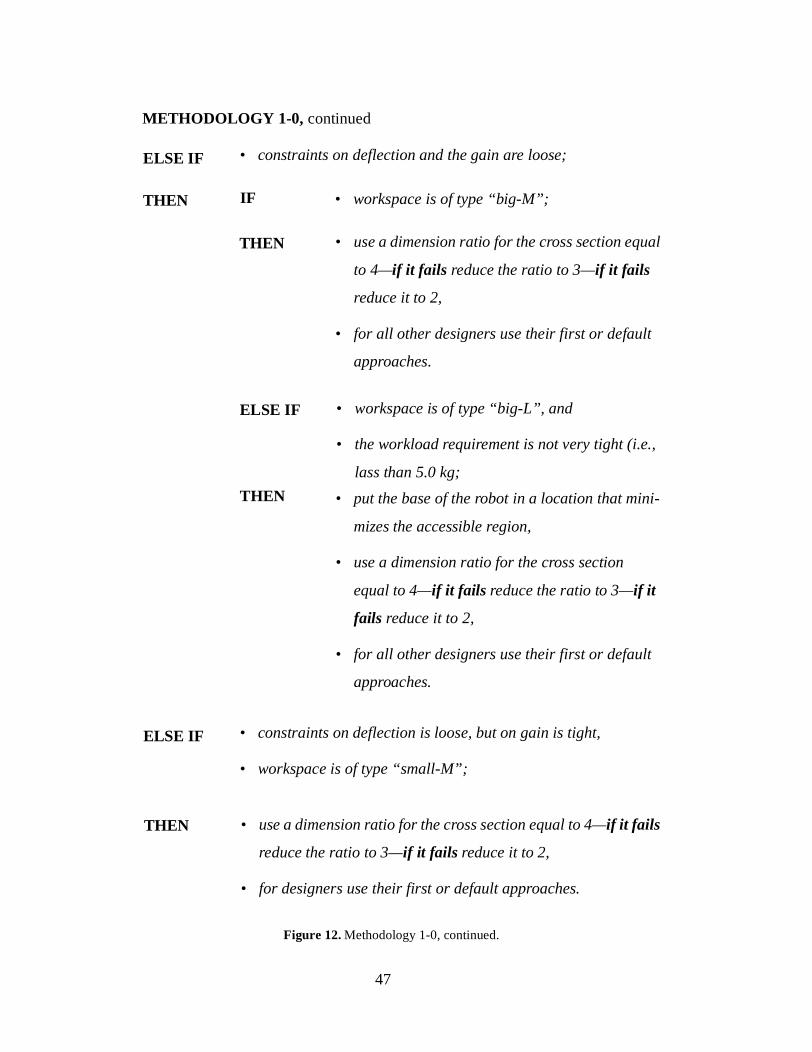
METHODOLOGY 1-0, continued
Figure 12. Methodology 1-0, continued.
• constraints on deflection and the gain are loose;ELSE IF
THEN
• use a dimension ratio for the cross section equal
to 4—if it fails reduce the ratio to 3—if it fails
reduce it to 2,
• for all other designers use their first or default
approaches.
• workspace is of type “big-L”, and
• the workload requirement is not very tight (i.e.,
lass than 5.0 kg;
ELSE IF
THEN • put the base of the robot in a location that mini-
mizes the accessible region,
• use a dimension ratio for the cross section
equal to 4—if it fails reduce the ratio to 3—if it
fails reduce it to 2,
• for all other designers use their first or default
approaches.
• constraints on deflection is loose, but on gain is tight,
• workspace is of type “small-M”;
ELSE IF
THEN • use a dimension ratio for the cross section equal to 4—if it fails
reduce the ratio to 3—if it fails reduce it to 2,
• for designers use their first or default approaches.
• workspace is of type “big-M”;IF
THEN
47

METHODOLOGY 1-0, continued
• constraint on deflection is tight,
• constraint on the gain is loose,
• workspace is not of type “big-L”;
ELSE IF
THEN • use a dimension ratio for the cross section equal to 4—if it fails
reduce the ratio to 3,
• for workspace of type “small-L” put the base of the robot at the
right or above the length of workspace, for type “M” work-
spaces put the base of the robot at the left or below the length of
workspace,
• for all other designers use their first or default approaches.
• constraints on deflection and the gain are both tight, and
• requirements on workload and settling time are rather “easy”;
ELSE IF
THEN
• use a dimension ratio for the cross section equal
to 4—if it fails reduce the ratio to 3,
• for all other designers use their first or default
approaches.
• workspace is of type “small-L”;ELSE IF
THEN • put the base of the robot in a location that mini-
mizes the accessible region,
• use a dimension ratio for the cross section
equal to 3,
• for all other designers use their first or default
approaches.
• workspace is of type “small-M”;IF
THEN
Figure 12. Methodology 1-0, continued.
48
ms
Acknowledgement
We acknowledge Professor M. Noori for co-advising the research and CLPSI for supporting it.
References
Badhrinath, K., and Jagannatha Rao, J. R. (1996). Modeling for Concurrent Design Using Game
Theory Formulations, Concurrent Engineering: Research and Applications, Vol. 4, No. 4,
December 1996, pp. 389-399.
Brown, D.C. & R. Douglas, R. (1993). Concurrent Accumulation of knowledge: A View of CE,
The Handbook of Concurrent Design and Manufacturing, H. R. Parsaei & W. G. Sullivan (Eds.),
Chapman & Hall, pp. 402-412.
Dasgupta, S., (1989). The structure of Design Processes, in Advances in Computers, Vol. 28, M.
C. Yovits (Ed.), Academic Press Inc., pp. 1-67.
Huang, G. Q. and Brandon, J. A., (1993). Cooperating Expert Systems in Mechanical Syste,
John Wiley & Sons Inc.
P. Jackson, P. (1990). Introduction to Expert Systems, Addison-Wesley, Inc., 1990.
Kannapan, S. M. and Marshek, K. M., (1992). Engineering Design Methodologies: A new Per-
spective, Intelligent Design and Manufacturing, A. Kusiak (Ed.), John Wiley & Sons, pp. 3-38.
49

d
ry
Klein, M., (1991). Supporting Conflict Resolution in Cooperative Design Systems, IEEE Trans-
actions on Systems, Man, and Cybernetics, Vol. 21, No. 6, pp. 1379-1389.
Lander, S.E., (1997). Issues in Multi-agent Design Systems, IEEE Expert: Intelligent Systems an
their Applications, Vol. 12, No. 2, pp. 18-26.
Langley, P., (1996). Elements of Machine Learning, Morgan Kaufmann, Inc.
NSF (1996). Research Opportunities in Engineering Design, NSF Strategic Planning Workshop
Final Report, (ed.) J. Shah.
Y. Reich, Y., and Fenves, S.J., (1991). The Formation and Use of Abstract Concepts in Design, in
Concept Formation: Knowledge and Experience in Unsupervised Learning, D. H. Fisher, M. J.
Pazzani, and P. Langley (Eds.). Morgan Kaufmann Publishers, Inc., pp. 323-353.
Shakeri, C., (1998). Discovery of Design Methodologies for the Integration of Multi-disciplina
Design Problems, Ph.D. Thesis, Worcester Polytechnic Institute.
Sobolewski, M., (1996). Multiagent Knowledge-Based Environment for Concurrent Engineering
Applications, Concurrent Engineering: Research and Applications, Vol. 4, No. 1, pp. 89-97.
Wooldridge, M., (1997). Agent-based software engineering, IEEE Transactions on Software
Engineering, 144(1): 26-37.
50