consolidated measurement report measurement report ... these measures only include patients who...
TRANSCRIPT

Kentucky State Aggregate Report
January 2015—December 2015
Consolidated Measurement Report
The Kentuckiana Health Collaborative is pleased to announce the release of the 2016 Consolidated Measurement Report. Private
reports were sent to health care providers throughout Kentucky to provide feedback on the quality of care their patients received on
select measures. For this report, the quality of care data were aggregated across providers at the county and region level. Anthem,
Humana, Passport Health, and WellCare Health Plan of Kentucky provided claims data for this report.
21 Medicaid
National Averages
BenchmarkAverage
Kentucky
PPO HMO
3
44
Preventive Care Management
Breast Cancer Screening Denominator 5,09980,409
73%70%97% 59%75%5 5Mammogram Performed
Cervical Cancer Screening Denominator 12,871182,068
75%72%98% 56%64%5 5Pap Test Performed
Chlamydia Screening Denominator, Overall 2,33937,720
47%43%83% 55%49%5 5Screening Performed
Colorectal Cancer Screening Denominator 13,212191,807
63%57%82% -52%5 5Appropriate Screening
Acute Care Management
Low Back Pain Denominator 1,25320,309
75%75%93% 74%67%5 5Appropriate Use of Imaging Study
Adults with Acute Bronchitis Denominator 69413,475
28%26%52% 28%18%5 5No Antibiotic Rx
Chronic Disease Care Management
Diabetes Denominator 8,48790,883
90%89%100% 86%92%5 5HbA1c Tested
55%47%94% 46%73%5 5 HbA1c Control (Tested < 8%)
34%44%0% 45%14%5 5 HbA1c Poor Control (Tested > 9%)
90%87%100% 90%89%5 5Nephropathy Monitored
54%47%68% 53%45%5 5Eye Exam (Retinal) Performed
--63% -40%5 5Diabetes Composite - All Tests Performed*
Asthma Controller Medication Ratio Denom., Overall 41110,621
78%78%100% 60%72%5 5Controller Medication Ratio
Asthma Medication Management Denominator, Overall 3648,872
--92% -65%5 5Med. Management (on Controller >50%)
46%49%78% 33%45%5 5Med. Management (on Controller >75%)
COPD Denominator 2867,255
43%41%77% 31%38%5 5Use of Spirometry Testing
AMI Denominator 221,445
85%82%100% 81%86%5 5Persistence of Beta-Blocker Tx after AMI
Antidepressant Medication Denominator 1,31219,427
50%51%74% 40%45%5 5Effective Continuation Phase Treatment
66%67%86% 55%60%5 5Effective Acute Phase Treatment
Pediatric Care Management
Childhood Immunization Denominator 1,26618,264
86%78%84% 76%60%5 5DTaP

Kentucky State Aggregate Report
January 2015—December 2015
Consolidated Measurement Report
21 Medicaid
National Averages
BenchmarkAverage
Kentucky
PPO HMO
3
44
Pediatric Care Management
Childhood Immunization Denominator 1,26618,264
65%61%77% 46%35%5 5Influenza
91%83%91% 88%70%5 5Polio
93%90%100% 89%85%5 5MMR
92%85%93% 88%74%5 5HiB (H Influenza Type B)
87%75%85% 88%51%5 5Hepatitis B
92%89%100% 89%85%5 5Chicken Pox
86%78%85% 77%60%5 5PCV (Pneumococcal conjugate)
86%83%97% 84%66%5 5Hepatitis A
80%73%84% 68%54%5 5Rotavirus
Adolesc. Immunization Denominator 80914,387
74%65%93% 73%68%5 5All Recommended
Well-Child Visits 0-15 m.o. 1,03915,997
78%77%93% 59%65%5 5At Least 6 Visits
Well-Child Visits 3-6 y.o. 5,49880,243
76%72%94% 71%73%5 5At Least 1 Visit
Pediatric Pharyngitis Denominator 1,62023,133
83%81%100% 71%76%5 5Group A Strep. Test
Pediatric URI Denominator 1,91826,968
88%87%98% 88%67%5 5No Antibiotic Rx
1
2
3
4
5
*
KHC website: www.KHCollaborative.org Public reporting: www.GoHealthShare.com
The total average across the measure's aggregate denominator (i.e., eligible patients or events) for the region.
The average rate for the top-ranked eligible (n > 4) providers, whose combined patients account for 10% of the total population from eligible providers. "N/A" means
that data are not available for comparison.
National averages are from the NCQA website, www.ncqa.org/report-cards/health-plans/state-of-health-care-quality/2016-table-of-contents.
PPO and HMO national averages are from commercial health plans.
These measures only include patients who received the listed test and whose most recent lab values are present in health plan data. This differs from HEDIS
specifications.
This measure has been changed from previous years to reflect the percentage of patients who received all three diabetes tests - Eye Exam (Retinal), HbA1c Testing, and
Nephropathy Monitoring.

Pediatric Care Management Preventive Care Management
Chronic Disease Management
January 2015—December 2015
Kentucky Average Kentucky Benchmark National PPO Average
Adult ScreeningWell-Child Care
Antibiotics and Testing
Diabetes Asthma and COPD Mental Illness and Depression
National Medicaid Average
Consolidated Measurement Report
Kentucky Community Aggregate Report
Childhood Immunizations
60
8478 76
DTaP
Childhood Immunizations (continued)
Imaging
70
9183 88
Polio
85100
90 89
MMR
74
9385 88
HiB
51
8575
88
Hep B
73
94
72 71
Well-Child 3-6 yrs.
85100
89 89
Chicken Pox
60
8578 77
PCV
66
9783 84
Hep A
54
8473 68
Rotavirus
35
77
61
46
Influenza
75
97
7059
Mammogram
64
98
72
56
Pap Test
52
82
57
Colo. Screen
67
93
75 74
LBP
9210089 86
HbA1c Test
45
68
4753
Eye Exam
89100
87 90
Nephropathy
72
100
78
60
Controller Ratio
45
78
49
33
Med Tx > 75%
38
77
4131
COPD Spirometry
65
93
77
59
Well-Child 0-15 mo.
68
93
6573
Adolesc. Immun.
76
100
8171
Group A Strep Test
67
9887 88
URI - No Rx
18
52
26 28
Bronchitis
49
83
4355
Chlamydia Screen
35
60
Follow-up 7 Days
55
100
Follow-up 30 Days
60
86
6755
Antidep. Rx Acute
45
74
5140
Antidep. 180 days
KHC website: www.KHCollaborative.org Public reporting: www.GoHealthShare.com
Acute Care Management
Antibiotics
Adult Screening (cont.)

Kentucky Area Development Districts Map
January 2015—December 2015
Consolidated Measurement Report
The Kentuckiana Health Collaborative is pleased to announce the release of the 2016 Consolidated Measurement Report. Private reports were sent to health care providers and group
practices in Kentucky to provide feedback on the quality of care their patients received on select measures. For this report, the quality of care data were aggregated across providers at
the Area Development District and state level. Data for the KIPDA ADD (number 10) do not include providers who only practice in Indiana. Anthem, Humana, Passport Health, and
WellCare Health Plan of Kentucky provided claims data for this report.
KHC website: www.KHCollaborative.org Public reporting: www.GoHealthShare.com

KY Area Development District Consolidated Measurement Report
January 2015—December 2015
Barren River
The Kentuckiana Health Collaborative is pleased to announce the release of the 2016 Consolidated Measurement Report. Private reports were sent to health care providers in Kentucky
and group practices in Kentuckiana to provide feedback on the quality of care their patients received on select measures. For this report, the quality of care data were aggregated across
providers at the Area Development District and state level. Anthem, Humana, Passport Health, and WellCare Health Plan of Kentucky provided claims data for this report.
HMOPPO
National Averages
Medicaid2 31Score 4Bench.
Kentucky
AverageB/W(99% CI)
5Barren River5
Preventive Care Management
Breast Cancer Screening Denominator 4,461 80,4097
=666Mammogram Performed 73% 75% 97%(71% - 75%) 73%70% 59%
Cervical Cancer Screening Denominator 12,054 182,0687
=666Pap Test Performed 61% 64% 98%(60% - 63%) 75%72% 56%
Chlamydia Screening Denominator 2,533 37,7207
=666Screening Performed 42% 49% 83%(39% - 44%) 47%43% 55%
Colorectal Cancer Screening Denominator 10,538 191,8077
=666Appropriate Screening 48% 52% 82%(47% - 50%) 63%57% -
Acute Care Management
Low Back Pain Denominator 1,466 20,3097
=666Appropriate Use of Imaging Study 62% 67% 93%(59% - 65%) 75%75% 74%
Adults with Acute Bronchitis Denominator 1,055 13,4757
=666No Antibiotic Rx 18% 18% 52%(15% - 21%) 28%26% 28%
Chronic Disease Care Management
Diabetes Denominator 5,342 90,8837
=666HbA1c Tested 90% 92% 100%(89% - 91%) 90%89% 86%
=666 HbA1c Control (Tested < 8%) 71% 73% 94%(68% - 74%) 55%47% 46%
=666 HbA1c Poor Control (Tested > 9%) 16% 14% N/A(14% - 18%) 34%44% 45%
=666Nephropathy Monitored 86% 89% 100%(85% - 87%) 90%87% 90%
=666Eye Exam (Retinal) Performed 44% 45% 68%(42% - 46%) 54%47% 53%
=666Diabetes Composite - All Tests Performed* 36% 40% 63%(34% - 38%) -- -
Asthma Controller Medication Ratio Denom. 609 10,6217
=666Controller Medication Ratio 76% 72% 100%(71% - 80%) 78%78% 49%
Asthma Medication Management Denominator 555 8,8727

KY Area Development District Consolidated Measurement Report
January 2015—December 2015
Barren River
HMOPPO
National Averages
Medicaid2 31Score 4Bench.
Kentucky
AverageB/W(99% CI)
5Barren River5
Chronic Disease Care Management
Asthma Medication Management Denominator 555 8,8727
=666Med. Management (on Controller >50%) 63% 65% 92%(58% - 68%) -- -
=666Med. Management (on Controller >75%) 41% 45% 78%(36% - 47%) 46%49% 33%
COPD Denominator 423 7,2557
=666Use of Spirometry Testing 42% 38% 77%(36% - 49%) 43%41% 31%
AMI Denominator n < 250 1,4457
-666Persistence of Beta-Blocker Tx after AMI - 86% 100%- 85%82% 81%
Antidepressant Medication Denominator 1,265 19,4277
=666Effective Continuation Phase Treatment 43% 45% 74%(39% - 46%) 50%51% 40%
=666Effective Acute Phase Treatment 56% 60% 86%(52% - 59%) 66%67% 55%
Pediatric Care Management
Pediatric Pharyngitis Denominator 2,086 23,1337
▼666Group A Strep. Test 66% 76% 100%(63% - 68%) 83%81% 71%
Pediatric URI Denominator 2,254 26,9687
▼666No Antibiotic Rx 57% 67% 98%(54% - 60%) 88%87% 88%
Childhood Immunization Denominator 1,184 18,2647
=666DTaP 67% 60%(63% - 70%) 86%78% 76%
=666Influenza 28% 35%(25% - 32%) 65%61% 46%
=666Polio 69% 70%(66% - 73%) 91%83% 88%
=666MMR 83% 85%(80% - 86%) 93%90% 89%
=666HiB (H Influenza Type B) 73% 74%(69% - 76%) 92%85% 88%
=666Hepatitis B 56% 51%(52% - 60%) 87%75% 88%
=666Chicken Pox 83% 85%(80% - 85%) 92%89% 89%
=666PCV (Pneumococcal conjugate) 55% 60%(51% - 58%) 86%78% 77%
▲666Hepatitis A 80% 66%(77% - 83%) 86%83% 84%
=666Rotavirus 55% 54%(52% - 59%) 80%73% 68%
Adolesc. Immunization Denominator 843 14,3877

KY Area Development District Consolidated Measurement Report
January 2015—December 2015
Barren River
HMOPPO
National Averages
Medicaid2 31Score 4Bench.
Kentucky
AverageB/W(99% CI)
5Barren River5
Pediatric Care Management
Adolesc. Immunization Denominator 843 14,3877
=666All Recommended 68% 68%(64% - 72%) 74%65% 73%
Well-Child Visits 0-15 m.o. 1,026 15,9977
=666At Least 6 Visits 62% 65%(58% - 66%) 78%77% 59%
Well-Child Visits 3-6 y.o. 5,450 80,2437
=666At Least 1 Visit 66% 73%(64% - 67%) 76%72% 71%
This is a 99% Confidence Interval constructed around the ADD's combined score for the measure. It shows the precision of the score, which is based on the size of the denominator and the score itself.
Symbols represent higher ("▲"), lower ("▼"), or equal ("=") performance compared to the average, benchmark, or your previous year, using 95% Confidence Intervals. A symbol's color represents better (" ") or worse (" ")
performance relative to the average, benchmark, or your previous year. Note that no comparison to 2013 rates is available for Chlamydia Screening, as guidelines changed for 2014 measurement.
The total average across the measure's aggregate denominator (i.e., eligible patients or events) for the state.
The average rate for the top-ranked eligible (n > 4) providers, whose combined patients account for 10% of the total population from eligible providers. "N/A" means that data are not available for comparison.
National averages are from NCQA's report, "The State of health Care Quality 2016," available at www.ncqa.org. PPO and HMO national averages are from commercial health plans.
These measures only include patients who received the listed test and whose most recent lab values are present in health plan data. This differs from HEDIS specifications.
Data are suppressed when the total denominator for the ADD is less than 250.
This measure has been changed from previous years to reflect the percentage of patients who received all three diabetes tests - Eye Exam (Retinal), HbA1c Testing, and Nephropathy Monitoring.
1
2
3
4
5
6
7
*
KHC website: www.KHCollaborative.org Public reporting: www.GoHealthShare.com
▲ ▼

KY Area Development District Consolidated Measurement Report
January 2015—December 2015
Big Sandy
The Kentuckiana Health Collaborative is pleased to announce the release of the 2016 Consolidated Measurement Report. Private reports were sent to health care providers in Kentucky
and group practices in Kentuckiana to provide feedback on the quality of care their patients received on select measures. For this report, the quality of care data were aggregated across
providers at the Area Development District and state level. Anthem, Humana, Passport Health, and WellCare Health Plan of Kentucky provided claims data for this report.
HMOPPO
National Averages
Medicaid2 31Score 4Bench.
Kentucky
AverageB/W(99% CI)
5Big Sandy5
Preventive Care Management
Breast Cancer Screening Denominator 3,378 80,4097
=666Mammogram Performed 67% 75% 97%(65% - 69%) 73%70% 59%
Cervical Cancer Screening Denominator 9,577 182,0687
=666Pap Test Performed 60% 64% 98%(58% - 61%) 75%72% 56%
Chlamydia Screening Denominator 1,727 37,7207
=666Screening Performed 48% 49% 83%(45% - 51%) 47%43% 55%
Colorectal Cancer Screening Denominator 8,184 191,8077
▼666Appropriate Screening 42% 52% 82%(41% - 44%) 63%57% -
Acute Care Management
Low Back Pain Denominator 1,076 20,3097
=666Appropriate Use of Imaging Study 69% 67% 93%(65% - 73%) 75%75% 74%
Adults with Acute Bronchitis Denominator 737 13,4757
=666No Antibiotic Rx 17% 18% 52%(14% - 21%) 28%26% 28%
Chronic Disease Care Management
Diabetes Denominator 5,473 90,8837
=666HbA1c Tested 89% 92% 100%(88% - 90%) 90%89% 86%
=666 HbA1c Control (Tested < 8%) 68% 73% 94%(65% - 71%) 55%47% 46%
=666 HbA1c Poor Control (Tested > 9%) 15% 14% N/A(12% - 17%) 34%44% 45%
=666Nephropathy Monitored 89% 89% 100%(88% - 90%) 90%87% 90%
=666Eye Exam (Retinal) Performed 38% 45% 68%(36% - 40%) 54%47% 53%
=666Diabetes Composite - All Tests Performed* 33% 40% 63%(31% - 34%) -- -
Asthma Controller Medication Ratio Denom. 608 10,6217
=666Controller Medication Ratio 66% 72% 100%(61% - 70%) 78%78% 49%
Asthma Medication Management Denominator 503 8,8727

KY Area Development District Consolidated Measurement Report
January 2015—December 2015
Big Sandy
HMOPPO
National Averages
Medicaid2 31Score 4Bench.
Kentucky
AverageB/W(99% CI)
5Big Sandy5
Chronic Disease Care Management
Asthma Medication Management Denominator 503 8,8727
=666Med. Management (on Controller >50%) 64% 65% 92%(58% - 69%) -- -
=666Med. Management (on Controller >75%) 43% 45% 78%(37% - 48%) 46%49% 33%
COPD Denominator 450 7,2557
=666Use of Spirometry Testing 33% 38% 77%(28% - 39%) 43%41% 31%
AMI Denominator n < 250 1,4457
-666Persistence of Beta-Blocker Tx after AMI - 86% 100%- 85%82% 81%
Antidepressant Medication Denominator 1,124 19,4277
=666Effective Continuation Phase Treatment 49% 45% 74%(45% - 53%) 50%51% 40%
=666Effective Acute Phase Treatment 60% 60% 86%(56% - 63%) 66%67% 55%
Pediatric Care Management
Pediatric Pharyngitis Denominator 1,078 23,1337
=666Group A Strep. Test 74% 76% 100%(70% - 77%) 83%81% 71%
Pediatric URI Denominator 1,672 26,9687
=666No Antibiotic Rx 58% 67% 98%(55% - 61%) 88%87% 88%
Childhood Immunization Denominator 708 18,2647
=666DTaP 60% 60%(55% - 65%) 86%78% 76%
=666Influenza 26% 35%(22% - 30%) 65%61% 46%
=666Polio 73% 70%(69% - 77%) 91%83% 88%
=666MMR 84% 85%(80% - 87%) 93%90% 89%
=666HiB (H Influenza Type B) 76% 74%(72% - 80%) 92%85% 88%
▲666Hepatitis B 63% 51%(58% - 67%) 87%75% 88%
=666Chicken Pox 88% 85%(84% - 90%) 92%89% 89%
=666PCV (Pneumococcal conjugate) 63% 60%(59% - 68%) 86%78% 77%
=666Hepatitis A 60% 66%(56% - 65%) 86%83% 84%
=666Rotavirus 53% 54%(48% - 58%) 80%73% 68%
Adolesc. Immunization Denominator 625 14,3877

KY Area Development District Consolidated Measurement Report
January 2015—December 2015
Big Sandy
HMOPPO
National Averages
Medicaid2 31Score 4Bench.
Kentucky
AverageB/W(99% CI)
5Big Sandy5
Pediatric Care Management
Adolesc. Immunization Denominator 625 14,3877
=666All Recommended 76% 68%(72% - 81%) 74%65% 73%
Well-Child Visits 0-15 m.o. 622 15,9977
=666At Least 6 Visits 59% 65%(54% - 64%) 78%77% 59%
Well-Child Visits 3-6 y.o. 3,049 80,2437
=666At Least 1 Visit 70% 73%(68% - 72%) 76%72% 71%
This is a 99% Confidence Interval constructed around the ADD's combined score for the measure. It shows the precision of the score, which is based on the size of the denominator and the score itself.
Symbols represent higher ("▲"), lower ("▼"), or equal ("=") performance compared to the average, benchmark, or your previous year, using 95% Confidence Intervals. A symbol's color represents better (" ") or worse (" ")
performance relative to the average, benchmark, or your previous year. Note that no comparison to 2013 rates is available for Chlamydia Screening, as guidelines changed for 2014 measurement.
The total average across the measure's aggregate denominator (i.e., eligible patients or events) for the state.
The average rate for the top-ranked eligible (n > 4) providers, whose combined patients account for 10% of the total population from eligible providers. "N/A" means that data are not available for comparison.
National averages are from NCQA's report, "The State of health Care Quality 2016," available at www.ncqa.org. PPO and HMO national averages are from commercial health plans.
These measures only include patients who received the listed test and whose most recent lab values are present in health plan data. This differs from HEDIS specifications.
Data are suppressed when the total denominator for the ADD is less than 250.
This measure has been changed from previous years to reflect the percentage of patients who received all three diabetes tests - Eye Exam (Retinal), HbA1c Testing, and Nephropathy Monitoring.
1
2
3
4
5
6
7
*
KHC website: www.KHCollaborative.org Public reporting: www.GoHealthShare.com
▲ ▼
KY Area Development District Consolidated Measurement Report
January 2015—December 2015
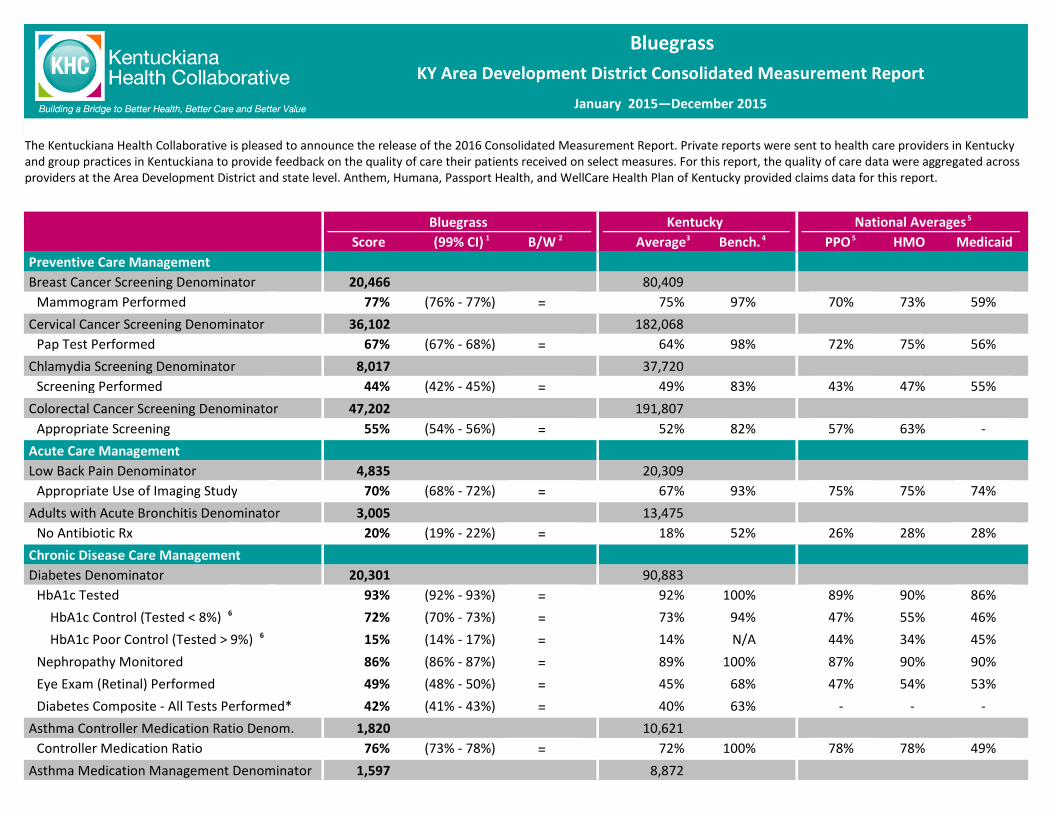
Bluegrass
The Kentuckiana Health Collaborative is pleased to announce the release of the 2016 Consolidated Measurement Report. Private reports were sent to health care providers in Kentucky
and group practices in Kentuckiana to provide feedback on the quality of care their patients received on select measures. For this report, the quality of care data were aggregated across
providers at the Area Development District and state level. Anthem, Humana, Passport Health, and WellCare Health Plan of Kentucky provided claims data for this report.
HMOPPO
National Averages
Medicaid2 31Score 4Bench.
Kentucky
AverageB/W(99% CI)
5Bluegrass5
Preventive Care Management
Breast Cancer Screening Denominator 20,466 80,4097
=666Mammogram Performed 77% 75% 97%(76% - 77%) 73%70% 59%
Cervical Cancer Screening Denominator 36,102 182,0687
=666Pap Test Performed 67% 64% 98%(67% - 68%) 75%72% 56%
Chlamydia Screening Denominator 8,017 37,7207
=666Screening Performed 44% 49% 83%(42% - 45%) 47%43% 55%
Colorectal Cancer Screening Denominator 47,202 191,8077
=666Appropriate Screening 55% 52% 82%(54% - 56%) 63%57% -
Acute Care Management
Low Back Pain Denominator 4,835 20,3097
=666Appropriate Use of Imaging Study 70% 67% 93%(68% - 72%) 75%75% 74%
Adults with Acute Bronchitis Denominator 3,005 13,4757
=666No Antibiotic Rx 20% 18% 52%(19% - 22%) 28%26% 28%
Chronic Disease Care Management
Diabetes Denominator 20,301 90,8837
=666HbA1c Tested 93% 92% 100%(92% - 93%) 90%89% 86%
=666 HbA1c Control (Tested < 8%) 72% 73% 94%(70% - 73%) 55%47% 46%
=666 HbA1c Poor Control (Tested > 9%) 15% 14% N/A(14% - 17%) 34%44% 45%
=666Nephropathy Monitored 86% 89% 100%(86% - 87%) 90%87% 90%
=666Eye Exam (Retinal) Performed 49% 45% 68%(48% - 50%) 54%47% 53%
=666Diabetes Composite - All Tests Performed* 42% 40% 63%(41% - 43%) -- -
Asthma Controller Medication Ratio Denom. 1,820 10,6217
=666Controller Medication Ratio 76% 72% 100%(73% - 78%) 78%78% 49%
Asthma Medication Management Denominator 1,597 8,8727

KY Area Development District Consolidated Measurement Report
January 2015—December 2015
Bluegrass
HMOPPO
National Averages
Medicaid2 31Score 4Bench.
Kentucky
AverageB/W(99% CI)
5Bluegrass5
Chronic Disease Care Management
Asthma Medication Management Denominator 1,597 8,8727
=666Med. Management (on Controller >50%) 68% 65% 92%(65% - 71%) -- -
=666Med. Management (on Controller >75%) 44% 45% 78%(41% - 48%) 46%49% 33%
COPD Denominator 1,572 7,2557
=666Use of Spirometry Testing 40% 38% 77%(37% - 43%) 43%41% 31%
AMI Denominator 291 1,4457
=666Persistence of Beta-Blocker Tx after AMI 82% 86% 100%(76% - 87%) 85%82% 81%
Antidepressant Medication Denominator 3,875 19,4277
=666Effective Acute Phase Treatment 61% 60% 86%(59% - 63%) 66%67% 55%
=666Effective Continuation Phase Treatment 46% 45% 74%(44% - 48%) 50%51% 40%
Pediatric Care Management
Pediatric Pharyngitis Denominator 4,516 23,1337
=666Group A Strep. Test 82% 76% 100%(80% - 83%) 83%81% 71%
Pediatric URI Denominator 5,509 26,9687
▲666No Antibiotic Rx 82% 67% 98%(80% - 83%) 88%87% 88%
Childhood Immunization Denominator 3,511 18,2647
=666DTaP 54% 60%(52% - 56%) 86%78% 76%
=666Influenza 43% 35%(41% - 45%) 65%61% 46%
=666Polio 64% 70%(62% - 66%) 91%83% 88%
=666MMR 83% 85%(82% - 85%) 93%90% 89%
=666HiB (H Influenza Type B) 70% 74%(68% - 72%) 92%85% 88%
=666Hepatitis B 45% 51%(43% - 47%) 87%75% 88%
=666Chicken Pox 84% 85%(82% - 85%) 92%89% 89%
=666PCV (Pneumococcal conjugate) 54% 60%(52% - 56%) 86%78% 77%
=666Hepatitis A 59% 66%(56% - 61%) 86%83% 84%
=666Rotavirus 51% 54%(49% - 53%) 80%73% 68%
Adolesc. Immunization Denominator 2,983 14,3877

KY Area Development District Consolidated Measurement Report
January 2015—December 2015
Bluegrass
HMOPPO
National Averages
Medicaid2 31Score 4Bench.
Kentucky
AverageB/W(99% CI)
5Bluegrass5
Pediatric Care Management
Adolesc. Immunization Denominator 2,983 14,3877
=666All Recommended 59% 68%(56% - 61%) 74%65% 73%
Well-Child Visits 0-15 m.o. 3,355 15,9977
=666At Least 6 Visits 66% 65%(64% - 68%) 78%77% 59%
Well-Child Visits 3-6 y.o. 16,267 80,2437
=666At Least 1 Visit 76% 73%(75% - 77%) 76%72% 71%
This is a 99% Confidence Interval constructed around the ADD's combined score for the measure. It shows the precision of the score, which is based on the size of the denominator and the score itself.
Symbols represent higher ("▲"), lower ("▼"), or equal ("=") performance compared to the average, benchmark, or your previous year, using 95% Confidence Intervals. A symbol's color represents better (" ") or worse (" ")
performance relative to the average, benchmark, or your previous year. Note that no comparison to 2013 rates is available for Chlamydia Screening, as guidelines changed for 2014 measurement.
The total average across the measure's aggregate denominator (i.e., eligible patients or events) for the state.
The average rate for the top-ranked eligible (n > 4) providers, whose combined patients account for 10% of the total population from eligible providers. "N/A" means that data are not available for comparison.
National averages are from NCQA's report, "The State of health Care Quality 2016," available at www.ncqa.org. PPO and HMO national averages are from commercial health plans.
These measures only include patients who received the listed test and whose most recent lab values are present in health plan data. This differs from HEDIS specifications.
Data are suppressed when the total denominator for the ADD is less than 250.
This measure has been changed from previous years to reflect the percentage of patients who received all three diabetes tests - Eye Exam (Retinal), HbA1c Testing, and Nephropathy Monitoring.
1
2
3
4
5
6
7
*
KHC website: www.KHCollaborative.org Public reporting: www.GoHealthShare.com
▲ ▼

KY Area Development District Consolidated Measurement Report
January 2015—December 2015
Buffalo Trace
The Kentuckiana Health Collaborative is pleased to announce the release of the 2016 Consolidated Measurement Report. Private reports were sent to health care providers in Kentucky
and group practices in Kentuckiana to provide feedback on the quality of care their patients received on select measures. For this report, the quality of care data were aggregated across
providers at the Area Development District and state level. Anthem, Humana, Passport Health, and WellCare Health Plan of Kentucky provided claims data for this report.
HMOPPO
National Averages
Medicaid2 31Score 4Bench.
Kentucky
AverageB/W(99% CI)
5Buffalo Trace5
Preventive Care Management
Breast Cancer Screening Denominator 1,067 80,4097
=666Mammogram Performed 70% 75% 97%(67% - 74%) 73%70% 59%
Cervical Cancer Screening Denominator 2,387 182,0687
=666Pap Test Performed 58% 64% 98%(55% - 60%) 75%72% 56%
Chlamydia Screening Denominator 560 37,7207
=666Screening Performed 58% 49% 83%(53% - 63%) 47%43% 55%
Colorectal Cancer Screening Denominator 2,544 191,8077
=666Appropriate Screening 44% 52% 82%(41% - 46%) 63%57% -
Acute Care Management
Low Back Pain Denominator 299 20,3097
=666Appropriate Use of Imaging Study 72% 67% 93%(65% - 78%) 75%75% 74%
Adults with Acute Bronchitis Denominator n < 250 13,4757
-666No Antibiotic Rx - 18% 52%- 28%26% 28%
Chronic Disease Care Management
Diabetes Denominator 1,498 90,8837
=666HbA1c Tested 91% 92% 100%(89% - 93%) 90%89% 86%
=666 HbA1c Control (Tested < 8%) 71% 73% 94%(66% - 76%) 55%47% 46%
=666 HbA1c Poor Control (Tested > 9%) 17% 14% N/A(14% - 22%) 34%44% 45%
=666Nephropathy Monitored 87% 89% 100%(85% - 89%) 90%87% 90%
=666Eye Exam (Retinal) Performed 45% 45% 68%(42% - 49%) 54%47% 53%
=666Diabetes Composite - All Tests Performed* 39% 40% 63%(36% - 43%) -- -
Asthma Controller Medication Ratio Denom. n < 250 10,6217
-666Controller Medication Ratio - 72% 100%- 78%78% 49%
Asthma Medication Management Denominator n < 250 8,8727

KY Area Development District Consolidated Measurement Report
January 2015—December 2015
Buffalo Trace
HMOPPO
National Averages
Medicaid2 31Score 4Bench.
Kentucky
AverageB/W(99% CI)
5Buffalo Trace5
Chronic Disease Care Management
Asthma Medication Management Denominator n < 250 8,8727
-666Med. Management (on Controller >50%) - 65% 92%- -- -
-666Med. Management (on Controller >75%) - 45% 78%- 46%49% 33%
COPD Denominator n < 250 7,2557
-666Use of Spirometry Testing - 38% 77%- 43%41% 31%
AMI Denominator n < 250 1,4457
-666Persistence of Beta-Blocker Tx after AMI - 86% 100%- 85%82% 81%
Antidepressant Medication Denominator n < 250 19,4277
-666Effective Acute Phase Treatment - 60% 86%- 66%67% 55%
-666Effective Continuation Phase Treatment - 45% 74%- 50%51% 40%
Pediatric Care Management
Pediatric Pharyngitis Denominator 255 23,1337
▼666Group A Strep. Test 53% 76% 100%(45% - 60%) 83%81% 71%
Pediatric URI Denominator n < 250 26,9687
-666No Antibiotic Rx - 67% 98%- 88%87% 88%
Childhood Immunization Denominator n < 250 18,2647
-666DTaP - 60%- 86%78% 76%
-666Influenza - 35%- 65%61% 46%
-666Polio - 70%- 91%83% 88%
-666MMR - 85%- 93%90% 89%
-666HiB (H Influenza Type B) - 74%- 92%85% 88%
-666Hepatitis B - 51%- 87%75% 88%
-666Chicken Pox - 85%- 92%89% 89%
-666PCV (Pneumococcal conjugate) - 60%- 86%78% 77%
-666Hepatitis A - 66%- 86%83% 84%
-666Rotavirus - 54%- 80%73% 68%
Adolesc. Immunization Denominator n < 250 14,3877

KY Area Development District Consolidated Measurement Report
January 2015—December 2015
Buffalo Trace
HMOPPO
National Averages
Medicaid2 31Score 4Bench.
Kentucky
AverageB/W(99% CI)
5Buffalo Trace5
Pediatric Care Management
Adolesc. Immunization Denominator n < 250 14,3877
-666All Recommended - 68%- 74%65% 73%
Well-Child Visits 0-15 m.o. n < 250 15,9977
-666At Least 6 Visits - 65%- 78%77% 59%
Well-Child Visits 3-6 y.o. 577 80,2437
▼666At Least 1 Visit 61% 73%(55% - 66%) 76%72% 71%
This is a 99% Confidence Interval constructed around the ADD's combined score for the measure. It shows the precision of the score, which is based on the size of the denominator and the score itself.
Symbols represent higher ("▲"), lower ("▼"), or equal ("=") performance compared to the average, benchmark, or your previous year, using 95% Confidence Intervals. A symbol's color represents better (" ") or worse (" ")
performance relative to the average, benchmark, or your previous year. Note that no comparison to 2013 rates is available for Chlamydia Screening, as guidelines changed for 2014 measurement.
The total average across the measure's aggregate denominator (i.e., eligible patients or events) for the state.
The average rate for the top-ranked eligible (n > 4) providers, whose combined patients account for 10% of the total population from eligible providers. "N/A" means that data are not available for comparison.
National averages are from NCQA's report, "The State of health Care Quality 2016," available at www.ncqa.org. PPO and HMO national averages are from commercial health plans.
These measures only include patients who received the listed test and whose most recent lab values are present in health plan data. This differs from HEDIS specifications.
Data are suppressed when the total denominator for the ADD is less than 250.
This measure has been changed from previous years to reflect the percentage of patients who received all three diabetes tests - Eye Exam (Retinal), HbA1c Testing, and Nephropathy Monitoring.
1
2
3
4
5
6
7
*
KHC website: www.KHCollaborative.org Public reporting: www.GoHealthShare.com
▲ ▼

KY Area Development District Consolidated Measurement Report
January 2015—December 2015
Cumberland Valley
The Kentuckiana Health Collaborative is pleased to announce the release of the 2016 Consolidated Measurement Report. Private reports were sent to health care providers in Kentucky
and group practices in Kentuckiana to provide feedback on the quality of care their patients received on select measures. For this report, the quality of care data were aggregated across
providers at the Area Development District and state level. Anthem, Humana, Passport Health, and WellCare Health Plan of Kentucky provided claims data for this report.
HMOPPO
National Averages
Medicaid2 31Score 4Bench.
Kentucky
AverageB/W(99% CI)
5Cumberland Valley5
Preventive Care Management
Breast Cancer Screening Denominator 4,251 80,4097
▼666Mammogram Performed 65% 75% 97%(63% - 67%) 73%70% 59%
Cervical Cancer Screening Denominator 15,256 182,0687
▼666Pap Test Performed 49% 64% 98%(48% - 50%) 75%72% 56%
Chlamydia Screening Denominator 3,141 37,7207
=666Screening Performed 45% 49% 83%(43% - 48%) 47%43% 55%
Colorectal Cancer Screening Denominator 11,226 191,8077
=666Appropriate Screening 43% 52% 82%(42% - 45%) 63%57% -
Acute Care Management
Low Back Pain Denominator 1,686 20,3097
=666Appropriate Use of Imaging Study 64% 67% 93%(60% - 66%) 75%75% 74%
Adults with Acute Bronchitis Denominator 1,508 13,4757
=666No Antibiotic Rx 16% 18% 52%(13% - 18%) 28%26% 28%
Chronic Disease Care Management
Diabetes Denominator 7,967 90,8837
=666HbA1c Tested 89% 92% 100%(88% - 89%) 90%89% 86%
=666 HbA1c Control (Tested < 8%) 68% 73% 94%(65% - 70%) 55%47% 46%
=666 HbA1c Poor Control (Tested > 9%) 16% 14% N/A(14% - 18%) 34%44% 45%
=666Nephropathy Monitored 89% 89% 100%(88% - 90%) 90%87% 90%
=666Eye Exam (Retinal) Performed 39% 45% 68%(37% - 40%) 54%47% 53%
=666Diabetes Composite - All Tests Performed* 33% 40% 63%(31% - 34%) -- -
Asthma Controller Medication Ratio Denom. 1,069 10,6217
=666Controller Medication Ratio 68% 72% 100%(64% - 71%) 78%78% 49%
Asthma Medication Management Denominator 876 8,8727

KY Area Development District Consolidated Measurement Report
January 2015—December 2015
Cumberland Valley
HMOPPO
National Averages
Medicaid2 31Score 4Bench.
Kentucky
AverageB/W(99% CI)
5Cumberland Valley5
Chronic Disease Care Management
Asthma Medication Management Denominator 876 8,8727
=666Med. Management (on Controller >50%) 67% 65% 92%(63% - 71%) -- -
=666Med. Management (on Controller >75%) 44% 45% 78%(39% - 48%) 46%49% 33%
COPD Denominator 633 7,2557
=666Use of Spirometry Testing 34% 38% 77%(30% - 39%) 43%41% 31%
AMI Denominator n < 250 1,4457
-666Persistence of Beta-Blocker Tx after AMI - 86% 100%- 85%82% 81%
Antidepressant Medication Denominator 2,006 19,4277
=666Effective Continuation Phase Treatment 44% 45% 74%(41% - 46%) 50%51% 40%
=666Effective Acute Phase Treatment 57% 60% 86%(54% - 60%) 66%67% 55%
Pediatric Care Management
Pediatric Pharyngitis Denominator 2,879 23,1337
=666Group A Strep. Test 72% 76% 100%(70% - 74%) 83%81% 71%
Pediatric URI Denominator 3,253 26,9687
=666No Antibiotic Rx 59% 67% 98%(57% - 62%) 88%87% 88%
Childhood Immunization Denominator 1,327 18,2647
▼666DTaP 39% 60%(36% - 43%) 86%78% 76%
▼666Influenza 16% 35%(13% - 19%) 65%61% 46%
▼666Polio 46% 70%(42% - 50%) 91%83% 88%
▼666MMR 66% 85%(62% - 69%) 93%90% 89%
▼666HiB (H Influenza Type B) 52% 74%(48% - 55%) 92%85% 88%
=666Hepatitis B 44% 51%(40% - 47%) 87%75% 88%
▼666Chicken Pox 66% 85%(63% - 69%) 92%89% 89%
▼666PCV (Pneumococcal conjugate) 41% 60%(37% - 44%) 86%78% 77%
▼666Hepatitis A 32% 66%(28% - 35%) 86%83% 84%
▼666Rotavirus 23% 54%(21% - 27%) 80%73% 68%
Adolesc. Immunization Denominator 1,173 14,3877

KY Area Development District Consolidated Measurement Report
January 2015—December 2015
Cumberland Valley
HMOPPO
National Averages
Medicaid2 31Score 4Bench.
Kentucky
AverageB/W(99% CI)
5Cumberland Valley5
Pediatric Care Management
Adolesc. Immunization Denominator 1,173 14,3877
▼666All Recommended 50% 68%(46% - 54%) 74%65% 73%
Well-Child Visits 0-15 m.o. 1,175 15,9977
▼666At Least 6 Visits 54% 65%(51% - 58%) 78%77% 59%
Well-Child Visits 3-6 y.o. 5,693 80,2437
=666At Least 1 Visit 64% 73%(63% - 66%) 76%72% 71%
This is a 99% Confidence Interval constructed around the ADD's combined score for the measure. It shows the precision of the score, which is based on the size of the denominator and the score itself.
Symbols represent higher ("▲"), lower ("▼"), or equal ("=") performance compared to the average, benchmark, or your previous year, using 95% Confidence Intervals. A symbol's color represents better (" ") or worse (" ")
performance relative to the average, benchmark, or your previous year. Note that no comparison to 2013 rates is available for Chlamydia Screening, as guidelines changed for 2014 measurement.
The total average across the measure's aggregate denominator (i.e., eligible patients or events) for the state.
The average rate for the top-ranked eligible (n > 4) providers, whose combined patients account for 10% of the total population from eligible providers. "N/A" means that data are not available for comparison.
National averages are from NCQA's report, "The State of health Care Quality 2016," available at www.ncqa.org. PPO and HMO national averages are from commercial health plans.
These measures only include patients who received the listed test and whose most recent lab values are present in health plan data. This differs from HEDIS specifications.
Data are suppressed when the total denominator for the ADD is less than 250.
This measure has been changed from previous years to reflect the percentage of patients who received all three diabetes tests - Eye Exam (Retinal), HbA1c Testing, and Nephropathy Monitoring.
1
2
3
4
5
6
7
*
KHC website: www.KHCollaborative.org Public reporting: www.GoHealthShare.com
▲ ▼

KY Area Development District Consolidated Measurement Report
January 2015—December 2015
Fivco
The Kentuckiana Health Collaborative is pleased to announce the release of the 2016 Consolidated Measurement Report. Private reports were sent to health care providers in Kentucky
and group practices in Kentuckiana to provide feedback on the quality of care their patients received on select measures. For this report, the quality of care data were aggregated across
providers at the Area Development District and state level. Anthem, Humana, Passport Health, and WellCare Health Plan of Kentucky provided claims data for this report.
HMOPPO
National Averages
Medicaid2 31Score 4Bench.
Kentucky
AverageB/W(99% CI)
5Fivco5
Preventive Care Management
Breast Cancer Screening Denominator 3,161 80,4097
=666Mammogram Performed 71% 75% 97%(69% - 73%) 73%70% 59%
Cervical Cancer Screening Denominator 8,189 182,0687
=666Pap Test Performed 56% 64% 98%(54% - 57%) 75%72% 56%
Chlamydia Screening Denominator 1,375 37,7207
=666Screening Performed 44% 49% 83%(41% - 48%) 47%43% 55%
Colorectal Cancer Screening Denominator 6,908 191,8077
=666Appropriate Screening 46% 52% 82%(45% - 48%) 63%57% -
Acute Care Management
Low Back Pain Denominator 819 20,3097
=666Appropriate Use of Imaging Study 65% 67% 93%(60% - 69%) 75%75% 74%
Adults with Acute Bronchitis Denominator 415 13,4757
▲666No Antibiotic Rx 31% 18% 52%(26% - 37%) 28%26% 28%
Chronic Disease Care Management
Diabetes Denominator 4,095 90,8837
=666HbA1c Tested 91% 92% 100%(90% - 92%) 90%89% 86%
=666 HbA1c Control (Tested < 8%) 71% 73% 94%(66% - 75%) 55%47% 46%
=666 HbA1c Poor Control (Tested > 9%) 17% 14% N/A(13% - 20%) 34%44% 45%
=666Nephropathy Monitored 90% 89% 100%(89% - 91%) 90%87% 90%
=666Eye Exam (Retinal) Performed 48% 45% 68%(46% - 50%) 54%47% 53%
=666Diabetes Composite - All Tests Performed* 43% 40% 63%(41% - 45%) -- -
Asthma Controller Medication Ratio Denom. 544 10,6217
=666Controller Medication Ratio 71% 72% 100%(66% - 76%) 78%78% 49%
Asthma Medication Management Denominator 471 8,8727

KY Area Development District Consolidated Measurement Report
January 2015—December 2015
Fivco
HMOPPO
National Averages
Medicaid2 31Score 4Bench.
Kentucky
AverageB/W(99% CI)
5Fivco5
Chronic Disease Care Management
Asthma Medication Management Denominator 471 8,8727
=666Med. Management (on Controller >50%) 65% 65% 92%(60% - 71%) -- -
=666Med. Management (on Controller >75%) 44% 45% 78%(38% - 50%) 46%49% 33%
COPD Denominator 362 7,2557
=666Use of Spirometry Testing 44% 38% 77%(37% - 50%) 43%41% 31%
AMI Denominator n < 250 1,4457
-666Persistence of Beta-Blocker Tx after AMI - 86% 100%- 85%82% 81%
Antidepressant Medication Denominator 809 19,4277
=666Effective Continuation Phase Treatment 45% 45% 74%(41% - 50%) 50%51% 40%
=666Effective Acute Phase Treatment 61% 60% 86%(57% - 66%) 66%67% 55%
Pediatric Care Management
Pediatric Pharyngitis Denominator 520 23,1337
▼666Group A Strep. Test 59% 76% 100%(53% - 64%) 83%81% 71%
Pediatric URI Denominator 742 26,9687
▲666No Antibiotic Rx 81% 67% 98%(77% - 84%) 88%87% 88%
Childhood Immunization Denominator 609 18,2647
=666DTaP 61% 60%(56% - 66%) 86%78% 76%
=666Influenza 28% 35%(24% - 33%) 65%61% 46%
=666Polio 73% 70%(69% - 78%) 91%83% 88%
=666MMR 81% 85%(77% - 85%) 93%90% 89%
=666HiB (H Influenza Type B) 77% 74%(72% - 81%) 92%85% 88%
▲666Hepatitis B 64% 51%(59% - 69%) 87%75% 88%
=666Chicken Pox 82% 85%(78% - 86%) 92%89% 89%
=666PCV (Pneumococcal conjugate) 64% 60%(59% - 69%) 86%78% 77%
=666Hepatitis A 65% 66%(60% - 70%) 86%83% 84%
=666Rotavirus 56% 54%(51% - 61%) 80%73% 68%
Adolesc. Immunization Denominator 513 14,3877

KY Area Development District Consolidated Measurement Report
January 2015—December 2015
Fivco
HMOPPO
National Averages
Medicaid2 31Score 4Bench.
Kentucky
AverageB/W(99% CI)
5Fivco5
Pediatric Care Management
Adolesc. Immunization Denominator 513 14,3877
=666All Recommended 76% 68%(71% - 81%) 74%65% 73%
Well-Child Visits 0-15 m.o. 573 15,9977
=666At Least 6 Visits 57% 65%(51% - 62%) 78%77% 59%
Well-Child Visits 3-6 y.o. 2,568 80,2437
▼666At Least 1 Visit 63% 73%(60% - 65%) 76%72% 71%
This is a 99% Confidence Interval constructed around the ADD's combined score for the measure. It shows the precision of the score, which is based on the size of the denominator and the score itself.
Symbols represent higher ("▲"), lower ("▼"), or equal ("=") performance compared to the average, benchmark, or your previous year, using 95% Confidence Intervals. A symbol's color represents better (" ") or worse (" ")
performance relative to the average, benchmark, or your previous year. Note that no comparison to 2013 rates is available for Chlamydia Screening, as guidelines changed for 2014 measurement.
The total average across the measure's aggregate denominator (i.e., eligible patients or events) for the state.
The average rate for the top-ranked eligible (n > 4) providers, whose combined patients account for 10% of the total population from eligible providers. "N/A" means that data are not available for comparison.
National averages are from NCQA's report, "The State of health Care Quality 2016," available at www.ncqa.org. PPO and HMO national averages are from commercial health plans.
These measures only include patients who received the listed test and whose most recent lab values are present in health plan data. This differs from HEDIS specifications.
Data are suppressed when the total denominator for the ADD is less than 250.
This measure has been changed from previous years to reflect the percentage of patients who received all three diabetes tests - Eye Exam (Retinal), HbA1c Testing, and Nephropathy Monitoring.
1
2
3
4
5
6
7
*
KHC website: www.KHCollaborative.org Public reporting: www.GoHealthShare.com
▲ ▼

KY Area Development District Consolidated Measurement Report
January 2015—December 2015
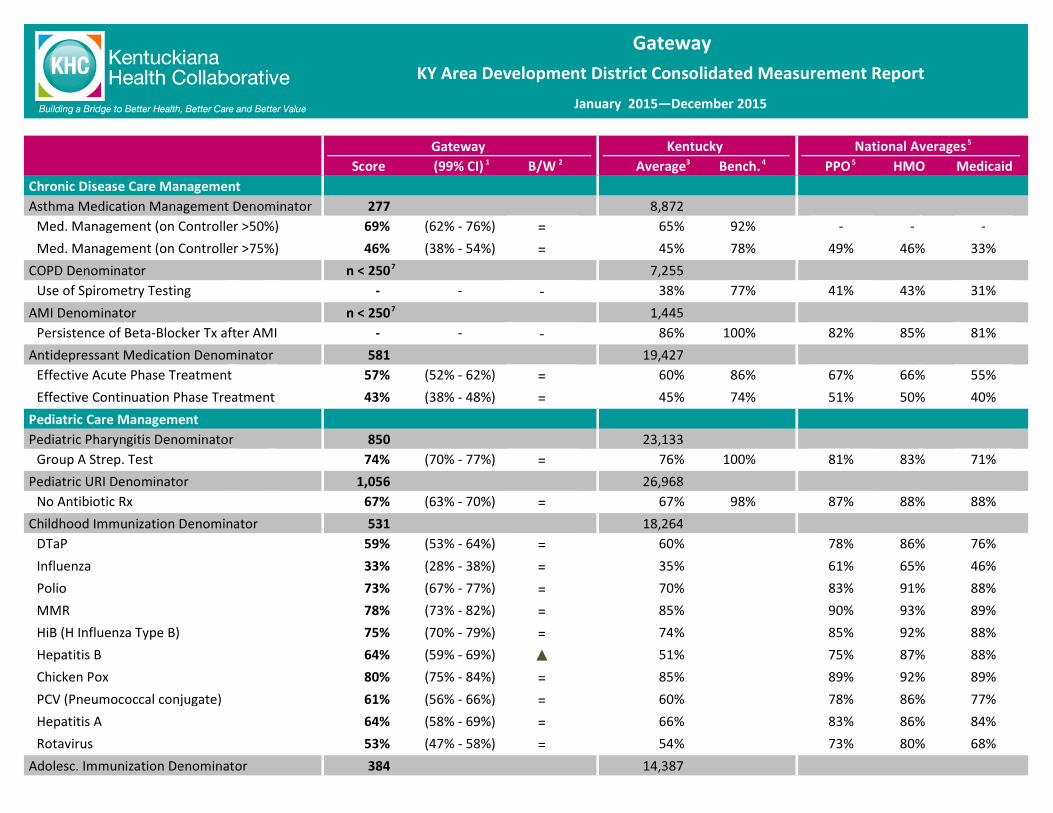
Gateway
The Kentuckiana Health Collaborative is pleased to announce the release of the 2016 Consolidated Measurement Report. Private reports were sent to health care providers in Kentucky
and group practices in Kentuckiana to provide feedback on the quality of care their patients received on select measures. For this report, the quality of care data were aggregated across
providers at the Area Development District and state level. Anthem, Humana, Passport Health, and WellCare Health Plan of Kentucky provided claims data for this report.
HMOPPO
National Averages
Medicaid2 31Score 4Bench.
Kentucky
AverageB/W(99% CI)
5Gateway5
Preventive Care Management
Breast Cancer Screening Denominator 1,850 80,4097
=666Mammogram Performed 66% 75% 97%(63% - 68%) 73%70% 59%
Cervical Cancer Screening Denominator 5,098 182,0687
▼666Pap Test Performed 53% 64% 98%(51% - 55%) 75%72% 56%
Chlamydia Screening Denominator 1,098 37,7207
=666Screening Performed 43% 49% 83%(39% - 47%) 47%43% 55%
Colorectal Cancer Screening Denominator 4,698 191,8077
=666Appropriate Screening 47% 52% 82%(45% - 49%) 63%57% -
Acute Care Management
Low Back Pain Denominator 645 20,3097
=666Appropriate Use of Imaging Study 63% 67% 93%(58% - 68%) 75%75% 74%
Adults with Acute Bronchitis Denominator 565 13,4757
=666No Antibiotic Rx 19% 18% 52%(15% - 24%) 28%26% 28%
Chronic Disease Care Management
Diabetes Denominator 2,678 90,8837
=666HbA1c Tested 90% 92% 100%(89% - 92%) 90%89% 86%
=666 HbA1c Control (Tested < 8%) 69% 73% 94%(64% - 74%) 55%47% 46%
=666 HbA1c Poor Control (Tested > 9%) 16% 14% N/A(12% - 20%) 34%44% 45%
=666Nephropathy Monitored 87% 89% 100%(86% - 89%) 90%87% 90%
=666Eye Exam (Retinal) Performed 43% 45% 68%(40% - 45%) 54%47% 53%
=666Diabetes Composite - All Tests Performed* 37% 40% 63%(34% - 39%) -- -
Asthma Controller Medication Ratio Denom. 346 10,6217
=666Controller Medication Ratio 66% 72% 100%(59% - 72%) 78%78% 49%
Asthma Medication Management Denominator 277 8,8727
KY Area Development District Consolidated Measurement Report
January 2015—December 2015
Gateway
HMOPPO
National Averages
Medicaid2 31Score 4Bench.
Kentucky
AverageB/W(99% CI)
5Gateway5
Chronic Disease Care Management
Asthma Medication Management Denominator 277 8,8727
=666Med. Management (on Controller >50%) 69% 65% 92%(62% - 76%) -- -
=666Med. Management (on Controller >75%) 46% 45% 78%(38% - 54%) 46%49% 33%
COPD Denominator n < 250 7,2557
-666Use of Spirometry Testing - 38% 77%- 43%41% 31%
AMI Denominator n < 250 1,4457
-666Persistence of Beta-Blocker Tx after AMI - 86% 100%- 85%82% 81%
Antidepressant Medication Denominator 581 19,4277
=666Effective Acute Phase Treatment 57% 60% 86%(52% - 62%) 66%67% 55%
=666Effective Continuation Phase Treatment 43% 45% 74%(38% - 48%) 50%51% 40%
Pediatric Care Management
Pediatric Pharyngitis Denominator 850 23,1337
=666Group A Strep. Test 74% 76% 100%(70% - 77%) 83%81% 71%
Pediatric URI Denominator 1,056 26,9687
=666No Antibiotic Rx 67% 67% 98%(63% - 70%) 88%87% 88%
Childhood Immunization Denominator 531 18,2647
=666DTaP 59% 60%(53% - 64%) 86%78% 76%
=666Influenza 33% 35%(28% - 38%) 65%61% 46%
=666Polio 73% 70%(67% - 77%) 91%83% 88%
=666MMR 78% 85%(73% - 82%) 93%90% 89%
=666HiB (H Influenza Type B) 75% 74%(70% - 79%) 92%85% 88%
▲666Hepatitis B 64% 51%(59% - 69%) 87%75% 88%
=666Chicken Pox 80% 85%(75% - 84%) 92%89% 89%
=666PCV (Pneumococcal conjugate) 61% 60%(56% - 66%) 86%78% 77%
=666Hepatitis A 64% 66%(58% - 69%) 86%83% 84%
=666Rotavirus 53% 54%(47% - 58%) 80%73% 68%
Adolesc. Immunization Denominator 384 14,3877

KY Area Development District Consolidated Measurement Report
January 2015—December 2015
Gateway
HMOPPO
National Averages
Medicaid2 31Score 4Bench.
Kentucky
AverageB/W(99% CI)
5Gateway5
Pediatric Care Management
Adolesc. Immunization Denominator 384 14,3877
=666All Recommended 66% 68%(59% - 72%) 74%65% 73%
Well-Child Visits 0-15 m.o. 526 15,9977
=666At Least 6 Visits 58% 65%(53% - 64%) 78%77% 59%
Well-Child Visits 3-6 y.o. 2,051 80,2437
=666At Least 1 Visit 67% 73%(64% - 69%) 76%72% 71%
This is a 99% Confidence Interval constructed around the ADD's combined score for the measure. It shows the precision of the score, which is based on the size of the denominator and the score itself.
Symbols represent higher ("▲"), lower ("▼"), or equal ("=") performance compared to the average, benchmark, or your previous year, using 95% Confidence Intervals. A symbol's color represents better (" ") or worse (" ")
performance relative to the average, benchmark, or your previous year. Note that no comparison to 2013 rates is available for Chlamydia Screening, as guidelines changed for 2014 measurement.
The total average across the measure's aggregate denominator (i.e., eligible patients or events) for the state.
The average rate for the top-ranked eligible (n > 4) providers, whose combined patients account for 10% of the total population from eligible providers. "N/A" means that data are not available for comparison.
National averages are from NCQA's report, "The State of health Care Quality 2016," available at www.ncqa.org. PPO and HMO national averages are from commercial health plans.
These measures only include patients who received the listed test and whose most recent lab values are present in health plan data. This differs from HEDIS specifications.
Data are suppressed when the total denominator for the ADD is less than 250.
This measure has been changed from previous years to reflect the percentage of patients who received all three diabetes tests - Eye Exam (Retinal), HbA1c Testing, and Nephropathy Monitoring.
1
2
3
4
5
6
7
*
KHC website: www.KHCollaborative.org Public reporting: www.GoHealthShare.com
▲ ▼

KY Area Development District Consolidated Measurement Report
January 2015—December 2015
Green River
The Kentuckiana Health Collaborative is pleased to announce the release of the 2016 Consolidated Measurement Report. Private reports were sent to health care providers in Kentucky
and group practices in Kentuckiana to provide feedback on the quality of care their patients received on select measures. For this report, the quality of care data were aggregated across
providers at the Area Development District and state level. Anthem, Humana, Passport Health, and WellCare Health Plan of Kentucky provided claims data for this report.
HMOPPO
National Averages
Medicaid2 31Score 4Bench.
Kentucky
AverageB/W(99% CI)
5Green River5
Preventive Care Management
Breast Cancer Screening Denominator 3,993 80,4097
=666Mammogram Performed 80% 75% 97%(79% - 82%) 73%70% 59%
Cervical Cancer Screening Denominator 9,810 182,0687
=666Pap Test Performed 63% 64% 98%(62% - 64%) 75%72% 56%
Chlamydia Screening Denominator 2,101 37,7207
=666Screening Performed 52% 49% 83%(50% - 55%) 47%43% 55%
Colorectal Cancer Screening Denominator 9,669 191,8077
=666Appropriate Screening 55% 52% 82%(53% - 56%) 63%57% -
Acute Care Management
Low Back Pain Denominator 1,158 20,3097
=666Appropriate Use of Imaging Study 66% 67% 93%(62% - 69%) 75%75% 74%
Adults with Acute Bronchitis Denominator 761 13,4757
=666No Antibiotic Rx 13% 18% 52%(10% - 16%) 28%26% 28%
Chronic Disease Care Management
Diabetes Denominator 4,900 90,8837
=666HbA1c Tested 92% 92% 100%(91% - 93%) 90%89% 86%
=666 HbA1c Control (Tested < 8%) 76% 73% 94%(72% - 79%) 55%47% 46%
=666 HbA1c Poor Control (Tested > 9%) 14% 14% N/A(11% - 17%) 34%44% 45%
=666Nephropathy Monitored 89% 89% 100%(88% - 90%) 90%87% 90%
=666Eye Exam (Retinal) Performed 43% 45% 68%(41% - 45%) 54%47% 53%
=666Diabetes Composite - All Tests Performed* 38% 40% 63%(36% - 40%) -- -
Asthma Controller Medication Ratio Denom. 427 10,6217
=666Controller Medication Ratio 74% 72% 100%(68% - 79%) 78%78% 49%
Asthma Medication Management Denominator 385 8,8727

KY Area Development District Consolidated Measurement Report
January 2015—December 2015
Green River
HMOPPO
National Averages
Medicaid2 31Score 4Bench.
Kentucky
AverageB/W(99% CI)
5Green River5
Chronic Disease Care Management
Asthma Medication Management Denominator 385 8,8727
=666Med. Management (on Controller >50%) 64% 65% 92%(58% - 70%) -- -
=666Med. Management (on Controller >75%) 41% 45% 78%(35% - 48%) 46%49% 33%
COPD Denominator 339 7,2557
=666Use of Spirometry Testing 45% 38% 77%(39% - 52%) 43%41% 31%
AMI Denominator n < 250 1,4457
-666Persistence of Beta-Blocker Tx after AMI - 86% 100%- 85%82% 81%
Antidepressant Medication Denominator 1,067 19,4277
=666Effective Continuation Phase Treatment 48% 45% 74%(44% - 51%) 50%51% 40%
=666Effective Acute Phase Treatment 62% 60% 86%(58% - 65%) 66%67% 55%
Pediatric Care Management
Pediatric Pharyngitis Denominator 1,316 23,1337
▼666Group A Strep. Test 66% 76% 100%(62% - 69%) 83%81% 71%
Pediatric URI Denominator 2,072 26,9687
▼666No Antibiotic Rx 55% 67% 98%(52% - 58%) 88%87% 88%
Childhood Immunization Denominator 929 18,2647
=666DTaP 61% 60%(57% - 65%) 86%78% 76%
▼666Influenza 23% 35%(20% - 27%) 65%61% 46%
=666Polio 73% 70%(69% - 76%) 91%83% 88%
=666MMR 87% 85%(84% - 90%) 93%90% 89%
=666HiB (H Influenza Type B) 73% 74%(70% - 77%) 92%85% 88%
▼666Hepatitis B 34% 51%(30% - 38%) 87%75% 88%
=666Chicken Pox 88% 85%(85% - 90%) 92%89% 89%
=666PCV (Pneumococcal conjugate) 61% 60%(57% - 65%) 86%78% 77%
▲666Hepatitis A 82% 66%(78% - 85%) 86%83% 84%
=666Rotavirus 57% 54%(53% - 61%) 80%73% 68%
Adolesc. Immunization Denominator 707 14,3877

KY Area Development District Consolidated Measurement Report
January 2015—December 2015
Green River
HMOPPO
National Averages
Medicaid2 31Score 4Bench.
Kentucky
AverageB/W(99% CI)
5Green River5
Pediatric Care Management
Adolesc. Immunization Denominator 707 14,3877
=666All Recommended 74% 68%(70% - 78%) 74%65% 73%
Well-Child Visits 0-15 m.o. 959 15,9977
=666At Least 6 Visits 67% 65%(63% - 71%) 78%77% 59%
Well-Child Visits 3-6 y.o. 4,829 80,2437
=666At Least 1 Visit 75% 73%(73% - 76%) 76%72% 71%
This is a 99% Confidence Interval constructed around the ADD's combined score for the measure. It shows the precision of the score, which is based on the size of the denominator and the score itself.
Symbols represent higher ("▲"), lower ("▼"), or equal ("=") performance compared to the average, benchmark, or your previous year, using 95% Confidence Intervals. A symbol's color represents better (" ") or worse (" ")
performance relative to the average, benchmark, or your previous year. Note that no comparison to 2013 rates is available for Chlamydia Screening, as guidelines changed for 2014 measurement.
The total average across the measure's aggregate denominator (i.e., eligible patients or events) for the state.
The average rate for the top-ranked eligible (n > 4) providers, whose combined patients account for 10% of the total population from eligible providers. "N/A" means that data are not available for comparison.
National averages are from NCQA's report, "The State of health Care Quality 2016," available at www.ncqa.org. PPO and HMO national averages are from commercial health plans.
These measures only include patients who received the listed test and whose most recent lab values are present in health plan data. This differs from HEDIS specifications.
Data are suppressed when the total denominator for the ADD is less than 250.
This measure has been changed from previous years to reflect the percentage of patients who received all three diabetes tests - Eye Exam (Retinal), HbA1c Testing, and Nephropathy Monitoring.
1
2
3
4
5
6
7
*
KHC website: www.KHCollaborative.org Public reporting: www.GoHealthShare.com
▲ ▼

KY Area Development District Consolidated Measurement Report
January 2015—December 2015
Kentucky River
The Kentuckiana Health Collaborative is pleased to announce the release of the 2016 Consolidated Measurement Report. Private reports were sent to health care providers in Kentucky
and group practices in Kentuckiana to provide feedback on the quality of care their patients received on select measures. For this report, the quality of care data were aggregated across
providers at the Area Development District and state level. Anthem, Humana, Passport Health, and WellCare Health Plan of Kentucky provided claims data for this report.
HMOPPO
National Averages
Medicaid2 31Score 4Bench.
Kentucky
AverageB/W(99% CI)
5Kentucky River5
Preventive Care Management
Breast Cancer Screening Denominator 2,658 80,4097
▼666Mammogram Performed 61% 75% 97%(59% - 64%) 73%70% 59%
Cervical Cancer Screening Denominator 11,059 182,0687
▼666Pap Test Performed 49% 64% 98%(48% - 51%) 75%72% 56%
Chlamydia Screening Denominator 2,156 37,7207
▼666Screening Performed 36% 49% 83%(34% - 39%) 47%43% 55%
Colorectal Cancer Screening Denominator 7,047 191,8077
▼666Appropriate Screening 37% 52% 82%(35% - 38%) 63%57% -
Acute Care Management
Low Back Pain Denominator 1,273 20,3097
=666Appropriate Use of Imaging Study 62% 67% 93%(58% - 65%) 75%75% 74%
Adults with Acute Bronchitis Denominator 916 13,4757
=666No Antibiotic Rx 16% 18% 52%(13% - 19%) 28%26% 28%
Chronic Disease Care Management
Diabetes Denominator 5,427 90,8837
=666HbA1c Tested 90% 92% 100%(89% - 91%) 90%89% 86%
=666 HbA1c Control (Tested < 8%) 68% 73% 94%(65% - 71%) 55%47% 46%
=666 HbA1c Poor Control (Tested > 9%) 16% 14% N/A(14% - 19%) 34%44% 45%
=666Nephropathy Monitored 90% 89% 100%(89% - 91%) 90%87% 90%
=666Eye Exam (Retinal) Performed 37% 45% 68%(36% - 39%) 54%47% 53%
=666Diabetes Composite - All Tests Performed* 32% 40% 63%(31% - 34%) -- -
Asthma Controller Medication Ratio Denom. 750 10,6217
▼666Controller Medication Ratio 61% 72% 100%(57% - 66%) 78%78% 49%
Asthma Medication Management Denominator 598 8,8727

KY Area Development District Consolidated Measurement Report
January 2015—December 2015
Kentucky River
HMOPPO
National Averages
Medicaid2 31Score 4Bench.
Kentucky
AverageB/W(99% CI)
5Kentucky River5
Chronic Disease Care Management
Asthma Medication Management Denominator 598 8,8727
=666Med. Management (on Controller >50%) 66% 65% 92%(61% - 71%) -- -
=666Med. Management (on Controller >75%) 43% 45% 78%(38% - 48%) 46%49% 33%
COPD Denominator 477 7,2557
=666Use of Spirometry Testing 29% 38% 77%(24% - 35%) 43%41% 31%
AMI Denominator n < 250 1,4457
-666Persistence of Beta-Blocker Tx after AMI - 86% 100%- 85%82% 81%
Antidepressant Medication Denominator 1,495 19,4277
=666Effective Acute Phase Treatment 55% 60% 86%(52% - 59%) 66%67% 55%
=666Effective Continuation Phase Treatment 42% 45% 74%(39% - 46%) 50%51% 40%
Pediatric Care Management
Pediatric Pharyngitis Denominator 1,498 23,1337
=666Group A Strep. Test 69% 76% 100%(65% - 72%) 83%81% 71%
Pediatric URI Denominator 2,180 26,9687
▼666No Antibiotic Rx 44% 67% 98%(41% - 46%) 88%87% 88%
Childhood Immunization Denominator 749 18,2647
▼666DTaP 44% 60%(39% - 49%) 86%78% 76%
▼666Influenza 14% 35%(11% - 18%) 65%61% 46%
▼666Polio 60% 70%(55% - 64%) 91%83% 88%
=666MMR 77% 85%(72% - 80%) 93%90% 89%
▼666HiB (H Influenza Type B) 62% 74%(57% - 66%) 92%85% 88%
=666Hepatitis B 48% 51%(43% - 53%) 87%75% 88%
=666Chicken Pox 77% 85%(73% - 81%) 92%89% 89%
▼666PCV (Pneumococcal conjugate) 47% 60%(42% - 51%) 86%78% 77%
▼666Hepatitis A 48% 66%(44% - 53%) 86%83% 84%
▼666Rotavirus 39% 54%(34% - 44%) 80%73% 68%
Adolesc. Immunization Denominator 681 14,3877

KY Area Development District Consolidated Measurement Report
January 2015—December 2015
Kentucky River
HMOPPO
National Averages
Medicaid2 31Score 4Bench.
Kentucky
AverageB/W(99% CI)
5Kentucky River5
Pediatric Care Management
Adolesc. Immunization Denominator 681 14,3877
=666All Recommended 65% 68%(60% - 69%) 74%65% 73%
Well-Child Visits 0-15 m.o. 700 15,9977
▼666At Least 6 Visits 46% 65%(41% - 51%) 78%77% 59%
Well-Child Visits 3-6 y.o. 3,175 80,2437
▼666At Least 1 Visit 62% 73%(60% - 64%) 76%72% 71%
This is a 99% Confidence Interval constructed around the ADD's combined score for the measure. It shows the precision of the score, which is based on the size of the denominator and the score itself.
Symbols represent higher ("▲"), lower ("▼"), or equal ("=") performance compared to the average, benchmark, or your previous year, using 95% Confidence Intervals. A symbol's color represents better (" ") or worse (" ")
performance relative to the average, benchmark, or your previous year. Note that no comparison to 2013 rates is available for Chlamydia Screening, as guidelines changed for 2014 measurement.
The total average across the measure's aggregate denominator (i.e., eligible patients or events) for the state.
The average rate for the top-ranked eligible (n > 4) providers, whose combined patients account for 10% of the total population from eligible providers. "N/A" means that data are not available for comparison.
National averages are from NCQA's report, "The State of health Care Quality 2016," available at www.ncqa.org. PPO and HMO national averages are from commercial health plans.
These measures only include patients who received the listed test and whose most recent lab values are present in health plan data. This differs from HEDIS specifications.
Data are suppressed when the total denominator for the ADD is less than 250.
This measure has been changed from previous years to reflect the percentage of patients who received all three diabetes tests - Eye Exam (Retinal), HbA1c Testing, and Nephropathy Monitoring.
1
2
3
4
5
6
7
*
KHC website: www.KHCollaborative.org Public reporting: www.GoHealthShare.com
▲ ▼

KY Area Development District Consolidated Measurement Report
January 2015—December 2015
KIPDA
The Kentuckiana Health Collaborative is pleased to announce the release of the 2016 Consolidated Measurement Report. Private reports were sent to health care providers in Kentucky
and group practices in Kentuckiana to provide feedback on the quality of care their patients received on select measures. For this report, the quality of care data were aggregated across
providers at the Area Development District and state level. Anthem, Humana, Passport Health, and WellCare Health Plan of Kentucky provided claims data for this report.
HMOPPO
National Averages
Medicaid2 31Score 4Bench.
Kentucky
AverageB/W(99% CI)
5KIPDA5
Preventive Care Management
Breast Cancer Screening Denominator 26,354 80,4097
=666Mammogram Performed 79% 75% 97%(79% - 80%) 73%70% 59%
Cervical Cancer Screening Denominator 53,482 182,0687
=666Pap Test Performed 71% 64% 98%(71% - 72%) 75%72% 56%
Chlamydia Screening Denominator 10,511 37,7207
=666Screening Performed 56% 49% 83%(55% - 57%) 47%43% 55%
Colorectal Cancer Screening Denominator 61,257 191,8077
=666Appropriate Screening 56% 52% 82%(56% - 57%) 63%57% -
Acute Care Management
Low Back Pain Denominator 4,504 20,3097
=666Appropriate Use of Imaging Study 66% 67% 93%(65% - 68%) 75%75% 74%
Adults with Acute Bronchitis Denominator 2,753 13,4757
=666No Antibiotic Rx 20% 18% 52%(19% - 22%) 28%26% 28%
Chronic Disease Care Management
Diabetes Denominator 24,108 90,8837
=666HbA1c Tested 93% 92% 100%(93% - 93%) 90%89% 86%
=666 HbA1c Control (Tested < 8%) 75% 73% 94%(74% - 77%) 55%47% 46%
=666 HbA1c Poor Control (Tested > 9%) 12% 14% N/A(11% - 13%) 34%44% 45%
=666Nephropathy Monitored 90% 89% 100%(89% - 90%) 90%87% 90%
=666Eye Exam (Retinal) Performed 49% 45% 68%(48% - 50%) 54%47% 53%
=666Diabetes Composite - All Tests Performed* 44% 40% 63%(43% - 44%) -- -
Asthma Controller Medication Ratio Denom. 3,374 10,6217
=666Controller Medication Ratio 75% 72% 100%(73% - 77%) 78%78% 49%
Asthma Medication Management Denominator 2,776 8,8727

KY Area Development District Consolidated Measurement Report
January 2015—December 2015
KIPDA
HMOPPO
National Averages
Medicaid2 31Score 4Bench.
Kentucky
AverageB/W(99% CI)
5KIPDA5
Chronic Disease Care Management
Asthma Medication Management Denominator 2,776 8,8727
=666Med. Management (on Controller >50%) 62% 65% 92%(60% - 65%) -- -
=666Med. Management (on Controller >75%) 49% 45% 78%(47% - 51%) 46%49% 33%
COPD Denominator 2,034 7,2557
=666Use of Spirometry Testing 41% 38% 77%(38% - 44%) 43%41% 31%
AMI Denominator 363 1,4457
=666Persistence of Beta-Blocker Tx after AMI 85% 86% 100%(80% - 89%) 85%82% 81%
Antidepressant Medication Denominator 4,790 19,4277
=666Effective Acute Phase Treatment 63% 60% 86%(61% - 65%) 66%67% 55%
=666Effective Continuation Phase Treatment 47% 45% 74%(45% - 49%) 50%51% 40%
Pediatric Care Management
Pediatric Pharyngitis Denominator 5,209 23,1337
=666Group A Strep. Test 85% 76% 100%(84% - 86%) 83%81% 71%
Pediatric URI Denominator 5,349 26,9687
▲666No Antibiotic Rx 80% 67% 98%(78% - 81%) 88%87% 88%
Childhood Immunization Denominator 6,106 18,2647
=666DTaP 65% 60%(63% - 67%) 86%78% 76%
=666Influenza 43% 35%(41% - 44%) 65%61% 46%
=666Polio 76% 70%(75% - 78%) 91%83% 88%
=666MMR 90% 85%(89% - 91%) 93%90% 89%
=666HiB (H Influenza Type B) 81% 74%(80% - 83%) 92%85% 88%
=666Hepatitis B 56% 51%(54% - 58%) 87%75% 88%
=666Chicken Pox 91% 85%(90% - 92%) 92%89% 89%
=666PCV (Pneumococcal conjugate) 66% 60%(65% - 68%) 86%78% 77%
=666Hepatitis A 74% 66%(72% - 75%) 86%83% 84%
=666Rotavirus 60% 54%(59% - 62%) 80%73% 68%
Adolesc. Immunization Denominator 4,255 14,3877

KY Area Development District Consolidated Measurement Report
January 2015—December 2015
KIPDA
HMOPPO
National Averages
Medicaid2 31Score 4Bench.
Kentucky
AverageB/W(99% CI)
5KIPDA5
Pediatric Care Management
Adolesc. Immunization Denominator 4,255 14,3877
=666All Recommended 75% 68%(73% - 77%) 74%65% 73%
Well-Child Visits 0-15 m.o. 4,600 15,9977
=666At Least 6 Visits 72% 65%(71% - 74%) 78%77% 59%
Well-Child Visits 3-6 y.o. 24,509 80,2437
=666At Least 1 Visit 77% 73%(76% - 78%) 76%72% 71%
This is a 99% Confidence Interval constructed around the ADD's combined score for the measure. It shows the precision of the score, which is based on the size of the denominator and the score itself.
Symbols represent higher ("▲"), lower ("▼"), or equal ("=") performance compared to the average, benchmark, or your previous year, using 95% Confidence Intervals. A symbol's color represents better (" ") or worse (" ")
performance relative to the average, benchmark, or your previous year. Note that no comparison to 2013 rates is available for Chlamydia Screening, as guidelines changed for 2014 measurement.
The total average across the measure's aggregate denominator (i.e., eligible patients or events) for the state.
The average rate for the top-ranked eligible (n > 4) providers, whose combined patients account for 10% of the total population from eligible providers. "N/A" means that data are not available for comparison.
National averages are from NCQA's report, "The State of health Care Quality 2016," available at www.ncqa.org. PPO and HMO national averages are from commercial health plans.
These measures only include patients who received the listed test and whose most recent lab values are present in health plan data. This differs from HEDIS specifications.
Data are suppressed when the total denominator for the ADD is less than 250.
This measure has been changed from previous years to reflect the percentage of patients who received all three diabetes tests - Eye Exam (Retinal), HbA1c Testing, and Nephropathy Monitoring.
1
2
3
4
5
6
7
*
KHC website: www.KHCollaborative.org Public reporting: www.GoHealthShare.com
▲ ▼

KY Area Development District Consolidated Measurement Report
January 2015—December 2015
Lake Cumberland
The Kentuckiana Health Collaborative is pleased to announce the release of the 2016 Consolidated Measurement Report. Private reports were sent to health care providers in Kentucky
and group practices in Kentuckiana to provide feedback on the quality of care their patients received on select measures. For this report, the quality of care data were aggregated across
providers at the Area Development District and state level. Anthem, Humana, Passport Health, and WellCare Health Plan of Kentucky provided claims data for this report.
HMOPPO
National Averages
Medicaid2 31Score 4Bench.
Kentucky
AverageB/W(99% CI)
5Lake Cumberland5
Preventive Care Management
Breast Cancer Screening Denominator 3,394 80,4097
=666Mammogram Performed 72% 75% 97%(70% - 74%) 73%70% 59%
Cervical Cancer Screening Denominator 9,136 182,0687
=666Pap Test Performed 56% 64% 98%(55% - 58%) 75%72% 56%
Chlamydia Screening Denominator 1,859 37,7207
=666Screening Performed 48% 49% 83%(45% - 51%) 47%43% 55%
Colorectal Cancer Screening Denominator 8,020 191,8077
=666Appropriate Screening 45% 52% 82%(43% - 46%) 63%57% -
Acute Care Management
Low Back Pain Denominator 1,088 20,3097
=666Appropriate Use of Imaging Study 68% 67% 93%(65% - 72%) 75%75% 74%
Adults with Acute Bronchitis Denominator 739 13,4757
=666No Antibiotic Rx 17% 18% 52%(13% - 20%) 28%26% 28%
Chronic Disease Care Management
Diabetes Denominator 4,313 90,8837
=666HbA1c Tested 90% 92% 100%(89% - 91%) 90%89% 86%
=666 HbA1c Control (Tested < 8%) 70% 73% 94%(66% - 73%) 55%47% 46%
=666 HbA1c Poor Control (Tested > 9%) 16% 14% N/A(13% - 19%) 34%44% 45%
=666Nephropathy Monitored 86% 89% 100%(85% - 87%) 90%87% 90%
=666Eye Exam (Retinal) Performed 42% 45% 68%(40% - 44%) 54%47% 53%
=666Diabetes Composite - All Tests Performed* 34% 40% 63%(33% - 36%) -- -
Asthma Controller Medication Ratio Denom. 559 10,6217
=666Controller Medication Ratio 70% 72% 100%(65% - 75%) 78%78% 49%
Asthma Medication Management Denominator 475 8,8727

KY Area Development District Consolidated Measurement Report
January 2015—December 2015
Lake Cumberland
HMOPPO
National Averages
Medicaid2 31Score 4Bench.
Kentucky
AverageB/W(99% CI)
5Lake Cumberland5
Chronic Disease Care Management
Asthma Medication Management Denominator 475 8,8727
=666Med. Management (on Controller >50%) 64% 65% 92%(58% - 69%) -- -
=666Med. Management (on Controller >75%) 43% 45% 78%(37% - 48%) 46%49% 33%
COPD Denominator 296 7,2557
=666Use of Spirometry Testing 29% 38% 77%(22% - 36%) 43%41% 31%
AMI Denominator n < 250 1,4457
-666Persistence of Beta-Blocker Tx after AMI - 86% 100%- 85%82% 81%
Antidepressant Medication Denominator 1,118 19,4277
=666Effective Acute Phase Treatment 55% 60% 86%(51% - 59%) 66%67% 55%
=666Effective Continuation Phase Treatment 39% 45% 74%(35% - 43%) 50%51% 40%
Pediatric Care Management
Pediatric Pharyngitis Denominator 1,279 23,1337
▼666Group A Strep. Test 66% 76% 100%(63% - 70%) 83%81% 71%
Pediatric URI Denominator 1,769 26,9687
▼666No Antibiotic Rx 56% 67% 98%(53% - 59%) 88%87% 88%
Childhood Immunization Denominator 864 18,2647
=666DTaP 51% 60%(46% - 55%) 86%78% 76%
▼666Influenza 21% 35%(18% - 25%) 65%61% 46%
=666Polio 67% 70%(62% - 71%) 91%83% 88%
▼666MMR 68% 85%(64% - 72%) 93%90% 89%
=666HiB (H Influenza Type B) 68% 74%(64% - 72%) 92%85% 88%
▼666Hepatitis B 35% 51%(31% - 40%) 87%75% 88%
▼666Chicken Pox 68% 85%(63% - 72%) 92%89% 89%
▼666PCV (Pneumococcal conjugate) 46% 60%(42% - 51%) 86%78% 77%
=666Hepatitis A 63% 66%(59% - 67%) 86%83% 84%
=666Rotavirus 52% 54%(47% - 56%) 80%73% 68%
Adolesc. Immunization Denominator 622 14,3877

KY Area Development District Consolidated Measurement Report
January 2015—December 2015
Lake Cumberland
HMOPPO
National Averages
Medicaid2 31Score 4Bench.
Kentucky
AverageB/W(99% CI)
5Lake Cumberland5
Pediatric Care Management
Adolesc. Immunization Denominator 622 14,3877
▼666All Recommended 58% 68%(53% - 63%) 74%65% 73%
Well-Child Visits 0-15 m.o. 815 15,9977
=666At Least 6 Visits 56% 65%(52% - 61%) 78%77% 59%
Well-Child Visits 3-6 y.o. 3,857 80,2437
▼666At Least 1 Visit 61% 73%(58% - 63%) 76%72% 71%
This is a 99% Confidence Interval constructed around the ADD's combined score for the measure. It shows the precision of the score, which is based on the size of the denominator and the score itself.
Symbols represent higher ("▲"), lower ("▼"), or equal ("=") performance compared to the average, benchmark, or your previous year, using 95% Confidence Intervals. A symbol's color represents better (" ") or worse (" ")
performance relative to the average, benchmark, or your previous year. Note that no comparison to 2013 rates is available for Chlamydia Screening, as guidelines changed for 2014 measurement.
The total average across the measure's aggregate denominator (i.e., eligible patients or events) for the state.
The average rate for the top-ranked eligible (n > 4) providers, whose combined patients account for 10% of the total population from eligible providers. "N/A" means that data are not available for comparison.
National averages are from NCQA's report, "The State of health Care Quality 2016," available at www.ncqa.org. PPO and HMO national averages are from commercial health plans.
These measures only include patients who received the listed test and whose most recent lab values are present in health plan data. This differs from HEDIS specifications.
Data are suppressed when the total denominator for the ADD is less than 250.
This measure has been changed from previous years to reflect the percentage of patients who received all three diabetes tests - Eye Exam (Retinal), HbA1c Testing, and Nephropathy Monitoring.
1
2
3
4
5
6
7
*
KHC website: www.KHCollaborative.org Public reporting: www.GoHealthShare.com
▲ ▼

KY Area Development District Consolidated Measurement Report
January 2015—December 2015
Lincoln Trail
The Kentuckiana Health Collaborative is pleased to announce the release of the 2016 Consolidated Measurement Report. Private reports were sent to health care providers in Kentucky
and group practices in Kentuckiana to provide feedback on the quality of care their patients received on select measures. For this report, the quality of care data were aggregated across
providers at the Area Development District and state level. Anthem, Humana, Passport Health, and WellCare Health Plan of Kentucky provided claims data for this report.
HMOPPO
National Averages
Medicaid2 31Score 4Bench.
Kentucky
AverageB/W(99% CI)
5Lincoln Trail5
Preventive Care Management
Breast Cancer Screening Denominator 4,148 80,4097
=666Mammogram Performed 72% 75% 97%(70% - 74%) 73%70% 59%
Cervical Cancer Screening Denominator 11,135 182,0687
=666Pap Test Performed 65% 64% 98%(64% - 66%) 75%72% 56%
Chlamydia Screening Denominator 2,622 37,7207
=666Screening Performed 50% 49% 83%(47% - 52%) 47%43% 55%
Colorectal Cancer Screening Denominator 10,065 191,8077
=666Appropriate Screening 48% 52% 82%(47% - 49%) 63%57% -
Acute Care Management
Low Back Pain Denominator 1,175 20,3097
=666Appropriate Use of Imaging Study 66% 67% 93%(62% - 69%) 75%75% 74%
Adults with Acute Bronchitis Denominator 1,009 13,4757
=666No Antibiotic Rx 13% 18% 52%(10% - 16%) 28%26% 28%
Chronic Disease Care Management
Diabetes Denominator 4,595 90,8837
=666HbA1c Tested 91% 92% 100%(90% - 92%) 90%89% 86%
=666 HbA1c Control (Tested < 8%) 71% 73% 94%(68% - 75%) 55%47% 46%
=666 HbA1c Poor Control (Tested > 9%) 14% 14% N/A(11% - 17%) 34%44% 45%
=666Nephropathy Monitored 88% 89% 100%(86% - 89%) 90%87% 90%
=666Eye Exam (Retinal) Performed 42% 45% 68%(40% - 44%) 54%47% 53%
=666Diabetes Composite - All Tests Performed* 36% 40% 63%(34% - 38%) -- -
Asthma Controller Medication Ratio Denom. 748 10,6217
=666Controller Medication Ratio 74% 72% 100%(69% - 77%) 78%78% 49%
Asthma Medication Management Denominator 585 8,8727

KY Area Development District Consolidated Measurement Report
January 2015—December 2015
Lincoln Trail
HMOPPO
National Averages
Medicaid2 31Score 4Bench.
Kentucky
AverageB/W(99% CI)
5Lincoln Trail5
Chronic Disease Care Management
Asthma Medication Management Denominator 585 8,8727
=666Med. Management (on Controller >50%) 59% 65% 92%(53% - 64%) -- -
=666Med. Management (on Controller >75%) 47% 45% 78%(41% - 52%) 46%49% 33%
COPD Denominator 407 7,2557
=666Use of Spirometry Testing 34% 38% 77%(29% - 41%) 43%41% 31%
AMI Denominator n < 250 1,4457
-666Persistence of Beta-Blocker Tx after AMI - 86% 100%- 85%82% 81%
Antidepressant Medication Denominator 1,163 19,4277
=666Effective Acute Phase Treatment 60% 60% 86%(56% - 64%) 66%67% 55%
=666Effective Continuation Phase Treatment 45% 45% 74%(41% - 48%) 50%51% 40%
Pediatric Care Management
Pediatric Pharyngitis Denominator 2,118 23,1337
=666Group A Strep. Test 84% 76% 100%(82% - 86%) 83%81% 71%
Pediatric URI Denominator 1,307 26,9687
=666No Antibiotic Rx 75% 67% 98%(71% - 77%) 88%87% 88%
Childhood Immunization Denominator 1,389 18,2647
▲666DTaP 73% 60%(70% - 76%) 86%78% 76%
▲666Influenza 45% 35%(42% - 48%) 65%61% 46%
=666Polio 79% 70%(76% - 82%) 91%83% 88%
=666MMR 91% 85%(89% - 93%) 93%90% 89%
▲666HiB (H Influenza Type B) 85% 74%(82% - 87%) 92%85% 88%
▲666Hepatitis B 68% 51%(65% - 71%) 87%75% 88%
=666Chicken Pox 91% 85%(88% - 92%) 92%89% 89%
▲666PCV (Pneumococcal conjugate) 75% 60%(72% - 78%) 86%78% 77%
▲666Hepatitis A 77% 66%(74% - 80%) 86%83% 84%
▲666Rotavirus 69% 54%(66% - 72%) 80%73% 68%
Adolesc. Immunization Denominator 1,116 14,3877

KY Area Development District Consolidated Measurement Report
January 2015—December 2015
Lincoln Trail
HMOPPO
National Averages
Medicaid2 31Score 4Bench.
Kentucky
AverageB/W(99% CI)
5Lincoln Trail5
Pediatric Care Management
Adolesc. Immunization Denominator 1,116 14,3877
=666All Recommended 71% 68%(67% - 74%) 74%65% 73%
Well-Child Visits 0-15 m.o. 1,018 15,9977
▲666At Least 6 Visits 75% 65%(71% - 78%) 78%77% 59%
Well-Child Visits 3-6 y.o. 6,098 80,2437
=666At Least 1 Visit 77% 73%(75% - 78%) 76%72% 71%
This is a 99% Confidence Interval constructed around the ADD's combined score for the measure. It shows the precision of the score, which is based on the size of the denominator and the score itself.
Symbols represent higher ("▲"), lower ("▼"), or equal ("=") performance compared to the average, benchmark, or your previous year, using 95% Confidence Intervals. A symbol's color represents better (" ") or worse (" ")
performance relative to the average, benchmark, or your previous year. Note that no comparison to 2013 rates is available for Chlamydia Screening, as guidelines changed for 2014 measurement.
The total average across the measure's aggregate denominator (i.e., eligible patients or events) for the state.
The average rate for the top-ranked eligible (n > 4) providers, whose combined patients account for 10% of the total population from eligible providers. "N/A" means that data are not available for comparison.
National averages are from NCQA's report, "The State of health Care Quality 2016," available at www.ncqa.org. PPO and HMO national averages are from commercial health plans.
These measures only include patients who received the listed test and whose most recent lab values are present in health plan data. This differs from HEDIS specifications.
Data are suppressed when the total denominator for the ADD is less than 250.
This measure has been changed from previous years to reflect the percentage of patients who received all three diabetes tests - Eye Exam (Retinal), HbA1c Testing, and Nephropathy Monitoring.
1
2
3
4
5
6
7
*
KHC website: www.KHCollaborative.org Public reporting: www.GoHealthShare.com
▲ ▼

KY Area Development District Consolidated Measurement Report
January 2015—December 2015
Northern Kentucky
The Kentuckiana Health Collaborative is pleased to announce the release of the 2016 Consolidated Measurement Report. Private reports were sent to health care providers in Kentucky
and group practices in Kentuckiana to provide feedback on the quality of care their patients received on select measures. For this report, the quality of care data were aggregated across
providers at the Area Development District and state level. Anthem, Humana, Passport Health, and WellCare Health Plan of Kentucky provided claims data for this report.
HMOPPO
National Averages
Medicaid2 31Score 4Bench.
Kentucky
AverageB/W(99% CI)
5Northern Kentucky5
Preventive Care Management
Breast Cancer Screening Denominator 6,400 80,4097
=666Mammogram Performed 71% 75% 97%(70% - 73%) 73%70% 59%
Cervical Cancer Screening Denominator 13,317 182,0687
=666Pap Test Performed 64% 64% 98%(63% - 65%) 75%72% 56%
Chlamydia Screening Denominator 2,638 37,7207
=666Screening Performed 55% 49% 83%(53% - 58%) 47%43% 55%
Colorectal Cancer Screening Denominator 15,902 191,8077
=666Appropriate Screening 50% 52% 82%(49% - 51%) 63%57% -
Acute Care Management
Low Back Pain Denominator 1,573 20,3097
=666Appropriate Use of Imaging Study 69% 67% 93%(66% - 72%) 75%75% 74%
Adults with Acute Bronchitis Denominator 895 13,4757
=666No Antibiotic Rx 18% 18% 52%(15% - 22%) 28%26% 28%
Chronic Disease Care Management
Diabetes Denominator 7,409 90,8837
=666HbA1c Tested 94% 92% 100%(94% - 95%) 90%89% 86%
=666 HbA1c Control (Tested < 8%) 78% 73% 94%(76% - 79%) 55%47% 46%
=666 HbA1c Poor Control (Tested > 9%) 11% 14% N/A(10% - 13%) 34%44% 45%
=666Nephropathy Monitored 94% 89% 100%(93% - 94%) 90%87% 90%
=666Eye Exam (Retinal) Performed 49% 45% 68%(47% - 50%) 54%47% 53%
=666Diabetes Composite - All Tests Performed* 45% 40% 63%(44% - 47%) -- -
Asthma Controller Medication Ratio Denom. 593 10,6217
=666Controller Medication Ratio 67% 72% 100%(62% - 72%) 78%78% 49%
Asthma Medication Management Denominator 475 8,8727

KY Area Development District Consolidated Measurement Report
January 2015—December 2015
Northern Kentucky
HMOPPO
National Averages
Medicaid2 31Score 4Bench.
Kentucky
AverageB/W(99% CI)
5Northern Kentucky5
Chronic Disease Care Management
Asthma Medication Management Denominator 475 8,8727
=666Med. Management (on Controller >50%) 65% 65% 92%(60% - 71%) -- -
=666Med. Management (on Controller >75%) 45% 45% 78%(40% - 51%) 46%49% 33%
COPD Denominator 525 7,2557
▼666Use of Spirometry Testing 28% 38% 77%(23% - 33%) 43%41% 31%
AMI Denominator n < 250 1,4457
-666Persistence of Beta-Blocker Tx after AMI - 86% 100%- 85%82% 81%
Antidepressant Medication Denominator 1,853 19,4277
=666Effective Continuation Phase Treatment 47% 45% 74%(44% - 50%) 50%51% 40%
=666Effective Acute Phase Treatment 62% 60% 86%(59% - 65%) 66%67% 55%
Pediatric Care Management
Pediatric Pharyngitis Denominator 1,313 23,1337
=666Group A Strep. Test 84% 76% 100%(81% - 86%) 83%81% 71%
Pediatric URI Denominator 1,318 26,9687
▲666No Antibiotic Rx 86% 67% 98%(83% - 88%) 88%87% 88%
Childhood Immunization Denominator 1,265 18,2647
=666DTaP 59% 60%(56% - 63%) 86%78% 76%
=666Influenza 40% 35%(37% - 44%) 65%61% 46%
=666Polio 69% 70%(66% - 73%) 91%83% 88%
=666MMR 88% 85%(86% - 90%) 93%90% 89%
=666HiB (H Influenza Type B) 75% 74%(72% - 78%) 92%85% 88%
▼666Hepatitis B 11% 51%(9% - 14%) 87%75% 88%
=666Chicken Pox 88% 85%(85% - 90%) 92%89% 89%
=666PCV (Pneumococcal conjugate) 59% 60%(55% - 62%) 86%78% 77%
=666Hepatitis A 62% 66%(59% - 66%) 86%83% 84%
=666Rotavirus 57% 54%(54% - 61%) 80%73% 68%
Adolesc. Immunization Denominator 1,127 14,3877

KY Area Development District Consolidated Measurement Report
January 2015—December 2015
Northern Kentucky
HMOPPO
National Averages
Medicaid2 31Score 4Bench.
Kentucky
AverageB/W(99% CI)
5Northern Kentucky5
Pediatric Care Management
Adolesc. Immunization Denominator 1,127 14,3877
=666All Recommended 73% 68%(69% - 76%) 74%65% 73%
Well-Child Visits 0-15 m.o. 1,333 15,9977
=666At Least 6 Visits 66% 65%(63% - 70%) 78%77% 59%
Well-Child Visits 3-6 y.o. 6,292 80,2437
=666At Least 1 Visit 80% 73%(79% - 82%) 76%72% 71%
This is a 99% Confidence Interval constructed around the ADD's combined score for the measure. It shows the precision of the score, which is based on the size of the denominator and the score itself.
Symbols represent higher ("▲"), lower ("▼"), or equal ("=") performance compared to the average, benchmark, or your previous year, using 95% Confidence Intervals. A symbol's color represents better (" ") or worse (" ")
performance relative to the average, benchmark, or your previous year. Note that no comparison to 2013 rates is available for Chlamydia Screening, as guidelines changed for 2014 measurement.
The total average across the measure's aggregate denominator (i.e., eligible patients or events) for the state.
The average rate for the top-ranked eligible (n > 4) providers, whose combined patients account for 10% of the total population from eligible providers. "N/A" means that data are not available for comparison.
National averages are from NCQA's report, "The State of health Care Quality 2016," available at www.ncqa.org. PPO and HMO national averages are from commercial health plans.
These measures only include patients who received the listed test and whose most recent lab values are present in health plan data. This differs from HEDIS specifications.
Data are suppressed when the total denominator for the ADD is less than 250.
This measure has been changed from previous years to reflect the percentage of patients who received all three diabetes tests - Eye Exam (Retinal), HbA1c Testing, and Nephropathy Monitoring.
1
2
3
4
5
6
7
*
KHC website: www.KHCollaborative.org Public reporting: www.GoHealthShare.com
▲ ▼

KY Area Development District Consolidated Measurement Report
January 2015—December 2015
Pennyrile
The Kentuckiana Health Collaborative is pleased to announce the release of the 2016 Consolidated Measurement Report. Private reports were sent to health care providers in Kentucky
and group practices in Kentuckiana to provide feedback on the quality of care their patients received on select measures. For this report, the quality of care data were aggregated across
providers at the Area Development District and state level. Anthem, Humana, Passport Health, and WellCare Health Plan of Kentucky provided claims data for this report.
HMOPPO
National Averages
Medicaid2 31Score 4Bench.
Kentucky
AverageB/W(99% CI)
5Pennyrile5
Preventive Care Management
Breast Cancer Screening Denominator 2,659 80,4097
=666Mammogram Performed 78% 75% 97%(76% - 80%) 73%70% 59%
Cervical Cancer Screening Denominator 5,981 182,0687
=666Pap Test Performed 55% 64% 98%(54% - 57%) 75%72% 56%
Chlamydia Screening Denominator 1,289 37,7207
=666Screening Performed 41% 49% 83%(37% - 45%) 47%43% 55%
Colorectal Cancer Screening Denominator 6,183 191,8077
=666Appropriate Screening 53% 52% 82%(52% - 55%) 63%57% -
Acute Care Management
Low Back Pain Denominator 950 20,3097
=666Appropriate Use of Imaging Study 72% 67% 93%(68% - 75%) 75%75% 74%
Adults with Acute Bronchitis Denominator 721 13,4757
=666No Antibiotic Rx 12% 18% 52%(10% - 16%) 28%26% 28%
Chronic Disease Care Management
Diabetes Denominator 3,269 90,8837
=666HbA1c Tested 91% 92% 100%(90% - 92%) 90%89% 86%
=666 HbA1c Control (Tested < 8%) 74% 73% 94%(69% - 78%) 55%47% 46%
=666 HbA1c Poor Control (Tested > 9%) 13% 14% N/A(10% - 16%) 34%44% 45%
=666Nephropathy Monitored 88% 89% 100%(87% - 89%) 90%87% 90%
=666Eye Exam (Retinal) Performed 42% 45% 68%(39% - 44%) 54%47% 53%
=666Diabetes Composite - All Tests Performed* 36% 40% 63%(34% - 38%) -- -
Asthma Controller Medication Ratio Denom. 307 10,6217
=666Controller Medication Ratio 66% 72% 100%(59% - 72%) 78%78% 49%
Asthma Medication Management Denominator n < 250 8,8727

KY Area Development District Consolidated Measurement Report
January 2015—December 2015
Pennyrile
HMOPPO
National Averages
Medicaid2 31Score 4Bench.
Kentucky
AverageB/W(99% CI)
5Pennyrile5
Chronic Disease Care Management
Asthma Medication Management Denominator n < 250 8,8727
-666Med. Management (on Controller >50%) - 65% 92%- -- -
-666Med. Management (on Controller >75%) - 45% 78%- 46%49% 33%
COPD Denominator n < 250 7,2557
-666Use of Spirometry Testing - 38% 77%- 43%41% 31%
AMI Denominator n < 250 1,4457
-666Persistence of Beta-Blocker Tx after AMI - 86% 100%- 85%82% 81%
Antidepressant Medication Denominator 656 19,4277
=666Effective Acute Phase Treatment 60% 60% 86%(55% - 65%) 66%67% 55%
=666Effective Continuation Phase Treatment 45% 45% 74%(40% - 50%) 50%51% 40%
Pediatric Care Management
Pediatric Pharyngitis Denominator 796 23,1337
▼666Group A Strep. Test 44% 76% 100%(39% - 48%) 83%81% 71%
Pediatric URI Denominator 1,250 26,9687
▼666No Antibiotic Rx 52% 67% 98%(49% - 56%) 88%87% 88%
Childhood Immunization Denominator 421 18,2647
=666DTaP 55% 60%(49% - 61%) 86%78% 76%
▼666Influenza 25% 35%(20% - 31%) 65%61% 46%
=666Polio 63% 70%(57% - 69%) 91%83% 88%
=666MMR 82% 85%(77% - 86%) 93%90% 89%
=666HiB (H Influenza Type B) 67% 74%(61% - 73%) 92%85% 88%
=666Hepatitis B 58% 51%(51% - 64%) 87%75% 88%
=666Chicken Pox 81% 85%(76% - 85%) 92%89% 89%
=666PCV (Pneumococcal conjugate) 55% 60%(49% - 61%) 86%78% 77%
=666Hepatitis A 75% 66%(70% - 80%) 86%83% 84%
=666Rotavirus 49% 54%(43% - 55%) 80%73% 68%
Adolesc. Immunization Denominator 396 14,3877

KY Area Development District Consolidated Measurement Report
January 2015—December 2015
Pennyrile
HMOPPO
National Averages
Medicaid2 31Score 4Bench.
Kentucky
AverageB/W(99% CI)
5Pennyrile5
Pediatric Care Management
Adolesc. Immunization Denominator 396 14,3877
=666All Recommended 68% 68%(62% - 74%) 74%65% 73%
Well-Child Visits 0-15 m.o. 472 15,9977
▼666At Least 6 Visits 55% 65%(49% - 60%) 78%77% 59%
Well-Child Visits 3-6 y.o. 2,093 80,2437
▼666At Least 1 Visit 61% 73%(58% - 64%) 76%72% 71%
This is a 99% Confidence Interval constructed around the ADD's combined score for the measure. It shows the precision of the score, which is based on the size of the denominator and the score itself.
Symbols represent higher ("▲"), lower ("▼"), or equal ("=") performance compared to the average, benchmark, or your previous year, using 95% Confidence Intervals. A symbol's color represents better (" ") or worse (" ")
performance relative to the average, benchmark, or your previous year. Note that no comparison to 2013 rates is available for Chlamydia Screening, as guidelines changed for 2014 measurement.
The total average across the measure's aggregate denominator (i.e., eligible patients or events) for the state.
The average rate for the top-ranked eligible (n > 4) providers, whose combined patients account for 10% of the total population from eligible providers. "N/A" means that data are not available for comparison.
National averages are from NCQA's report, "The State of health Care Quality 2016," available at www.ncqa.org. PPO and HMO national averages are from commercial health plans.
These measures only include patients who received the listed test and whose most recent lab values are present in health plan data. This differs from HEDIS specifications.
Data are suppressed when the total denominator for the ADD is less than 250.
This measure has been changed from previous years to reflect the percentage of patients who received all three diabetes tests - Eye Exam (Retinal), HbA1c Testing, and Nephropathy Monitoring.
1
2
3
4
5
6
7
*
KHC website: www.KHCollaborative.org Public reporting: www.GoHealthShare.com
▲ ▼

KY Area Development District Consolidated Measurement Report
January 2015—December 2015
Purchase
The Kentuckiana Health Collaborative is pleased to announce the release of the 2016 Consolidated Measurement Report. Private reports were sent to health care providers in Kentucky
and group practices in Kentuckiana to provide feedback on the quality of care their patients received on select measures. For this report, the quality of care data were aggregated across
providers at the Area Development District and state level. Anthem, Humana, Passport Health, and WellCare Health Plan of Kentucky provided claims data for this report.
HMOPPO
National Averages
Medicaid2 31Score 4Bench.
Kentucky
AverageB/W(99% CI)
5Purchase5
Preventive Care Management
Breast Cancer Screening Denominator 3,515 80,4097
=666Mammogram Performed 81% 75% 97%(79% - 82%) 73%70% 59%
Cervical Cancer Screening Denominator 7,140 182,0687
=666Pap Test Performed 72% 64% 98%(70% - 73%) 75%72% 56%
Chlamydia Screening Denominator 1,494 37,7207
=666Screening Performed 47% 49% 83%(43% - 50%) 47%43% 55%
Colorectal Cancer Screening Denominator 7,735 191,8077
=666Appropriate Screening 61% 52% 82%(60% - 63%) 63%57% -
Acute Care Management
Low Back Pain Denominator 869 20,3097
=666Appropriate Use of Imaging Study 66% 67% 93%(62% - 70%) 75%75% 74%
Adults with Acute Bronchitis Denominator 463 13,4757
=666No Antibiotic Rx 22% 18% 52%(17% - 27%) 28%26% 28%
Chronic Disease Care Management
Diabetes Denominator 3,111 90,8837
=666HbA1c Tested 91% 92% 100%(90% - 93%) 90%89% 86%
=666 HbA1c Control (Tested < 8%) 79% 73% 94%(75% - 83%) 55%47% 46%
=666 HbA1c Poor Control (Tested > 9%) 10% 14% N/A(8% - 13%) 34%44% 45%
=666Nephropathy Monitored 88% 89% 100%(86% - 89%) 90%87% 90%
=666Eye Exam (Retinal) Performed 47% 45% 68%(45% - 50%) 54%47% 53%
=666Diabetes Composite - All Tests Performed* 41% 40% 63%(38% - 43%) -- -
Asthma Controller Medication Ratio Denom. n < 250 10,6217
-666Controller Medication Ratio - 72% 100%- 78%78% 49%
Asthma Medication Management Denominator n < 250 8,8727

KY Area Development District Consolidated Measurement Report
January 2015—December 2015
Purchase
HMOPPO
National Averages
Medicaid2 31Score 4Bench.
Kentucky
AverageB/W(99% CI)
5Purchase5
Chronic Disease Care Management
Asthma Medication Management Denominator n < 250 8,8727
-666Med. Management (on Controller >50%) - 65% 92%- -- -
-666Med. Management (on Controller >75%) - 45% 78%- 46%49% 33%
COPD Denominator 254 7,2557
=666Use of Spirometry Testing 38% 38% 77%(31% - 46%) 43%41% 31%
AMI Denominator n < 250 1,4457
-666Persistence of Beta-Blocker Tx after AMI - 86% 100%- 85%82% 81%
Antidepressant Medication Denominator 637 19,4277
=666Effective Continuation Phase Treatment 43% 45% 74%(38% - 48%) 50%51% 40%
=666Effective Acute Phase Treatment 59% 60% 86%(54% - 64%) 66%67% 55%
Pediatric Care Management
Pediatric Pharyngitis Denominator 484 23,1337
▼666Group A Strep. Test 57% 76% 100%(52% - 63%) 83%81% 71%
Pediatric URI Denominator 653 26,9687
▼666No Antibiotic Rx 50% 67% 98%(45% - 55%) 88%87% 88%
Childhood Immunization Denominator 275 18,2647
=666DTaP 63% 60%(55% - 70%) 86%78% 76%
▼666Influenza 16% 35%(11% - 22%) 65%61% 46%
=666Polio 72% 70%(64% - 78%) 91%83% 88%
=666MMR 86% 85%(80% - 91%) 93%90% 89%
=666HiB (H Influenza Type B) 71% 74%(63% - 77%) 92%85% 88%
▲666Hepatitis B 67% 51%(59% - 74%) 87%75% 88%
=666Chicken Pox 84% 85%(78% - 89%) 92%89% 89%
=666PCV (Pneumococcal conjugate) 63% 60%(55% - 70%) 86%78% 77%
=666Hepatitis A 59% 66%(52% - 67%) 86%83% 84%
=666Rotavirus 57% 54%(49% - 64%) 80%73% 68%
Adolesc. Immunization Denominator 281 14,3877

KY Area Development District Consolidated Measurement Report
January 2015—December 2015
Purchase
HMOPPO
National Averages
Medicaid2 31Score 4Bench.
Kentucky
AverageB/W(99% CI)
5Purchase5
Pediatric Care Management
Adolesc. Immunization Denominator 281 14,3877
=666All Recommended 69% 68%(61% - 75%) 74%65% 73%
Well-Child Visits 0-15 m.o. 269 15,9977
▼666At Least 6 Visits 51% 65%(43% - 59%) 78%77% 59%
Well-Child Visits 3-6 y.o. 1,433 80,2437
▼666At Least 1 Visit 62% 73%(58% - 65%) 76%72% 71%
This is a 99% Confidence Interval constructed around the ADD's combined score for the measure. It shows the precision of the score, which is based on the size of the denominator and the score itself.
Symbols represent higher ("▲"), lower ("▼"), or equal ("=") performance compared to the average, benchmark, or your previous year, using 95% Confidence Intervals. A symbol's color represents better (" ") or worse (" ")
performance relative to the average, benchmark, or your previous year. Note that no comparison to 2013 rates is available for Chlamydia Screening, as guidelines changed for 2014 measurement.
The total average across the measure's aggregate denominator (i.e., eligible patients or events) for the state.
The average rate for the top-ranked eligible (n > 4) providers, whose combined patients account for 10% of the total population from eligible providers. "N/A" means that data are not available for comparison.
National averages are from NCQA's report, "The State of health Care Quality 2016," available at www.ncqa.org. PPO and HMO national averages are from commercial health plans.
These measures only include patients who received the listed test and whose most recent lab values are present in health plan data. This differs from HEDIS specifications.
Data are suppressed when the total denominator for the ADD is less than 250.
This measure has been changed from previous years to reflect the percentage of patients who received all three diabetes tests - Eye Exam (Retinal), HbA1c Testing, and Nephropathy Monitoring.
1
2
3
4
5
6
7
*
KHC website: www.KHCollaborative.org Public reporting: www.GoHealthShare.com
▲ ▼