consolidated interim financial statements at 30 june...
TRANSCRIPT

YOOX NET-A-PORTER GROUP S.P.A.
VIA MORIMONDO 17 | 20143 MILAN
P.I./C.F. AND MILAN COMPANY REGISTER NO.: 02050461207 – R.E.A. NO.: MI-1656860
SHARE CAPITAL EURO 1,339,762.93
Consolidated interim financial statements at 30 June 2017

CONSOLIDATED INTERIM FINANCIAL STATEMENTS AS AT 30 JUNE 2017 | 1
CONSOLIDATED INTERIM FINANCIAL STATEMENTS AS AT 30 JUNE 2017

CONSOLIDATED INTERIM FINANCIAL STATEMENTS AS AT 30 JUNE 2017 | 2

CONSOLIDATED INTERIM FINANCIAL STATEMENTS AS AT 30 JUNE 2017 | 3
Contents MANAGEMENT AND CONTROL BODIES 5 DIRECTORS’ INTERIM REPORT 7 CONDENSED CONSOLIDATED INTERIM FINANCIAL STATEMENTS AS AT 30 JUNE 2017 YNAP GROUP 35 CERTIFICATION OF THE CONDENSED CONSOLIDATED INTERIM FINANCIAL STATEMENTS PURSUANT TO ARTICLE 81-TER OF CONSOB REGULATION 11971 OF 14 MAY 1999, AS AMENDED 97 INDEPENDENT AUDITORS’ REPORT ON THE LIMITED AUDIT OF THE CONDENSED CONSOLIDATED INTERIM FINANCIAL STATEMENTS 99

CONSOLIDATED INTERIM FINANCIAL STATEMENTS AS AT 30 JUNE 2017 | 4
CONSOLIDATED INTERIM FINANCIAL STATEMENTS AS AT 30 JUNE 2017 | 5
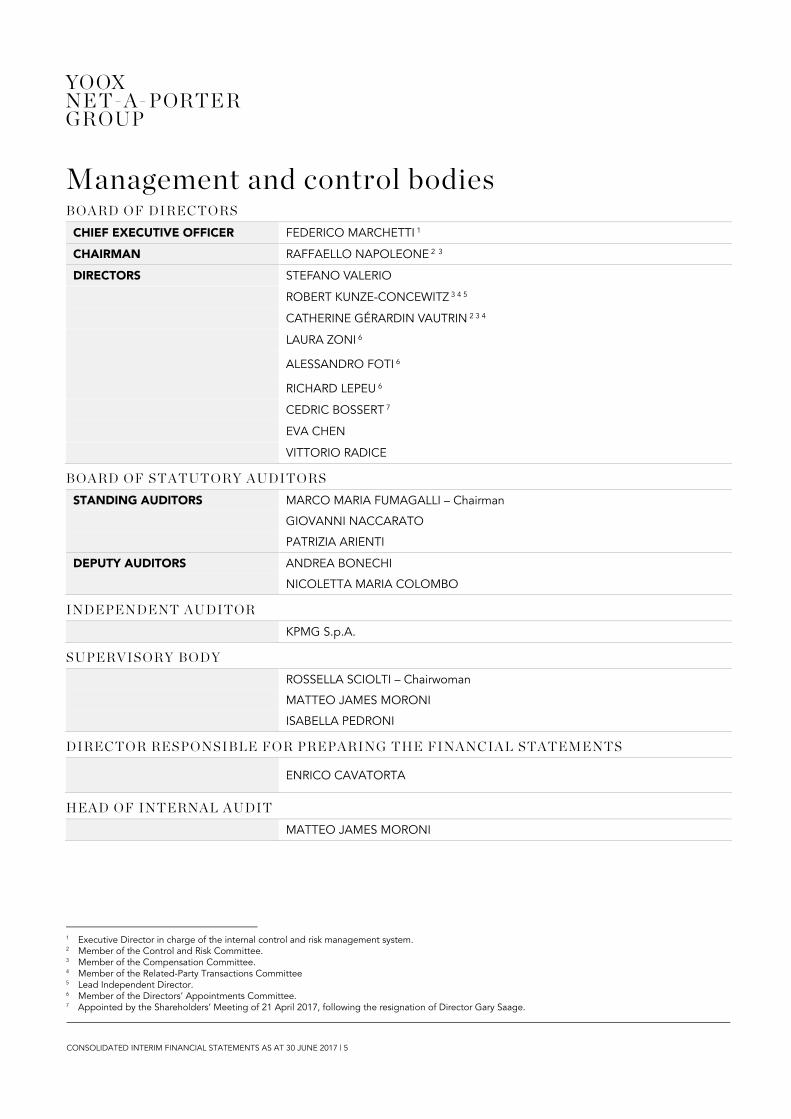
Management and control bodies
B O A R D O F D I R EC T O R S
CHIEF EXECUTIVE OFFICER FEDERICO MARCHETTI 1
CHAIRMAN RAFFAELLO NAPOLEONE 2 3
DIRECTORS STEFANO VALERIO
ROBERT KUNZE-CONCEWITZ 3 4 5
CATHERINE GÉRARDIN VAUTRIN 2 3 4
LAURA ZONI 6
ALESSANDRO FOTI 6
RICHARD LEPEU 6
CEDRIC BOSSERT 7
EVA CHEN
VITTORIO RADICE
B O A R D O F S T A TU T O R Y A U D I T O R S
STANDING AUDITORS MARCO MARIA FUMAGALLI – Chairman
GIOVANNI NACCARATO
PATRIZIA ARIENTI
DEPUTY AUDITORS ANDREA BONECHI
NICOLETTA MARIA COLOMBO
I ND E P E N D E NT A U D I T O R
KPMG S.p.A.
S UP ER VI S O R Y B O D Y
ROSSELLA SCIOLTI – Chairwoman
MATTEO JAMES MORONI
ISABELLA PEDRONI
D I R EC TO R R ES PO NS I B L E F O R PR E PA R I NG T HE F I NA N C I A L S TA T E ME NTS
ENRICO CAVATORTA
H EA D O F I N T ER NA L A U DI T
MATTEO JAMES MORONI
1 Executive Director in charge of the internal control and risk management system. 2 Member of the Control and Risk Committee. 3 Member of the Compensation Committee. 4 Member of the Related-Party Transactions Committee 5 Lead Independent Director. 6 Member of the Directors’ Appointments Committee. 7 Appointed by the Shareholders’ Meeting of 21 April 2017, following the resignation of Director Gary Saage.

CONSOLIDATED INTERIM FINANCIAL STATEMENTS AS AT 30 JUNE 2017 | 6

CONSOLIDATED INTERIM FINANCIAL STATEMENTS AS AT 30 JUNE 2017 | 7
DIRECTORS’ INTERIM REPORT

CONSOLIDATED INTERIM FINANCIAL STATEMENTS AS AT 30 JUNE 2017 | 8

CONSOLIDATED INTERIM FINANCIAL STATEMENTS AS AT 30 JUNE 2017 | 9
Contents INTRODUCTION 11
Multi-brand In-Season business line 11 Multi-brand Off-Season business line 11 ONLINE FLAGSHIP STORES business line 11
REVENUES AND PROFITABILITY 13 Methodological note 13 Accounting policies 14 Reclassified consolidated income statement 14 Analysis of net revenues by business line 17 Consolidated net revenues by geographical area 18
INVESTMENTS 19 ANALYSIS OF GROSS PROFIT BY BUSINESS LINE 20 FINANCIAL MANAGEMENT 21
Consolidated statement of financial position 21 Debt/Consolidated net financial position 22
INFORMATION FOR INVESTORS 23 YOOX NET-A-PORTER GROUP stock performance in the first half of 2017 23 YOOX NET-A-PORTER GROUP stock performance compared with the main indices of reference in the first half of 2017 25 Stock coverage 25 Shareholder structure 25 Investor Relations 26
INFORMATION CONCERNING MEASURES TO PROTECT PRIVACY 26 HUMAN RESOURCES 27 CORPORATE GOVERNANCE 27 SIGNIFICANT EVENTS AFTER THE END OF THE PERIOD 32 BUSINESS OUTLOOK 32 ANNEXES TO THE DIRECTORS’ REPORT 33

CONSOLIDATED INTERIM FINANCIAL STATEMENTS AS AT 30 JUNE 2017 | 10
CONSOLIDATED INTERIM FINANCIAL STATEMENTS AS AT 30 JUNE 2017 | 11
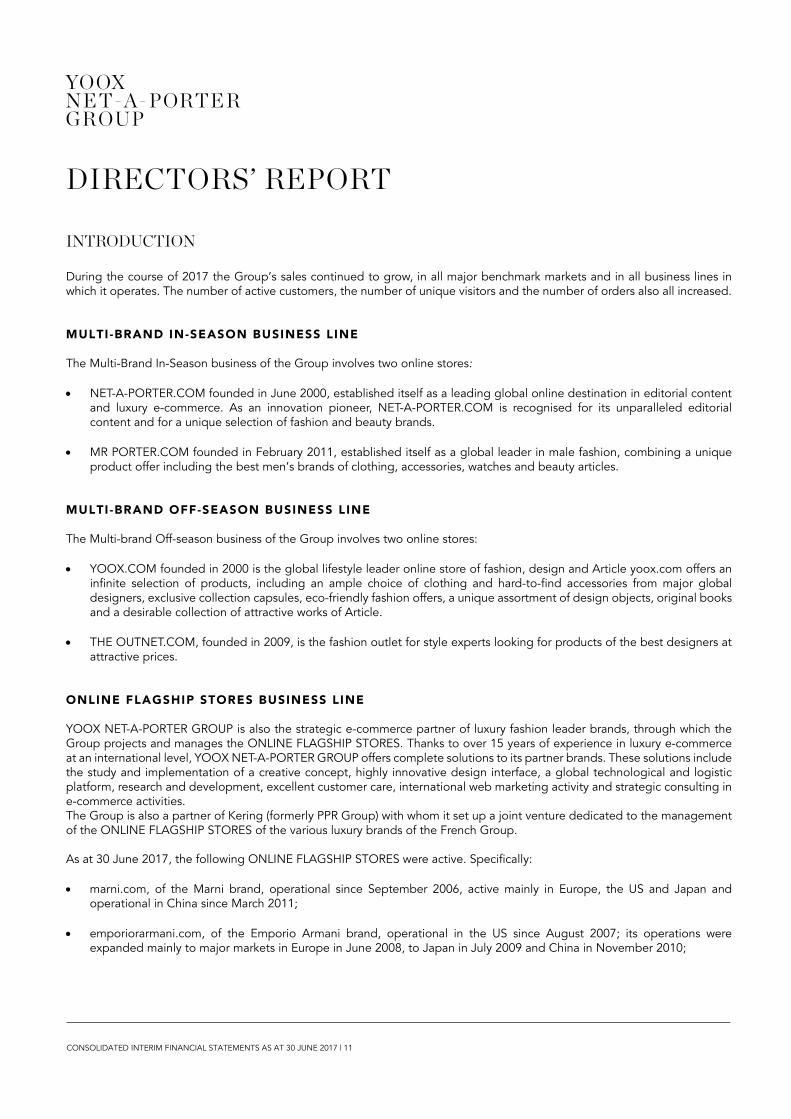
DIRECTORS’ REPORT INTRODUCTION During the course of 2017 the Group’s sales continued to grow, in all major benchmark markets and in all business lines in which it operates. The number of active customers, the number of unique visitors and the number of orders also all increased. MULTI -BRAND IN-SEASON BUSINESS LINE The Multi-Brand In-Season business of the Group involves two online stores:
NET-A-PORTER.COM founded in June 2000, established itself as a leading global online destination in editorial content and luxury e-commerce. As an innovation pioneer, NET-A-PORTER.COM is recognised for its unparalleled editorial content and for a unique selection of fashion and beauty brands.
MR PORTER.COM founded in February 2011, established itself as a global leader in male fashion, combining a unique product offer including the best men’s brands of clothing, accessories, watches and beauty articles.
MULTI -BRAND OFF-SEASON BUSINESS LINE The Multi-brand Off-season business of the Group involves two online stores:
YOOX.COM founded in 2000 is the global lifestyle leader online store of fashion, design and Article yoox.com offers an infinite selection of products, including an ample choice of clothing and hard-to-find accessories from major global designers, exclusive collection capsules, eco-friendly fashion offers, a unique assortment of design objects, original books and a desirable collection of attractive works of Article.
THE OUTNET.COM, founded in 2009, is the fashion outlet for style experts looking for products of the best designers at attractive prices.
ONLINE FLAGSHIP STORES BUSINESS LINE YOOX NET-A-PORTER GROUP is also the strategic e-commerce partner of luxury fashion leader brands, through which the Group projects and manages the ONLINE FLAGSHIP STORES. Thanks to over 15 years of experience in luxury e-commerce at an international level, YOOX NET-A-PORTER GROUP offers complete solutions to its partner brands. These solutions include the study and implementation of a creative concept, highly innovative design interface, a global technological and logistic platform, research and development, excellent customer care, international web marketing activity and strategic consulting in e-commerce activities. The Group is also a partner of Kering (formerly PPR Group) with whom it set up a joint venture dedicated to the management of the ONLINE FLAGSHIP STORES of the various luxury brands of the French Group. As at 30 June 2017, the following ONLINE FLAGSHIP STORES were active. Specifically:
marni.com, of the Marni brand, operational since September 2006, active mainly in Europe, the US and Japan and operational in China since March 2011;
emporiorarmani.com, of the Emporio Armani brand, operational in the US since August 2007; its operations were expanded mainly to major markets in Europe in June 2008, to Japan in July 2009 and China in November 2010;

CONSOLIDATED INTERIM FINANCIAL STATEMENTS AS AT 30 JUNE 2017 | 12
stoneisland.com, of the Stone Island brand, operational since March 2008 mostly in the main European markets, the US and Japan;
valentino.com, of the Valentino brand, operational since April 2008 in the US, since March 2009 in the main European markets and Japan and since November 2014 in China;
emiliopucci.com, of the Emilio Pucci brand, operational since November 2008, mostly in the main European markets, the US and Japan;
moschino.com, of the Moschino, Love Moschino and MoschinoCheapAndChic brands, active since February 2009 mainly in Europe, the US and Japan;
dsquared2.com, of the Dsquared2 brand, operational since September 2009, mainly in Europe, the US, Japan and China;
jilsander.com, of the Jil Sander and Jil Sander Navy brands, operational since September 2009 mainly in Europe, the US and Japan; the store expanded to include the Jil Sander Navy brand in January 2011;
justcavalli.com, of the Just Cavalli brand, operational since February 2011 mainly in Europe, the US and Japan;
napapijri.com, of the Napapijri brand, operational since March 2010 mainly in Europe and the US, and since October 2010 in Japan;
albertaferretti.com, of the Alberta Ferretti and Philosophy by Alberta Ferretti brands, operational since March 2010 mainly in Europe, the US and Japan;
maisonmargiela.com, of the Maison Margiela brand, operational since October 2010, mainly in Europe, the US and Japan;
moncler.com, of the Moncler brand, operational since September 2011 mainly in Europe, the US and China and since September 2014 in Japan;
armani.com, of the Giorgio Armani, Armani Collezioni, Armani Junior, EA7, Emporio Armani and Armani Jeans brands, operational since October 2011 mainly in Europe, the US, Japan and China;
trussardi.com, of the Trussardi 1911 brand, operational since December 2011 mainly in Europe, the US and Japan; in October 2012 it was also extended to the Tru Trussardi and Trussardi Jeans brands;
barbarabui.com, of the Barbara Bui brand, operational since February 2012, mainly in Europe, the US and Japan;
pomellato.com, of the Pomellato brand, operational since May 2012 mainly in Europe, the US and Japan;
alexanderwang.com, of the Alexander Wang and T by Alexander Wang brands, operational since May 2012 in Asia-Pacific area countries including China, Hong Kong and Japan and in Europe, and since July 2014 in the US;
missoni.com, of the Missoni brand, operational since March 2013 mainly in Europe, North America and Japan;
dodo.it, of the Dodo brand, operational since March 2013 mainly in Europe, North America and since the end of 2014 in Japan;
kartell.com, of the Kartell brand operational since May 2014 in Europe;
redvalentino.com, of the Red Valentino brand, operational since November 2014, mainly in the US, Europe and Japan and, since July 2015, it has extended to the Chinese market;
lanvin.com, of the Lanvin brand, active since February 2015 in Europe, United States and the main countries of the Asia-Pacific region, later extended to the Chinese market in March 2015;

CONSOLIDATED INTERIM FINANCIAL STATEMENTS AS AT 30 JUNE 2017 | 13
karl.com of the Karl Lagerfeld branch, active since October 2015 in Europe, the US and Japan;
dunhill.com, of the Alfred Dunhill brand, active since February 2016 mainly in Europe, the US and the countries of the Asia-Pacific region;
chloe.com, of the Chloé brand, active since June 2016 mainly in Europe, the US, and the countries of the Asia-Pacific region;
sergiorossi.com, of the Sergio Rossi brand, active since September 2012 in the main European markets, the US, Japan and extended to the Chinese market in June 2014;
Isabelmarant.com, of the Isabel Marant brand, operational in major European markets, the US, Japan and Asia-Pacific countries since June 2017;
bottegaveneta.com, of the Bottega Veneta brand managed by the joint venture between Kering and YOOX NET-A-PORTER GROUP and launched at the end of 2012 in several European markets, the US and Japan;
stellamccartney.com, of the Stella McCartney brand, managed by the joint venture between Kering and YOOX NET-A-PORTER GROUP and started at the end of 2012 in Europe, the US and Japan and extended to the Chinese market in January 2014;
alexandermcqueen.com, of the Alexander McQueen brand, managed by the joint venture between Kering and YOOX NET-A-PORTER GROUP and active since May 2013, mainly in Europe, the US and Japan and extended to the Chinese market in January 2014;
balenciaga.com, of the Balenciaga brand, managed by the joint venture between Kering and YOOX NET-A-PORTER GROUP and active since May 2013, mainly in Europe, the US and Japan and extended to the Chinese market in May 2014;
ysl.com, of the Saint Laurent brand, managed by the joint venture between Kering and YOOX NET-A-PORTER GROUP and operational since June 2013 mainly in Europe, the US and Japan;
brioni.com, of the Brioni brand, managed by the joint venture between Kering and YOOX NET-A-PORTER GROUP and active since November 2013, mainly in Europe, the US and Japan and extended to the Chinese market in February 2015;
mcq.com, the Alexander McQueen contemporary line, managed by the joint venture between Kering and YOOX NET-A-PORTER GROUP and active since April 2015 mainly in Europe, the US and the main countries of the Asia-Pacific region.
REVENUES AND PROFITABILITY METHODOLOGICAL NOTE This Directors’ Report contains information relating to the revenues, profitability and financial position of the YOOX NET-A-PORTER GROUP as at 30 June 2017. Unless otherwise specified, all amounts are expressed in thousands. Comparisons in the document were made with respect to
the corresponding period of the previous year, or compared with 31 December 2016. It should be noted that possible differences that may be found in some tables are due to rounding off amounts expressed in thousands of euro. The Parent Company YOOX NET-A-PORTER GROUP S.p.A. is referred to by its full name or simply as the Company; the Group reporting directly to it appears as YOOX NET-A-PORTER GROUP or simply as the Group; when notes refer to subsidiaries, full company names are used. All subsidiaries of YOOX NET-A-PORTER GROUP S.p.A. operate in the Group’s business sector, or in any event, perform activities that are consistent with those of the Group.

CONSOLIDATED INTERIM FINANCIAL STATEMENTS AS AT 30 JUNE 2017 | 14
Unless otherwise indicated, all amounts are expressed in thousands of Euro. ACCOUNTING POLICIES The Interim Financial Statements as at 30 June 2017 have been drawn up in accordance with Article 154-ter, paragraph 5 of Legislative Decree 58/98 – T.U.F. – as amended and supplemented - and in compliance with article 2.2.3 of the Stock Exchange Regulations. The accounting standards, consolidation standards and evaluation criteria used in preparing the Consolidated Interim Financial Statements are consistent and comply with the standards used to draw up the Annual Report at 31 December 2016, which is available on the website www.ynap.com in the “Investor Relations” section. The accounting policies used by the Parent Company and by the Group are consistent with those of the International Financial Reporting Standards endorsed by the European Union and the application of Legislative Decree 38/2005 and other Consob rules and regulations governing financial statements. These financial statements were prepared on a cost basis (with the exception of derivative financial instruments, held-for-sale financial assets and available-for-sale financial instruments, which are stated at their current value) and on the assumption that the business is a going concern. RECLASSIFIED CONSOLIDATED INCOME STATEMENT The income statements for the Group, presented in the following pages of the current Directors’ Report, have been reclassified in a way deemed by management to be useful for reporting interim indicators of profitability such as gross profit, EBITDA Pre Corporate Costs, EBITDA, EBITDA without incentive plans, operating profit and net profit without incentive plans. Some of the above interim profitability indicators are not recognised as accounting measures under the IFRS endorsed by the European Union and, therefore, their calculation may not be standard. Group management uses these indicators to monitor and measure the Group’s performance. Management believes that these indicators are an important measure of operating performance in that they are not affected by the various criteria used to calculate taxes, the amount and characteristics of invested capital and the related amortisation and depreciation methods. The criterion used by the Group to calculate these indicators might not be consistent with that adopted by other groups or companies, and accordingly, the resulting figures may not be comparable.

CONSOLIDATED INTERIM FINANCIAL STATEMENTS AS AT 30 JUNE 2017 | 15
Reclassified consolidated income statement for the first half of 2017 compared with the reclassified income statement for the first half of 2016:
THOUSAND EURO 30 JUNE 2017 30 JUNE 2016 CHANGE
CONSOLIDATED NET REVENUES 1,034,106 897,038 137,068 15.3%
COST OF GOODS SOLD (619,604) (542,154) (77,451) 14.3%
GROSS PROFIT 8 414,502 354,884 59,617 16.8%
% of consolidated net revenues 40.1% 39.6%
FULFILMENT COSTS (99,920) (88,501) (11,418) 12.9%
SALES AND MARKETING COSTS (124,421) (106,037) (18,384) 17.3%
EBITDA PRE-CORPORATE COSTS 9 190,161 160,347 29,815 18.6%
% of consolidated net revenues 18.4% 17.9%
GENERAL EXPENSES (87,527) (81,035) (6,493) 8.0%
INCENTIVE PLANS (6,555) (5,914) (641) 10.8%
OTHER INCOME AND EXPENSES (4,638) (2,795) (1,843) 65.9%
EBITDA 10 91,441 70,603 20,838 29.5%
% of consolidated net revenues 8.8% 7.9%
DEPRECIATION AND AMORTISATION (52,126) (41,621) (10,505) 25.2%
NON-RECURRING EXPENSES 0 0
OPERATING PROFIT 39,315 28,982 10,333 35.7%
% of consolidated net revenues 3.8% 3.2%
INCOME FROM EQUITY INVESTMENTS 39 239 (200) -83.7%
FINANCIAL INCOME 7,914 12,929 (5,015) -38.8%
FINANCIAL EXPENSES (17,889) (13,952) (3,937) 28.2%
PROFIT BEFORE TAX 29,378 28,198 1,180 4.2%
% of consolidated net revenues 2.8% 3.1%
TAXES (8,793) (9,363) 571 -6.1%
CONSOLIDATED NET INCOME FOR THE YEAR 20,585 18,835 1,751 9.3%
% of consolidated net revenues 2.0% 2.1%
EBITDA EXCLUDING INCENTIVE PLAN COSTS 11 97,996 76,517 21,479 28.1%
% of consolidated net revenues 9.5% 8.5%
NET INCOME EXCLUDING INCENTIVE PLANS AND PPA 12 38,041 37,027 1,014 2.7%
% of consolidated net revenues 3.7% 4.1%
8 Gross profit is net income before fulfilment costs, sales and marketing costs, general expenses, other income and expenses, depreciation and amortisation,
non-recurring expenses, income/loss from investment in associates, financial income and expenses and income taxes. Since Gross Profit is not recognised as

CONSOLIDATED INTERIM FINANCIAL STATEMENTS AS AT 30 JUNE 2017 | 16
In the first half of 2017 YOOX NET-A-PORTER GROUP recorded consolidated net revenues, excluding sales returns and discounts to customers, equal to Euro 1,034,106 thousand, an increase of 15.3% compared with the figure of Euro 897,038 thousand as at 30 June 2016. EBITDA totalled Euro 91,441 thousand as at 30 June 2017 compared with Euro 70,603 thousand as at 30 June 2016. As a percentage of net revenues EBITDA went from 7.9% in the first half of 2016 to 8.8% in the first half of 2017. This result is mainly attributable to the increase in gross profit combined with an operating leverage on general expenses, both supported by the positive effect on profitability from the exchange rate with the US dollar and the Russian Rouble. Excluding the notional charges relating to the incentive plans, equal to Euro 6,555 thousand, EBITDA stood at Euro 97,996 thousand (+28.1% compared with the same period in 2016), with a margin on sales of 9.5% compared with 8.5% last year. Consolidated net income stood at Euro 20,585 thousand compared with Euro 18,835 thousand as at 30 June 2016 with a margin that went from 2.1% to 2.0% in the first half of 2017. This performance reflects the increase in EBITDA margin, which was offset by the greater impact from the depreciation relating to intangible non-current assets posted following upon determination of the Purchase Price Allocation, which went from Euro 41,621 thousand in the first half of 2016 to Euro 52,126 thousand for the first half of 2017, as well as by higher net financial expenses due mainly to unrealised exchange losses. Excluding the notional charges relating to the incentive plans, the related tax effect and the amortisation of intangible assets recognised following the Purchase Price Allocation process, net income was Euro 38,041 thousand, compared with Euro 37,027 thousand in the first half of 2016. The table below shows several key indicators13 relating to the Group’s activities, compared with the related indicators of the first half of 2016.
30 JUNE 2017 30 JUNE 2016
NUMBER OF VISITS (MILLIONS) 394.3 342.7
NUMBER OF ORDERS (THOUSANDS) 4,452 3,945
AOV14 (EUROS) 345 335
NUMBER OF ACTIVE CUSTOMERS15 (THOUSANDS) 3,050 2,600
In the first half of 2017 the Group recorded visits totalling 394.3 million compared with 342.7 million in the same period of the previous year. The number of orders stood at 4,452 thousand, equal to one order processed every 4 seconds, compared with 3,945 thousand in the first half of 2016. The average order value (AOV) stood at Euro 345 (excluding VAT) compared with Euro 335 (excluding VAT) in the same period of the previous year. The number of active customers increased from 2,600 thousand in the first half of 2016 to 3,050 thousand in the first half of 2017.
an accounting measure under the IFRS endorsed by the European Union, its calculation might not be standard, and the measurement criterion adopted by the Group might not be consistent with that used by other groups, and accordingly, the resulting figure may not be comparable.
9 EBITDA Pre Corporate Costs is defined as profit before general expenses, other income and expenses, depreciation and amortisation, non-recurring expenses, income/loss from investment in associates, financial income and expenses and income taxes. Since EBITDA Pre Corporate Costs is not recognised as an accounting measure under the IFRS endorsed by the European Union, its calculation might not be standard, and the measurement criterion adopted by the Group might not be consistent with that used by other groups, and accordingly, the resulting figure may not be comparable.
10 EBITDA is net income before depreciation and amortisation, non-recurring expenses, income/loss from investment in associates, financial income and expenses and income taxes. Since EBITDA is not recognised as an accounting measure under the IFRS endorsed by the European Union, its calculation might not be standard. Group management uses EBITDA to monitor and measure the Group’s performance. Management believes that EBITDA is an important measure of operating performance in that it is not affected by the various criteria used to calculate taxes, the amount and characteristics of invested capital and the related amortisation and depreciation methods. The criterion used by the Group to calculate EBITDA might not be consistent with that adopted by other groups, and accordingly, the resulting figure may not be comparable with those calculated by such groups.
11 EBITDA excluding Incentive Plans is defined as EBITDA net of costs relating to the Stock Option Plans and Company Incentive Plans, described in the consolidated financial statements. For more details, refer to Annex 1 of this Report, which describes the impact of these costs on the reclassified consolidated income statement.
12 Net income excluding Incentive Plans and PPA is defined as consolidated net income for the period before non-cash costs relating to the Stock Option Plans and Company Incentive Plans and before the amortisation of intangible assets recognised following the Purchase Price Allocation Process.
13 The business metrics refer to proprietary Multi-brand online stores, NET-A-PORTER.COM, MR PORTER.COM, THECORNER.COM, SHOESCRIBE.COM, YOOX.COM, THE OUTNET.COM and online flagship store “Powered by YOOX NET-A-PORTER GROUP”. The business metrics related to the joint venture with Kering and the jimmychoo.com online store are excluded.
14 Average Order Value or AOV, excluding VAT, indicates the average value of each purchase order. 15 An Active Customer is defined as a customer who placed at least one order during the 12 preceding months.

CONSOLIDATED INTERIM FINANCIAL STATEMENTS AS AT 30 JUNE 2017 | 17
ANALYSIS OF NET REVENUES BY BUSINESS LINE Below are the Group’s net revenues per business line, compared with the net revenues of the first half of 2016:
THOUSAND EURO 30 JUNE 2017 30 JUNE 2016 CHANGE
MULTI-BRAND IN-SEASON 552,932 53.5% 490,070 54.6% 62,862 12.8%
MULTI-BRAND OFF-SEASON 381,660 36.9% 318,252 35.5% 63,408 19.9%
ONLINE FLAGSHIP STORES 99,514 9.6% 88,716 9.9% 10,798 12.2%
TOTAL YOOX NET-A-PORTER-GROUP 1,034,106 100.0% 897,038 100.0% 137,068 15.3%
In the first half of 2017, the Group’s consolidated net revenues, net of returns from sales and discounts given to customers, were Euro 1,034,106 thousand, an increase of 15.3% over the figure of Euro 897,038 thousand for the first half of 2016, with a contribution from all business lines. Multi-brand In-Season The Multi-brand In-Season business line, which includes the activities of the online stores NET-A-PORTER.COM and MRPORTER.COM in the first half of 2017, recorded consolidated net revenues of Euro 552,932 thousand, an 12.8% increase over the Euro 490,070 thousand recorded in the first half of 2016, which also included THECORNER.COM and SHOESCRIBE.COM. The second quarter witnessed the launch of new major exclusive capsule collections on NET-A-PORTER and MR PORTER, as well as excellent performance in the fine jewellery and watches category.
Specifically, a new exclusive Chloé capsule collection debuted on NET-A-PORTER, whilst on MR PORTER there were launches of the MR PORTER X GUCCI collection and the exclusive capsule collection of ready-to-wear, footwear and accessories for men designed by Tod’s. The fine jewellery and watches category recorded solid performance thanks to strong demand, especially in the United States. The second quarter witnessed the debut of new prestigious brands. Piaget was launched on NET-A-PORTER whilst Cartier chose NET-A-PORTER as its exclusive partner for launching the new Panthère de Cartier watch collection. In the second quarter, MR PORTER, which is currently one of the global top 10 Men’s Fashion Apps on the App Store, launched new features on its new native app to make best use of the textual content. The continuous improvement of the mobile experience for users helped to further boost sales from smartphones and tablets. Overall, as at 30 June 2017, the Multi-Brand In-Season business line accounted for 53.5% of the Group’s consolidated net revenues Multi-brand Off-Season The Multi-brand Off-season business line, including the activity of online stores YOOX.COM and THE OUTNET.COM, recorded net revenues of Euro 381,660 thousand, an increase of 19.9% compared with Euro 318,252 thousand in the same period of the previous year. This performance was achieved thanks to the excellent results of both online stores. The Off-Season business line has enriched its brand portfolio both on YOOX and on THE OUTNET. YOOX has reaffirmed its commitment to supporting and promoting emerging designers and young talents with the launch of new exclusive collections such as, for example, those of the top Italian model Bianca Balti and of the internationally renowned designers Fausto Puglisi and Arthur Arbesser. THE OUTNET launched Philosophy di Lorenzo Serafini (part of Alberta Ferretti) and enriched its beachwear range with the introduction of collections from Stella McCartney, Roberto Cavalli, Just Cavalli, La Perla and Calvin Klein, as well as with Iris&Ink's first beachwear capsule collection. Lastly, in June, to celebrate its seventeenth birthday, YOOX successfully launched a new global campaign based on an innovative media mix, diversified among digital, social, radio and new advertising formats. The campaign recorded extremely positive response from customers and obtained excellent results in terms of awareness and engagement Overall, as at 30 June 2017, the Multi-brand End-of-Season accounted for 36.9% of the Group’s consolidated net revenues. Online Flagship Stores The Online Flagship Stores business line includes the design, creation, set-up and management of the Online Flagship Stores of some of the leading global luxury fashion brands. As at 30 June 2017, it registered net revenues of Euro 99,514 thousand, an increase of 12.2% versus Euro 88,716 thousand in the first half of 2016.

CONSOLIDATED INTERIM FINANCIAL STATEMENTS AS AT 30 JUNE 2017 | 18
On 20 June 2017, the new Isabel Marant Online Flagship Store, isabelmarant.com, was launched in Europe, the United States and the Asia-Pacific region, including China. The See By Chloé line was also added on chloe.com as an expansion of the already existing global partnership with Chloé. Overall, as at 30 June 2017, the Online Flagship Stores business accounted for 9.6% of the Group’s consolidated net revenues. CONSOLIDATED NET REVENUES BY GEOGRAPHICAL AREA Below are the consolidated net revenues by geographical area as at 30 June 2017 and in the second quarter of 2017, compared, respectively, with the consolidated net revenues as at 30 June 2016 and in the second quarter of 2016:
THOUSAND EURO 30 JUNE
2017
30 JUNE 2016
CHANGE
CHANGE IN
EXCHANGE RATE
COSTS
ITALY 64,390 6.2% 57,470 6.4% 6,920 12.0% 12.2%
UNITED KINGDOM 138,461 13.4% 135,245 15.1% 3,216 2.4% 13.0%
EUROPE (EXCLUDING ITALY AND THE UNITED KINGDOM)
266,965 25.8% 238,410 26.6% 28,556 12.0% 9.7%
NORTH AMERICA 322,488 31.2% 268,126 29.9% 54,362 20.3% 17.3%
ASIA-PACIFIC 178,465 17.3% 137,420 15.3% 41,045 29.9% 31.9%
OTHER COUNTRIES AND NOT-COUNTRY-RELATED REVENUES16
63,337 6.1% 60,368 6.7% 2,969 4.9% 13.1%
TOTAL YOOX NET-A-PORTER-GROUP 1,034,106 100% 897,038 100% 137,068 15.3% 16.3%
THOUSAND EURO 2Q 2017 2Q 2016 CHANGE
CHANGE IN
EXCHANGE RATE
COSTS
ITALY 33,070 6.4% 29,219 6.5% 3,852 13.2% 13.2%
UNITED KINGDOM 71,786 13.8% 70,226 15.6% 1,561 2.2% 11.7%
EUROPE (EXCLUDING ITALY AND THE UNITED KINGDOM)
132,443 25.5% 117,463 26.1% 14,980 12.8% 11.6%
NORTH AMERICA 161,205 31.0% 135,100 30.0% 26,104 19.3% 17.0%
ASIA-PACIFIC 87,399 16.8% 68,176 15.1% 19,223 28.2% 30.8%
OTHER COUNTRIES AND NOT-COUNTRY-RELATED REVENUES17
33,402 6.4% 30,652 6.8% 2,750 9.0% 16.3%
TOTAL YOOX NET-A-PORTER-GROUP 519,306 100% 450,836 100% 68,470 15.2% 16.5%
YOOX NET-A-POTER GROUP posted a sharp improvement in results in all main reference markets during the period. The United Kingdom confirmed double-digit positive growth in the second quarter of 2017, with the excellent performance of the In-Season business line. Net revenues in the United Kingdom amounted to Euro 71,786 thousand, an increase of 11.7% at constant exchange rates (+2.2% at current rates, penalised by the decline of the Euro/Sterling exchange rate against the same period of the previous year) compared to net revenues of Euro 70,226 thousand in the same quarter of 2016.
16 The item “Not country-related” includes the set-up and maintenance fees for the online flagship stores, for the media partnership and advertising projects and
for other services offered to online flagship store partners. 17 The item “Not country-related” includes the set-up and maintenance fees for the online flagship stores, for the media partnership and advertising projects and
for other services offered to online flagship store partners.

CONSOLIDATED INTERIM FINANCIAL STATEMENTS AS AT 30 JUNE 2017 | 19
This result has translated into consolidated net revenues of Euro 138,461 thousand in the first half of 2017, up 13.0% at constant exchange rates (+2.4% at current rates), compared to net revenues at Euro 135,245 thousand in the same period of 2016. North America, the Group's top market, has continued with the solid performance already achieved at the beginning of the year, recording net revenues of Euro 161,205 thousand in the second quarter, up 17.0% at constant exchange rates (+19.3% at current rates) compared to Euro 135,100 thousand in the same quarter of 2016. During the first half of 2017, net revenues increased by 17.3% at constant exchange rates (+20.3% at current rates) to reach Euro 322,488 thousand. Italy has achieved strong performance, driven by YOOX, with net revenues of Euro 33,070 thousand in the second quarter, up 13.2% at constant exchange rates, despite the challenging comparison basis. This result contributed to the increase in net revenues in the first half of the year, up 12.2% at constant exchange rates (+12.0% at current rates), amounting to Euro 64,390 thousand. In the second quarter of 2017, Europe (excluding Italy and the United Kingdom), returned to double-digit growth, with net revenues amounting to Euro 132,443 thousand, up 11.6% at constant exchange rates (+12.8% at current rates). This has resulted in net revenues growth of 9.7% in the first half of 2017 at constant exchange rates (+12.0% at current exchange rates). The Asia Pacific region also confirmed solid performance during this quarter, with the second quarter net revenues of Euro 87,399 thousand, up 30.8% at constant exchange rates (+28.2% at current rates), driven mainly by Hong Kong and China. This result has translated into net revenues of Euro 178,465 thousand for the first half of 2017, up 31.9% at constant exchange rates (+29.9% at current rates). Lastly, the aggregate Other Countries and Not-country-related revenues recorded net revenues of Euro 33,402 thousand in the second quarter and Euro 63,337 thousand in the first half of 2017, up 16.3% and 13.1% respectively (+9.0% and +4.9% at current rates).
INVESTMENTS The Group made investments totalling Euro 80,246 thousand in the first half of 2017, comprising Euro 53,368 thousand in intangible assets and Euro 26,878 thousand in tangible assets. Increases in intangible assets mainly refer to investments in multi-year development projects valued at Euro 46,693 thousand. In the first half of 2017, the Group continued to improve its expertise in terms of logistics and technology, also investing in convergence on a single shared global techno-logistics platform. It continued to release already-existing omni-channel features to a growing number of the Group’s partner Online Flagship Stores, also further investing in its own mobile range. Confirming
the success of its strategy, mobile sales exceeded desktop sales, accounting for over 50% of sales in July. In the second quarter, a new version of the YOOX native app was released on iOS and on Android, with excellent results obtained in terms of conversion rate and effectiveness in text search capabilities. In the first half of 2017, investments in Research & Development continued. Specifically, with the aim of accelerating innovation and developing increasingly advanced technologies, including those involving Artificial Intelligence, in London, the Group
inaugurated the new Tech Hub, which hosts the Group’s UK-based technology team. Lastly, during this period, the Group invested in strengthening its own operations, with the expansion of its own capacity at the Interporto Bologna centre, as well as in the set-up of the logistics hub for the In-Season line in Milan. A new automated device was also developed internal to further improve YOOX’s digital production.

CONSOLIDATED INTERIM FINANCIAL STATEMENTS AS AT 30 JUNE 2017 | 20
ANALYSIS OF GROSS PROFIT18 BY BUSINESS LINE THOUSAND EURO MULTI-BRAND IN-SEASON MULTI-BRAND OFF-SEASON ONLINE FLAGSHIP STORES
30 JUNE 2017 30 JUNE 2016 30 JUNE 2017 30 JUNE 2016 30 JUNE 2017 30 JUNE 2016
GROSS PROFIT 234,366 205,967 144,035 116,932 36,099 31,985
% OF NET REVENUES 42.4% 42.0% 37.7% 36.7% 36.3% 36.1%
% CHANGE 13.8% 23.2% 12.9% Multi-brand In-Season business line The Multi-brand in-season business line recorded a gross profit at 30 June 2017 of Euro 234,366 thousand, growth of 13.8% compared with Euro 205,967 thousand in the same period of the previous year, with the margin on net sales revenues going from 42.0% to 42.4% for the first half of 2017. This result reflected growth reported in the first six months of 2017 by online stores NET-A-PORTER.COM and MRPORTER, while the first half of 2016 also included THECORNER.COM and SHOESCRIBE.COM. Multi-brand Off-Season business line The Multi-brand end of season business line recorded a gross profit as at 30 June 2017 of Euro 144,035 thousand, with growth of 23.2% compared with Euro 116,932 thousand for the same period in the previous year, with the margin for net sales revenues going from 36.7% to 37.7% for the first half of 2017. This result mainly reflects more effective pricing and mark-down policies as well as favourable currencies. Online Flagship Stores business line The Online Flagship Stores business line recorded a gross profit in the first half of 2017 of Euro 36,099 thousand, up 12.9% compared with the same period in the previous year, with a margin of 36.3% compared with 36.1% for the first half of 2016.
18 Gross profit is defined as the difference between net sales revenues and cost of goods sold including shipping costs.

CONSOLIDATED INTERIM FINANCIAL STATEMENTS AS AT 30 JUNE 2017 | 21
FINANCIAL MANAGEMENT CONSOLIDATED STATEMENT OF FINANCIAL POSITION The tables below contain the figures taken from the Group’s reclassified consolidated statements of financial position as at 30 June 2017 and the Group’s consolidated statement of cash flows for the same period. Reclassified consolidated statement of financial position at 30 June 2017:
THOUSAND EURO BALANCE AT
30 JUNE 2017 BALANCE AT 31 DEC 2016
% CHANGE
NET WORKING CAPITAL19 61,673 36,556 68.7%
NON-CURRENT ASSETS 1,866,493 1,880,397 -0.7%
NON-CURRENT LIABILITIES (EXCLUDING FINANCIAL LIABILITIES) (80,843) (85,660) -5.6%
NET INVESTED CAPITAL20 1,847,323 1,831,293 0.9%
EQUITY 1,932,071 1,935,994 -0.2%
NET DEBT / (NET FINANCIAL POSITION)21 (84,748) (104,701) -19.1%
TOTAL SOURCES OF FINANCING 1,847,323 1,831,293 0.9%
The Group’s net invested capital went from Euro 1,831,293 thousand, as at 31 December 2016, to Euro 1,847,323 thousand as at 30 June 2017. Shareholders’ equity, which at 30 June 2017 stood at Euro 1,932,071 thousand, fell by 0.2% (see paragraph 8.23 of the document for more detailed information). The net financial position deteriorated, going from Euro 104,701 thousand, as at 31 December 2016, to Euro 84,748 thousand, as at 30 June 2017.
19 Net working capital is current assets, net of current liabilities, with the exception of cash and cash equivalents, bank loans and borrowings and other financial
payables due within one year and financial assets and liabilities included under other current assets and liabilities. Net working capital is not recognised as an accounting measure under the IFRS accounting principles endorsed by the European Union. The measurement criterion adopted by the Company might not be consistent with that adopted by other groups and, accordingly, the balance obtained by the Company may not be comparable with those calculated by such groups.
20 Net invested capital is the sum of working capital, non-current assets and non-current liabilities, net of medium-/long-term financial liabilities. Net invested capital is not recognised as an accounting measure under Italian GAAP or the IFRS endorsed by the European Union. The measurement criterion adopted by the Company might not be consistent with that adopted by other groups and, accordingly, the balance obtained by the Company may not be comparable with those calculated by such groups.
21 Net debt (or net financial position) is the sum of cash and cash equivalents, other current financial assets, net of bank loans and other financial liabilities falling due within one year, other current financial liabilities, and medium-/long-term financial liabilities. Net debt (or net financial position) is not recognised as an accounting measure under the IFRS accounting principles endorsed by the European Union. The measurement criterion adopted by the Company might not be consistent with that adopted by other groups and, accordingly, the balance obtained by the Company may not be comparable with those calculated by such groups. For details of the items that make up net debt (or net financial position), please see the table below in the section “Debt/Consolidated net financial position”. “Other current financial assets” are not regulated in detail in the definition of net financial debt (or net financial position) of SECR; the Group integrates this definition by including in “other current financial assets” the credits held towards acquirers and logistic operators, who are required to collect payment upon delivery.
CONSOLIDATED INTERIM FINANCIAL STATEMENTS AS AT 30 JUNE 2017 | 22
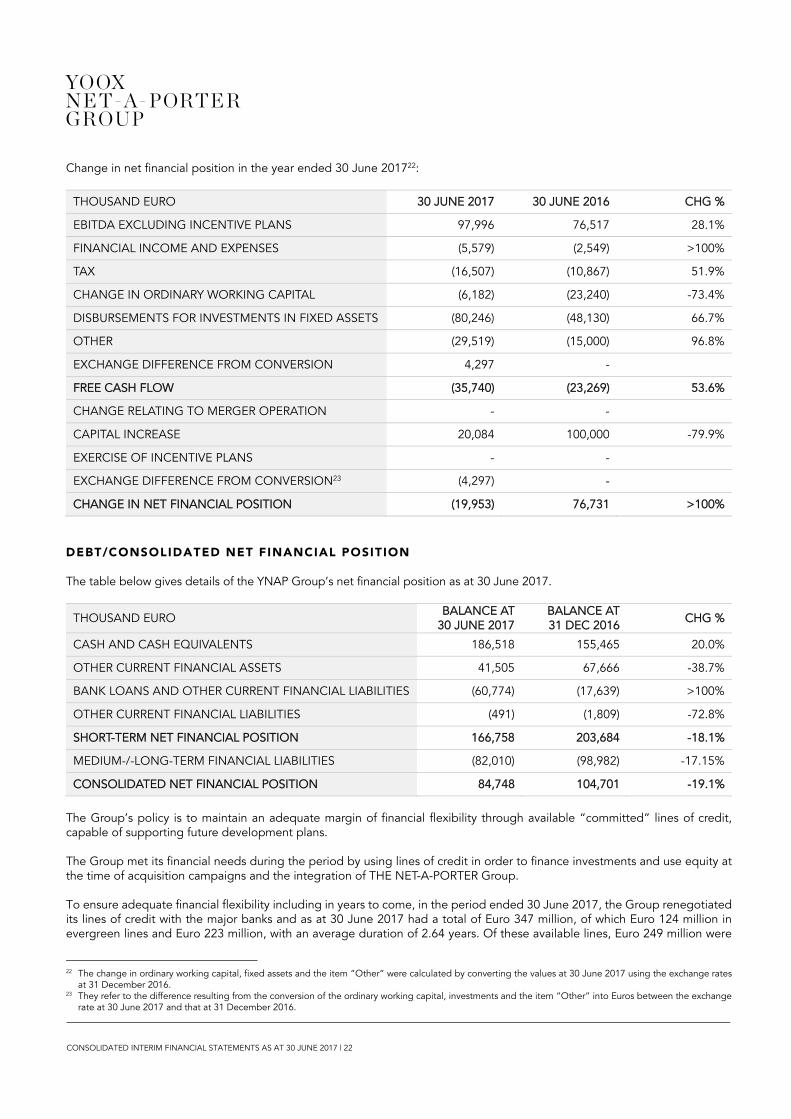
Change in net financial position in the year ended 30 June 201722:
THOUSAND EURO 30 JUNE 2017 30 JUNE 2016 CHG %
EBITDA EXCLUDING INCENTIVE PLANS 97,996 76,517 28.1%
FINANCIAL INCOME AND EXPENSES (5,579) (2,549) >100%
TAX (16,507) (10,867) 51.9%
CHANGE IN ORDINARY WORKING CAPITAL (6,182) (23,240) -73.4%
DISBURSEMENTS FOR INVESTMENTS IN FIXED ASSETS (80,246) (48,130) 66.7%
OTHER (29,519) (15,000) 96.8%
EXCHANGE DIFFERENCE FROM CONVERSION 4,297 -
FREE CASH FLOW (35,740) (23,269) 53.6%
CHANGE RELATING TO MERGER OPERATION - -
CAPITAL INCREASE 20,084 100,000 -79.9%
EXERCISE OF INCENTIVE PLANS - -
EXCHANGE DIFFERENCE FROM CONVERSION23 (4,297) -
CHANGE IN NET FINANCIAL POSITION (19,953) 76,731 >100%
DEBT/CONSOLIDATED NET FINANCIAL POSITION The table below gives details of the YNAP Group’s net financial position as at 30 June 2017.
THOUSAND EURO BALANCE AT
30 JUNE 2017 BALANCE AT 31 DEC 2016
CHG %
CASH AND CASH EQUIVALENTS 186,518 155,465 20.0%
OTHER CURRENT FINANCIAL ASSETS 41,505 67,666 -38.7%
BANK LOANS AND OTHER CURRENT FINANCIAL LIABILITIES (60,774) (17,639) >100%
OTHER CURRENT FINANCIAL LIABILITIES (491) (1,809) -72.8%
SHORT-TERM NET FINANCIAL POSITION 166,758 203,684 -18.1%
MEDIUM-/-LONG-TERM FINANCIAL LIABILITIES (82,010) (98,982) -17.15%
CONSOLIDATED NET FINANCIAL POSITION 84,748 104,701 -19.1%
The Group’s policy is to maintain an adequate margin of financial flexibility through available “committed” lines of credit, capable of supporting future development plans. The Group met its financial needs during the period by using lines of credit in order to finance investments and use equity at the time of acquisition campaigns and the integration of THE NET-A-PORTER Group. To ensure adequate financial flexibility including in years to come, in the period ended 30 June 2017, the Group renegotiated its lines of credit with the major banks and as at 30 June 2017 had a total of Euro 347 million, of which Euro 124 million in evergreen lines and Euro 223 million, with an average duration of 2.64 years. Of these available lines, Euro 249 million were
22 The change in ordinary working capital, fixed assets and the item “Other” were calculated by converting the values at 30 June 2017 using the exchange rates
at 31 December 2016. 23 They refer to the difference resulting from the conversion of the ordinary working capital, investments and the item “Other” into Euros between the exchange
rate at 30 June 2017 and that at 31 December 2016.

CONSOLIDATED INTERIM FINANCIAL STATEMENTS AS AT 30 JUNE 2017 | 23
not utilised. The annual cost on the nominal value of the total of lines of credit was equal to an average spread of approximately 108 bps. The lines utilised as at 30 June 2017 were fully hedged against the risk of interest rate fluctuations. Cash and cash equivalents totalled Euro 186,518 thousand as at 30 June 2017, and are made up of cash, negotiable instruments and demand deposits or short-term deposits with banks, which are actually available and readily usable. As at 30 June 2017, financial liabilities stood at Euro 142,784 thousand and were mainly made up of medium-/long-term loans agreed for funding the investment in the techno-logistics platform and for managing the integration process under way. Specifically, outstanding long-term loans were provided by a lending syndicate in the following amounts: Banca Nazionale del Lavoro: Euro 20,625 thousand (of which Euro 2,947 thousand was short-term); UniCredit: Euro 28,125 thousand (of which Euro 4,019 thousand was short-term); and Banca Intesa: Euro 26,250 thousand (of which Euro 3,751 thousand was short-term). Other loans were provided by Banca Sella (Euro 417 thousand, all short term) and EIB (Euro 22,756 thousand (of which Euro 9,040 thousand short term). The remaining financial liabilities refer to finance leases totalling Euro 8,698 thousand (of which Euro 4,685 thousand is short term) dedicated to investments in technology and current IFI financial payables (Factoring) for a total of Euro 35,852 thousand, in addition to related accruals (Euro 62 thousand). Other current financial liabilities as at 30 June 2017 of Euro 491 thousand, included the negative fair value of transactions in derivatives (accounted for according to IAS 39 using the Cash flow hedge method) set up to hedge against the interest rate risk in relation to the loan agreements in place. Other current financial assets as at 30 June 2017, equal to Euro 41,505 thousand, refer mainly to financial receivables due to the Group from acquirers who manage authorisations for cards belonging to national/international credit or debit card circuits used for online sales, and logistics operators who are asked for cash for payments on delivery (Euro 27,992 thousand), as well as an interest-bearing deposit with the BNL bank (Euro 10,475 thousand). The remaining part is attributable to the positive fair value of derivative transactions (accounted for according to IAS 39 using the Cash flow hedge method) set up to hedge the exchange rate risk deriving from sales in Japanese yen (Euro 148 thousand) and US dollars (Euro 1,547 thousand), and lastly financial deferrals recognised at the end of the quarter (Euro 1,344 thousand).
INFORMATION FOR INVESTORS Since 03 December 2009, the shares of the Group have been listed on the STAR segment of Borsa Italiana (ISIN Code IT0003540470). After that, the stock was also admitted to the FTSE Italia Mid Cap24 index, to then, on 23 December 2013, join the FTSE MIB – the main index of Borsa Italiana consisting of the top 40 Italian companies by capitalisation and liquidity. As at the document date, the Group’s shares are traded on the Mercato Telematico Azionario (MTA) organised and operated by Borsa Italiana, following the decision of the Board of Directors of the Company to request exit from the STAR segment on 30 July 2015. This decision is attributable to the context of the merger between YOOX GROUP and THE NET-A-PORTER GROUP, to the high market capitalisation of the Group and to the inclusion of the stock in the FTSE MIB index from 2013. Following the effective merger on 05 October 2015, the YOOX NET-A-PORTER GROUP new issue shares resulting from that transaction and the ordinary shares already outstanding as at that date were admitted to trading on the MTA with the new ticker “YNAP” and included in the FTSE MIB index. As at 30 June 2017, the last day of trading of the first half of the year, the YOOX NET-A-PORTER GROUP stock closed at Euro 24.22, corresponding to a market capitalisation equalling Euro 3.2 billion. YOOX NET-A-PORTER GROUP STOCK PERFORMANCE IN THE FIRST HALF OF 2017 After reaching the peaks of the period in the first few weeks of trading, the YNAP stock closed the first half of 2017 below the levels at the start of the year, with performance characterised by high volatility over the course of the six months. From the minimum for the period, reached in March 2017 (15 March 2017), at the end of the half-year period, the stock recorded a performance of 12.7% (please see the chart on the next page for the performances of the benchmark indices of the e-commerce25, luxury26 and Italian luxury27 sectors in the reference period).
24 The FTSE Italia Mid Cap index includes the top 60 companies in terms of capitalisation and liquidity outside of the FTSE MIB index. 25 The representative index for the e-commerce sector includes Alibaba, Amazon, ASOS, boohoo.com, Blue Nile, eBay, Start Today and Zalando. 26 The representative index of the luxury sector includes Brunello Cucinelli, Compagnie Financière Richemont, Hermès, Kering, LVMH, Moncler, Prada, Salvatore
Ferragamo and Tod’s. 27 The representative index of the Italian luxury sector includes Brunello Cucinelli, Moncler, Prada, Salvatore Ferragamo and Tod’s.

CONSOLIDATED INTERIM FINANCIAL STATEMENTS AS AT 30 JUNE 2017 | 24
From the end of the reference period (30 June 2017) until 2 August 2017 the stock recorded a further growth of 14.0%. In fact, as at 2 August 2017 the YOOX NET-A-PORTER GROUP stock closed at Euro 27.6, corresponding to a market capitalisation of Euro 3.7 billion. Between the time of the listing and 30 June 2017, the stock registered positive performance of 463% over the flotation price (Euro 4.3), whilst in the 6 months to 30 June 2017, the stock recorded a decrease of 10.1% with respect to its closing price as at 30 December 2016 (the last day of trading in 2016).
30/12/16
06/01/17
17/01/17
26/01/17
03/02/17
13/02/17
22/02/17
03/03/17
10/03/17
21/03/17
31/03/17
07/04/17
18/04/17
27/04/17
05/05/17
15/05/17
24/05/17
02/06/17
09/06/17
20/06/17
30/06/17
€20.0
€22.0
€24.0
€26.0
€28.0
€30.0
0
400
800
1,200
1,600
2,000
2,400
2,800
3,200
3,600
4,000
4,400
4,800
5,200
5,600
6,000
6,400
6,800
7,200
7,600
8,000
8,400
8,800
9,200
9,600
10,000
Price YNAP S.p.A. Volumes (Thousands) Source: Factset

CONSOLIDATED INTERIM FINANCIAL STATEMENTS AS AT 30 JUNE 2017 | 25
YOOX NET-A-PORTER GROUP STOCK PERFORMANCE COMPARED WITH THE MAIN INDICES OF REFERENCE IN THE FIRST HALF OF 2017
31/12/16
9/1/17
18/1/17
27/1/17
3/2/17
14/2/17
23/2/17
3/3/17
13/3/17
22/3/17
31/3/17
7/4/17
18/4/17
27/4/17
5/5/17
15/5/17
24/5/17
2/6/17
9/6/17
20/6/17
30/6/17
60
75
90
105
120
135
150
-10.1%
7.0%
15.7%
18.6%
32.8%
YNAP S.p.A. FSTE MIB E-commerce Index Luxury Index Italian Luxury Index Source: Factset
The table below summarises key stock and stock exchange data for the first half of 2016.
STOCK AND STOCK EXCHANGE DATA 30 JUNE 2017
CLOSING PRICE AS AT 30/06/2017 (EURO) 24.22
MAXIMUM CLOSING PRICE IN THE FIRST HALF OF 2017 (EURO) – 18/01/2017 28.49
MINIMUM CLOSING PRICE IN THE FIRST HALF OF 2017 IN EURO - 15/03/2017 21.50
MARKET CAPITALISATION AS AT 30/06/2017 (EURO MILLION) 3,242.92
Source: Borsa Italiana
STOCK COVERAGE Stock analyst coverage as at 02 August 2017 includes 22 financial analysts: Banca IMI, Citi, Deutsche Bank, Equita, Exane BNP Paribas, Fidentiis, Goldman Sachs International, Intermonte, J.P. Morgan, Kepler Chevreux, Mediobanca, Morgan Stanley, Arete, Banca Akros, Berenberg, Bryan Garnier & Co., Credit Suisse, Hammer Partners, KeyBanc and Macquarie, to which Barclays and Jefferies International were added during the first half of 2016. SHAREHOLDER STRUCTURE As at 30 June 2017, the share capital issued stood at Euro 1,338,942.89, corresponding to a total of 133,894,289 shares with no indication of par value, pursuant to Article 2346 of the Italian Civil Code, of which 90,988,151 were ordinary shares, admitted to trading on the MTA and 42,906,138 were unlisted B shares with no voting rights.
CONSOLIDATED INTERIM FINANCIAL STATEMENTS AS AT 30 JUNE 2017 | 26
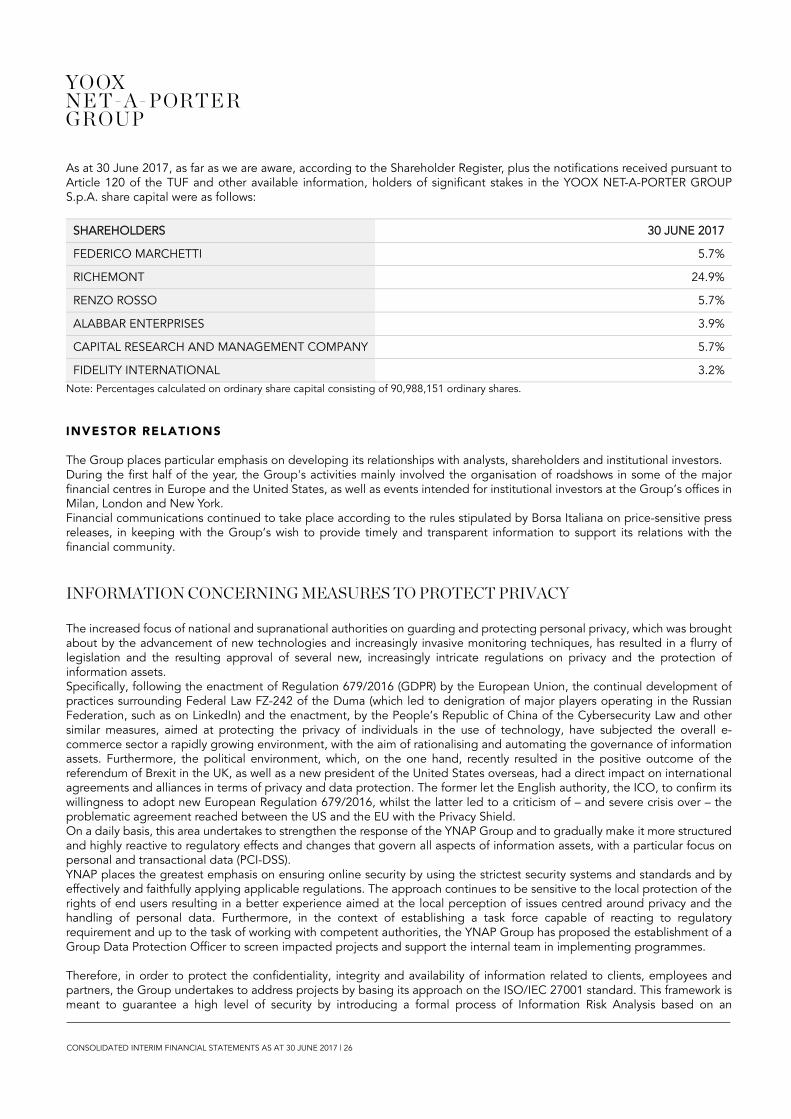
As at 30 June 2017, as far as we are aware, according to the Shareholder Register, plus the notifications received pursuant to Article 120 of the TUF and other available information, holders of significant stakes in the YOOX NET-A-PORTER GROUP S.p.A. share capital were as follows:
SHAREHOLDERS 30 JUNE 2017
FEDERICO MARCHETTI 5.7%
RICHEMONT 24.9%
RENZO ROSSO 5.7%
ALABBAR ENTERPRISES 3.9%
CAPITAL RESEARCH AND MANAGEMENT COMPANY 5.7%
FIDELITY INTERNATIONAL 3.2%
Note: Percentages calculated on ordinary share capital consisting of 90,988,151 ordinary shares.
INVESTOR RELATIONS The Group places particular emphasis on developing its relationships with analysts, shareholders and institutional investors. During the first half of the year, the Group's activities mainly involved the organisation of roadshows in some of the major financial centres in Europe and the United States, as well as events intended for institutional investors at the Group’s offices in Milan, London and New York. Financial communications continued to take place according to the rules stipulated by Borsa Italiana on price-sensitive press releases, in keeping with the Group’s wish to provide timely and transparent information to support its relations with the financial community.
INFORMATION CONCERNING MEASURES TO PROTECT PRIVACY The increased focus of national and supranational authorities on guarding and protecting personal privacy, which was brought about by the advancement of new technologies and increasingly invasive monitoring techniques, has resulted in a flurry of legislation and the resulting approval of several new, increasingly intricate regulations on privacy and the protection of information assets. Specifically, following the enactment of Regulation 679/2016 (GDPR) by the European Union, the continual development of practices surrounding Federal Law FZ-242 of the Duma (which led to denigration of major players operating in the Russian Federation, such as on LinkedIn) and the enactment, by the People’s Republic of China of the Cybersecurity Law and other similar measures, aimed at protecting the privacy of individuals in the use of technology, have subjected the overall e-commerce sector a rapidly growing environment, with the aim of rationalising and automating the governance of information assets. Furthermore, the political environment, which, on the one hand, recently resulted in the positive outcome of the referendum of Brexit in the UK, as well as a new president of the United States overseas, had a direct impact on international agreements and alliances in terms of privacy and data protection. The former let the English authority, the ICO, to confirm its willingness to adopt new European Regulation 679/2016, whilst the latter led to a criticism of – and severe crisis over – the problematic agreement reached between the US and the EU with the Privacy Shield. On a daily basis, this area undertakes to strengthen the response of the YNAP Group and to gradually make it more structured and highly reactive to regulatory effects and changes that govern all aspects of information assets, with a particular focus on personal and transactional data (PCI-DSS). YNAP places the greatest emphasis on ensuring online security by using the strictest security systems and standards and by effectively and faithfully applying applicable regulations. The approach continues to be sensitive to the local protection of the rights of end users resulting in a better experience aimed at the local perception of issues centred around privacy and the handling of personal data. Furthermore, in the context of establishing a task force capable of reacting to regulatory requirement and up to the task of working with competent authorities, the YNAP Group has proposed the establishment of a Group Data Protection Officer to screen impacted projects and support the internal team in implementing programmes. Therefore, in order to protect the confidentiality, integrity and availability of information related to clients, employees and partners, the Group undertakes to address projects by basing its approach on the ISO/IEC 27001 standard. This framework is meant to guarantee a high level of security by introducing a formal process of Information Risk Analysis based on an
CONSOLIDATED INTERIM FINANCIAL STATEMENTS AS AT 30 JUNE 2017 | 27
internationally recognised methodology and an approach by design. This risk analysis allows the Information Risk Committee, established within the framework, to assess the information risk trends on a quarterly basis and take the appropriate preventive actions. The management system is designed to include and satisfy all regulatory requirements to which the Group is subject from an information perspective and, at the same time, to optimise efforts and share the technological solutions and techniques adopted. The entire framework is based on a risk analysis and continuous improvement approach (Deming Cycle), which guarantees a high level of effectiveness and ensures that the challenges in terms of security and privacy of information that the e-commerce sector currently needs to address.
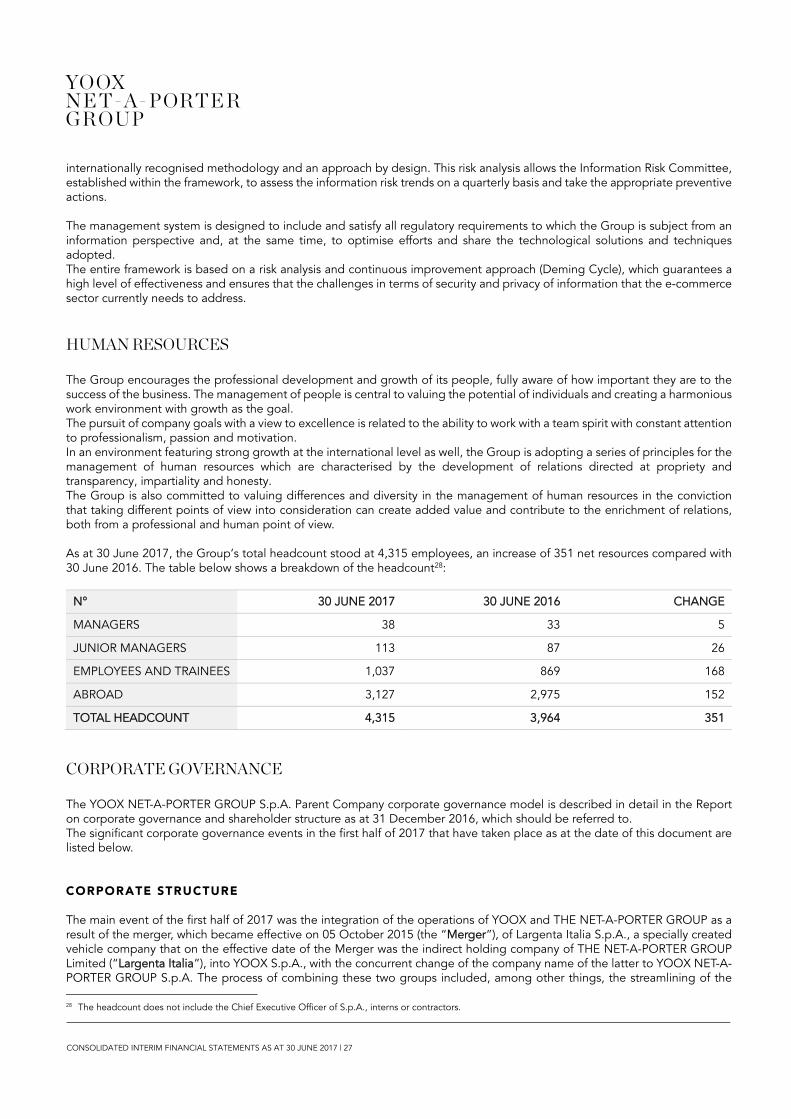
HUMAN RESOURCES The Group encourages the professional development and growth of its people, fully aware of how important they are to the success of the business. The management of people is central to valuing the potential of individuals and creating a harmonious work environment with growth as the goal. The pursuit of company goals with a view to excellence is related to the ability to work with a team spirit with constant attention to professionalism, passion and motivation. In an environment featuring strong growth at the international level as well, the Group is adopting a series of principles for the management of human resources which are characterised by the development of relations directed at propriety and transparency, impartiality and honesty. The Group is also committed to valuing differences and diversity in the management of human resources in the conviction that taking different points of view into consideration can create added value and contribute to the enrichment of relations, both from a professional and human point of view. As at 30 June 2017, the Group’s total headcount stood at 4,315 employees, an increase of 351 net resources compared with 30 June 2016. The table below shows a breakdown of the headcount28:
N° 30 JUNE 2017 30 JUNE 2016 CHANGE
MANAGERS 38 33 5
JUNIOR MANAGERS 113 87 26
EMPLOYEES AND TRAINEES 1,037 869 168
ABROAD 3,127 2,975 152
TOTAL HEADCOUNT 4,315 3,964 351
CORPORATE GOVERNANCE The YOOX NET-A-PORTER GROUP S.p.A. Parent Company corporate governance model is described in detail in the Report on corporate governance and shareholder structure as at 31 December 2016, which should be referred to. The significant corporate governance events in the first half of 2017 that have taken place as at the date of this document are listed below. CORPORATE STRUCTURE The main event of the first half of 2017 was the integration of the operations of YOOX and THE NET-A-PORTER GROUP as a result of the merger, which became effective on 05 October 2015 (the “Merger”), of Largenta Italia S.p.A., a specially created vehicle company that on the effective date of the Merger was the indirect holding company of THE NET-A-PORTER GROUP Limited (“Largenta Italia”), into YOOX S.p.A., with the concurrent change of the company name of the latter to YOOX NET-A-PORTER GROUP S.p.A. The process of combining these two groups included, among other things, the streamlining of the
28 The headcount does not include the Chief Executive Officer of S.p.A., interns or contractors.

CONSOLIDATED INTERIM FINANCIAL STATEMENTS AS AT 30 JUNE 2017 | 28
corporate structure that primarily led to the combination of two Group subsidiaries headquartered in the United States. Specifically, on 01 October 2016, Net-A-Porter LLC, an indirect subsidiary of THE NET-A-PORTER GROUP Ltd with registered offices in the state of New York, was merged into YOOX Corporation, a company with registered offices in Delaware that is a wholly-owned subsidiary of YOOX NET-A-PORTER GROUP S.p.A. The company resulting from the merger, which changed its name to YNAP Corporation, is currently 70.8% held by THE NET-A-PORTER GROUP Ltd and 29.2% held by YOOX NET-A-PORTER GROUP S.p.A. Furthermore, on 28 November 2016, a joint venture agreement was announced with Symphony Investments, a company controlled by Mohamed Alabbar, to create an undisputed leader in luxury e-commerce in the Middle East, through a partnership capable of grasping the huge potential for growth in this area. Pursuant to the provisions of this agreement, on 20 January 2017, YNAP Middle East Holding Limited was first established: this is a UK company that is currently 67% owned by THE NET-A-PORTER GROUP Ltd and 33% owned by Symphony Global LLC. YNAP Middle East Holding Limited shall therefore be fully consolidated by YNAP. Subsequently, in order to establish local operating activities and fully seize the significant growth potential of this area, YNAP Middle East General Trading Limited was established. This is an operating company with registered office in Dubai that is 49% directly controlled by YNAP Middle East Holding and 51% by the vehicle company established in Dubai International Financial Center E-Lux Middle East Holding Limited. ASSIGNMENT OF SHARES FOLLOWING THE EXERCISE OF STOCK OPTIONS On 12 January 2017, 78,000 YNAP ordinary shares were granted, following the exercise of 1,500 options whose details are described in the table below:
STOCK OPTION PLANS ASSIGNMENT DATE 106.5 59.17 TOTAL OPTIONS TOTAL SHARES AFTER DIVISION
2003 – 2005 04/02/2009 1,000 1,000 52,000
2006 – 2008 03/03/2007 500 500 26,000
TOTAL 1,000 500 1,500 78,000
On 10 May 2017, 74,984 YNAP ordinary shares were granted following the exercise of 1,442 options relating to the 2007-2012 Stock Option Plan at a strike price of Euro 59.17 per option. As a result of this, the new share capital issued by YNAP S.p.A. is equal to Euro 1,338,942.89 represented by 133,894,289 shares with no par value, including 90,988,151 ordinary shares and 44,906,138 B Shares without voting rights. STOCK GRANT PLAN On 27 April 2012, the Shareholders’ Meeting, pursuant to Article 114-bis of Legislative Decree 58/1998, approved the establishment of an incentive and loyalty plan known as the Stock Grant Plan for employees of the Issuer and companies directly or indirectly controlled by it, to be implemented by the granting, free of charge, of a total of 550,000 ordinary shares in the Company, giving the Board of Directors the mandate to adopt the relative regulations. At the date of this Document, the Stock Grant Plan had not been implemented. For more information on the Stock Grant Plan and the relative characteristics, refer to the prospectus produced pursuant to Article 84-bis of the Issuers’ Regulation, which can also be consulted on the Company’s website www.ynap.com (Corporate Governance / Company Documents Section). 2015-2025 STOCK OPTION PLAN AND GRANTING OF OPTIONS RELATING TO THE 2015-2025 STOCK OPTION PLAN Pursuant to the 2015-2025 Stock Option Plan, during the first half of 2017 the Company made the following stock grants:
on 18 April 2017, the granting to 38 beneficiaries of 610,000 options valid for the subscription of 610,000 YNAP ordinary shares;

CONSOLIDATED INTERIM FINANCIAL STATEMENTS AS AT 30 JUNE 2017 | 29
on 21 June 2017, the granting to 2 beneficiaries of 72,000 options valid for the subscription of 72,000 YNAP ordinary shares;
For more information regarding the main characteristics of the Plan, please refer to the Prospectus issued pursuant to Article 84-bis of Consob Regulation 11971/1999 (as updated on 31 March 2017, available on the Company’s website www.ynap.com (Governance Section - Documents, Principles and Procedures - Corporate Documents). APPLICATION OF THE DISCLOSURE OBLIGATION SIMPLIFICATION SCHEME IN COMPLIANCE WITH CONSOB RESOLUTION 18079 OF 20 JANUARY 2012 Pursuant to article 3 of the Consob Resolution 18079 of 20 January 2012, the Company decided to join the opt-out regime described in Article 70, paragraph 8, and 71, paragraph 1-bis, of the Consob Regulation 11971/99 (as later amended and supplemented), taking advantage of the possibility of exemption from the obligation of the publication of the information documents described in Annex 3B to the aforementioned Consob Regulation on the occasion of significant merger, demerger, capital increase operations through the contribution of assets in kind, acquisitions and transfers. BOARD OF DIRECTORS The Issuer’s Board in office at the date of this Report comprises 11 (eleven) members:
7 (seven) members were appointed by the General Meeting of 30 April 2015, based on the two lists presented (six members were taken from List 1, presented by the outgoing Board of Directors, and the remainder were taken from List 2, presented by a group of institutional investors) pursuant to the articles of association in force as at the said date; The following persons were appointed as Directors based on the two lists presented:
Federico Marchetti (Executive Director)
Robert Kunze-Concewitz (Lead Independent Director)
Raffaello Napoleone (Chairman)
Stefano Valerio (Vice-Chairman - Executive Director)
Laura Zoni
Catherine Gérardin Vautrin
Alessandro Foti
Director Richard Lepeu was appointed by the General Meeting held on 21 July 2015 with effect from the Effective Date of the Merger;
2 (two) independent directors Eva Chen and Vittorio Radice were appointed by the Ordinary Shareholders’ Meeting held on 16 December 2015; and
At the recommendation of the Board of Directors, Director Cedric Bossert was appointed by the Ordinary Shareholders’ Meeting held on 21 April 2017 to replace resigning Director Gary Saage, who had been appointed by the Shareholders’ Meeting held on 21 July 2015.
The Board will remain in office until the date of the shareholders’ meeting called for the approval of the financial statements as at 31 December 2017.
CONSOLIDATED INTERIM FINANCIAL STATEMENTS AS AT 30 JUNE 2017 | 30
BOARD OF STATUTORY AUDITORS On 30 April 2015, the Shareholders’ Meeting appointed the Board of Statutory Auditors for the three-year period 2015-2017. It is composed of:
Marco Maria Fumagalli (Chairman)
Giovanni Naccarato (Standing Auditor)
Patrizia Arienti (Standing Auditor)
Andrea Bonechi (Alternate Auditor)
Nicoletta Maria Colombo (Alternate Auditor) APPROVAL OF THE SEPARATE FINANCIAL STATEMENTS AS AT 31 DECEMBER 2016 The Shareholders’ Meeting, which was held at a single ordinary session on 21 April 2017, approved the separate financial statements for the year ending 31 December 2016, and decided to increase the legal reserve to Euro 267,482.61 equal to 20% of the share capital subscribed and paid up at 31 December 2016, out of the “Retained earnings and losses reserve,” and to cover the result for the year by using the “Retained earnings and losses reserve” in the amount of Euro 24,758,739.88 and by partially using the “Share premium reserve” in the amount of Euro 19,162,077.48. REMUNERATION REPORT On 21 April 2017 the Shareholders’ Meeting approved, in a non-binding vote, Section I of the Remuneration Report prepared pursuant to Article 123-ter of Legislative Decree 58/1998 and Article 84-quater of Consob Regulation 11971/1999, as well as in accordance with Annex 3A, Tables 7-bis and 7-ter of the same Regulation PURCHASE AND DISPOSAL OF TREASURY SHARES At their meeting of 21 April 2017, the shareholders approved, with the majorities specified in Article 44-bis, paragraph 2 of Consob Regulation 11971/1999 for the purposes of the so-called whitewash, the authorisation of the purchase and disposal of treasury shares, in compliance with Articles 2357 and 2357-ter of the Italian Civil Code and Article 132 of the TUF and related implementation provisions, revoking the authorisation to purchase treasury shares approved by the shareholders’ meeting of 27 April 2016. The authorisation for the purchase and disposal of treasury shares is aimed at allowing the Company to initiate treasury share purchase programmes for the purposes set forth in Article 5 of Regulation (EU) 596/2014 (Market Abuse Regulation, hereinafter “MAR”), as may be expanded to the practices allowed pursuant to Article 13 of the MAR and, thus, to allocate treasury shares held (a) to service programmes for options on shares or other grants of shares to employees and members of the administration or control bodies of the issuer or an associate, or, where permitted by the practices allowed pursuant to Article 13 of the MAR, a subsidiary; (b) to service the conversion of bonds; and (c) for the subsequent elimination, with no change in share capital, and within any deadlines approved by the competent corporate bodies. The authorisation for such purchases was granted for a period of 18 months from the date of the resolution. The authorisation for the use of treasury shares was granted without time limits. As at the date of this document, the Company holds 17,339 treasury shares in its portfolio, equal to 0.019% of its current ordinary share capital.

CONSOLIDATED INTERIM FINANCIAL STATEMENTS AS AT 30 JUNE 2017 | 31
DIRECTORS’ APPOINTMENTS COMMITTEE The current Directors’ Appointments Committee was established by Board resolution of 30 April 2015, as subsequently supplemented by a resolution of the Board of Directors of 11 November 2015. It consists of three non-executive directors, two of whom, including the Chairman, are independent, namely:
Alessandro Foti – Independent Director – Chairman;
Richard Lepeu – Non-Executive Director;
Laura Zoni – Independent Director. COMPENSATION COMMITTEE The current Compensation Committee was established by the Board resolution of 30 April 2015 and comprises three Non-executive directors, the majority of whom are independent, namely:
Robert Kunze-Concewitz – Independent Director – acting as Chairman;
Catherine Gérardin Vautrin – Independent Director;
Raffaello Napoleone – non-executive director. CONTROL AND RISKS COMMITTEE The current Control and Risk Committee was established by the Board resolution of 30 April 2015 and comprises three Non-executive directors, all of whom are independent, namely:
Alessandro Foti – Independent Director – Chairman;
Catherine Gérardin Vautrin – Independent Director;
Raffaello Napoleone – independent director; RELATED-PARTY TRANSACTIONS COMMITTEE: The Committee for Related-Party Transactions, appointed at the Board meeting of 30 April 2015, is composed of:
Catherine Gérardin Vautrin – Independent Director - Chairwoman;
Robert Kunze-Concewitz – Independent Director;
Alessandro Foti – Independent Director. SUPERVISORY BODY PURSUANT TO LEGISLATIVE DECREE 231/2001 The Supervisory Body, in office until the approval of the financial statements as at 31 December 2017, was first appointed by the Board on 30 April 2015 and comprises three members: Rossella Sciolti, an external member, as Chairperson, Isabella Pedroni, an external member, and Matteo James Moroni, an internal member and Internal Audit Manager of the Issuer.

CONSOLIDATED INTERIM FINANCIAL STATEMENTS AS AT 30 JUNE 2017 | 32
DIRECTOR RESPONSIBLE FOR PREPARING THE FINANCIAL STATEMENTS The Issuer’s Board of Directors in office on 24 April 2015 appointed Enrico Cavatorta as Chief Financial and Corporate Officer, effective as of 27 April 2015. As of 1 May 2015, he was also assigned the role of Director responsible for preparing the financial statements, pursuant to Article 154-bis of Legislative Decree 58/1998.
SIGNIFICANT EVENTS AFTER THE END OF THE PERIOD ASSIGNMENT OF SHARES FOLLOWING THE EXERCISE OF STOCK OPTIONS After the end of the half year, on 12 July and 28 July 2017, a total of 82,004 YNAP ordinary shares were granted following the exercise of 1,577 options relating to the 2006-2008 Stock Option Plan at a strike price of Euro 59.17 per option. As a result of the above, YNAP S.p.A.’s new share capital as at the date of this Report amounted to Euro 1,339,762.93, represented by 133,976,293 shares with no par value, of which 91,070,155 ordinary shares and 42,906,138 B Shares. ONLINE FLAGSHIP STORES In July 2017, YOOX NET-A-PORTER GROUP S.p.A. and Ferrari S.p.A. signed a long-term global agreement for the design and management of Ferrari’s new Online Flagship Store, which already benefits from a consolidated customer base and a substantial e-commerce business launch. The launch is envisioned for the first quarter of 2018. UPDATES ON INTEGRATION In July, the Group successfully achieved a further significant milestone with the launch of the first Online Flagship Store on the new front-end platform. This outcome further enhances the functionality of the Group's platform with sophisticated business tools, such as precision marketing and merchandising and also allows for greater customisation of the interface, as well as full independence of use by both internal and external operations of the Group.
BUSINESS OUTLOOK YOOX NET-A-PORTER GROUP expects to achieve net revenue growth in line with its Five-Year plan and improvement in adjusted EBITDA margin in 2017: as leader in the three luxury e-commerce segments where it does business, the Group boasts a unique positioning to best support the entire luxury sector in the full realisation of the digital potential. In particular, it is expected that the Multi-Brand In-Season business line will further enrich its unique brand portfolio with new prestigious brands and exclusive capsule collections, with further important developments in the fine jewellery and watches categories and with the MR PORTER private label. In addition, this business line will further enhance its own range of luxury services and content, with a specific focus on the high spending customer base. It is expected that the Off-Season Multi-brand business line will mainly benefit from the launch of THE OUTNET international localisation and further enrichment in the offering range, including the debut of the YOOX private label. Lastly, it is expected that Online Flagship Stores business line growth will benefit from the launch of isabelamarant.com as well as from significant progress in its own omni-channel offering and significant front-end platform improvements. The Group expects to invest between Euro 160 million and Euro 170 million in 2017, mainly in technology, in order to achieve important goals in the integration process, such as the launch of the new front-end platform for THE OUTNET and for select Online Flagship Stores and the completion of the omni-stock programme for the Off-Season business. By the end of the year, the Group will open a new establishment and a distribution centre in Dubai, complete the expansion of the Interporto logistics centre in Bologna and will continue to work on completing the In-Season logistics hub in Milan.

CONSOLIDATED INTERIM FINANCIAL STATEMENTS AS AT 30 JUNE 2017 | 33
ANNEXES TO THE DIRECTORS’ REPORT ANNEX 1: INCENTIVE PLANS AND IMPACT ON THE RECLASSIFIED CONSOLIDATED INCOME STATEMENT Impact of incentive plans in the first half of 2017:
THOUSAND EURO 30 JUNE 2017 % TOTAL 30 JUNE 2016 % TOTAL
FULFILMENT COSTS (99,971) (88,518)
of which incentive plans (51) 0.8% (17) 0.3%
SALES AND MARKETING COSTS (124,926) (106,790)
of which incentive plans (505) 7.7% (754) 12.7%
GENERAL EXPENSES (93,525) (86,178)
of which incentive plans (5,998) 91.5% (5,143) 87.0%
INCENTIVE PLANS TOTAL (6,555) 100.0% (5,914) 100.0%

CONSOLIDATED INTERIM FINANCIAL STATEMENTS AS AT 30 JUNE 2017 | 34

CONDENSED CONSOLIDATED INTERIM FINANCIAL STATEMENTS AS AT 30 JUNE 2017 YNAP GROUP | 35
CONDENSED CONSOLIDATED INTERIM FINANCIAL STATEMENTS AS AT 30 JUNE 2017 YNAP GROUP

CONDENSED CONSOLIDATED INTERIM FINANCIAL STATEMENTS AS AT 30 JUNE 2017 YNAP GROUP | 36

CONDENSED CONSOLIDATED INTERIM FINANCIAL STATEMENTS AS AT 30 JUNE 2017 YNAP GROUP | 37
Contents CONSOLIDATED FINANCIAL STATEMENTS AS AT 30 JUNE 2017 PREPARED IN COMPLIANCE WITH INTERNATIONAL FINANCIAL REPORTING STANDARDS (IFRS) 39 CONSOLIDATED INCOME STATEMENT 39 CONSOLIDATED STATEMENT OF COMPREHENSIVE INCOME 40 CONSOLIDATED STATEMENT OF FINANCIAL POSITION 41 STATEMENT OF CHANGES IN CONSOLIDATED ’EQUITY AS AT 30/06/2017 AND 30/06/2016 42 CONSOLIDATED STATEMENT OF CASH FLOWS 44 NOTES TO THE CONDENSED INTERIM CONSOLIDATED FINANCIAL STATEMENTS AS AT 30 JUNE 2017 45 ANNEXES 92

CONDENSED CONSOLIDATED INTERIM FINANCIAL STATEMENTS AS AT 30 JUNE 2017 YNAP GROUP | 38

CONDENSED CONSOLIDATED INTERIM FINANCIAL STATEMENTS AS AT 30 JUNE 2017 YNAP GROUP | 39
CONSOLIDATED FINANCIAL STATEMENTS AS AT 30 JUNE 2017 PREPARED IN COMPLIANCE WITH INTERNATIONAL FINANCIAL REPORTING STANDARDS (IFRS) (1) CONSOLIDATED INCOME STATEMENT
THOUSANDS OF EUROS NOTES 30/06/2017 30/06/2016
NET REVENUES 8.1 1,034,106 897,038
COST OF GOODS SOLD 8.2 (619,604) (542,154)
FULFILMENT COSTS 8.3 (107,114) (94,591)
SALES AND MARKETING COSTS 8.4 (124,929) (106,792)
GENERAL EXPENSES 8.5 (138,506) (121,725)
OTHER INCOME AND EXPENSES 8.6 (4,638) (2,795)
NON-RECURRING EXPENSES 8.7 - -
OPERATING PROFIT 8.8 39,314 28,982
INCOME FROM EQUITY INVESTMENTS 8.9 39 239
FINANCIAL INCOME 8.10 7,914 12,929
FINANCIAL EXPENSES 8.10 (17,889) (13,952)
PROFIT BEFORE TAX 29,378 28,198
TAXES 8.11 (8,793) (9,363)
CONSOLIDATED NET INCOME FOR THE PERIOD 20,585 18,835
OF WHICH:
ATTRIBUTABLE TO THE OWNERS OF THE GROUP 20,876 18,835
ATTRIBUTABLE TO NON-CONTROLLING INTERESTS (291) -
BASIC EARNINGS PER SHARE 8.12 0.16 0.14
DILUTED EARNINGS PER SHARE 8.12 0.15 0.14
(1) The financial statements, which were prepared in accordance with CONSOB Resolution 15519 of 27 July 2006 and CONSOB Communication DEM/6064293 of 28 July 2006, are annexed to the notes to the condensed consolidated interim financial statements at 30 June 2017.

CONDENSED CONSOLIDATED INTERIM FINANCIAL STATEMENTS AS AT 30 JUNE 2017 YNAP GROUP | 40
CONSOLIDATED STATEMENT OF COMPREHENSIVE INCOME
NOTES 30/06/2017 30/06/2016
THOUSANDS OF EUROS
CONSOLIDATED NET INCOME FOR THE PERIOD 20,585 18,835
OTHER COMPONENTS OF COMPREHENSIVE INCOME, NET OF TAX EFFECTS
FOREIGN CURRENCY TRANSLATION DIFFERENCES 8.23 (53,516) (198,182)
PROFIT/(LOSS) FROM CASH FLOW HEDGES 8.23 1,739 426
TOTAL OTHER COMPONENTS OF COMPREHENSIVE INCOME WHICH WILL BE (OR COULD BE) RECLASSIFIED IN THE INCOME STATEMENT
(51,777) (197,757)
NET CHANGE IN RETAINED EARNINGS AND ACTUARIAL LOSSES RELATING TO EMPLOYEE BENEFITS
8.23 3 (11)
TOTAL OTHER COMPONENTS OF COMPREHENSIVE INCOME THAT WILL NOT BE RECLASSIFIED IN THE INCOME STATEMENT
3 (11)
TOTAL CONSOLIDATED COMPREHENSIVE NET INCOME FOR THE PERIOD (31,189) (178,933)
OF WHICH:
ATTRIBUTABLE TO THE OWNERS OF THE GROUP (30,899) (178,933)
ATTRIBUTABLE TO NON-CONTROLLING INTERESTS (291) -

CONDENSED CONSOLIDATED INTERIM FINANCIAL STATEMENTS AS AT 30 JUNE 2017 YNAP GROUP | 41
CONSOLIDATED STATEMENT OF FINANCIAL POSITION
THOUSANDS OF EUROS NOTES 30/06/2017 31/12/2016
NON-CURRENT ASSETS
PROPERTY, PLANT AND EQUIPMENT 8.13 140,404 130,586
INTANGIBLE ASSETS WITH FINITE USEFUL LIFE 8.14 466,966 461,460
GOODWILL 8.15 1,199,341 1,231,769
EQUITY INTERESTS IN ASSOCIATES 8.16 740 701
DEFERRED TAX ASSETS 8.17 56,313 53,043
OTHER NON-CURRENT FINANCIAL ASSETS 8.18 2,730 2,837
TOTAL NON-CURRENT ASSETS 1,866,493 1,880,397
CURRENT ASSETS
INVENTORIES 8.19 646,268 578,200
TRADE RECEIVABLES 8.20 40,573 32,387
OTHER CURRENT ASSETS 8.21 36,697 48,171
CASH AND CASH EQUIVALENTS 8.22 186,518 155,465
CURRENT FINANCIAL ASSETS 8.22 39,810 66,995
TOTAL CURRENT ASSETS 949,866 881,218
TOTAL ASSETS 2,816,359 2,761,615
EQUITY
SHARE CAPITAL 1,339 1,337
RESERVES 1,790,071 1,833,826
RETAINED EARNINGS AND LOSSES RESERVE 120,076 66,900
CONSOLIDATED NET INCOME FOR THE PERIOD 20,585 33,930
EQUITY ATTRIBUTABLE TO SHAREHOLDERS OF THE PARENT 8.23 1,925,560 1,935,994
EQUITY ATTRIBUTABLE TO THIRD PARTIES 8.23 6,511 -
TOTAL CONSOLIDATED EQUITY 1,932,071 1,935,994
NON-CURRENT LIABILITIES
MEDIUM-/-LONG-TERM FINANCIAL LIABILITIES 8.25 82,010 98,982
EMPLOYEE BENEFIT LIABILITIES 8.26 149 153
PROVISIONS FOR RISKS AND NON-CURRENT CHARGES 8.28 - -
DEFERRED TAX LIABILITIES 8.27 72,594 77,140
OTHER MEDIUM-/LONG-TERM PAYABLES 8.31 8,099 8,367
TOTAL NON-CURRENT LIABILITIES 162,852 184,643
BANK LOANS AND OTHER CURRENT FINANCIAL LIABILITIES 8.25 60,774 17,639
PROVISIONS FOR RISKS AND CHARGES 8.28 40,734 58,748
TRADE PAYABLES 8.29 478,840 399,412
TAX LIABILITIES 8.30 23,271 24,192
OTHER PAYABLES 8.31 117,817 140,988
TOTAL CURRENT LIABILITIES 721,435 640,978
TOTAL CONSOLIDATED EQUITY AND LIABILITIES 2,816,359 2,761,615

ST
AT
EM
EN
T O
F C
HA
NG
ES
IN
CO
NS
OL
IDA
TE
D E
QU
ITY
AS
AT
30
JU
NE
20
17
T
HO
US
AN
DS
OF
EU
RO
S
SH
AR
E
CA
PIT
AL
SH
AR
E
PR
EM
IUM
R
ESE
RV
E
AN
D
OT
HE
R
EQ
UIT
Y-R
ELA
TE
D
RE
SE
RV
ES
LE
GA
L R
ESE
RV
E
TR
EA
SU
RY
SH
AR
E
AC
QU
ISIT
ION
R
ESE
RV
E
CA
SH
FLO
W
HE
DG
E
RE
SE
RV
E
IAS 1
9
RE
SE
RV
E
ST
OC
K
OP
TIO
N
RE
SE
RV
E
OT
HE
R
RE
SE
RV
ES
T
RA
NSLA
TIO
N
RE
SE
RV
E
RE
TA
INE
D
EA
RN
ING
S
OR
LO
SS
ES
CA
RR
IED
FO
RW
AR
D
CO
NSO
LID
AT
ED
N
ET
IN
CO
ME
SH
AR
EH
OLD
ER
S’
EQ
UIT
Y
AT
TR
IBU
TA
BLE
T
O N
ON
-C
ON
TR
OLL
ING
IN
TE
RE
ST
S
TO
TA
L
TO
TA
L 3
1 D
EC
EM
BE
R
2016
1,3
37
2,0
41
,05
8
260
(162
)(8
24
)(6
0)
34
,33
1-
(240,7
77)
66
,90
03
3,9
30
-1
,93
5,9
94
SH
AR
E C
AP
ITA
L
INC
RE
ASE
S
1
- -
--
--
- -
--
--
INC
RE
ASE
S IN
R
ESE
RV
ES F
OR
SH
AR
E-
BA
SE
D P
AY
ME
NT
S
- 97
--
--
6,5
55
13
,81
0
--
-6
,80
22
7,2
64
OT
HE
R C
HA
NG
ES
- (1
9,1
62)
7-
--
--
-5
3,0
86
(33,9
30)
--
TO
TA
L E
FFE
CT
S
RE
SU
LTIN
G F
RO
M
TR
AN
SA
CT
ION
S W
ITH
SH
AR
EH
OLD
ER
S
1,3
38
2,0
21
,99
3
267
(162
)(8
24
)(6
0)
40
,88
61
3,8
10
(240,7
77)
11
9,9
86
-6
,80
21
,96
3,2
59
NE
T IN
CO
ME
FO
R T
HE
P
ER
IOD
-
- -
--
--
- -
-2
0,8
76
(291)
20
,58
5
OT
HE
R P
RO
FIT
S/L
OSSE
S
FO
R T
HE
C
OM
PR
EH
EN
SIV
E
INC
OM
E S
TA
TE
ME
NT
- -
--
1,7
39
3-
- (5
3,5
16
)-
--
(51,7
74)
TO
TA
L C
ON
SO
LID
AT
ED
C
OM
PR
EH
EN
SIV
E
INC
OM
E
- -
--
1,7
39
3-
- (5
3,5
16)
-2
0,8
76
(291
)(3
1,1
89)
TO
TA
L 3
0 J
UN
E 2
01
7
1,3
39
2,0
21
,99
3
267
(162
)915
(57
)4
0,8
86
13
,81
0
(294,2
93)
11
9,9
85
20
,87
66
,51
11
,93
2,0
71
CONDENSED CONSOLIDATED INTERIM FINANCIAL STATEMENTS AS AT 30 JUNE 2017 YNAP GROUP | 42

ST
AT
EM
EN
T O
F C
HA
NG
ES
IN
CO
NS
OL
IDA
TE
D E
QU
ITY
AS
AT
30
JU
NE
20
16
T
HO
USA
ND
S O
F E
UR
OS
SH
AR
E
CA
PIT
AL
SH
AR
E
PR
EM
IUM
R
ESE
RV
E
AN
D
OT
HE
R
EQ
UIT
Y-R
ELA
TE
D
RE
SE
RV
ES
LE
GA
L R
ESE
RV
E
TR
EA
SU
RY
SH
AR
E
AC
QU
ISIT
ION
R
ESE
RV
E
CA
SH
FLO
W
HE
DG
E
RE
SE
RV
E
IAS 1
9
RE
SE
RV
E
ST
OC
K
OP
TIO
N
RE
SE
RV
E
TR
AN
SLA
TIO
N
RE
SE
RV
E
RE
TA
INE
D
EA
RN
ING
S
ORL
OSSE
S
CA
RR
IED
FO
RW
AR
D
CO
NSO
LID
AT
ED
N
ET
IN
CO
ME
SH
AR
EH
OLD
ER
S’
EQ
UIT
Y
AT
TR
IBU
TA
BLE
T
O N
ON
-C
ON
TR
OLL
ING
IN
TE
RE
ST
S
TO
TA
L
TO
TA
L 31 D
EC
EM
BE
R 2
015
1,3
01
1,9
41
,65
8193
(162
)(3
93
)(4
7)
21
,98
2
4,9
91
50
,35
81
6,6
09
-2
,03
6,4
90
SH
AR
E C
AP
ITA
L IN
CR
EA
SE
S
36
99
,96
4-
--
--
--
--
10
0,0
00
INC
RE
ASE
S IN
RE
SE
RV
ES F
OR
SH
AR
E-B
ASE
D P
AY
ME
NT
S
- -
--
--
5,9
45
--
--
5,9
45
OT
HE
R C
HA
NG
ES
- (6
28)
67
--
--
-1
6,5
42
(16,6
09)
-(6
28
)
TO
TA
L E
FFE
CT
S R
ESU
LTIN
G F
RO
M
TR
AN
SA
CT
ION
S W
ITH
SH
AR
EH
OLD
ER
S
1,3
37
2,0
40
,99
4260
(162
)(3
93
)(4
7)
27
,92
7
4,9
91
66
,90
0-
-2
,14
1,8
07
NE
T IN
CO
ME
FO
R T
HE
PE
RIO
D
- -
--
--
- -
-1
8,8
35
-1
8,8
35
OT
HE
R P
RO
FIT
S/L
OSSE
S F
OR
TH
E
CO
MP
RE
HE
NSIV
E IN
CO
ME
STA
TE
ME
NT
-
--
-426
(11)
- (1
98
,18
2)
--
-(1
97,7
68)
TO
TA
L C
ON
SO
LID
AT
ED
C
OM
PR
EH
EN
SIV
E IN
CO
ME
-
--
-426
(11
)-
(198,1
82)
-1
8,8
35
-(1
78,9
32)
TO
TA
L 3
0 J
UN
E 2
01
6
1,3
37
2,0
40
,99
5260
(162
)33
(58
)2
7,9
27
(193,1
91)
66
,90
01
8,8
35
-1
,96
2,8
75
CONDENSED CONSOLIDATED INTERIM FINANCIAL STATEMENTS AS AT 30 JUNE 2017 YNAP GROUP | 43

CONDENSED CONSOLIDATED INTERIM FINANCIAL STATEMENTS AS AT 30 JUNE 2017 YNAP GROUP | 44
CONSOLIDATED STATEMENT OF CASH FLOWS
THOUSANDS OF EUROS NOTES 30/06/2017 30/06/2016
CONSOLIDATED NET INCOME FOR THE PERIOD 8.32 20,585 18,835
ADJUSTMENTS FOR:
TAXES FOR THE PERIOD 8.32 8,793 9,363
FINANCIAL EXPENSES DURING THE PERIOD 8.33 17,889 13,952
FINANCIAL INCOME DURING THE PERIOD 8.33 (7,914) (12,929)
SHARE OF EARNINGS FROM ASSOCIATES 8.33 (39) (239)
AMORTISATION AND IMPAIRMENT LOSSES FOR THE PERIOD 8.33 52,126 41,621
FAIR VALUE ADJUSTMENT OF STOCK OPTION PLANS 8.33 6,555 5,945
UNREALISED EFFECT OF CHANGES IN FOREIGN EXCHANGE RATES 8.33 (13,237) (9,264)
LOSSES/(GAINS) ON SALE OF NON-CURRENT ASSETS 8.33 - 101
PROVISIONS FOR EMPLOYEE BENEFITS 8.33 10 17
PROVISIONS FOR RISKS AND CHARGES 8.33 1,848 562
PAYMENT OF EMPLOYEE BENEFITS 8.33 (14) (15)
USE OF PROVISIONS FOR RISKS AND CHARGES 8.33 (19,862) (13,669)
CHANGES IN INVENTORIES 8.34 (68,067) 919
CHANGES IN TRADE RECEIVABLES 8.34 (8,186) 7,381
CHANGES IN TRADE PAYABLES 8.34 79,428 8,970
CHANGES IN OTHER CURRENT ASSETS AND LIABILITIES 8.35 (10,243) (40,742)
CASH FLOW FROM (USED IN) OPERATING ACTIVITIES 59,672 30,808
INCOME TAX PAID 8.32 (16,507) (5,748)
INTEREST AND OTHER FINANCIAL EXPENSES PAID 8.33 (5,748) (13,952)
INTEREST AND OTHER FINANCIAL INCOME RECEIVED 8.33 113 12,929
CASH FROM (USED IN) OPERATING ACTIVITIES 37,530 24,037
INVESTING ACTIVITIES
ACQUISITION OF PROPERTY, PLANT AND EQUIPMENT 8.36 (28,821) (4,934)
ACQUISITION OF INTANGIBLE ASSETS 8.37 (54,754) (40,404)
ACQUISITION OF EQUITY INVESTMENTS 8.38 - -
ACQUISITION OF OTHER NON-CURRENT FINANCIAL ASSETS 8.39 108 237
ACQUISITION OF SUBSIDIARIES, NET OF CASH AND CASH EQUIVALENTS - -
CASH FROM (USED IN) INVESTING ACTIVITIES (83,467) (45,101)
FINANCING ACTIVITIES
NEW SHORT-TERM LIABILITIES 8.42 45,164 37,866
REPAYMENT OF SHORT-TERM LIABILITIES 8.42 (837) (9,717)
NEW MEDIUM-/LONG-TERM FINANCIAL LIABILITIES 8.41 - -
REPAYMENT OF MEDIUM-/LONG-TERM FINANCIAL LIABILITIES 8.41 (15,248) (6,573)
PAYMENT FOR SHARE CAPITAL INCREASE AND SHARE PREMIUM RESERVE 8.40 20,726 100,000
INVESTMENTS IN FINANCIAL ASSETS 27,184 (5,691)
CASH FLOW FROM (USED IN) FINANCING ACTIVITIES 76,990 115,885
TOTAL CASH FLOW FOR THE PERIOD 31,053 94,821
CASH AND CASH EQUIVALENTS AT THE BEGINNING OF THE PERIOD 8.22 155,465 130,340
CASH AND CASH EQUIVALENTS AT THE END OF THE PERIOD 8.22 186,518 225,161
TOTAL CASH FLOW FOR THE PERIOD 31,053 94,821
CONDENSED CONSOLIDATED INTERIM FINANCIAL STATEMENTS AS AT 30 JUNE 2017 YNAP GROUP | 45
NOTES TO THE CONDENSED INTERIM CONSOLIDATED FINANCIAL STATEMENTS AT 30 JUNE 2017 1. GENERAL INFORMATION ABOUT THE GROUP YOOX NET-A-PORTER GROUP S.p.A. (hereinafter the “Company” or the “Parent Company”) is a joint stock company with its registered office at 17, Via Morimondo, Milan, Italy.
The YOOX NET-A-PORTER GROUP (hereinafter the “Group”), in addition to the Parent Company, comprises the UK group THE NET-A-PORTER GROUP Ltd, the US firm YNAP Corporation to manage sales in North America, the Japanese company YOOX Japan to manage sales in Japan, Mishang Trading (Shanghai) Co. Ltd and NAP Group China Ltd to manage sales in China, YOOX Asia Limited and NAP Group Asia Pacific Ltd to manage sales in Asia Pacific, and the holding companies of the equity investments Largenta Ltd, NAP International Ltd., and Shouke Ltd. The YOOX Group is active in electronic commerce and offers commercial services relating to clothing and fashion accessories, and more generally to anything that accessorises the person or the home, during free time, when relaxing or during leisure activities. 2. STATEMENT OF COMPLIANCE WITH IFRS AND GENERAL CRITERIA USED TO PREPARE THE
CONDENSED INTERIM FINANCIAL STATEMENTS These condensed consolidated interim financial statements, drawn up in accordance with IAS 34 – Interim financial statements, were prepared using the same accounting standards as were used to prepare the consolidated financial statements as at 31 December 2016, please refer to it for further details. The comparative figures reported in the presentation of the statement of financial position and the statement of cash flows are those provided for by IAS 34 (31 December 2016 for the statement of financial position and 30 June 2016 for the income statement, the statement of comprehensive income, the statement of changes in shareholders’ equity and the statement of cash flows). The figures for the first half of 2017 and the first half year of 2016 are reported in presenting the income statement, the Group having adopted the half year as the intermediate reference period. These condensed consolidated interim financial statements, which were prepared in accordance with IAS 34 and with the provisions of Article 154-ter of Legislative Decree 58 of 24 February 1998 (Consolidated Finance Law) as subsequently amended, do not include all the information required for the annual financial statements and must be read in conjunction with the Consolidated Financial Statements as at 31 December 2016. Specifically, the formats for the income statement, statement of comprehensive income, statement of financial position, statement of changes in equity and statement of cash flows were prepared in expanded form, and are the same as those used for the consolidated financial statements as at 31 December 2016. However, the notes provided below are presented in summary form, and thus, do not include all information required for annual financial statements. In line with the requirements of IAS 34, in order to avoid duplicating information which has already been published, the notes refer only to those components of the income statement, the statement of comprehensive income, the statement of financial position, the statement of changes in equity and the statement of cash flows which, owing to their composition, amount, nature or infrequency, are essential for understanding the financial position, operations and assets of the Group. The condensed consolidated interim financial statements as at 30 June 2017 consist of the income statement, statement of comprehensive income, statement of financial position, statement of changes in shareholders’ equity and statement of cash flows, in addition to these explanatory notes. In presenting these statements, comparative data have been presented as required by IAS 34, supplemented as noted above. CONSOLIDATED FINANCIAL STATEMENTS In accordance with CONSOB Resolution 15519 of 27 July 2006 and Communication DEM/6064293 of 28 July 2006 relating to financial statements, specific income statements, statements of financial position and statements of cash flows have been included showing significant relationships with related parties, in order to improve readability.

CONDENSED CONSOLIDATED INTERIM FINANCIAL STATEMENTS AS AT 30 JUNE 2017 YNAP GROUP | 46
As indicated above, the condensed consolidated interim financial statements as at 30 June 2017 were drawn up in accordance with the IFRS endorsed by the European Union, and comprise the following: Income statement The income statement is classified by function, which is considered to provide more meaningful information than classification by nature since it is more consistent with the reporting system used by management when evaluating the performance of the business. Statement of comprehensive income The statement of comprehensive income presents, in a single statement, the components of profit (loss) for the year and income and expenses recognised directly in shareholders’ equity for transactions not involving shareholders. Statement of financial position The statement of financial position presents current and non-current assets and current and non-current liabilities separately. For each item under assets and liabilities a description is provided in the notes of the amounts expected to be settled or recovered, within or after the 12-month period following the reporting date. Statement of changes in shareholders’ equity The statement of changes in shareholders’ equity reports the profit or loss for the year, including each item of revenue or cost, income or expense which, as required by IFRS and their interpretations, is recognised directly in equity, and the total of these items; total comprehensive profit or loss for the year, with separate presentation of the portion pertaining to owners of the Parent and any portion pertaining to non-controlling interests; the effect on each item of equity of changes to accounting standards and corrections of errors as required by the accounting treatment set out in IAS 8; and the balance of profit or loss carried forward at the start of the year and at the reporting date, together with the changes during the year. The notes to the condensed consolidated interim financial statements also present the amounts deriving from transactions with owners of the Parent and a reconciliation between the carrying amount of each share class, the share premium reserve and other reserves at the start and end of the financial year, showing each change separately. Statement of cash flows The statement of cash flows presents the cash flows from operating, investing and financing activities. Operating cash flows are presented using the indirect method, whereby profit or loss for the year or for the period is adjusted for non-monetary transactions, for all deferrals or provisions relating to previous or future operating receipts or payments and for revenue items relating to cash flows from investing or financing activity. The condensed consolidated interim financial statements show a comparison with the previous year’s figures. Where necessary in the case of changes to accounting standards or measurement or classification criteria, the comparative data are restated and reclassified to provide uniform and consistent information. 3. ACCOUNTING STANDARDS AND MEASUREMENT CRITERIA These condensed consolidated interim financial statements have been drawn up in accordance with IASB (International Accounting Standards Board) IFRS (International Financial Reporting Standards) and are endorsed by the European Union. “IFRS” also refers to the International Accounting Standards (“IAS”) currently in force, in addition to all the interpretation documents issued by the International Financial Reporting Interpretations Committee (“IFRIC”) previously known as the Standing Interpretations Committee (“SIC”).

CONDENSED CONSOLIDATED INTERIM FINANCIAL STATEMENTS AS AT 30 JUNE 2017 YNAP GROUP | 47
3.1 CHANGES TO ACCOUNTING STANDARDS, NEW ACCOUNTING STANDARDS, CHANGES TO ESTIMATES AND RECLASSIFICATIONS
NEW ACCOUNTING STANDARDS AND AMENDMENTS EFFECTIVE AS OF 1 JANUARY 2016 THAT ARE NOT RELEVANT FOR THE GROUP Amendments to IAS 12 - Recognition of Deferred Tax Assets for Unrealised Losses The amendments provide clarifications on the procedures for recognising deferred tax assets from unrealised losses on debt instruments measured at fair value. The amendments apply for fiscal years beginning on or after 1 January 2017. Amendments to IFRS 12 - Annual Improvements to IFRS Standards (2014-2016 Cycle). The amendments clarify that the disclosure requirements for equity investments in other entities also apply to equity investments classified as held for sale. The amendments apply for fiscal years beginning on or after 1 January 2017. Amendments to IAS 7 - Disclosure Initiative The amendments require entities to provide information allowing users of financial statements to assess changes in liabilities resulting from financing activities including monetary and non-monetary changes. The amendments apply for fiscal years beginning on or after 1 January 2017. NEW ACCOUNTING STANDARDS AND AMENDMENTS APPROVED BY THE EUROPEAN UNION AND NOT ADOPTED IN ADVANCE BY THE GROUP The new accounting standards or amendments that are mandatory for fiscal years beginning on or after 1 January 2018, which may be applied in advance, are specified below. The Group has decided not to adopt them in advance for the preparation of these condensed consolidated interim financial statements. IFRS 15 - Revenue from Contracts with Customers: IFRS 15 introduces a single general model to determine if, when and to what extent to recognise revenues. This standard replaces the revenue recognition criteria in IAS 18 - Revenue, IAS 11 - Construction Contracts and IFRIC 13 - Customer Loyalty Programmes. IFRS 15 applies for fiscal years beginning on or after 1 January 2018. Early adoption is permitted. During the first half of 2017, activities continued aimed at identifying circumstances considered potentially critical in relation to various contract types, identifying and quantifying potential impacts on the financial statements and on the financial data. From a preliminary analysis, no elements have been identified that could have significant impacts on the revenues recorded by the Group. The Group does not intend to adopt the new standard in advance. IFRS 9 - Financial Instruments: Published in July 2014, IFRS 9 replaces IAS 39 Financial Instruments: Recognition and Measurement. IFRS 9 introduces new provisions for the classification and measurement of financial instruments, a new model for expected losses for the calculation of impairment losses on financial assets and new general provisions for hedge accounting transactions. In addition, it includes provisions for the recognition and elimination of financial instruments for accounting purposes in keeping with the current IAS 39. IFRS 9 applies for fiscal years beginning on or after 1 January 2018. Early adoption is permitted. During the first half of 2017, there was a continuation of the process of assessing potential impacts resulting from the application of the new standard and defining the reporting to be issued in the explanatory notes to the financial statements, with reference to the envisioned scopes of updating. Preliminary assessments were carried out on the possible impacts of applying IFRS 9 based on the currently available information that could be subject to changes resulting from further detailed analysis. The Group does not expect significant effects on the consolidated financial statements resulting from the application of IFRS 9. The Group does not intend to adopt the new standard in advance. DOCUMENTS NOT YET APPROVED BY THE EUROPEAN UNION AS AT 30 JUNE 2017 IFRS 16 - Leases: Issued in January 2016, IFRS 16 introduced new principles for the recognition, measurement, presentation and disclosure of leases for both contractual counterparties. IFRS 16 applies for fiscal years beginning on or after 1 January 2019. The company may elect to apply IFRS 16 before that date in the event of the application of IFRS 15 - Revenue from Contracts with Customers. IFRS 16 replaces the previous standard IAS 17 - Leases, and related interpretations.

CONDENSED CONSOLIDATED INTERIM FINANCIAL STATEMENTS AS AT 30 JUNE 2017 YNAP GROUP | 48
During the first half of 2017, activity continued aimed at identifying potential critical issues existing within contracts covered by the scope of application of IFRS 16, identifying and quantifying potential impacts on the financial statements and verifying any possible adaptations of the financial reporting support systems. Specifically, the application of this standard will have significant impacts on the financial liabilities of YNAP Group and the recognition of the rights of use acquired as non-current assets. In this regard, analyses are in progress on contracts that, among other things, relate to office, warehouse, guesthouse and automobile use. IFRS 2: Classification and Measurement of Share-based Payment Transactions – In June 2016, the IASB issued amendments to IFRS 2 aimed at clarifying the recording of transactions involving share-based payments. These amendments are applicable starting 1 January 2018, but they may be applied in advance. Amendments to IFRS 4: Applying IFRS 9 Financial Instruments with IFRS 4 Insurance Contracts - The IASB issued this document in September 2018, and it is applicable starting 1 January 2018. Amendments to IAS 40 - Transfers of Investment Property In December 2016, the IASB published amendments to paragraph 57 of IAS 40. These amendments are applicable starting 1 January 2018, but they may be applied in advance. Annual Improvements to IFRS Standards (2014-2016 Cycle) - The improvements made to the IFRS with the issuance made by the IASB in December 2016, involved the following standards: IFRS 1 and IAS 28. IFRIC Interpretation 22: Foreign Currency Transactions and Advance Consideration - Issued in December 2016, IFRIC 22 provides clarifications on the recording of foreign currency transactions. Sale or Contribution of Assets between an Investor and its Associate or Joint Venture (Amendments to IFRS 10 and IAS 28) - The application date of these amendments was deferred indefinitely, but they may be adopted. 3.2 CRITERIA FOR CONSOLIDATION The Group’s consolidated financial statements comprise the Parent Company’s financial statements and those of the subsidiaries in which the Parent Company directly or indirectly holds the majority of voting rights and over which it exercises control, or from which it can make gains owing to its capacity to dictate financial and operating policy. The financial statements of the consolidated subsidiaries are prepared using the same time frame of reference and the same accounting principles as the Parent Company. The financial statements of subsidiaries are included in the consolidated financial statements from the date on which the Group takes control until this control ceases to exist. If the Group loses control of a subsidiary, the consolidated financial statements include the result of said subsidiary in proportion to the period in which the Group still had control. Any share of equity and reserves attributable to non-controlling interests in the subsidiaries and the share of the consolidated subsidiaries’ profit or loss for the year attributable to non-controlling interests are recorded separately in the consolidated statement of financial position and income statement. Changes in equity interests in subsidiaries which do not result in loss of control or increase the controlling stake are recorded among changes in equity. A list of fully consolidated companies is provided in Note 5 of these notes to the consolidated financial statements. Equity interests in associates and joint ventures Associates are those companies in which the Group has a considerable influence, but not control of their management or the power to decide financial and operating policies and gain benefit from the activity of these companies. Associates tend to be those companies in which the Group directly or indirectly holds 20%-50% of share capital or voting rights, including potential voting rights that can be exercised or converted. Associates are accounted for using the equity method and initially recognised at cost. If the Group’s share of the associates’ losses should exceed the carrying amount of the equity investment in said associate, the value of the investment is written off and the share of additional losses is recorded in the appropriate provisions insofar as the Group is obliged to cover its associates’ losses or fulfil obligations on its behalf. Unrealised profits and losses arising from transactions with associates are eliminated based on the equity interest held.

CONDENSED CONSOLIDATED INTERIM FINANCIAL STATEMENTS AS AT 30 JUNE 2017 YNAP GROUP | 49
Transactions eliminated on consolidation Transactions between Group companies are eliminated in full. Unrealised profits and losses from transactions with subsidiaries are also eliminated in full. Any portions of shareholders’ equity and profit (loss) attributable to non-controlling interests are determined according to voting rights held, excluding potential voting rights. Any positive differences resulting from the elimination of investments against the amount of shareholders’ equity booked at the date of initial consolidation are posted as maximum amounts under assets, liabilities and contingent liabilities, with the remainder posted to goodwill. Any negative differences resulting from elimination of investments against the amount of shareholders’ equity booked at the date of the initial consolidation are posted as minimum amounts under assets and liabilities, with the remainder entered in the income statement. 3.3 USE OF ESTIMATES In order to prepare the consolidated interim financial statements, the management is required to use estimates and assumptions which affect the carrying amounts of revenues, costs, assets and liabilities reported in the financial statements and the information regarding contingent assets and liabilities at the reporting date for the condensed consolidated interim financial statements. If, in the future, these estimates and assumptions, which are based on the management’s best evaluation, should differ from actual circumstances, they will be altered appropriately during the period in which the circumstances change and the effects of any changes will be immediately recognised in the income statement. For a more detailed description of the most important evaluation methods used for the Group, please refer to the indications given in the Annual Report as at 31 December 2016. It should also be pointed out that these evaluation processes, especially the more complex ones, such as determining any losses for non-current assets, are usually only conducted in full during the compiling of the annual financial statements, when all the required information is available, except in cases where there are impairment indicators that require an immediate evaluation of any losses. 4. APPROVAL OF THE INTERIM FINANCIAL STATEMENTS AS AT 30 JUNE 2017 The interim financial statements as at 30 June 2017 were approved by the Board of Directors on 02 August 2017. 5. SCOPE OF CONSOLIDATION The condensed consolidated half-year financial statements at 30 June 2017 include the financial statements of the Parent Company YOOX NET-A-PORTER GROUP S.p.A. and of the subsidiaries. A parent is deemed to have control when it is exposed to variable returns resulting from the equity investment and it has the power to influence the returns of the investee company or the right to manage the core business of said company. Subsidiaries of immaterial size and those where the actual exercising of voting rights is subject to major long-term restrictions are excluded from the scope of consolidation and valued at cost.
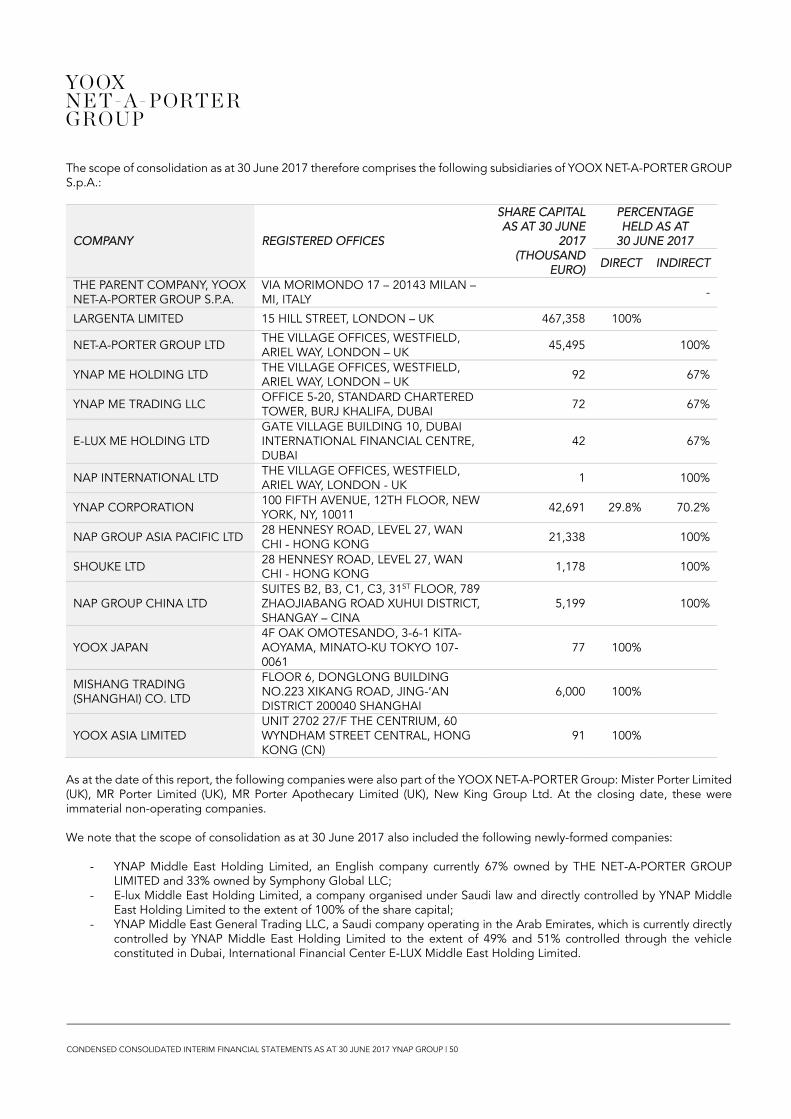
CONDENSED CONSOLIDATED INTERIM FINANCIAL STATEMENTS AS AT 30 JUNE 2017 YNAP GROUP | 50
The scope of consolidation as at 30 June 2017 therefore comprises the following subsidiaries of YOOX NET-A-PORTER GROUP S.p.A.:
COMPANY REGISTERED OFFICES
SHARE CAPITAL AS AT 30 JUNE
2017 (THOUSAND
EURO)
PERCENTAGE HELD AS AT
30 JUNE 2017
DIRECT INDIRECT
THE PARENT COMPANY, YOOX NET-A-PORTER GROUP S.P.A.
VIA MORIMONDO 17 – 20143 MILAN –MI, ITALY
-
LARGENTA LIMITED 15 HILL STREET, LONDON – UK 467,358 100%
NET-A-PORTER GROUP LTD THE VILLAGE OFFICES, WESTFIELD, ARIEL WAY, LONDON – UK
45,495 100%
YNAP ME HOLDING LTD THE VILLAGE OFFICES, WESTFIELD, ARIEL WAY, LONDON – UK
92 67%
YNAP ME TRADING LLC OFFICE 5-20, STANDARD CHARTERED TOWER, BURJ KHALIFA, DUBAI
72 67%
E-LUX ME HOLDING LTD GATE VILLAGE BUILDING 10, DUBAI INTERNATIONAL FINANCIAL CENTRE, DUBAI
42 67%
NAP INTERNATIONAL LTD THE VILLAGE OFFICES, WESTFIELD, ARIEL WAY, LONDON - UK
1 100%
YNAP CORPORATION 100 FIFTH AVENUE, 12TH FLOOR, NEW YORK, NY, 10011
42,691 29.8% 70.2%
NAP GROUP ASIA PACIFIC LTD 28 HENNESY ROAD, LEVEL 27, WAN CHI - HONG KONG
21,338 100%
SHOUKE LTD 28 HENNESY ROAD, LEVEL 27, WAN CHI - HONG KONG
1,178 100%
NAP GROUP CHINA LTD SUITES B2, B3, C1, C3, 31ST FLOOR, 789 ZHAOJIABANG ROAD XUHUI DISTRICT, SHANGAY – CINA
5,199 100%
YOOX JAPAN 4F OAK OMOTESANDO, 3-6-1 KITA-AOYAMA, MINATO-KU TOKYO 107-0061
77 100%
MISHANG TRADING (SHANGHAI) CO. LTD
FLOOR 6, DONGLONG BUILDING NO.223 XIKANG ROAD, JING-’AN DISTRICT 200040 SHANGHAI
6,000 100%
YOOX ASIA LIMITED UNIT 2702 27/F THE CENTRIUM, 60 WYNDHAM STREET CENTRAL, HONG KONG (CN)
91 100%
As at the date of this report, the following companies were also part of the YOOX NET-A-PORTER Group: Mister Porter Limited (UK), MR Porter Limited (UK), MR Porter Apothecary Limited (UK), New King Group Ltd. At the closing date, these were immaterial non-operating companies. We note that the scope of consolidation as at 30 June 2017 also included the following newly-formed companies:
- YNAP Middle East Holding Limited, an English company currently 67% owned by THE NET-A-PORTER GROUP LIMITED and 33% owned by Symphony Global LLC;
- E-lux Middle East Holding Limited, a company organised under Saudi law and directly controlled by YNAP Middle East Holding Limited to the extent of 100% of the share capital;
- YNAP Middle East General Trading LLC, a Saudi company operating in the Arab Emirates, which is currently directly controlled by YNAP Middle East Holding Limited to the extent of 49% and 51% controlled through the vehicle constituted in Dubai, International Financial Center E-LUX Middle East Holding Limited.

CONDENSED CONSOLIDATED INTERIM FINANCIAL STATEMENTS AS AT 30 JUNE 2017 YNAP GROUP | 51
As at 30 June 2017, the scope of consolidation also included (i) the newly established YNAP Middle East Holding Limited (the UK company that is currently 67% owned by THE NET-A-PORTER GROUP LIMITED and 33% owned by Symphony Global LLC) and (ii) its subsidiary, YNAP Middle East Trading (a Saudi Arabian company operating in the United Arab Emirates): The following exchange rates were used to convert the financial statements and account balances in currencies other than the
Euro as at 30 June 2017, 31 December 2016 and 30 June 2016 (source: www.bancaditalia.it):
EXCHANGE RATE AS AT 30/06/2017 AVERAGE EXCHANGE RATE FOR THE HALF-YEAR UNDER REVIEW
USD 1.1412 1.083
JPY 127.75 121.78
CNY 7.7385 7.4448
HKD 8.9068 8.4199
GBP 0.8793 0.8606
AED 4.1893 3.9758
RUB 67.545 62.806
AUD 1.4851 1.4453
CAD 1.4785 1.4453
KRW 1,304.6 1,236.3
EXCHANGE RATE AS AT 31/12/2016 AVERAGE EXCHANGE RATE FOR 2016
USD 1.0541 1.1069
JPY 123.40 120.20
CNY 7.3202 7.3522
HKD 8.1751 8.5922
GBP 0.8562 0.8195
AED 3.8696 4.0634
RUB 64.300 74.145
AUD 1.4596 1.4883
CAD 1.4188 1.4569
KRW 1,269.4 1,284.2
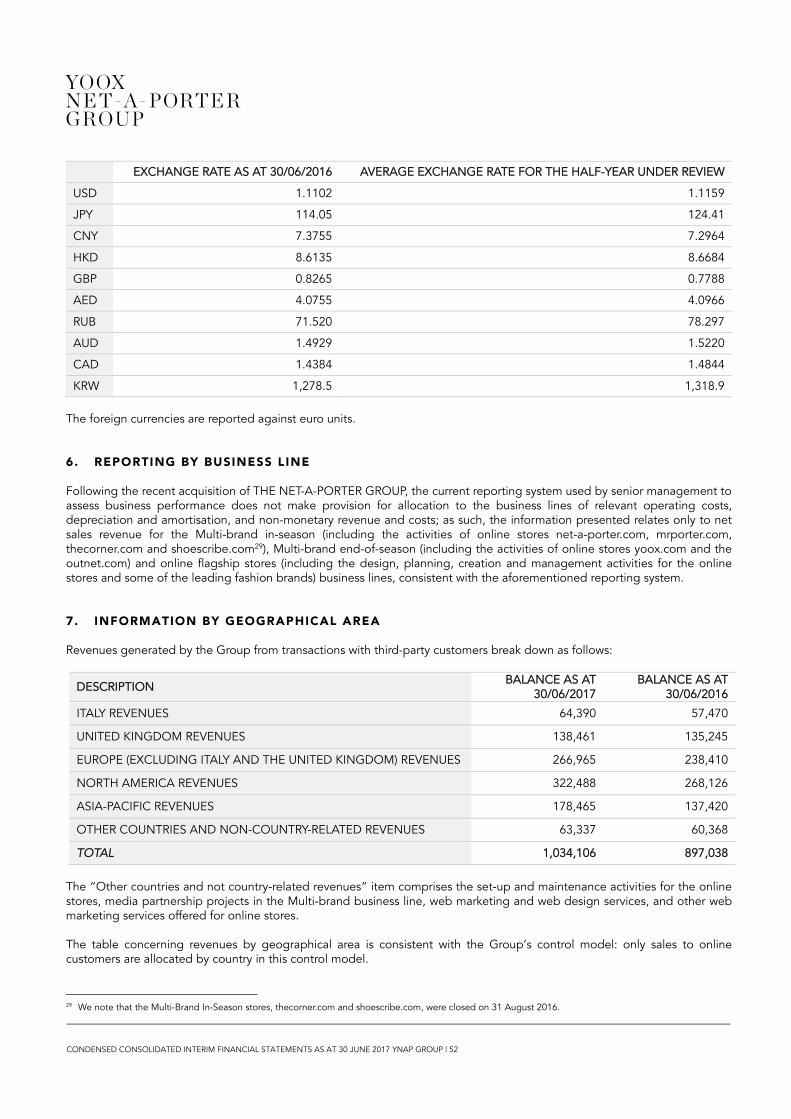
CONDENSED CONSOLIDATED INTERIM FINANCIAL STATEMENTS AS AT 30 JUNE 2017 YNAP GROUP | 52
EXCHANGE RATE AS AT 30/06/2016 AVERAGE EXCHANGE RATE FOR THE HALF-YEAR UNDER REVIEW
USD 1.1102 1.1159
JPY 114.05 124.41
CNY 7.3755 7.2964
HKD 8.6135 8.6684
GBP 0.8265 0.7788
AED 4.0755 4.0966
RUB 71.520 78.297
AUD 1.4929 1.5220
CAD 1.4384 1.4844
KRW 1,278.5 1,318.9
The foreign currencies are reported against euro units. 6. REPORTING BY BUSINESS LINE Following the recent acquisition of THE NET-A-PORTER GROUP, the current reporting system used by senior management to assess business performance does not make provision for allocation to the business lines of relevant operating costs, depreciation and amortisation, and non-monetary revenue and costs; as such, the information presented relates only to net sales revenue for the Multi-brand in-season (including the activities of online stores net-a-porter.com, mrporter.com, thecorner.com and shoescribe.com29), Multi-brand end-of-season (including the activities of online stores yoox.com and the outnet.com) and online flagship stores (including the design, planning, creation and management activities for the online stores and some of the leading fashion brands) business lines, consistent with the aforementioned reporting system. 7. INFORMATION BY GEOGRAPHICAL AREA Revenues generated by the Group from transactions with third-party customers break down as follows:
DESCRIPTION BALANCE AS AT
30/06/2017 BALANCE AS AT
30/06/2016
ITALY REVENUES 64,390 57,470
UNITED KINGDOM REVENUES 138,461 135,245
EUROPE (EXCLUDING ITALY AND THE UNITED KINGDOM) REVENUES 266,965 238,410
NORTH AMERICA REVENUES 322,488 268,126
ASIA-PACIFIC REVENUES 178,465 137,420
OTHER COUNTRIES AND NON-COUNTRY-RELATED REVENUES 63,337 60,368
TOTAL 1,034,106 897,038
The “Other countries and not country-related revenues” item comprises the set-up and maintenance activities for the online stores, media partnership projects in the Multi-brand business line, web marketing and web design services, and other web marketing services offered for online stores. The table concerning revenues by geographical area is consistent with the Group’s control model: only sales to online customers are allocated by country in this control model.
29 We note that the Multi-Brand In-Season stores, thecorner.com and shoescribe.com, were closed on 31 August 2016.

CONDENSED CONSOLIDATED INTERIM FINANCIAL STATEMENTS AS AT 30 JUNE 2017 YNAP GROUP | 53
In 2016 and 2017, no single third-party customer contributed more than 10% of the Group’s revenues. 8. NOTES TO THE INCOME STATEMET, THE STATEMENT OF FINANCIAL POSITION AND
STATEMENT OF CASH FLOWS CONSOLIDATED INCOME STATEMENT 8.1 NET REVENUES The Group’s net revenues from sales and the provision of services at 30 June 2017 and 30 June 2016 break down as follows:
DESCRIPTION BALANCE AS AT
30/06/2017 BALANCE AS AT
30/06/2016 CHANGE
NET REVENUES FROM SALES 1,006,470 867,124 139,346
NET REVENUES FROM THE PROVISION OF SERVICES 27,636 29,914 (2,278)
TOTAL 1,034,106 897,038 137,068
Net revenues from sales increased went from Euro 897,038 thousand in the first half of 2016 to Euro 1,034,106 thousand in the first half of 2017, an increase of over 15.3%. Net revenues from sales include all revenues for the sale of goods, expressed net of discounts provided to customers and returns. Revenues from the sale of goods are reported net of sales returns, amounting to Euro 561,985 thousand in the first half of 2017, or 36.2% of gross revenues, and Euro 466,348 thousand in the first half of 2016, or 35.4% of gross revenues for the first six months of 2016. Returns are an inherent part of the Company’s business activities, as a result of the protection afforded to consumers under remote-selling – and specifically e-commerce – regulations in force in the countries where the Company operates. Revenues from the provision of services decreased by 7.6% from Euro 29,914 thousand in the first half of 2016 to Euro 27,636 thousand in the first half of 2017, mainly including:
the recharging of transport services for sales, net of any discounts, to the end customer (in certain countries the customer also pays for return shipments) and net of refunds made if the customer returns the goods sold;
revenues from the set-up fees charged to create the online stores and fees charged to Strategic Partners in the Mono-brand business line for maintaining the online stores;
revenues generated from the sale of media partnership projects and web marketing services. 8.2 COST OF GOODS SOLD The cost of goods sold amounted to Euro 619,604 thousand (59.9% of net revenues) for the period ending at 30 June 2017, compared with Euro 542,154 thousand (60.4% of net revenues) for the period ending at 30 June 2016, an increase of Euro 77,451 thousand. The cost of goods sold includes costs deriving from the acquisition of goods for resale as well as costs for services and other costs.

CONDENSED CONSOLIDATED INTERIM FINANCIAL STATEMENTS AS AT 30 JUNE 2017 YNAP GROUP | 54
The following table shows a breakdown of the cost of goods sold by nature:
DESCRIPTION BALANCE AS AT 30/06/2017 BALANCE AS AT 30/06/2016 CHANGE
CHANGE IN INVENTORIES OF GOODS 61,299 27,493 33,806
PURCHASE OF GOODS (600,798) (500,560) (100,238)
SERVICE COSTS (61,001) (52,003) (8,997)
OTHER COSTS (19,105) (17,084) (2,022)
TOTAL (619,604) (542,154) (77,451)
Costs for the purchase of goods rose from Euro 500,560 thousand in the first half of 2016 to Euro 600,798 thousand in the first half of 2017, an increase of 20.0%. This cost comprises the cost of procuring goods for resale, and its absolute value is directly correlated to sales performance. Service costs increased by Euro 8,997 thousand, from Euro 52,003 thousand in the first half of 2016 to Euro 61,001 thousand in the first half of 2017. A portion of the transportation costs is invoiced directly to the end customer and recognised as revenue from the provision of services, net of refunds on customer returns. Other costs increased by Euro 2,022 thousand, from Euro 17,084 thousand in the first half of 2016 to Euro 19,105 thousand in the first half of 2017. These costs mainly comprise transportation costs for purchases, and the internal personnel costs and external supplier costs incurred to set-up and maintain the websites of Mono-brand Strategic Partners. 8.3 FULFILMENT COSTS Fulfilment costs amounted to Euro 107,114 thousand (10.4% of net revenues) for the period ended 30 June 2017, compared with Euro 94,591 thousand (10.5% of net revenues) in the first six months of 2016, an increase of Euro 12,523 thousand. This cost comprises operational expenses incurred from digital production, cataloguing and quality control, from warehouse logistics, and from the department that provides direct services to customers, referred to as customer services. The following table shows the breakdown of fulfilment costs:
DESCRIPTION BALANCE AS AT 30/06/2017 BALANCE AS AT 30/06/2016 CHANGE
SERVICE COSTS AND OTHER COSTS (53,259) (46,730) (6,529)
PERSONNEL EXPENSES (46,712) (41,789) (4,924)
DEPRECIATION AND AMORTISATION (7,143) (6,072) (1,070)
TOTAL (107,114) (94,591) (12,523)
Service and other costs increased by Euro 6,529 thousand, from Euro 46,730 thousand in the first half of 2016 to Euro 53,259 thousand in the first half of 2017. They mainly comprise service costs for handling and packaging goods and costs relating to outsourced production processes. Personnel expenses rose from Euro 41,789 thousand in the first half of 2016 to Euro 46,712 thousand in the first half of 2017, an increase if Euro 4,924 thousand, owing to the increase in the number of employees involved in this function. Personnel expenses include the cost of employees as well as costs equivalent to personnel expenses relating to interns, contractors and consultants.
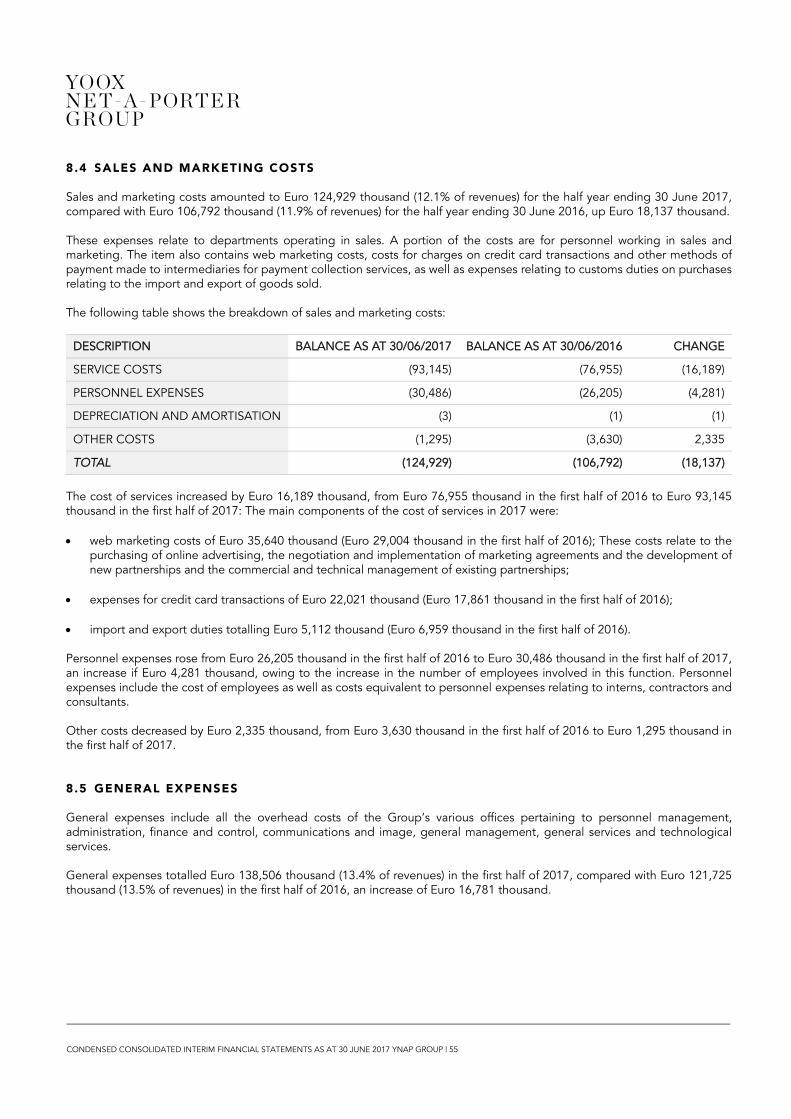
CONDENSED CONSOLIDATED INTERIM FINANCIAL STATEMENTS AS AT 30 JUNE 2017 YNAP GROUP | 55
8.4 SALES AND MARKETING COSTS Sales and marketing costs amounted to Euro 124,929 thousand (12.1% of revenues) for the half year ending 30 June 2017, compared with Euro 106,792 thousand (11.9% of revenues) for the half year ending 30 June 2016, up Euro 18,137 thousand. These expenses relate to departments operating in sales. A portion of the costs are for personnel working in sales and marketing. The item also contains web marketing costs, costs for charges on credit card transactions and other methods of payment made to intermediaries for payment collection services, as well as expenses relating to customs duties on purchases relating to the import and export of goods sold. The following table shows the breakdown of sales and marketing costs:
DESCRIPTION BALANCE AS AT 30/06/2017 BALANCE AS AT 30/06/2016 CHANGE
SERVICE COSTS (93,145) (76,955) (16,189)
PERSONNEL EXPENSES (30,486) (26,205) (4,281)
DEPRECIATION AND AMORTISATION (3) (1) (1)
OTHER COSTS (1,295) (3,630) 2,335
TOTAL (124,929) (106,792) (18,137)
The cost of services increased by Euro 16,189 thousand, from Euro 76,955 thousand in the first half of 2016 to Euro 93,145 thousand in the first half of 2017: The main components of the cost of services in 2017 were:
web marketing costs of Euro 35,640 thousand (Euro 29,004 thousand in the first half of 2016); These costs relate to the purchasing of online advertising, the negotiation and implementation of marketing agreements and the development of new partnerships and the commercial and technical management of existing partnerships;
expenses for credit card transactions of Euro 22,021 thousand (Euro 17,861 thousand in the first half of 2016);
import and export duties totalling Euro 5,112 thousand (Euro 6,959 thousand in the first half of 2016). Personnel expenses rose from Euro 26,205 thousand in the first half of 2016 to Euro 30,486 thousand in the first half of 2017, an increase if Euro 4,281 thousand, owing to the increase in the number of employees involved in this function. Personnel expenses include the cost of employees as well as costs equivalent to personnel expenses relating to interns, contractors and consultants. Other costs decreased by Euro 2,335 thousand, from Euro 3,630 thousand in the first half of 2016 to Euro 1,295 thousand in the first half of 2017. 8.5 GENERAL EXPENSES General expenses include all the overhead costs of the Group’s various offices pertaining to personnel management, administration, finance and control, communications and image, general management, general services and technological services. General expenses totalled Euro 138,506 thousand (13.4% of revenues) in the first half of 2017, compared with Euro 121,725 thousand (13.5% of revenues) in the first half of 2016, an increase of Euro 16,781 thousand.

CONDENSED CONSOLIDATED INTERIM FINANCIAL STATEMENTS AS AT 30 JUNE 2017 YNAP GROUP | 56
General expenses can be broken down as follows:
DESCRIPTION BALANCE AS AT 30/06/2017 BALANCE AS AT 30/06/2016 CHANGE
SERVICE COSTS (53,242) (41,919) (11,323)
PERSONNEL EXPENSES (40,283) (44,259) 3,976
DEPRECIATION AND AMORTISATION (44,981) (35,547) (9,434)
TOTAL (138,506) (121,725) (16,781)
The cost of services increased by Euro 11,323 thousand, from Euro 41,919 thousand in the first half of 2016 to Euro 53,242 thousand in the first half of 2017: Personnel expenses increased by Euro 35,157 thousand, from Euro 44,259 thousand in the first half of 2016 to Euro 40,283 thousand in the first half of 2017. Personnel expenses include the cost of employees as well as costs equivalent to personnel expenses relating to interns, contractors and consultants. Depreciation and amortisation rose from Euro 35,547 thousand in the first half of 2016 to Euro 44,981 thousand in the first half of 2017, an increase of Euro 9,434 thousand. 8.6 OTHER INCOME AND EXPENSES Other income and expenses came to a total negative figure of Euro 4,638 thousand for the period ending 30 June 2017, versus a negative figure of Euro 2,795 thousand for the period ending 30 June 2016, a decrease of Euro 1,843 thousand. Other income and expenses can be broken down as follows:
DESCRIPTION BALANCE AS AT 30/06/2017 BALANCE AS AT 30/06/2016 CHANGE
NON-OPERATING PROFITS/LOSSES (2,456) (1,712) (744)
THEFT AND LOSSES (1,039) (663) (375)
OTHER TAX LIABILITIES (232) (147) (85)
OTHER INCOME AND EXPENSES (909) (41) (868)
PROVISIONS FOR SUNDRY RISKS (174) (95) (79)
REIMBURSEMENTS 171 (137) 307
TOTAL (4,638) (2,795) (1,843)
Net non-operating profits (losses) went from Euro 1,712 thousand in the first half of 2016 to Euro 2,456 thousand in the first half of 2017. The item includes income and expenses resulting from ordinary operating activities. Theft and losses relates to the theft and losses of goods destined for final customers that have already occurred at the end of the period. Other tax charges increased by Euro 85 thousand, from Euro 147 thousand in the first half of 2016 to Euro 232 thousand in the first half of 2017. Provisions for sundry risks in the first half of 2017 relate to the estimated charge incurred due to theft and loss of goods not identified as missing at the reporting date.
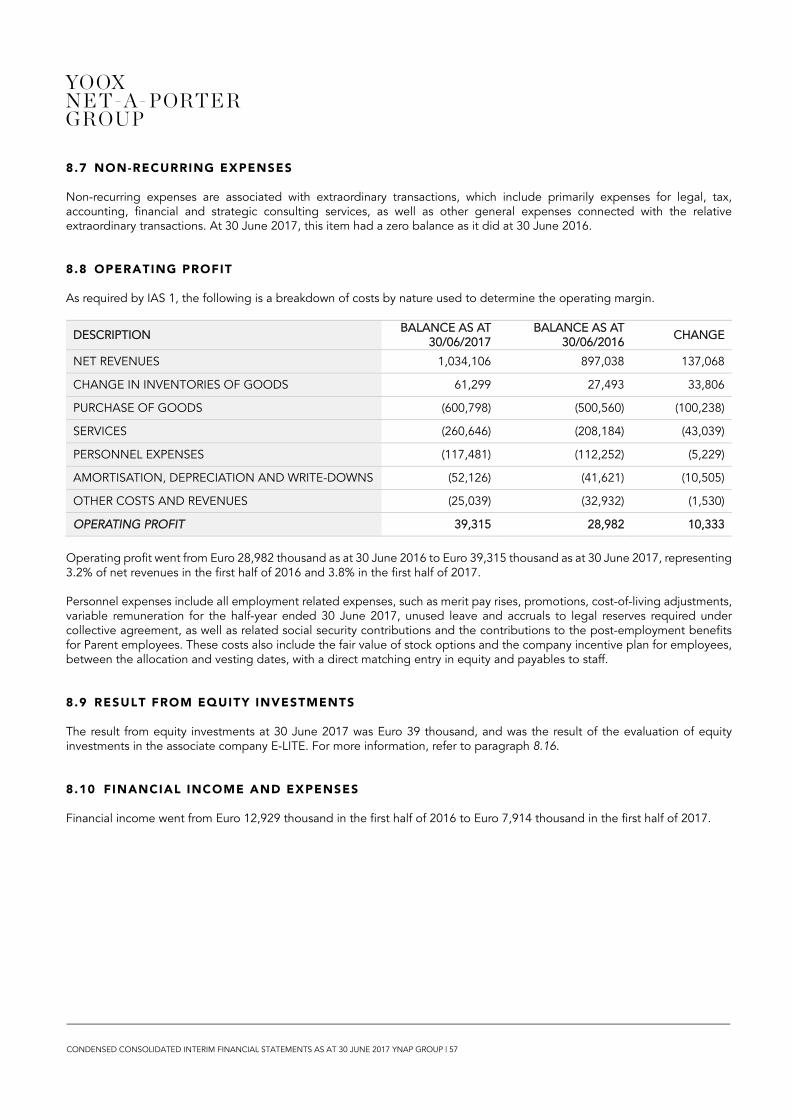
CONDENSED CONSOLIDATED INTERIM FINANCIAL STATEMENTS AS AT 30 JUNE 2017 YNAP GROUP | 57
8.7 NON-RECURRING EXPENSES Non-recurring expenses are associated with extraordinary transactions, which include primarily expenses for legal, tax, accounting, financial and strategic consulting services, as well as other general expenses connected with the relative extraordinary transactions. At 30 June 2017, this item had a zero balance as it did at 30 June 2016. 8.8 OPERATING PROFIT As required by IAS 1, the following is a breakdown of costs by nature used to determine the operating margin.
DESCRIPTION BALANCE AS AT
30/06/2017 BALANCE AS AT
30/06/2016 CHANGE
NET REVENUES 1,034,106 897,038 137,068
CHANGE IN INVENTORIES OF GOODS 61,299 27,493 33,806
PURCHASE OF GOODS (600,798) (500,560) (100,238)
SERVICES (260,646) (208,184) (43,039)
PERSONNEL EXPENSES (117,481) (112,252) (5,229)
AMORTISATION, DEPRECIATION AND WRITE-DOWNS (52,126) (41,621) (10,505)
OTHER COSTS AND REVENUES (25,039) (32,932) (1,530)
OPERATING PROFIT 39,315 28,982 10,333
Operating profit went from Euro 28,982 thousand as at 30 June 2016 to Euro 39,315 thousand as at 30 June 2017, representing 3.2% of net revenues in the first half of 2016 and 3.8% in the first half of 2017. Personnel expenses include all employment related expenses, such as merit pay rises, promotions, cost-of-living adjustments, variable remuneration for the half-year ended 30 June 2017, unused leave and accruals to legal reserves required under collective agreement, as well as related social security contributions and the contributions to the post-employment benefits for Parent employees. These costs also include the fair value of stock options and the company incentive plan for employees, between the allocation and vesting dates, with a direct matching entry in equity and payables to staff. 8.9 RESULT FROM EQUITY INVESTMENTS The result from equity investments at 30 June 2017 was Euro 39 thousand, and was the result of the evaluation of equity investments in the associate company E-LITE. For more information, refer to paragraph 8.16. 8.10 FINANCIAL INCOME AND EXPENSES Financial income went from Euro 12,929 thousand in the first half of 2016 to Euro 7,914 thousand in the first half of 2017.

CONDENSED CONSOLIDATED INTERIM FINANCIAL STATEMENTS AS AT 30 JUNE 2017 YNAP GROUP | 58
The following table shows the breakdown of financial income:
DESCRIPTION BALANCE AS AT
30/06/2017 BALANCE AS AT
30/06/2016 CHANGE
EXCHANGE RATE GAINS 6,264 12,214 (5,950)
OTHER FINANCIAL INCOME 1,542 549 993
INTEREST INCOME ON CURRENT ACCOUNT 108 163 55
INTEREST INCOME FROM ASSOCIATE LOANS - 3 (3)
TOTAL 7,914 12,929 (4,852)
Exchange rate gains went from Euro 12,214 thousand in the first half of 2016 to Euro 6,264 thousand in the first half of 2017. These gains arose mainly from the translation of items in US dollars and yen and are closely connected with the ordinary sales and purchase of goods. Other financial income rose from Euro 549 thousand in the first half of 2016 to Euro 1,542 thousand in the first half of 2017, while interest income on current accounts went from Euro 163 thousand in the first half of 2016 to Euro 108 thousand in the first half of 2017. Financial expenses rose from Euro 13,952 thousand in the first half of 2016 to Euro 17,889 thousand in the first half of 2017. The following table shows the breakdown of financial expenses:
DESCRIPTION BALANCE AS AT 30/06/2017 BALANCE AS AT 30/06/2016 CHANGE
EXCHANGE RATE LOSSES (15,095) (12,026) (3,068)
OTHER FINANCIAL EXPENSES (2,227) (592) (1,635)
INTEREST EXPENSES (567) (1,333) 766
TOTAL (17,889) (13,952) (3,937)
Realised and unrealised exchange rate losses totalled Euro 12,026 thousand in the first half of 2016 and Euro 15,095 thousand in the first half of 2017. They mainly relate to the conversion of items in US dollars and Japanese yen, and are strictly linked to the ordinary sale and purchase of goods. Other financial expense went from Euro 592 thousand in the first half of 2016 to Euro 2,227 thousand in the first half of 2017, and mainly relate to bank sureties issued to third parties on the Group’s behalf. This item also includes premiums paid for exchange rate risk hedging agreements, as well as the recognition of their fair value. Interest expense of Euro 567 thousand at 30 June 2017, declined by Euro 766 thousand.

CONDENSED CONSOLIDATED INTERIM FINANCIAL STATEMENTS AS AT 30 JUNE 2017 YNAP GROUP | 59
8.11 TAXES Income tax can be broken down as follows:
DESCRIPTION BALANCE AS
AT 30/06/2017 BALANCE AS
AT 30/06/2016 CHANGE
CURRENT CORPORATE INCOME TAX (IRES) - PARENT COMPANY (1) - (15,840) 15,840
CURRENT REGIONAL INCOME TAX (IRAP) - PARENT COMPANY (2) - - -
CURRENT INCOME TAX - FOREIGN COMPANIES (16,554) (10,631) (5,923)
DEFERRED TAXES 7,761 17,108 (9,347)
TOTAL TAXES (8,793) (9,363) 570
(1) IRES: Imposta sul Reddito delle Società (Corporate or Company Tax) (2) IRAP: Imposta Regionale sulle Attività Produttive (Regional Tax on Production Activities)
Current taxes went from Euro 26,471 thousand to Euro 16,554 thousand. Net deferred taxes totalled Euro 7,761 thousand for the period. Taxes for the period were estimated on the basis of results projected for the current year. 8.12 BASIC AND DILUTED EARNINGS PER SHARE The following table shows the calculation of the basic earnings per share (Basic EPS) and diluted earnings per share (Diluted EPS) reported in the consolidated income statement.
CALCULATION OF BASIC EPS 30 JUNE 2017 30 JUNE 2016
BASIC EARNINGS 20,876 18,835
AVERAGE NUMBER OF BASIC SHARES 133,836,107 131,558,381
BASIC EPS 0.16 0.14
CALCULATION OF DILUTED EPS 30 JUNE 2017 30 JUNE 2016
BASIC EARNINGS 20,876 18,835
AVERAGE NUMBER OF BASIC SHARES 133,836,107 131,558,381
AVERAGE NUMBER OF SHARES GRANTED FREE OF CHARGE 894,947 1,036,415
TOTAL 134,731,054 132,594,796
DILUTED EPS 0.15 0.14
The average number of shares granted without consideration as at 30 June 2017 and 30 June 2016 and used to calculate diluted EPS relates to the granting of shares under existing stock option plans which, as stated in IFRS 2, can be converted on the basis of vesting conditions in the respective years. In calculating the basic earnings per share (Basic EPS) and the diluted earnings per share (Diluted EPS) given in the table above, the repurchase of 162,000 treasury shares which took place between 2 July 2010 and 7 November 2011 has been taken into account. Treasury shares repurchased were deducted in the calculation of the average number of outstanding

CONDENSED CONSOLIDATED INTERIM FINANCIAL STATEMENTS AS AT 30 JUNE 2017 YNAP GROUP | 60
ordinary shares net of 31,338 shares, 4,801 shares, 20,255 shares, 378 shares, 48,464 shares, 4,829 shares and 24,596 shares relating to the Company Incentive Plan, granted respectively on 6 August 2012, 10 January 2013, 27 May 2013, 3 June 2013, 1 August 2013, 14 January 2014 and 13 May 2014 to 46 beneficiaries and 10,000 shares granted on 16 January 2015.

ST
AT
EM
EN
T O
F F
INA
NC
IAL
PO
SIT
ION
8.1
3
PR
OP
ER
TY
, P
LA
NT
AN
D E
QU
IPM
EN
T
As
at
30 J
une 2
01
7,
pro
pert
y, p
lant
and
eq
uip
ment
tota
lled
Euro
140,4
04 t
ho
usa
nd
. T
he f
ollo
win
g is
a s
um
mary
of
chang
es
there
in in t
he f
irst
half o
f 201
7:
DE
SC
RIP
TIO
N
HIS
TO
RIC
AL
CO
ST
IN
CR
EA
SE
S
DE
CR
EA
SE
SH
IST
OR
ICA
L
CO
ST
AC
C.
DE
PR
EC
IAT
ION
A
MO
RT
ISA
TIO
NU
TIL
ISA
TIO
N
AC
C.
DE
PR
EC
IAT
ION
EX
CH
AN
GE
D
IFFE
RE
NC
E
FR
OM
C
ON
VE
RSIO
N
EX
CH
AN
GE
D
IFFE
RE
NC
E
FR
OM
C
ON
VE
RSIO
N
NE
T
CA
RR
YIN
G
AM
OU
NT
NE
T
CA
RR
YIN
G
AM
OU
NT
AS A
T
31/1
2/2
016
AS A
T
30/0
6/2
017
AS A
T
31/1
2/2
016
AS A
T
30/0
6/2
017
AS A
T
31/1
2/2
016
AS A
T
30/0
6/2
017
AS A
T
31/1
2/2
016
AS A
T
30/0
6/2
017
PLA
NT
AN
D
EQ
UIP
ME
NT
8
7,0
82
969
(7)
88
,04
4(3
5,0
13)
(3,5
16)
- (3
8,5
29)
(993
)(1
,686)
51
,07
64
7,8
28
BU
ILD
ING
S
69
,85
5
8,6
79
(156
)7
8,3
78
(35,3
04)
(3,7
86)
31
(39,0
60)
(460
)(2
,687)
34
,09
13
6,6
31
LE
ASE
HO
LD
IM
PR
OV
EM
EN
TS
69
,85
5
8,6
79
(156)
78
,37
8(3
5,3
04)
(3,7
86)
31
(39,0
60)
(460)
(2,6
87)
34
,09
13
6,6
31
IND
UST
RIA
L A
ND
C
OM
ME
RC
IAL
EQ
UIP
ME
NT
5
,82
4
791
(7)
6,6
09
(3,5
91)
(446
)7
(4,0
31)
(95
)(1
6)
2,1
38
2,5
62
OT
HE
R A
SSE
TS
75
,65
4
5,0
16
(748
)7
9,9
22
(45,7
77)
(5,8
96)
640
(51,0
33)
(901
)(1
,066)
28
,97
72
7,8
23
FU
RN
ITU
RE
AN
D
FU
RN
ISH
ING
S
12
,92
1
581
-1
3,5
02
(10,1
95)
(569)
- (1
0,7
64)
(196)
(207)
2,5
29
2,5
31
ELE
CT
RO
NIC
E
QU
IPM
EN
T
61
,27
5
4,3
65
(748)
64
,89
2(3
4,4
07)
(5,2
08)
640
(38,9
74)
(700)
(846)
26
,16
92
5,0
72
OT
HE
R T
AN
G.
ASSE
TS
1,4
58
70
01
,52
8(1
,175)
(120)
0
(1,2
95)
(6)
(13)
277
221
ASSE
TS U
ND
ER
C
ON
ST
RU
CT
ION
A
ND
PA
YM
EN
TS
ON
AC
CO
UN
T
14
,30
5
17
,73
3
(6,3
10)
25
,72
9-
--
--
(168
)1
4,3
05
25
,56
0
GE
NE
RA
L T
OTA
L 2
52
,72
1
33
,18
8
(7,2
28)
27
8,6
82
(119,6
85)
(13,6
45)
678
(132,3
53)
(2,4
51)
(5,6
23)
13
0,5
86
14
0,4
04
CONDENSED CONSOLIDATED INTERIM FINANCIAL STATEMENTS AS AT 30 JUNE 2017 YNAP GROUP | 61

CONDENSED CONSOLIDATED INTERIM FINANCIAL STATEMENTS AS AT 30 JUNE 2017 YNAP GROUP | 62
The overall net increase in property, plant and equipment in 2017 amounted to Euro 9,818 thousand. Investments in tangible assets were mainly related to investments in the highly automated technical and logistical platform and the completion of work in process on the administrative centre in the new London office. Note that a portion of this work is still under way. Specifically, work has still not been completed on the logistics centres in Landriano (PV) and Interporto Bologna totalling Euro 23,785 thousand and on the administrative centre in London totalling Euro 1,775 thousand. This involved an increase in the item “Plant and equipment” of Euro 969 thousand as well as the item “Buildings” in an amount equal to Euro 8,679 thousand, and in the item “Equipment” in the amount of Euro 791 thousand. The total increase in “Other Assets”, amounting to Euro 5,016 thousand, is due to the combined effect of the investment in new servers, PCs and monitors, also held under finance leases, for an increase of Euro 4,635 thousand, and investments made in furniture as regards the remainder. Amortisation in the period totalled Euro 13,645 thousand. Moreover, no impairment losses or revaluations were carried out on items of property, plant and equipment. Furthermore, in the period under review, no financial expenses were ascribed to asset entries in the statement of financial position.

8.1
4
INT
AN
GIB
LE
AS
SE
TS
WIT
H F
INIT
E U
SE
FU
L L
IFE
In
tan
gib
le a
ssets
am
ou
nte
d t
o E
uro
466,9
66 t
ho
usa
nd
as
at
30 J
une 2
017.
The f
ollo
win
g is
a s
um
mary
of
chang
es
in inta
ng
ible
ass
ets
wit
h f
init
e u
sefu
l lif
e in t
he f
irst
half o
f 201
7:
DE
SC
RIP
TIO
N
HIS
TO
RIC
AL
CO
ST
INC
RE
ASE
SD
EC
RE
AS
ES
HIS
TO
RIC
AL
CO
ST
AC
C.
AM
OR
TIS
AT
ION
A
MO
RT
ISA
TIO
NU
SE
SA
CC
. A
MO
RT
ISA
TIO
N
EX
CH
AN
GE
D
IFFE
RE
NC
E
FR
OM
C
ON
VE
RSIO
N
EX
CH
AN
GE
D
IFFE
RE
NC
E
FR
OM
C
ON
VE
RSIO
N
NE
TC
AR
RY
ING
AM
OU
NT
NE
T
CA
RR
YIN
G
AM
OU
NT
AS A
T
31/1
2/2
016
AS A
T
30/0
6/2
017
AS A
T
31/1
2/2
016
AS A
T
30/0
6/2
017
AS A
T
31/1
2/2
016
AS A
T
30/0
6/2
017
AS A
T31/1
2/2
016
AS A
T
30/0
6/2
017
DE
VE
LOP
ME
NT
CO
ST
S
14
7,0
93
38
,46
7-
18
5,5
60
(91,1
51)
(19,4
15)
-(1
10,5
66)
(1,4
77)
(1,5
53)
54
,46
57
3,4
41
SO
FT
WA
RE
AN
D L
ICE
NC
ES
31
,74
71
,03
9-
32
,78
6(2
0,0
18)
(3,3
43)
-(2
3,3
61)
(249
)(8
21
)1
1,4
80
8,6
04
BR
AN
DS A
ND
OT
HE
R
RIG
HT
S
3,0
20
--
3,0
20
(2,8
32)
(60
)-
(2,8
92)
(9)
(8)
179
120
TR
AD
EM
AR
KS A
ND
PA
TE
NT
S
3,0
20
--
3,0
20
(2,8
32)
(60)
-(2
,892)
(9)
(8)
179
120
ASSE
TS U
ND
ER
D
EV
ELO
PM
EN
T
52
,54
75
2,3
30
(38,4
67)
66
,41
0-
--
--
-5
2,5
47
66
,41
0
OT
HE
R
37
6,6
17
--
37
6,6
17
(35,2
11)
(15,6
63)
-(5
0,8
75)
1,3
85
(7,3
50)
34
2,7
91
31
8,3
92
BR
AN
D
30
8,4
12
--
30
8,4
12
(21,4
82)
(10,2
28)
-(3
1,7
10)
920
(6,4
46)
28
7,8
50
27
0,2
56
CU
ST
OM
ER
LIS
T
65
,10
4-
-6
5,1
04
(11,3
37)
(5,3
98)
-(1
6,7
35)
486
(828)
54
,25
34
7,5
41
OT
HE
R IN
TA
NG
IBLE
A
SSE
TS
3,1
01
--
3,1
01
(2,3
93)
(37)
-(2
,430)
(21)
(76)
687
595
GE
NE
RA
L T
OTA
L 6
11
,02
39
1,8
35
(38,4
67)
66
4,4
81
(149,2
13)
(38,4
81)
-(1
87,6
94)
(350
)(9
,732)
46
1,4
60
46
6,9
66
CONDENSED CONSOLIDATED INTERIM FINANCIAL STATEMENTS AS AT 30 JUNE 2017 YNAP GROUP | 63

CONDENSED CONSOLIDATED INTERIM FINANCIAL STATEMENTS AS AT 30 JUNE 2017 YNAP GROUP | 64
The principal changes in these items during the period are described below. Development costs In the first half of 2017, the Group made significant long-term investments in multi-year development projects for a total amount of Euro 46,596 thousand (assets under construction as at 30 June 2017). However, it completed assets under construction reported as at 31 December 2016 (Euro 38,467 thousand). These are costs incurred by the Group for specific projects aimed at the ongoing development of innovative solutions for the creation and management of online stores. The development projects were categorised on the basis of the issue for which the various procedures were carried out: development of e-commerce platform functionality, operational development of productivity, and development of security and continuity of service. These costs relate both to internal personnel expenses and to the costs of services provided by third parties. In keeping with the strategy established in previous years, the number of development projects outsourced to external suppliers increased significantly. The expenses for research-related activities, which are carried out with a view to obtaining new scientific or technical knowledge and discoveries, are recognised in the income statement at the time they are incurred. Software and licences The increases during the period (Euro 1,039 thousand) include expenditures with long-term benefits, principally relating to the acquisition of software licences to build the infrastructure of the Online Stores. Amortisation of intangible assets with finite useful life totalled Euro 38,481 thousand during the period, of which Euro 15,626 thousand related to allocations of amounts on the brand and on the customer list acquired as part of the merger between YOOX GROUP and NET-A-PORTER GROUP. 8.15 PURCHASE PRICE ALLOCATION AND GOODWILL Goodwill of Euro 1,199,341 thousand was due to the combined effect of the carrying amount of the goodwill arising from the merger of Largenta Italia S.p.A., which took effect on 5 October 2015 for legal and accounting purposes, into YOOX NET-A-PORTER GROUP S.p.A. and the definition of the Purchase Price Allocation process. BRAND The brand falls under intangible assets relating to marketing identified by IFRS 3 as a potential intangible asset identified during purchase price allocation. With reference to the acquisition of THE NET-A-PORTER GROUP, it was considered appropriate to limit the analysis to a single brand, with “Net-A-Porter.com” considered an umbrella brand – this means that consumers associate its other brands to it, clearly identifying the “Net-A-Porter experience”. For the initial valuation of the brand, both market methods and fundamental methods based on cash flows were used. Following the allocation process, this intangible asset was recorded as at 30 June 2017 in the amount of Euro 270,256 thousand with a defined useful life of 15 years. In 2017, the amortisation charge of the relevant asset (Euro 10,228 thousand, before taxes and Euro 8,182 thousand after taxes) was recorded on the income statement. The company checks at the end of every quarter that there are no impairment indicators. CUSTOMER LIST Over the years, NAP has built up a significant portfolio of ongoing relations with clients worldwide, leveraging on the quality and variety of its offer, supported by editorial content, and a reliable and personalised service. In light of the characteristics mentioned above relating to the use of the brand, the customer list was considered as a single asset, drawing on the contributions made from all currently operational websites. Following the allocation process, this intangible asset was recorded as at 30 June 2017 in the amount of Euro 47,541 thousand with a defined useful life of 6 years.

CONDENSED CONSOLIDATED INTERIM FINANCIAL STATEMENTS AS AT 30 JUNE 2017 YNAP GROUP | 65
In 2017, the amortisation charge of the relevant asset (Euro 5,398 thousand, before taxes and Euro 4,318 thousand after taxes) was recorded on the income statement. The company checks at the end of every quarter that there are no impairment indicators. OTHER CONSIDERATIONS Note that goodwill is subjected on an annual basis, or more frequently if specific events or changes in circumstances indicate the possibility of a loss in value, to impairment tests, as set out by IAS 36 - Impairment of Assets. The recoverability of amounts entered is checked through a comparison of the net carrying value of the individual cash generating units with the recoverable amount (value in use). This recoverable amount is represented by the present value of future cash flows, which are estimated will result from the continuous use of the assets relating to the cash generating unit and the terminal value attributable thereto. The recoverability of goodwill is checked at least once a year (on 31 December) even in the absence of indicators of impairment. As at 30 June 2017, the Group made a comparison between the actual trend and that set out in the strategic guidelines of the 2017 - 2021 five-year plan approved by the Board of Directors on 29 June 2016. This analysis did not highlight any impairment indicators relating to goodwill and, therefore, the latter was not subject to impairment tests during the period. Given that the determination of the recoverable value is based on estimates, the Group cannot be sure that there will be no impairment of goodwill in future periods. 8.16 INVESTMENTS IN ASSOCIATES The non-current item as at 30 June 2017 stood at Euro 740 thousand.
DESCRIPTION BALANCE AS AT 30/06/2017 BALANCE AS AT 31/12/2016 CHANGE
INVESTMENTS IN ASSOCIATED COMPANIES 740 701 39
TOTAL 740 701 39
The change in the item as at 30 June 2017 was due to the valuation of the associate at equity. The table below provides a summary of the operational data of the 49%-owned associate.
INVESTMENT END OF PERIOD DATE OWNERSHIP % INVESTMENT INVESTMENT
PROFIT/(LOSS) EQUITY
SHARE OF PROFIT/(LOSS)
E_LITE S.P.A (ASSOCIATE) 30 JUNE 49% 741 81 1,430 39
TOTAL 741 81 1,430 39
8.17 DEFERRED TAX ASSETS
DESCRIPTION BALANCE AS AT 30/06/2017 BALANCE AS AT 31/12/2016 CHANGE
DEFERRED TAX ASSETS 56,313 53,043 3,270
TOTAL 56,313 53,043 3,270
Changes in deferred tax assets during the first half of 2017 are shown in the following table:
DESCRIPTION BALANCE AS AT
31/12/2016 INCREASES DECREASES
EXCHANGE DIFFERENCE FROM CONVERSION
BALANCE AS AT 30/06/2017
DEFERRED TAX ASSETS 53,043 6,375 (2,081) (1,024) 56,313
TOTAL 53,043 6,375 (2,081) (1,024) 56,313

CONDENSED CONSOLIDATED INTERIM FINANCIAL STATEMENTS AS AT 30 JUNE 2017 YNAP GROUP | 66
The deferred tax assets pertaining to the allowance for impairment, the provision for obsolete inventories and the provisions for risks and charges also include the amount pertaining to provisions made by foreign subsidiaries. 8.18 OTHER NON-CURRENT FINANCIAL ASSETS Other non-current financial assets totalled Euro 2,730 thousand at 30 June 2017 (compared with Euro 2,837 thousand at 31 December 2016), corresponding mainly to security deposits. Other non-current financial assets are due to be repaid in more than five years’ time. 8.19 INVENTORIES
DESCRIPTION BALANCE AS AT 30/06/2017 BALANCE AS AT 31/12/2016 CHANGE
INVENTORIES 646,268 578,200 68,067
TOTAL 646,268 578,200 68,067
Inventories as at 30 June 2017 and 31 December 2016 break down as follows:
DESCRIPTION BALANCE AS
AT 30/06/2017 BALANCE AS
AT 31/12/2016 CHANGE
INVENTORIES OF RAW MATERIALS, CONSUMABLES AND SUPPLIES 1,756 1,996 (240)
TOTAL 1,756 1,996 (240)
FINISHED PRODUCTS AND GOODS 713,409 645,993 67,416
PROVISION FOR OBSOLETE FINISHED PRODUCTS AND GOODS (68,897) (69,788) 891
TOTAL 644,512 576,205 68,307
TOTAL NET INVENTORIES 646,268 578,200 68,067
Inventories rose by 11.7% from Euro 578,200 thousand as at 31 December 2016 to Euro 646,268 thousand as at 30 June 2017, and relate to goods that have been purchased for subsequent resale online. Goods from previous collections and/or obsolete goods are written down with a provision for obsolete inventories, calculated using the estimated realisable value of the goods. This estimate of realisable values also takes into account the expected effects of new sales policies. The amount of the provision in the first half of 2017 for obsolete inventories and changes in the provision are shown below:
DESCRIPTION BALANCE
AS AT 31/12/2016
INCREASES DECREASES
EXCHANGE DIFFERENCE
FROM CONVERSION
BALANCE AS AT
30/06/2017
PROVISION FOR OBSOLETE INVENTORIES (69,788) (5,577) 3,010 3,458 (68,897)
TOTAL (69,788) (5,577) 3,010 3,458 (68,897)
The reserve for obsolete inventories has a carrying amount deemed appropriate for the actual quantities of obsolete or slow-moving goods on hand.

CONDENSED CONSOLIDATED INTERIM FINANCIAL STATEMENTS AS AT 30 JUNE 2017 YNAP GROUP | 67
8.20 TRADE RECEIVABLES The breakdown of trade receivables as at 30 June 2017 is as follows:
DESCRIPTION BALANCE AS AT 30/06/2017 BALANCE AS AT 31/12/2016 CHANGE
DUE FROM CUSTOMERS 7,018 10,087 (3,069)
OTHER TRADE RECEIVABLES 33,689 22,434 11,255
ALLOWANCE FOR IMPAIRMENT (134) (134) -
TOTAL 40,573 32,387 8,186
The receivables due from customers are fully recoverable within 12 months and relate to trade receivables for the sale of goods to individuals. Other trade receivables mainly relate to receivables from Online Stores, chiefly for the provision of services. This item includes, inter alia, services related to set-up fees incurred by the Group in relation to Strategic Partners for the design and implementation activities that the Group carries out for Online Stores. The table below shows changes in the allowance for impairment in 2017:
DESCRIPTION BALANCE AS AT
31/12/2016 INCREASES DECREASES
BALANCE AS AT 30/06/2017
ALLOWANCE FOR IMPAIRMENT (134) - - (134)
TOTAL (134) - - (134)
The allowance for impairment covers specific risks relating to unpaid receivables and other receivables not considered recoverable. At 30 June 2017, it was not deemed necessary to carry out further provisions with respect to 31 December 2016. Pursuant to IFRS 7, Note 10 provides information on the maximum credit risk classed according to due dates, gross of the allowance for impairment. 8.21 OTHER CURRENT ASSETS
DESCRIPTION BALANCE AS AT 30/06/2017 BALANCE AS AT 31/12/2016 CHANGE
OTHER CURRENT ASSETS 36,697 48,171 (11,474)
TOTAL 36,697 48,171 (11,474)

CONDENSED CONSOLIDATED INTERIM FINANCIAL STATEMENTS AS AT 30 JUNE 2017 YNAP GROUP | 68
The following is a breakdown of other current assets as at 30 June 2017:
DESCRIPTION BALANCE AS AT
30/06/2017 BALANCE AS AT
31/12/2016 CHANGE
OTHER RECEIVABLES 3,705 1,726 1,979
ALLOWANCE FOR IMPAIRMENT – RECEIVABLES FROM OTHERS (221) (221) -
ADVANCES TO SUPPLIERS 88 69 19
ADVANCES TO EMPLOYEES 151 168 (16)
PREPAYMENTS AND ACCRUED INCOME 16,405 29,933 (13,528)
TAX RECEIVABLES 16,569 16,496 73
TOTAL 36,697 48,171 (11,474)
“Other receivables” includes: Credit notes received from suppliers for which the latter must still refund money to the Company and from advance payments to the supplier for the purchase of goods for which the corresponding invoices have not yet been received (e.g. payments on order, prepayments). The allowance for impairment – receivables from others, as previously mentioned, relates to the loan to the Greek tax representative, which is deemed unrecoverable. The item “Prepayments and accrued income” item mainly comprises costs relating to future periods but incurred in the first half of 2017. These mainly consist of software licence fees, insurance costs, rental costs, prepaid royalties to use trademarks and prepaid professional consulting services. Tax receivables, which are fully recoverable by the end of the following year, comprise receivables for direct and indirect taxes. 8.22 CASH AND CASH EQUIVALENTS AND CURRENT FINANCIAL ASSETS The breakdown of the item “Cash and cash equivalents” as at 30 June 2017 is as follows:
DESCRIPTION BALANCE AS AT 30/06/2017 BALANCE AS AT 31/12/2016 CHANGE
BANK AND POSTAL ACCOUNTS 186,500 155,447 31,054
CASH AND CASH EQUIVALENTS ON HAND 17 18 (1)
TOTAL 186,518 155,465 31,053
The balance represents the cash and cash equivalents on hand at the end of the period deposited at major banks, readily available and free from liens.

CONDENSED CONSOLIDATED INTERIM FINANCIAL STATEMENTS AS AT 30 JUNE 2017 YNAP GROUP | 69
The following is a breakdown of current financial assets at 30 June 2017:
DESCRIPTION BALANCE AS AT 30/06/2017 BALANCE AS AT 31/12/2016 CHANGE
DUE FROM ACQUIRERS 27,992 54,584 (26,593)
INVESTMENTS 10,475 10,475 -
PREPAYMENTS AND ACCRUALS 1,344 1,935 (591)
TOTAL 39,810 66,995 (27,184)
8.23 EQUITY ATTRIBUTABLE TO OWNERS OF THE PARENT COMPANY AND MINORITY
INTERESTS The breakdown of changes in equity as at 30 June 2017 is presented in a separate table. The share capital amounting to Euro 1,338,942.89 thousand as at 30 June 2017 (Euro 1,337,413.05 thousand as at 31 December 2016) increased during the first half of 2017 following the capital increase resulting from the exercise of stock options by the beneficiaries. The reserves are composed as follows:
The share premium reserve and other capital reserves amounted to Euro 2,021,993 thousand as at 30 June 2017 (Euro 2,041,058 thousand as at 31 December 2016): this reserve increased during the first half of 2017 following the booking of the premium generated by the exercise of stock options by the beneficiaries totalling Euro 97 thousand. Furthermore, following approval of the 2016 loss, the use of this reserve in the amount of Euro 19,162 thousand was approved to cover the loss.
Other capital reserves totalled a positive Euro 20,321 thousand and were attributable to other reserves generated following contributions of the minority shareholder of YNAP Middle East Holding LTD, Symphony Global LLC, totalling Euro 20,612 thousand (of which Euro 6,511 thousand as a minority interest – Euro 291 thousand negative loss for the period).
the legal reserve, which totalled Euro 267 thousand as at 30 June 2017 (Euro 260 thousand as at 31 December 2016), consists of accruals of 5% of Parent Company profits every year. Over the year, following the Board of Directors’ resolution, this was increased by Euro 7 thousand.
the purchase of treasury shares, with a negative balance of Euro 162 thousand, is recorded as a direct decrease in net equity in compliance with the provisions of IAS 32;
translation reserve, which had a negative balance of Euro 294,293 thousand as at 30 June 2017 (compared with Euro 240,777 thousand as at 31 December 2016), reflects exchange rate differences arising from the translation of financial statements denominated in foreign currency. The change versus 30 June 2017 was negative in the amount of Euro 53,500 thousand; this reserve was heavily impacted by fluctuations in the GBP, the currency in which the merger dated 5 October 2015 was conducted.
other reserves, equal to Euro 41,744 thousand as at 30 June 2017 (Euro 33,447 thousand as at 31 December 2016) include the fair value measurement of the stock options, equal to Euro 40,886 thousand as at 30 June 2017 (Euro 34,331 thousand as at 31 December 2016), the cash flow hedge reserve, equal to a positive value of Euro 915 thousand (negative in the amount of Euro 824 thousand as at 31 December 2016), and the reserve for actuarial gains and losses from the measurement of post-employment benefits, negative in the amount of Euro 57 thousand (negative at Euro 60 thousand as at 31 December 2016).
Retained earnings (losses carried forward) of Euro 119,986 thousand as at 30 June 2017 (Euro 66,900 thousand as at 31 December 2016), increased by Euro 53,086 thousand due to the allocation of profit for 2016 amounting to Euro 53,093

CONDENSED CONSOLIDATED INTERIM FINANCIAL STATEMENTS AS AT 30 JUNE 2017 YNAP GROUP | 70
thousand (net of the parent company loss covered through the use of the share premium reserve) and their allocation to the legal reserve totalling Euro 7 thousand.
Minority interests are detailed in the table below:
NAME BALANCE AS AT 30/06/2017 BALANCE AS AT 31/12/2016 CHANGE
YNAP MIDDLE EAST (SYMPHONY) 6,511 - 6,511
TOTAL 6,511 - 6,511
Composition of minority interests:
BALANCE AS AT 30/06/2017 BALANCE AS AT 31/12/2016 CHANGE
SHARE CAPITAL - - -
SHARE PREMIUM RESERVE - - -
TRANSLATION RESERVE - - -
OTHER RESERVES 6,802 - 6,802
NET INCOME FOR THE YEAR (291) - (291)
TOTAL 6,511 - 6,511
8.24 STOCK OPTION PLANS AND COMPANY INCENTIVE PLANS Granting of stock options Following approval of the share-split at the extraordinary shareholders’ meeting of the Parent Company on 8 September 2009, beneficiaries of Stock Option Plans exercising their options will be entitled to 52 ordinary shares of the Company for every option exercised, except for the 2012-2015 Stock Option Plan and the 2015-2025 Stock Option Plan, which provide for the ratio of one share for every option exercised. With reference to the Stock Option Plans and company Incentive Plans reserved for employees, associates, consultants and directors of the Company and its subsidiaries, as at 03 June 2017 the Board of Directors had granted the following options, outlined in the table below:
STOCK OPTION PLANS
GRANTED (A) EXPIRED
(B) EXERCISED (C)
TOTAL GRANTED NOT
EXPIRED OR NOT EXERCISED
(D = A-B-C)
GRANTED, NOT
VESTED
GRANTED, VESTED, NOT EXERCISABLE
GRANTED, VESTED AND EXERCISABLE
2001 – 2003 80,575 31,560 49,015 0 0 0 0
2003 – 2005 36,760 3,000 33,760 0 0 0 0
2004 – 2006 32,319 12,650 19,169 500 0 0 500
2006 – 2008 31,303 200 26,767 4,336 0 0 4,336
2007 – 2012 102,600 3,650 87,677 11,273 0 0 11,273
2009 – 2014 94,448 24,599 69,849 0 0 0 0
TOTAL 378,005 75,659 286,237 16,109 0 0 16,109
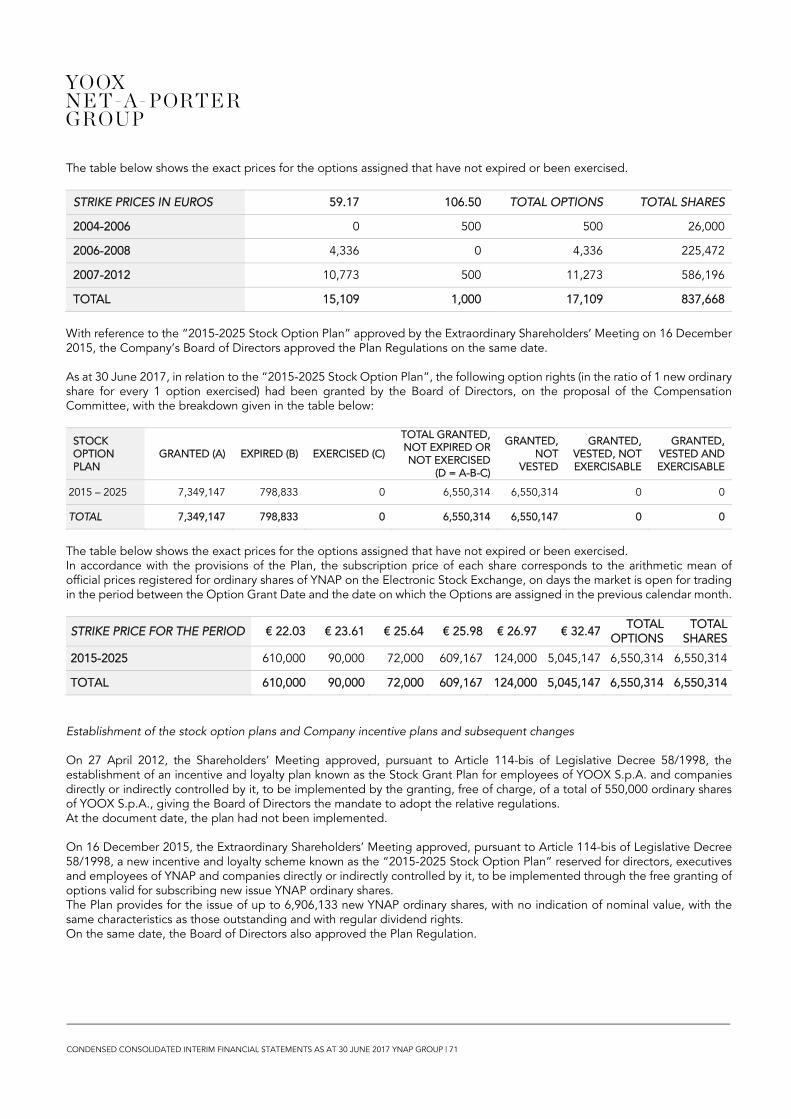
CONDENSED CONSOLIDATED INTERIM FINANCIAL STATEMENTS AS AT 30 JUNE 2017 YNAP GROUP | 71
The table below shows the exact prices for the options assigned that have not expired or been exercised.
STRIKE PRICES IN EUROS 59.17 106.50 TOTAL OPTIONS TOTAL SHARES
2004-2006 0 500 500 26,000
2006-2008 4,336 0 4,336 225,472
2007-2012 10,773 500 11,273 586,196
TOTAL 15,109 1,000 17,109 837,668
With reference to the “2015-2025 Stock Option Plan” approved by the Extraordinary Shareholders’ Meeting on 16 December 2015, the Company’s Board of Directors approved the Plan Regulations on the same date. As at 30 June 2017, in relation to the “2015-2025 Stock Option Plan”, the following option rights (in the ratio of 1 new ordinary share for every 1 option exercised) had been granted by the Board of Directors, on the proposal of the Compensation Committee, with the breakdown given in the table below:
STOCK OPTION PLAN
GRANTED (A) EXPIRED (B) EXERCISED (C)
TOTAL GRANTED, NOT EXPIRED OR NOT EXERCISED
(D = A-B-C)
GRANTED, NOT
VESTED
GRANTED, VESTED, NOT EXERCISABLE
GRANTED, VESTED AND EXERCISABLE
2015 – 2025 7,349,147 798,833 0 6,550,314 6,550,314 0 0
TOTAL 7,349,147 798,833 0 6,550,314 6,550,147 0 0
The table below shows the exact prices for the options assigned that have not expired or been exercised. In accordance with the provisions of the Plan, the subscription price of each share corresponds to the arithmetic mean of official prices registered for ordinary shares of YNAP on the Electronic Stock Exchange, on days the market is open for trading in the period between the Option Grant Date and the date on which the Options are assigned in the previous calendar month.
STRIKE PRICE FOR THE PERIOD € 22.03 € 23.61 € 25.64 € 25.98 € 26.97 € 32.47 TOTAL
OPTIONSTOTAL
SHARES
2015-2025 610,000 90,000 72,000 609,167 124,000 5,045,147 6,550,314 6,550,314
TOTAL 610,000 90,000 72,000 609,167 124,000 5,045,147 6,550,314 6,550,314
Establishment of the stock option plans and Company incentive plans and subsequent changes On 27 April 2012, the Shareholders’ Meeting approved, pursuant to Article 114-bis of Legislative Decree 58/1998, the establishment of an incentive and loyalty plan known as the Stock Grant Plan for employees of YOOX S.p.A. and companies directly or indirectly controlled by it, to be implemented by the granting, free of charge, of a total of 550,000 ordinary shares of YOOX S.p.A., giving the Board of Directors the mandate to adopt the relative regulations. At the document date, the plan had not been implemented. On 16 December 2015, the Extraordinary Shareholders’ Meeting approved, pursuant to Article 114-bis of Legislative Decree 58/1998, a new incentive and loyalty scheme known as the “2015-2025 Stock Option Plan” reserved for directors, executives and employees of YNAP and companies directly or indirectly controlled by it, to be implemented through the free granting of options valid for subscribing new issue YNAP ordinary shares. The Plan provides for the issue of up to 6,906,133 new YNAP ordinary shares, with no indication of nominal value, with the same characteristics as those outstanding and with regular dividend rights. On the same date, the Board of Directors also approved the Plan Regulation.

CONDENSED CONSOLIDATED INTERIM FINANCIAL STATEMENTS AS AT 30 JUNE 2017 YNAP GROUP | 72
Share capital increases to service stock option plans On 16 December 2015, the Extraordinary Shareholders’ Meeting approved the capital increase servicing the 2015-2025 Stock Option Plan, for a maximum nominal amount of Euro 69,061.33 through a capital contribution in one or more tranches, pursuant to Article 2441, paragraphs 5 and 6 of the Italian Civil Code, and therefore with the exclusion of option rights, by issuing a maximum of 6,906,133 new YNAP ordinary shares, with no indication of nominal value, with the same characteristics as those outstanding and with regular dividend rights. The deadline for subscription to the capital increase has been set as 31 December 2025, with the provision that if the capital increase has not been fully subscribed by this deadline, the share capital shall, pursuant to Article 2439, paragraph 2 of the Italian Civil Code, be deemed to be increased by an amount equal to the subscriptions received up to that moment and with effect from that moment, provided that these resolutions have been filed with the Register of Companies. Pursuant to the 2015-2025 Stock Option Plan, during the first half of 2017 the Company made the following stock grants:
on 18 April 2017, the granting to 38 beneficiaries of 610,000 options valid for the subscription of 610,000 YNAP shares;
on 21 June 2017, the granting to 2 beneficiaries of 72,000 options valid for the subscription of 72,000 YNAP ordinary shares.
For more information regarding the main characteristics of the Plan, please refer to the Prospectus issued pursuant to Article 84-bis of Consob Regulation 11971/1999 (as updated on 31 March 2017, available on the Company’s website www.ynap.com (Governance Section - Documents, Principles and Procedures - Corporate Documents). 8.25 MEDIUM-/LONG-TERM FINANCIAL LIABILITIES - BANK LOANS AND OTHER CURRENT
FINANCIAL PAYABLES Bank loans and other financial liabilities stood at Euro 142,784 thousand, an increase of Euro 26,163 thousand compared with 31 December 2016 (Euro 116,621 thousand).
DESCRIPTION BALANCE AS AT
30/06/2017 BALANCE AS AT
31/12/2016 CHANGE
MEDIUM-/-LONG-TERM FINANCIAL LIABILITIES 82,010 98,982 (16,973)
BANK LOANS AND OTHER CURRENT FINANCIAL LIABILITIES 60,774 17,639 43,135
TOTAL 142,784 116,621 26,163
The following table shows the breakdown of debt as at 30 June 2017:
LENDING INSTITUTION REMAINING AMOUNT RATE SHORT-TERM
PORTION MEDIUM-/LONG-
TERM PORTION
BANCA SELLA 417 EURIBOR + 2.3% 417 -
EIB 22,756 FIX (AVG 1.66%) 9,040 13,716
SYNDICATE 75,000 EURIBOR + 0.85% 10,717 64,283
FACTOR (IFITALIA) 35,852 EURIBOR + VARIOUS% 35,852 -
FINANCIAL LEASES 8,697 FIXED 4,685 4,011
ACCRUED LIABILITIES 62 62 -
TOTAL 142,784 60,774 82,010
The summarised details of loan agreements and lines of credit stipulated in the first half of 2017 are given below:

CONDENSED CONSOLIDATED INTERIM FINANCIAL STATEMENTS AS AT 30 JUNE 2017 YNAP GROUP | 73
COMMITMENTS OF FINANCIAL NATURE (COVENANTS) The Company, including for the purposes of Article 1461 of the Italian Civil Code, recognises that it is essential to comply with the financial covenants calculated on the basis of the consolidated financial statements in the name of YOOX NET-A-PORTER GROUP S.p.A., and acknowledges that the “Bank” can terminate the agreements if the financial situation reflected in the consolidated financial statements does not comply with any one of these covenants. Below are the financial parameters for the loan agreed with Banca Nazionale del Lavoro, UniCredit and Banca Intesa:
1) the ratio between the Net Financial Position and EBITDA including the incentive plans should not be more than 2.5 until the total loan repayment;
2) the ratio between the net financial position and Shareholders’ Equity should not be more than 1.0 until the total loan repayment.
The finance parameter for the loan taken out with the European Investment Bank is also provided:
1) the ratio between the net financial position and EBITDA including the incentive plans should not be more than 2.0 until the total loan repayment;
2) the ratio between the net financial position and Shareholders’ Equity should not be more than 0.8 until the total loan repayment.
YOOX NET-A-PORTER GROUP S.p.A. will notify the “Banks” of the above financial parameters on a half-yearly basis, on 30 June and 31 December every year until the due date. If any one of the above covenants is not complied with, YOOX NET-A-PORTER GROUP S.p.A., without prejudice to the right of the “Bank” to terminate the agreement, undertakes to reach an agreement with the “Bank”, within 30 business days of the request, over the financial and management measures necessary to ensure that the covenants in question fall within the terms set, or, alternatively, to repay the loan in advance on the due date of the interest period in progress. In relation to the aforementioned financing agreed, it should be noted that as at 30 June 2017, just as at 31 December 2016, the aforementioned financial parameters were complied with by the Group. As at 30 June 2017, financing with other credit institutions is not governed by compliance with parameters of a financial and commercial nature.

CONDENSED CONSOLIDATED INTERIM FINANCIAL STATEMENTS AS AT 30 JUNE 2017 YNAP GROUP | 74
Net financial position The table below gives a breakdown of net financial position as at 30 June 2017:
DESCRIPTION BALANCE AS AT
30/06/2017 BALANCE AS AT
31/12/2016 CHANGE
CASH AND CASH EQUIVALENTS 186,518 155,465 31,053
CURRENT FINANCIAL ASSETS 39,810 66,995 (27,184)
OTHER CURRENT FINANCIAL ASSETS 1,695 672 1,023
BANK LOANS AND OTHER CURRENT FINANCIAL LIABILITIES (60,774) (17,639) (43,135)
OTHER CURRENT FINANCIAL LIABILITIES (491) (1,809) 1,317
CURRENT NET FINANCIAL POSITION 166,758 203,684 (36,926)
MEDIUM-/-LONG-TERM FINANCIAL LIABILITIES (82,010) (98,982) 16,973
NET FINANCIAL POSITION30 84,748 104,701 (19,953)
In 2017, the Group’s net financial position deteriorated by Euro 19,953 thousand, going from a positive figure of Euro 104,701 thousand as at 31 December 2016 to a positive figure of Euro 84,748 thousand as at 30 June 2017. 8.26 EMPLOYEE BENEFIT LIABILITIES This item refers exclusively to the post-employment benefits recorded by the Parent Company in accordance with current legislation. Changes in defined benefit plans for employees in the first half of 2017 are summarised below:
DESCRIPTION BALANCE AS AT
31 DECEMBER 2016 PROVISIONS UTILISATION
BALANCE AS AT 30 JUNE 2017
EMPLOYEE BENEFITS 153 1 5 149
TOTAL 153 1 5 149
30 Net debt (or net financial position) is the sum of cash and cash equivalents, other current financial assets, net of bank loans and other financial liabilities falling
due within one year, other current financial liabilities, and medium-/long-term financial liabilities. Net financial debt (or net financial position) is not recognised as an accounting measure under Italian GAAP or the IFRS endorsed by the European Union. The measurement criterion adopted by the Company might not be consistent with that adopted by other groups and, accordingly, the balance obtained by the Company may not be comparable with those calculated by such groups. For details of the items that make up net financial debt (or net financial position), see the table above in the section “Net financial position”. “Other current financial assets” are not governed by the definition of net financial debt (or net financial position) of the CESR. The Group believes this definition should be supplemented including claims vs. acquirers and logistics operators from whom cash on delivery is required under “Other current financial assets”.

CONDENSED CONSOLIDATED INTERIM FINANCIAL STATEMENTS AS AT 30 JUNE 2017 YNAP GROUP | 75
The main technical, demographic and economic parameters used in the actuarial calculation of employee benefits as at 30 June 2017 are summarised below:
ACTUARIAL ASSUMPTIONS USED FOR THE CALCULATIONS
SURVIVAL TABLES ISTAT SIM AND SIF TABLES FOR 2015
ANNUAL TURNOVER RATE 2.90%
LIKELIHOOD OF REQUESTS FOR SEVERANCE INDEMNITY ADVANCES 7.60%
DISCOUNT RATE 1.67% (IBOXX CORPORATES AA € 10+)
INFLATION RATE 1.50%
% REQUESTS FOR ADVANCES 70.00%
NOMINAL REMUNERATION GROWTH RATE 1.50%
8.27 DEFERRED TAX LIABILITIES The following tables show the breakdown of, and changes in, deferred tax liabilities as at 30 June 2016:
DESCRIPTION BALANCE AS
AT 31/12/2016 INCREASES DECREASES
EXCHANGE DIFFERENCE FROM
CONVERSION
BALANCE AS AT 30/06/2017
DEFERRED TAX LIABILITIES 77,140 1,854 (4,469) (1,931) 72,594
TOTAL 77,140 1,854 (4,469) (1,931) 72,594
DESCRIPTION OF TAXABLE ITEM BALANCE AS AT
30/06/2017 2017 TAX RATE TAX RECORDED IN 2017
UNREALISED EXCHANGE RATE GAINS 2016 - 24% -
POSITIVE FAIR VALUE (CFH) OF DERIVATIVES 1,696 24% 407
PPA – BRAND 270,263 20% 54,053
PPA – CL 47,542 20% 9,508
DEFERMENT - OTHER ITEMS 43,132 20% 8,626
TOTAL 362,633 72,594

CONDENSED CONSOLIDATED INTERIM FINANCIAL STATEMENTS AS AT 30 JUNE 2017 YNAP GROUP | 76
8.28 PROVISIONS FOR CURRENT AND NON-CURRENT RISKS AND CHARGES This item reflects provisions for estimated current liabilities as at 30 June 2017, the timing and extent of which cannot be determined. The following table shows the breakdown of the item and changes in the first half of 2017:
DESCRIPTION BALANCE
AS AT 31/12/2016
INCREASES DECREASES EXCHANGE
DIFFERENCE FROM CONVERSION
BALANCE AS AT
30/06/2017
PROVISION FOR THEFT AND LOSS 463 170 (455) - 178
PROVISION FOR FRAUD 683 1,678 (683) - 1,678
OTHER PROVISIONS FOR RISKS AND CHARGES
357 357
COMPLIANCE RISK 53,835 - (15,894) (1,077) 36,864
OPERATIONAL RISK 3,410 - (1,700) (54) 1,656
TOTAL PROVISIONS FOR CURRENT RISKS AND CHARGES
58,748 1,848 (18,732) (1,131) 40,734
During the period, Euro 455 thousand from the provision for theft and loss was used, and it was therefore deemed appropriate to proceed with a further accrual of Euro 170 thousand, following a new estimate. Euro 683 thousand was utilised from the provision for fraud, and it was therefore deemed appropriate to proceed with a further accrual of Euro 1,678 thousand, to cover fraud committed via online sales paid for by credit card. This fraud coverage provision was calculated taking into account the historical incidence of the value of fraud in relation to the value of sales. We also note that the declines in the period were influenced to the extent of Euro 17,594 thousand by the valuation of the liabilities assumed within the scope of THE NET-A-PORTER group aggregation operation, pertaining to the assessment of the compliance and operational risks deemed possible as at the date of acquisition. 8.29 TRADE PAYABLES The following table shows a breakdown of trade payables as at 30 June 2017:
DESCRIPTION BALANCE AS AT
30/06/2017 BALANCE AS AT
31/12/2016 CHANGE
DUE TO SUPPLIERS 373,780 300,971 72,809
CREDIT NOTES TO BE RECEIVED FROM SUPPLIERS (3,426) (4,241) 815
INVOICES TO BE RECEIVED FROM SUPPLIERS 104,864 99,803 5,061
DUE TO CREDIT CARD OPERATORS 3,622 2,879 742
TOTAL 478,840 399,412 79,427
In the first half of 2017, trade payables increased from Euro 399,412 thousand as at 31 December 2016 to Euro 478,840 thousand at 30 June 2017. Trade payables are all payables relating to the purchase of goods and services from Group suppliers. Payables are recorded at their nominal value. Since all payables fall due within one year, none are subject to discounting. “Trade payables” includes all amounts due to suppliers, both for the supply of finished products and raw materials, and for the supply of intangible assets.

CONDENSED CONSOLIDATED INTERIM FINANCIAL STATEMENTS AS AT 30 JUNE 2017 YNAP GROUP | 77
8.30 TAX PAYABLES Current tax liabilities relate exclusively to the current income tax liability, net of payments on account.
DESCRIPTION BALANCE AS AT 30/06/2017 BALANCE AS AT 31/12/2016 CHANGE
CURRENT INCOME TAX LIABILITY 23,271 24,192 (921)
TOTAL 23,271 24,192 (921)
During the first half of 2017, this payable balance decreased by Euro 921 thousand, from Euro 24,192 thousand as at 31 December 2016 to Euro 23,271 thousand as at 30 June 2017. 8.31 OTHER SHORT- AND MEDIUM-/LONG-TERM PAYABLES The following table shows a breakdown of other payables as at 30 June 2017:
DESCRIPTION BALANCE AS AT
30/06/2017 BALANCE AS AT
31/12/2016 CHANGE
DUE TO SOCIAL SECURITY INSTITUTIONS 5,301 4,485 817
CREDIT NOTES TO BE ISSUED TO CUSTOMERS 57,419 67,085 (9,666)
DUE TO DIRECTORS 531 679 (148)
DUE TO EMPLOYEES 21,506 25,794 (4,288)
DUE TO TAX REPRESENTATIVES 7,134 9,828 (2,695)
OTHER PAYABLES 24,685 27,944 (3,259)
ACCRUED EXPENSES AND DEFERRED INCOME 1,240 5,173 (3,932)
TOTAL 117,817 140,988 (23,172)
The item “Due to social security institutions” reflects contributions payable to social security institutions, mainly on the amounts recognised to employees at the close of the half year. Credit notes to be issued to customers relate to certain payables for returns on sales made in the first half of 2017. The item “Due to tax representatives” reflects indirect tax liabilities. Sales carried out in European countries in the first half of 2017 and in 2016 exceeded the threshold set out in Article 41, paragraph 1, letter b) of Decree-Law 331/93, which requires payment of VAT in the destination country for goods sold. In order to comply with this requirement, the Company has opened VAT accounts in these countries. Note that at 30 June 2017 the Group recognized other medium-/long-term payables in the amount of Euro 8,099 thousand due to the straight lining of operating leases held by THE NET-A-PORTER Group. CONSOLIDATED STATEMENT OF CASH FLOWS 8.32 NET PROFIT FOR THE PERIOD, TAXES FOR THE PERIOD, INCOME TAXES PAID Details of consolidated profit for the period, taxes for the period, depreciation and amortisation and other non-monetary income statement items are provided in Notes 8.3, 8.4, 8.5, 8.9, 8.10, 8.11, 8.12, 8.13 and 8.14. In relation to the income tax allocation in the first half of 2017 of Euro 8,793 thousand (negative at Euro 14,565 thousand in 2016), tax payments amounting to Euro 16,507 thousand were made (Euro 15,229 thousand in 2016) relating to tax

CONDENSED CONSOLIDATED INTERIM FINANCIAL STATEMENTS AS AT 30 JUNE 2017 YNAP GROUP | 78
outstanding for the previous year and payments on account, calculated in accordance with the respective tax regulations in force in the various countries where the Group operates. 8.33 OTHER NET NON-MONETARY EXPENSES/( INCOME) Other net non-monetary income and expenses include non-monetary items on the income statement apart from income tax, depreciation and amortisation and provisions that are classified as a direct deduction from asset items (allowance for impairment and provisions for obsolescence). This includes provisions for defined benefit plans for employees (TFR), the measurement at fair value of stock option plans, provisions for risks and charges, capital gains and capital losses, unrealised foreign exchange fluctuations and recognised interest income and expenses. In relation to these last items, interest received and interest paid are presented separately. 8.34 CHANGE IN TRADE RECEIVABLES, INVENTORIES AND TRADE PAYABLES This item reports the use or generation of cash relative to net working capital, i.e. changes in trade receivables, inventories and trade payables. Changes in trade payables refer exclusively to supplies of raw materials, goods and services, excluding the change in payables to suppliers of investments, which are reported in the section of the statement of cash flows relating to cash generated by or used in investing activities. 8.35 CHANGES IN OTHER CURRENT ASSETS AND LIABILITIES This item reflects the change in all other current assets and liabilities, net of the effects of recognising non-monetary income and expenses, i.e. the change in the balances with a direct effect on the use or generation of cash. 8.36 ACQUISITION OF PROPERTY, PLANT AND EQUIPMENT AND PROCEEDS FROM THE SALE
OF PROPERTY, PLANT AND EQUIPMENT Cash flow from the acquisition of property, plant and equipment reflects both expenditure to replace plants and expenditure on new plants. The amount reported also includes the change in investment payables. 8.37 OUTLAYS FOR INVESTMENTS IN OTHER INTANGIBLE ASSETS Cash flow for acquisition of other intangible assets relates to investments in licences and software and the capitalisation of development costs (for a breakdown of these, see Note 8.14. Capitalisations are classified among cash flow generated by/used in investing activities since they involve a cash outflow associated with the internal costs incurred (mainly personnel expenses). These outflows were broadly in line with costs capitalised during the period. 8.38 OUTLAYS FOR INVESTMENTS IN ASSOCIATES No cash was used by the investment in the associate E_Lite. 8.39 ACQUISITION OF AND PROCEEDS FROM DISPOSALS OF OTHER NON-CURRENT FINANCIAL
ASSETS Other non-current financial assets at 30 June 2017 changed by Euro 117 thousand compared with the same period of the previous year.

CONDENSED CONSOLIDATED INTERIM FINANCIAL STATEMENTS AS AT 30 JUNE 2017 YNAP GROUP | 79
8.40 INCREASE IN SHARE CAPITAL AND SHARE PREMIUM RESERVE For information on total receipts for increases in share capital and the share premium reserve, please see Note 8.23 “Equity attributable to owners of the Parent Company”. 8.41 ARRANGEMENT AND REPAYMENT OF MEDIUM-/LONG-TERM FINANCIAL LIABILITIES Repayments of other medium-/long-term financial liabilities relate to loans from banks and other lenders, as described in Note 8.25. 8.42 ARRANGEMENT AND REPAYMENT OF SHORT-TERM FINANCIAL LIABILITIES The change in short-term bank exposure is included in the change in short-term financial liabilities, since these are forms of short-term borrowing, as described in Note 8.25.

9.
DIS
CL
OS
UR
E O
F F
INA
NC
IAL
RIS
KS
A
. A
cco
unti
ng
cla
ssific
ati
on a
nd
fair
valu
e
The t
ab
le b
elo
w s
ho
ws
the c
arr
ying
am
ount
and
fair
valu
e o
f each
fin
anci
al ass
et
and
lia
bili
ty,
as
well
as
the r
ela
tive
fair
valu
e h
iera
rchy
leve
l.
30 J
UN
E 2
017
CA
RR
YIN
G V
ALU
E
FA
IR V
ALU
E
TH
OU
SA
ND
S O
F E
UR
OS
NO
TE
S
LO
AN
S A
ND
R
EC
EIV
AB
LE
S
FIN
AN
CIA
L
ASSE
TS A
T
FA
IR V
ALU
E
RE
CO
RD
ED
IN
IN
CO
ME
STA
TE
ME
NT
FA
IR V
ALU
E -
H
ED
GIN
G
INST
RU
ME
NT
S
FIN
AN
CIA
L
LIA
BIL
ITIE
S A
T
FA
IR V
ALU
E
RE
CO
RD
ED
IN
IN
CO
ME
STA
TE
ME
NT
OT
HE
R
FIN
AN
CIA
L
LIA
BIL
ITIE
S
TO
TA
L LE
VE
L 1
LE
VE
L 2
LE
VE
L 3
T
OTA
L
FIN
AN
CIA
L A
SSE
TS
OT
HE
R N
ON
-CU
RR
EN
T F
INA
NC
IAL
ASSE
TS
2,7
30
- -
- -
2,7
30
- -
- -
TR
AD
E R
EC
EIV
AB
LES
40,5
73
- -
- -
40
,57
3
- -
- -
OT
HE
R C
UR
RE
NT
ASSE
TS
35,0
01
- 1,6
96
- -
36
,69
7
- 1
,69
6
- 1
,69
6
CA
SH
AN
D C
ASH
EQ
UIV
ALE
NT
S
186,5
18
- -
- -
18
6,5
18
- -
- -
TO
TA
L FIN
AN
CIA
L A
SSE
TS
264,8
22
- 1
,69
6
- -
26
6,5
18
- 1
,69
6
- 1
,69
6
FIN
AN
CIA
L L
IAB
ILIT
IES
BA
NK
OV
ER
DR
AFT
S
-
- -
- (3
5,8
52)
(35,8
52)
- -
- -
GU
AR
AN
TE
ED
BA
NK
LO
AN
S
-
- -
- (9
8,2
34)
(98,2
34)
- (9
8,2
34)
- (9
8,2
34)
NO
N-G
UA
RA
NT
EE
D B
AN
K L
OA
NS
-
- -
- -
- -
- -
-
LIA
BIL
ITIE
S F
OR
FIN
AN
CIA
L LE
ASE
S
-
- -
- (8
,699)
(8,6
99)
- (8
,699)
- (8
,699)
TR
AD
E P
AYA
BLE
S
-
- -
- (4
78,8
40)
(478,8
40)
- -
- -
OT
HE
R L
IAB
ILIT
IES
-
- (4
91)
- (1
17,3
25)
(117,8
17)
- (4
91)
- (4
91
)
TO
TA
L FIN
AN
CIA
L LI
AB
ILIT
IES
-
- (4
91
) -
(738,9
50)
(739,4
42)
- (1
07,4
24)
- (1
07,4
24)
CONDENSED CONSOLIDATED INTERIM FINANCIAL STATEMENTS AS AT 30 JUNE 2017 YNAP GROUP | 80

31 D
EC
EM
BE
R 2
016
C
AR
RY
ING
VA
LUE
FA
IR V
ALU
E
TH
OU
SA
ND
S O
F E
UR
OS
NO
TE
S
LO
AN
S A
ND
R
EC
EIV
AB
LE
S
FIN
AN
CIA
L
ASSE
TS A
T
FA
IR V
ALU
E
RE
CO
RD
ED
IN
IN
CO
ME
STA
TE
ME
NT
FA
IR V
ALU
E -
H
ED
GIN
G
INST
RU
ME
NT
S
FIN
AN
CIA
L
LIA
BIL
ITIE
S A
T
FA
IR V
ALU
E
RE
CO
RD
ED
IN
IN
CO
ME
STA
TE
ME
NT
OT
HE
R
FIN
AN
CIA
L
LIA
BIL
ITIE
S
TO
TA
L LE
VE
L 1
LE
VE
L 2
LE
VE
L 3
T
OTA
L
FIN
AN
CIA
L A
SSE
TS
OT
HE
R N
ON
-CU
RR
EN
T F
INA
NC
IAL
ASSE
TS
2,8
37
- -
- -
2,8
37
- -
- -
TR
AD
E R
EC
EIV
AB
LES
32,3
87
- -
- -
32
,38
7
- -
- -
OT
HE
R C
UR
RE
NT
ASSE
TS
47,4
99
- 672
- -
48
,17
1
- 672
- 672
CA
SH
AN
D C
ASH
EQ
UIV
ALE
NT
S
155,4
65
- -
- -
15
5,4
65
- -
- -
TO
TA
L FIN
AN
CIA
L A
SSE
TS
238,1
88
- 672
- -
238,8
60
- 672
- 672
FIN
AN
CIA
L L
IAB
ILIT
IES
BA
NK
OV
ER
DR
AFT
S
-
- -
- (2
,756)
(2,7
56)
- -
- -
GU
AR
AN
TE
ED
BA
NK
LO
AN
S
-
- -
- -
- -
- -
-
NO
N-G
UA
RA
NT
EE
D B
AN
K L
OA
NS
-
- -
- (1
02,2
49)
(102,2
49)
- (1
02,2
49)
- (1
02,2
49)
LIA
BIL
ITIE
S F
OR
FIN
AN
CIA
L LE
ASE
S
-
- -
- (1
1,6
16)
(11,6
16)
- (1
1,6
16)
- (1
1,6
16)
TR
AD
E P
AYA
BLE
S
-
- -
- (3
99,4
12)
(399,4
12)
- -
- -
OT
HE
R L
IAB
ILIT
IES
-
- (1
,809)
- (1
39,1
79)
(140,9
88)
- (1
,809)
- (1
,809)
TO
TA
L F
INA
NC
IAL L
IAB
ILIT
IES
-
- (1
,80
9)
- (6
55,2
12)
(657,0
21)
- (1
15,6
74)
- (1
15,6
74)
CONDENSED CONSOLIDATED INTERIM FINANCIAL STATEMENTS AS AT 30 JUNE 2017 YNAP GROUP | 81

CONDENSED CONSOLIDATED INTERIM FINANCIAL STATEMENTS AS AT 30 JUNE 2017 YNAP GROUP | 82
B. Hierarchical levels of fair value measurement In order to determine the fair value of financial instruments, the Group relies on measurement techniques based on observable market parameters (Mark to model), which are therefore included in level 2 of the fair value hierarchy identified in IFRS 13. IFRS 13 identifies a hierarchy of measurement techniques based on three levels:
Level 1: inputs are quoted prices in markets for identical assets or liabilities;
Level 2: inputs are inputs other than quoted market prices included within Level 1 that are observable for the financial asset or liability, either directly (prices) or indirectly (derived from prices);
Level 3: inputs that are unobservable; used to measure fair value to the extent that relevant observable inputs are not available, thereby allowing for situations in which there is little, if any, market activity for the asset or liability.
When it chooses its measurement techniques, the Group adheres to the following hierarchy: a) use of prices found in markets, even if they are inactive, of identical instruments (Recent Transactions) or similar instruments
(Comparable Approach);
b) use of measurement techniques based primarily on observable market parameters;
c) use of measurement techniques based primarily on unobservable market parameters. The Company has adopted procedures to assess the fair value of assets and liabilities using measurement techniques based on observable market parameters. The Company determined the fair value of the derivatives in place as at 30 June 2017 using generally accepted measurement techniques for instruments of the type used by the Group. The models applied for the measurement of instruments require calculations through the Bloomberg info provider. The input data used in the models are primarily observable market parameters (Euro, Yen and Dollar interest rate curve and official exchange rates at the measurement date) acquired from the Bloomberg info provider. In the first half of 2017, there were no transfers from Level 1 to Level 2 or vice versa. C. Financial risk management The Group is exposed to the following risks deriving from the use of financial instruments:
Credit risk, in relation to normal commercial dealings with customers as well as financing activities;
Liquidity risk, in relation to the availability of financial resources and access to the credit and financial instruments market;
Market risk, in relation to fluctuations in interest rates and exchange rates between the euro and the other currencies used by the Group.
The Group’s risk management policies aim to identify and analyse the risks to which the Group is exposed, establish appropriate limits and controls and monitor risks and compliance with those limits. These policies and the relative systems are revised on a regular basis to reflect any changes in market conditions and Group activities. CREDIT RISK Credit risk is the risk that a customer or financial instrument counterparty may cause a financial loss by not meeting a contractual obligation, and derives primarily from the Group’s trade receivables and debt securities.

CONDENSED CONSOLIDATED INTERIM FINANCIAL STATEMENTS AS AT 30 JUNE 2017 YNAP GROUP | 83
The carrying amount of financial assets represents the Group’s maximum exposure to credit risk. The existing receivables at the close of the period are chiefly due from customers, Group companies, other commercial counterparties and tax authorities. There are no significant overdue balances. CREDIT RISK WITH COMMERCIAL COUNTERPARTIES Due to the type of business carried out by the Group, credit risk exposure is limited as collections take place at the time of sale (payments by credit card) or upon delivery in the case of payment on delivery of the merchandise (COD). Credit risk related to any problem accounts subject to legal action or to overdue accounts is monitored centrally and reported each month. CREDIT RISK WITH FINANCIAL COUNTERPARTIES In relation to the credit risk deriving from other financial assets other than trade receivables, theoretical credit risk for the Group arises from the breach of a counterparty with a maximum exposure that is equal to the carrying amount of the financial asset recognised in the financial statements, as well as the nominal value of guarantees given on third-party debt or commitments specified in paragraph 11 of the notes. The Group has policies in place that limit the amount of credit exposure to the various banks. The YOOX NET-A-PORTER GROUP has obtained lines of credit from leading Italian and international banks of high standing. Insofar as the Group is aware, there are no potential losses deriving from the impossibility of financial counterparties to meet their contractual obligations of a significant or appreciable amount. LIQUIDITY RISK The Group aims to maintain appropriate levels of liquidity and available funds to sustain the growth of the business and ensure the timely fulfilment of its obligations. The YOOX NET-A-PORTER Group has preferred to adopt a flexible approach, adapted to the dynamic nature of the business in which it operates, through recourse to credit lines which on the one hand are committed, i.e. they do not include the possibility of the lenders asking for repayment before a pre-set date, and on the other hand are revolving, i.e. the Group has the possibility of repaying individual drawdowns, thereby rebuilding their availability. The net financial position as at 30 June 2017 was positive at Euro 84,748 thousand. MARKET RISK Market risk is the risk that the fair value or future cash flows of a financial instrument could fluctuate as a result of changes in market prices, due to changes in exchange rates, interest rates or equity instrument prices. The objective of market risk management is to manage and control the Group’s exposure to that risk within acceptable levels, while also optimising the return on investments. For the YOOX NET-A-PORTER-GROUP, market risk arises in the form of currency and interest rate risk. CURRENCY RISK The Group is exposed to currency risk when sales, purchases and loans are expressed in a currency other than the functional currencies of each Group entity which are, primarily, the Euro, the UK pound and the US dollar. The Group is principally exposed towards the US dollar, the UK pound, the Japanese yen and, only to a marginal extent, the Chinese renminbi and the Russian ruble. At all times, the Group covers the estimated exposure to changes in exchange rates with respect to expected sales. In 2017, this exposure is hedged using US dollar and Japanese yen forward sale agreements and collar options on US dollars and Japanese yen entered into with leading domestic and international credit institutions with which the Group works on a daily basis. All forward currency sale agreements and collar options have a term of less than one year after year-end close. The Group companies are located in countries not belonging to the European Monetary Union, specifically the UK, the United States, Japan, China and Hong Kong. Since the Group’s functional currency is the Euro, the income statements of these

CONDENSED CONSOLIDATED INTERIM FINANCIAL STATEMENTS AS AT 30 JUNE 2017 YNAP GROUP | 84
companies are translated into Euro at the average exchange rate for the period. Holding revenue and profits constant in their local currencies, changes in the exchange rates concerned may have an effect on the Euro amount of their revenue, costs and financial results. The Euro value of assets and liabilities of consolidated companies whose accounting currency is not the Euro may vary depending on exchange rate movements. In accordance with IFRS, the effects of these changes are recognised directly in equity, under the item “Translation reserve”. INTEREST RATE RISK Interest rate risk arises when a change in interest rates adversely affects performance for the year. Funding and credit lines available to the YOOX NET-A-PORTER Group are indexed to the Euribor, and therefore the Group is exposed to an increase in interest rates. The YOOX Group felt it advisable to manage the interest rate risk through recourse to interest rate swaps covering medium-/long-term funding agreed for financing the new techno-logistics platform. The interest cost of the majority of the Group’s bank loans is roughly equal to Euribor plus a spread of about 1.50%, in line with the previous year. HEDGE ACCOUNTING – CASH FLOW HEDGING The Group performs prospective and retrospective tests of the effectiveness of the derivative financial instruments recorded, using the rules of hedge accounting. Effectiveness is ensured if the ratio of the change in the fair value of the hedging instrument to the change in the fair value of the hedged instrument falls within the range of 80%-125%. In 2017, the Group put cash flow hedges into place in relation to a highly likely planned transaction. The financial instruments in place as at 30 June 2017 are forward contracts stated at fair value in the equity reserve, as set out in IFRS. FINANCIAL ASSETS AND LIABILITIES MEASURED AT AMORTISED COST Measured at amortised cost: held-to-maturity assets, trade receivables and payables, time deposits, loans, and other liabilities and assets measured at amortised cost (such as other receivables and payables). Pursuant to IFRS 7, the fair value of these items is remeasured by calculating the present value of the contractually-expected flows of principal and interest, with reference to the yield curve for government securities at the measurement date. Investments in repurchase agreements, mentioned previously, come under financial assets valued at amortised cost. The carrying amount of trade payables and receivables represents a reasonable approximation of their fair value. 10. INFORMATION PURSUANT TO IAS 24 ON MANAGEMENT REMUNERATION AND ON
RELATED PARTIES Transactions with related parties, as defined under IAS 24, at 30 June 2017, as well as at 31 December 2016 and 30 June 2016, were restricted to commercial, administrative and financial services relationships with subsidiaries and other related parties. The transactions form part of normal business operations, within the usual scope of activity of each of the interested parties, and are carried out under normal market conditions.

CONDENSED CONSOLIDATED INTERIM FINANCIAL STATEMENTS AS AT 30 JUNE 2017 YNAP GROUP | 85
Below is a non-exhaustive list of definitions of the related parties of an entity (the “Entity”) as indicated in IAS 24: a) entities that directly or indirectly:
(i) control the Entity, or (ii) are controlled by the Entity, or (iii) are subject to joint control with the Entity, or (iv) have significant influence over the Entity, or (v) have joint control over the Entity.
b) entities related to the Entity according to the definition set out in IAS 28 – Investments in Associates;
c) joint ventures in which the Entity has a shareholding; d) managers with strategic responsibility for the Entity or its parent company, including the directors and statutory auditors
of the Entity; e) the close family members of any physical persons included in points a) to d) above; f) entities controlled or jointly controlled by one of the persons described in points d) or e) above, or that are under the
significant influence of these persons; i.e. entities in which the persons described in d) and e) hold, either directly or indirectly, a significant share of the voting rights;
g) pension funds for employees of the Entity or any other entity related to it. 10.1 INTRA-GROUP TRANSACTIONS In order to provide more information on the extent of relationships within the Group, the following tables present transactions taking place between Group companies and cancelled out in the consolidated financial statements as at 30 June 2017, as well as at 31 December 2016 and 30 June 2016. The main relationships between the Group companies are chiefly commercial in nature and can be summarised as follows:
1. supply of products to the subsidiaries intended for sale on the US, Japanese, Asia Pacific and Chinese online stores; 2. maintenance, support and update services for the subsidiaries’ websites; 3. administrative, financial and legal services provided for the subsidiaries; 4. customer service support services provided for the subsidiaries; 5. consulting and support services in the area of fashion, marketing, advertising and professional training provided for the
subsidiaries.
The relationships between the Group companies and related parties are not considered to be atypical or unusual, and form part of the Group’s ordinary business operations. The transactions were carried out under normal market (i.e. arm’s-length) conditions. The following tables indicate receivables and payables among Group companies at 30 June 2017, 31 December 2016 and 30 June 2016. Receivables and payables related to subsidiaries are expressed in USD, JPY, CNY, HDK and GBP and translated into euros at the year-end exchange rate. Revenue and costs are expressed in USD, JPY, CNY, HKD and GBP and translated into EUR at the average exchange rate for the year in question.

CONDENSED CONSOLIDATED INTERIM FINANCIAL STATEMENTS AS AT 30 JUNE 2017 YNAP GROUP | 86
30 June 2017
TRADE
RECEIVABLES FINANCIAL
RECEIVABLES TRADE
PAYABLES FINANCIAL LIABILITIES
REVENUES COSTS
YNAP GROUP S.P.A. 74,317 2,461 5,754 29,077 85,262 1,132
YNAP CORPORATION (US) 2,035 - 25,944 177 137 42,639
YOOX KK (JAPAN) 105 795 10,656 - 35 20,613
MISHANG TRADING (SHANGHAI) CO LTD
15 - 20,736 1,696 5 4,208
YOOX ASIA LTD (HK) 1 1,910 9,854 - 9 15,898
LARGENTA LIMITED (UK) - - - - - -
THE NET-A-PORTER GROUP LIMITED (UK)
3,718 26,372 4,419 555 956 4515
NET-A-PORTER INTERNATIONAL LIMITED (UK)
- - - - - -
THE NET-A-PORTER GROUP ASIA PACIFIC (HK)
455 - 1,812 31 112 53
SHOUKE LTD (HK) - - - - - -
THE NET-A-PORTER GROUP CHINA (PRC)
66 - 6 2 61 -
YNAP MIDDLE EAST GENERAL TRADING LLC UAE)
- - 1,532 - - 1,517
TOTAL SUBSIDIARIES 80,712 31,539 80,712 31,539 86,576 86,576
31 December 2016
TRADE
RECEIVABLES FINANCIAL
RECEIVABLES TRADE
PAYABLES FINANCIAL LIABILITIES
REVENUES COSTS
YNAP GROUP S.P.A. 59,234 3,109 4,062 2,878 179,000 4,873
YNAP CORPORATION (US) 4,351 - 43,688 8,107 58,939 170,600
YOOX KK (JAPAN) 99 819 8,006 - 130 40,134
MISHANG TRADING (SHANGHAI) CO LTD
17 - 17,200 1,752 17 8,546
YOOX ASIA LTD (HK) 1 2,059 7,049 - 19 25,889
LARGENTA LIMITED (UK) - - - - - -
THE NET-A-PORTER GROUP LIMITED (UK)
49,646 7,752 8,070 937 96,184 73,390
NET-A-PORTER INTERNATIONAL LIMITED (UK)
137 - - - - 145
THE NET-A-PORTER GROUP ASIA PACIFIC (HK)
3,316 - 25,638 61 10,127 23,155
THE NET-A-PORTER GROUP CHINA LTD (PRC)
792 - 3,880 4 2,316 -
TOTAL SUBSIDIARIES 117,593 13,739 117,593 13,739 346,732 346,732

CONDENSED CONSOLIDATED INTERIM FINANCIAL STATEMENTS AS AT 30 JUNE 2017 YNAP GROUP | 87
30 June 2016
TRADE
RECEIVABLES FINANCIAL
RECEIVABLES TRADE
PAYABLES FINANCIAL LIABILITIES
REVENUES COSTS
YNAP GROUP S.P.A. 30,680 40,149 205 2,838 73,555 1,534
YOOX CORPORATION (US) 276 - 10,939 - 274 42,894
YOOX KK (JAPAN) 52 881 4,711 - 51 17,170
MISHANG TRADING (SHANGHAI) CO LTD
4 - 13,262 3,655 5 3,669
YOOX ASIA LTD (UK) - 1,957 2,771 - 9 10,484
LARGENTA LIMITED (UK) - - - - - -
THE NET-A-PORTER GROUP LIMITED (UK)
134,129 3,715 - 118,562 54,616 31,675
NET-A-PORTER INTERNATIONAL LIMITED (UK)
- - - 3,715 - -
THE NET-A-PORTER GROUP LLC (US)
576 59,547 91,409 - 28,391 43,052
THE NET-A-PORTER GROUP ASIA PACIFIC (HK)
11 25,424 42,286 - 4,623 12,037
SHOUKE LTD (HK) - - - 2,903 - -
THE NET-A-PORTER GROUP CHINA LTD (PRC)
597 - 742 - 991 -
TOTAL SUBSIDIARIES 166,325 131,673 166,325 131,673 162,515 162,515
10.2 REMUNERATION OF SENIOR MANAGERS AND OTHER KEY PERSONS WITHIN THE GROUP The senior management and key persons with strategic responsibility for management, planning and administration in the Group are, in addition to executive and non-executive directors, the Chief Financial Officer, General Manager, Chief Operating Officer and Co-General Manager. The gross annual remuneration of the above persons, inclusive of all forms of remuneration (including gross pay, bonuses and fringe benefits), as well as bonuses accrued but not paid out that are subject to the achievement of long-term objectives, are reported in the following table together with the fees of the members of the Board of Statutory Auditors: 30 June 2017
DESCRIPTION SHORT-TERM
BENEFITS LONG-TERM
BENEFITS STOCK OPTION PLANS AND
COMPANY INCENTIVE PLANS
DIRECTORS 1,111 400 3,291
STATUTORY AUDITORS 35
MANAGEMENT PERSONNEL WITH STRATEGIC RESPONSIBILITIES
974 178 641
TOTAL 2,120 578 3,932

CONDENSED CONSOLIDATED INTERIM FINANCIAL STATEMENTS AS AT 30 JUNE 2017 YNAP GROUP | 88
31 December 2016
DESCRIPTION SHORT-TERM
BENEFITS LONG-TERM
BENEFITS STOCK OPTION PLANS AND
COMPANY INCENTIVE PLANS
DIRECTORS 2,163 1,000 6,655
STATUTORY AUDITORS 71
MANAGEMENT PERSONNEL WITH STRATEGIC RESPONSIBILITIES
1,462 65 1,056
TOTAL 3,696 1,065 7,712
30 June 2016
DESCRIPTION SHORT-TERM
BENEFITS LONG-TERM
BENEFITS STOCK OPTION PLANS AND
COMPANY INCENTIVE PLANS
DIRECTORS 1,102 400 3,129
STATUTORY AUDITORS 35
MANAGEMENT PERSONNEL WITH STRATEGIC RESPONSIBILITIES
715 32 522
TOTAL 1,852 432 3,652
Finally, no close family members of any of the natural persons indicated above are related parties of the Issuer and/or the companies of the Group, as defined in IAS 24. 10.3 TRANSACTIONS WITH OTHER RELATED PARTIES The following tables list the main financial and commercial relationships between the companies of the Group and related parties other than Group companies, as at 30 June 2017, 31 December 2016 and 30 June 2016, excluding intra-Group relationships, which are described above. Commercial transactions with these entities are carried out under normal market conditions, and all transactions are carried out in the interests of the Group. 30 June 2017
DESCRIPTION TRADE
RECEIVABLES FINANCIAL
RECEIVABLES TRADE
PAYABLES FINANCIAL LIABILITIES
REVENUES COSTS
GATTI PAVESI BIANCHI STUDIO LEGALE ASSOCIATO
- - 1,147 - - 1,109
BIZMATICA SISTEMI S.P.A. 1,279 - 67 - 1,048 80
JC ACCOUNTING KK (FORMERLY KK TPI)
- - 17 - - 51
NAGAMINE MISHIMA ACCOUNTING OFFICE
- - 2 - - 17
TARTER KRINSKY E DROGIN LLP - - 46 - - 138
RICHEMONT GROUP 50 - 4,279 - 306 13,593
E_ LITE S.P.A. 906 - 6,796 - 11,861 -
TOTAL RELATED PARTIES 2,235 - 12,354 - 13,215 14,988

CONDENSED CONSOLIDATED INTERIM FINANCIAL STATEMENTS AS AT 30 JUNE 2017 YNAP GROUP | 89
31 December 2016
DESCRIPTION TRADE
RECEIVABLES FINANCIAL
RECEIVABLES TRADE
PAYABLES FINANCIAL LIABILITIES
REVENUES COSTS
GATTI PAVESI BIANCHI STUDIO LEGALE ASSOCIATO
- - 574 - - 1,574
BIZMATICA SISTEMI S.P.A. - - 19 - - 330
JC ACCOUNTING KK (FORMERLY KK TPI)
- - 10 - - 100
NAGAMINE MISHIMA ACCOUNTING OFFICE
- - 3 - - 30
TARTER KRINSKY E DROGIN LLP - - 161 - - 365
RICHEMONT GROUP 42 - 5,486 - 691 20,315
E_ LITE S.P.A. 14 - 12,051 - 19,930 -
TOTAL RELATED PARTIES 56 - 18,304 - 20,621 22,714
30 June 2016
DESCRIPTION TRADE
RECEIVABLES FINANCIAL
RECEIVABLES TRADE
PAYABLES FINANCIAL LIABILITIES
REVENUES COSTS
STUDIO LEGALE ASSOCIATO D’URSO GATTI E BIANCHI
- - 675 - - 931
BIZMATICA SISTEMI S.P.A. - - 102 - - 102
JC ACCOUNTING KK (FORMERLY KK TPI)
- - 19 - - 47
NAGAMINE ACCOUNTING - - 2 - - 23
TARTER KRINSKY E DROGIN LLP - - 48 - - 99
RICHEMONT GROUP 4 - 6,350 - 4,171 4,777
E_LITE 759 - 5,244 - 9,658 -
TOTAL RELATED PARTIES 763 - 12,440 - 13,829 5,979
The above entities are regarded as related parties of the Group for the following reasons:
Studio Legale D’Urso Gatti e Associati: a partner in the law firm is a director of the Parent;
Tarter Krinsky and Drogin LLP: a partner in the law firm is a member of the Board of Directors of one of the Group’s companies (YNAP Corporation);
KK TPI and Nagamine Accounting Office: the owner of both consultancy firms is a member of the Board of Directors of a Group company (YOOX Japan);
Bizmatica Sistemi S.p.A.: the chairman of the company is the son of a member of the Board of Directors of a Group company (YNAP GROUP S.p.A.);
E_lite: it is a 49% owned subsidiary.
Richemont, and its subsidiaries, since it is a Group shareholder. None of the transactions that took place with related parties in 2017 and 2016 was significant (except as mentioned above), atypical and/or unusual.

CONDENSED CONSOLIDATED INTERIM FINANCIAL STATEMENTS AS AT 30 JUNE 2017 YNAP GROUP | 90
11. OTHER INFORMATION COMMITMENTS AND GUARANTEES
DESCRIPTION BALANCE AS AT
30/06/2017 BALANCE AS AT
31/12/2016
THIRD-PARTY ASSETS HELD BY THE GROUP 168,503 167,029
SURETIES GIVEN TO OTHERS 7,308 6,400
COMMITMENTS UNDER HEDGING CONTRACTS (NOMINAL VALUE) 104,836 126,768
The companies’ warehouses hold goods worth Euro 168,503 thousand received on a sale-or-return basis from YNAP’s partners. The increase compared with the previous fiscal year was due exclusively to the increase in sales in the last quarter of the mono-brand online stores that store goods at our warehouses. The sureties, all given by the Parent Company, relate to the following contracts:
the contract agreed by the Parent Company with SINV, with effect from 12 May 2015, for a period of nine months, which may be renewed at the end of the contract, for the rental of office premises in Milan. The surety amounts to Euro 356,526.50 and will expire on 01 January 2019;
the contract agreed by the Company with Oslavia, with effect from 04 November 2016 for a period of six years, for the rental of office premises in Via Lombardini, Milan. The surety amounts to Euro 20,934.15 and expires on 31 July 2020;
the contract concluded by the Company following the repayment of the Global Collect guarantee deposit of Euro 1,200,000, after UniCredit issued a bank guarantee for the same amount, expiring on 30 June 2018;
the contract agreed with Logistica Bentivoglio S.r.l. with effect from 27 June 2011 and expiring on 31 December 2017 to guarantee compliance with obligations under the rental agreement for the warehouse at the Bentivoglio Blocco 9.5 Interporto totalling Euro 564,052;
the contract agreed by the Company with Despina S.p.A. to guarantee compliance with obligations under a rental contract with effect from 10 February 2017, relating to office premises at Via Nannetti 1 in Zola Predosa. The amount of the surety is Euro 400,000 expiring on 1 February 2018;
the contract agreed with Geodis Logistic S.p.A. with effect from 13 February 2013 and expiring on 30 January 2019 to guarantee compliance with obligations under the rental agreement for the warehouse and offices at the Interporto totalling Euro 103,621;
the contract agreed with Generali Italia Immobiliare, with effect from 25 July 2013 and expiring on 13 September 2019, for the rental of office space in Casalecchio di Reno in via del Lavoro. The amount of the surety is Euro 31,140.
the contract agreed with Vailog S.r.l. to guarantee compliance with obligations under the rental agreement for the warehouse and offices at the Interporto with effect from 4 November 2016 and expiring on 30 November 2025. The amount of the surety is Euro 224,000.
Guarantee line with HSBC on YNAP Corporation group company warehouses totalling Euro 2,112 thousand, effective as of September 2016 and expiring in July 2023.
Guarantee line with HSBC on the group company warehouses of THE NET-A-PORTER GROUP Asia Pacific Ltd group totalling Euro 2,296 thousand, starting from September 2015 and expiring in May 2021.

CONDENSED CONSOLIDATED INTERIM FINANCIAL STATEMENTS AS AT 30 JUNE 2017 YNAP GROUP | 91
The hedging contracts relate to:
forward sales set up by the Parent to cover the currency risk connected to intra-Group sales in US dollars and Japanese yen. The nominal amount of these commitments, translated to Euro at the exchange rate in effect at the reporting date, is Euro 29,419 thousand;
Interest Rate Swaps signed by the Parent Company to hedge the interest rate risk related to the medium-/long-term loan agreed for financing the new techno-logistics platform. The nominal amount of commitments at the reporting date is Euro 75,417 thousand.
12. SIGNIFICANT EVENTS AFTER 30 JUNE 2017 ASSIGNMENT OF SHARES FOLLOWING THE EXERCISE OF STOCK OPTIONS After the end of the half year, on 12 July and 28 July 2017, a total of 82,004 YNAP ordinary shares were granted following the exercise of 1,577 options relating to the 2006-2008 Stock Option Plan at a strike price of Euro 59.17 per option. As a result of the above, YNAP S.p.A.’s new share capital as at the date of this Report amounted to Euro 1,339,762.93, represented by 133,976,293 shares with no par value, of which 91,070,155 ordinary shares and 42,906,138 B Shares. ONLINE FLAGSHIP STORES In July 2017, YOOX NET-A-PORTER GROUP S.p.A. and Ferrari S.p.A. signed a multi-year global agreement for the design and management of Ferrari’s new Online Flagship Store, which already has a consolidated customer based and an already-launched e-commerce business of a significant size. The launch is envisioned for the first quarter of 2018. UPDATES ON INTEGRATION In July, the Group successfully achieved a further significant milestone with the launch of the first Online Flagship Store on the new front-end platform. This outcome further enhances the functionality of the Group's platform with sophisticated business tools, such as precision marketing and merchandising and also allows for greater customisation of the interface as well as full independence of use by both internal and external operators of the Group.

CONDENSED CONSOLIDATED INTERIM FINANCIAL STATEMENTS AS AT 30 JUNE 2017 YNAP GROUP | 92
ANNEX 1 Consolidated income statement as at 30/06/2017 prepared in accordance with Consob Resolution 15519 of 27 July 2006 and Consob Communication DEM/6064293 of 28 July 2006 (in thousands of Euro).
30 JUNE 2017 30 JUNE 2016
CONSOLIDATED INCOME STATEMENT BALANCE
OF WHICH
WITH RELATED PARTIES
% WEIGHTING
BALANCE
OF WHICH
WITH RELATED PARTIES
% WEIGHTING
AMOUNTS IN THOUSANDS OF EURO AND PERCENTAGE WEIGHTING ON INDIVIDUAL ITEMS:
NET REVENUES 1,034,106 12,167 1.2% 897,038 13,829 1.5%
COST OF GOODS SOLD (619,604) (13,593) 2.2% (542,154) (4,777) 0.9%
FULFILMENT COSTS (107,114) (94,591)
SALES AND MARKETING COSTS (124,929) (203) 0.2% (106,792) (169) 0.2%
GENERAL EXPENSES (138,506) (7,822) 5.6% (121,725) (6,968) 5.7%
OTHER INCOME AND EXPENSES (4,638) 985 -21.2% (2,795)
NON-RECURRING EXPENSES - -
OPERATING PROFIT 39,314 28,982
RESULT OF EQUITY INVESTMENTS 39 239
FINANCIAL INCOME 7,914 12,929
FINANCIAL EXPENSES (17,889) (13,952)
PROFIT BEFORE TAX 29,378 28,198
TAXES (8,793) (9,363)
CONSOLIDATED NET INCOME FOR THE YEAR 20,585 18,835
OF WHICH:
ATTRIBUTABLE TO OWNERS OF THE PARENT 20,876 18,835
ATTRIBUTABLE TO NON-CONTROLLING INTERESTS (291) -

CONDENSED CONSOLIDATED INTERIM FINANCIAL STATEMENTS AS AT 30 JUNE 2017 YNAP GROUP | 93
ANNEX 2 Consolidated statement of financial position as at 30/06/2017, prepared in accordance with Consob Resolution 15519 of 27 July 2006 and Consob Communication DEM/6064293 of 28 July 2006 (in thousands of Euro).
30 JUNE 2017 31 DECEMBER 2016
CONSOLIDATED STATEMENT OF FINANCIAL POSITION
BALANCE
OF WHICH
WITH RELATED PARTIES
% WEIGHTING
BALANCE
OF WHICH
WITH RELATED PARTIES
% WEIGHTING
AMOUNTS IN THOUSANDS OF EURO AND PERCENTAGE WEIGHTING ON INDIVIDUAL ITEMS
NON-CURRENT ASSETS
PROPERTY, PLANT AND EQUIPMENT 140,404 130,586
INTANGIBLE ASSETS WITH FINITE USEFUL LIFE 466,966 461,460
GOODWILL 1,199,341 1,231,769
EQUITY INTERESTS IN ASSOCIATES 740 701
DEFERRED TAX ASSETS 56,313 53,043
OTHER NON-CURRENT FINANCIAL ASSETS 2,730 2,837
TOTAL NON-CURRENT ASSETS 1,866,493 1,880,397
CURRENT ASSETS
INVENTORIES 646,268 578,200
TRADE RECEIVABLES 40,573 2,235 5.5% 32,387 56 0.2%
OTHER CURRENT ASSETS 36,697 48,171
CASH AND CASH EQUIVALENTS 186,518 155,465
CURRENT FINANCIAL ASSETS 39,810 66,995
TOTAL CURRENT ASSETS 949,866 881,218
TOTAL ASSETS 2,816,359 2,761,615
EQUITY
SHARE CAPITAL 1,339 1,337
RESERVES 1,790,071 1,833,826
RETAINED EARNINGS AND LOSSES RESERVE 120,076 66,900
CONSOLIDATED NET INCOME FOR THE PERIOD 20,585 33,930
EQUITY ATTRIBUTABLE TO SHAREHOLDERS OF THE PARENT
1,925,560 1,935,994
EQUITY ATTRIBUTABLE TO THIRD PARTIES 6,511 -

CONDENSED CONSOLIDATED INTERIM FINANCIAL STATEMENTS AS AT 30 JUNE 2017 YNAP GROUP | 94
30 JUNE 2017 31 DECEMBER 2016
CONSOLIDATED STATEMENT OF FINANCIAL POSITION
BALANCE
OF WHICH
WITH RELATED PARTIES
% WEIGHTING
BALANCE
OF WHICH
WITH RELATED PARTIES
% WEIGHTING
TOTAL CONSOLIDATED EQUITY 1,932,071 1,935,994
NON-CURRENT LIABILITIES
MEDIUM-/-LONG-TERM FINANCIAL LIABILITIES 82,010 98,982
EMPLOYEE BENEFIT LIABILITIES 149 153
PROVISIONS FOR RISKS AND NON-CURRENT CHARGES
- -
DEFERRED TAX LIABILITIES 72,594 77,140
OTHER MEDIUM-/LONG-TERM PAYABLES 8,099 8,367
TOTAL NON-CURRENT LIABILITIES 162,852 184,643
BANK LOANS AND OTHER CURRENT FINANCIAL LIABILITIES
60,774 17,639
PROVISIONS FOR RISKS AND CHARGES 40,734 58,748
TRADE PAYABLES 478,840 12,354 2.6% 399,412 18,304 4.6%
TAX LIABILITIES 23,271 24,192
OTHER PAYABLES 117,817 140,988
TOTAL CURRENT LIABILITIES 721,435 640,978
TOTAL CONSOLIDATED EQUITY AND LIABILITIES 2,816,359 2,761,615

CONDENSED CONSOLIDATED INTERIM FINANCIAL STATEMENTS AS AT 30 JUNE 2017 YNAP GROUP | 95
ANNEX 3 Consolidated statement of cash flows as at 30 June 2017, prepared in accordance with Consob Resolution 15519 of 27 July 2006 and Consob Communication DEM/6064293 of 28 July 2006 (in thousands of Euro).
30 JUNE 2017 30 JUNE 2016
CONSOLIDATED STATEMENT OF CASH FLOWS BALANCE
OF WHICH
WITH RELATED PARTIES
% WEIGHTING
BALANCE
OF WHICH
WITH RELATED PARTIES
% WEIGHTING
AMOUNTS IN THOUSANDS OF EURO AND PERCENTAGE WEIGHTING ON INDIVIDUAL ITEMS
CONSOLIDATED NET INCOME FOR THE PERIOD 20,585 18,835
ADJUSTMENTS FOR:
TAXES FOR THE PERIOD 8,793 9,363
FINANCIAL EXPENSES DURING THE PERIOD 17,889 13,952
FINANCIAL INCOME DURING THE PERIOD (7,914) (12,929) (3) 0.02%
SHARE OF EARNINGS FROM ASSOCIATES (39) (239)
AMORTISATION AND IMPAIRMENT LOSSES FOR THE PERIOD
52,126 41,621
FAIR VALUE ADJUSTMENT OF STOCK OPTION PLANS
6,555 5,945
UNREALISED EFFECT OF CHANGES IN FOREIGN EXCHANGE RATES
(13,237) (9,264)
LOSSES/(GAINS) ON SALE OF NON-CURRENT ASSETS
- 101
PROVISIONS FOR EMPLOYEE BENEFITS 10 17
PROVISIONS FOR RISKS AND CHARGES 1,848 562
PAYMENT OF EMPLOYEE BENEFITS (14) (15)
USE OF PROVISIONS FOR RISKS AND CHARGES (19,862) (13,669)
CHANGES IN INVENTORIES (68,067) 919
CHANGES IN TRADE RECEIVABLES (8,186) (2,179) 26.6% 7,381 522 7.1%
CHANGES IN TRADE PAYABLES 79,428 (5,950) -7.5% 8,970 (1,028) -11.5%
CHANGES IN OTHER CURRENT ASSETS AND LIABILITIES
(10,243) (40,742)
CASH FLOW FROM (USED IN) OPERATING ACTIVITIES
59,672 30,808
INCOME TAX PAID (16,507) (5,748)
INTEREST AND OTHER FINANCIAL EXPENSES PAID
(5,748) (13,952)
INTEREST AND OTHER FINANCIAL INCOME RECEIVED
113 12,929
CASH FROM (USED IN) OPERATING ACTIVITIES 37,530 24,037
INVESTING ACTIVITIES
ACQUISITION OF PROPERTY, PLANT AND EQUIPMENT
(28,821) (4,934)
ACQUISITION OF INTANGIBLE ASSETS (54,754) (40,404)

CONDENSED CONSOLIDATED INTERIM FINANCIAL STATEMENTS AS AT 30 JUNE 2017 YNAP GROUP | 96
30 JUNE 2017 30 JUNE 2016
CONSOLIDATED STATEMENT OF CASH FLOWS BALANCE
OF WHICH
WITH RELATED PARTIES
% WEIGHTING
BALANCE
OF WHICH
WITH RELATED PARTIES
% WEIGHTING
ACQUISITION OF EQUITY INVESTMENTS - -
ACQUISITION OF OTHER NON-CURRENT FINANCIAL ASSETS
108 237
ACQUISITION OF SUBSIDIARIES NET OF CASH AND CASH EQUIVALENTS ACQUIRED
- -
CASH FROM (USED IN) INVESTING ACTIVITIES (83,467) (45,101)
FINANCING ACTIVITIES
NEW SHORT-TERM LIABILITIES 45,164 37,866
REPAYMENT OF SHORT-TERM LIABILITIES (837) (9,717)
NEW MEDIUM-/LONG-TERM FINANCIAL LIABILITIES
- -
REPAYMENT OF MEDIUM-/LONG-TERM FINANCIAL LIABILITIES
(15,248) (6,573)
TREASURY SHARES ACQUISITION - -
INCREASE IN SHARE CAPITAL AND SHARE PREMIUM RESERVE
20,726 100,000
INVESTMENTS IN FINANCIAL ASSETS 27,184 (5,691)
CHANGE DUE TO DIFFERENCE BETWEEN CASH AND EQUITY EFFECT OF INCENTIVE PLANS
- -
CASH FLOW FROM (USED IN) FINANCING ACTIVITIES
76,990 115,885
TOTAL CASH FLOW FOR THE PERIOD 31,053 94,821
CASH AND CASH EQUIVALENTS AT THE BEGINNING OF THE PERIOD
155,465 130,340
CASH AND CASH EQUIVALENTS AT THE END OF THE PERIOD
186,518 225,161
TOTAL CASH FLOW FOR THE PERIOD 31,053 94,821

CERTIFICATION OF CONDENSED CONSOLIDATED INTERIM FINANCIAL REPORT | 97
Certification of the condensed consolidated interim financial statements pursuant to article 81-ter of CONSOB Regulation 11971 of 14 May 1999, as amended
CERTIFICATION OF THE CONDENSED CONSOLIDATED INTERIM FINANCIAL STATEMENTS PERSUANT TO
ARTICLE 81-TER OF CONSOB REGULATION No. 11971 OF 14 MAY 1999, AS AMENDED
1. The undersigned, Federico Marchetti, as Chief Executive Officer, and Enrico Cavatorta, as Director in charge of preparing
corporate accounting documents of YOOX NET-A-PORTER GROUP S.p.A. hereby certify, with due regard for the provisions of Article 154-bis (3 and 4) of Legislative Decree No. 58 of 24 February 1998: • the adequacy, with respect to the Company’s characteristics and • the effective application of the administrative and accounting procedures for the compilation of the condensed
interim financial statements, during the period from 01 January 2017 to 30 June 2017.
2. No significant aspects have emerged in this regard.
3. We also bear witness to the fact that:
3.1 The consolidated interim financial statements: a) were prepared in accordance with International Financial Reporting Standards endorsed by the European Union
pursuant to EC Parliament and Council Regulation No. 1606/2002 of 19 July 2002; b) correspond to entries made in accounting ledgers and records; c) are suitable for providing a true and fair view of the financial position and results of operations of the issuer and all
companies included in consolidation;
3.2 The Interim Directors’ Report includes a reliable analysis of the references to important events which have occurred during the first six months of the fiscal year and their influence on the condensed consolidated interim financial statements, together with a description of the main risks and uncertainties for the remaining six months of the fiscal year. The Interim Director's Report also includes a reliable analysis of disclosure of related-party transactions.
Milano (MI), 02 August 2017
Chief Executive Officer Federico Marchetti [signature]
Director in charge of preparing corporate accounting documents
Enrico Cavatorta
[signature]

CERTIFICATION OF CONDENSED CONSOLIDATED INTERIM FINANCIAL REPORT | 98

INDEPENDENT AUDITORS’ REPORT | 99
Independent auditors’ report on the limited audit of the condensed consolidated interim financial statements

Printed by: SERVIF RR Donnelley Financial – Milan