page number - yooxcdn3.yoox.biz/cloud/ynap/uploads/doc/2016/ynap_presentation_c… · page number...
TRANSCRIPT


P A G E N U M B E R
This presentation has been prepared by YOOX NET-A-PORTER GROUP S.p.A. for information purposes only and for use in presentations of theGroup’s results and strategies.
For further details on the YOOX NET-A-PORTER GROUP, reference should be made to publicly available information.
Statements contained in this presentation, particularly regarding any possible or assumed future performance of the Group and/or the industry inwhich the Company operates, are or may be forward-looking statements based on YOOX NET-A-PORTER GROUP S.p.A.’s current expectationsand projections about future events, and in this respect may involve risks and uncertainties.
Actual future results for any quarter, half-year or annual period may therefore differ materially from those expressed in or implied by thesestatements due to a number of different factors, many of which are beyond the ability of YOOX NET-A-PORTER GROUP S.p.A. to control orestimate precisely, including, but not limited to, the Group’s ability to manage the effects of the uncertain current global economic and financialconditions (also deriving from or connected to the recent “Brexit Referendum” outcomes) on our business and to predict future economicconditions, the Group’s ability to achieve and manage growth, the degree to which YOOX NET-A-PORTER GROUP S.p.A. enters into, maintainsand develops commercial and partnership agreements, the Group’s ability to successfully identify, develop and retain key employees, manageand maintain key customer relationships and maintain key supply sources, unfavorable development affecting consumer spending, the rate ofgrowth of the Internet and online commerce, competition, fluctuations in exchange rates, any failure of information technology, inventory andother asset risk, credit risk on our accounts, regulatory developments and changes in tax laws. YOOX NET-A-PORTER GROUP S.p.A. does notguarantee that the assumption underlying any forward-looking statements in this presentation are free from errors nor does not it accept anyresponsibility for the future accuracy of the opinions expressed in this presentation.
YOOX NET-A-PORTER GROUP S.p.A. does not undertake any obligation to review, update or confirm investors’ expectations and/or estimates orto publicly release any revisions to any forward-looking statements to reflect events or circumstances after the date of this presentation.
Any reference to past performance of the YOOX NET-A-PORTER GROUP shall not be taken as an indication of future performance.
This document does not constitute an offer or invitation to purchase or subscribe to any shares and no part of it shall form the basis of or be reliedupon in connection with any contract or commitment whatsoever.
By attending the presentation you agree to be bound by the foregoing terms.

STRATEGIC VISION
FINANCIAL TARGETS


P A G E N U M B E R

P A G E N U M B E R

P A G E N U M B E R

P A G E N U M B E R
A Global company with Anglo-Italian roots
A unique ecosystem covering all luxury customer segments globally
The global partner of choice of the world’s leading luxury brands for all online distribution channels

P A G E N U M B E R
2009
Orders processed
Net Revenues2
Employees
Monthly Unique Visitors
Enterprise Value1
Customers
€226m
€137m
287
0.5m
6m
1 every 27s
2015
€2.7b
€1.7b
3,901
2.5m
27m
Orders 1m 7m
1 every 4s
Countries reached 67 >180
1. Fully diluted Enterprise Value, calculated as of 3 December 2009 and 1 July 2016, respectively. Net Financial position for 2015 EV calculated as of 31 March 2016 and adjusted for €100m capital increase.2. Net Revenues refer to last 12 months as of 30 September 2009 for YOOX and last 12 months as of 31 March 2016 for YNAP.For all the definitions (indicated with " * "), please refer to slide 35

P A G E N U M B E R
YNAP Pro-forma Net Revenues and CAGR
2009 2015
+34%
+29%
€1.7bn
YNAP 2015 Market Share4
YNAP3 AND MARKET HISTORICAL PERFORMANCE
Online Personal Luxury Goods Market CAGR
€16.8bn
3. Combined YOOX GROUP and the NET-A-PORTER GROUP Net Revenue CAGR for 2009 - 2015Note: For sources cited on this slide, please refer to slide 36
P A G E N U M B E R
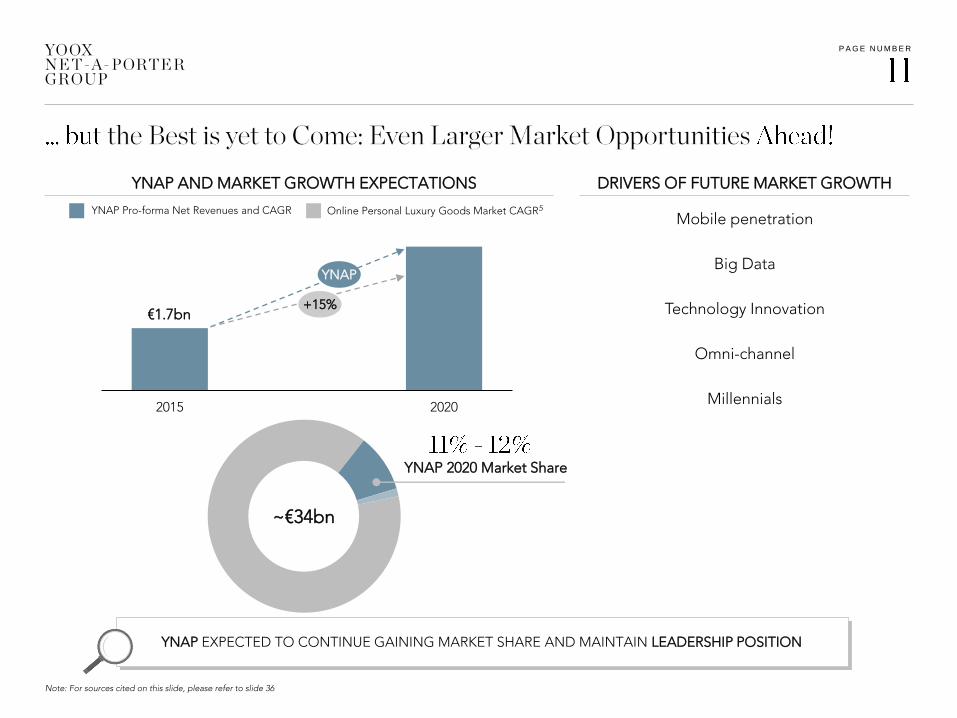
2015 2020
YNAP
YNAP AND MARKET GROWTH EXPECTATIONS
+15%
YNAP EXPECTED TO CONTINUE GAINING MARKET SHARE AND MAINTAIN LEADERSHIP POSITION
Mobile penetration
Big Data
Technology Innovation
Omni-channel
Millennials
YNAP Pro-forma Net Revenues and CAGR Online Personal Luxury Goods Market CAGR5
€1.7bn
DRIVERS OF FUTURE MARKET GROWTH
YNAP 2020 Market Share
~€34bn
Note: For sources cited on this slide, please refer to slide 36

P A G E N U M B E R
Creative Content to delight our customers
Personalised customer journey powered by Smart Data
Hi Federico,it seems to be quite coldoutside, maybe you needa nice scarf!
How aboutthis?
Customer-centric approach, focused on Mobile usage
4 KEY PRINCIPLES
Impeccable Service as part of the experience

P A G E N U M B E R
One firm operating 3 distinct business lines
4 Brands catering to their respective customer bases through their distinctive identities and value propositions
One shared global platform servicing all Brands, empowering innovation while fully unlocking synergies
Common Corporate Functions to share and deploy best practices and encourage cross-fertilisation
MULTI-BRAND IN-SEASON MULTI-BRAND OFF-SEASON ONLINE FLAGSHIP STORES
THE PLATFORM (Technology and R&D, Operations and Private Label Sourcing)
CORPORATE FUNCTIONS
JVCo with Kering
and many more …
“POWERED BY YOOX NET-A-PORTER GROUP”

P A G E N U M B E R
…With a culture built on common values of customer centricity & innovation,
and encouraging differentiation at brand-level
… Instilling a spirit of togetherness by fostering
collaboration, learning and curiosity
... Made of 1 dream team combining the best talent of NET-A-PORTER, YOOX, and the industry
… Which values and promotes diversity by implementing
family-friendly and female-empowering initiatives
… With the goal of being the world’s most
sought-after employer in online fashion

P A G E N U M B E R
0%
40%
80%
NET-A-PORTER YOOX
0
2,000
4,000
NET-A-PORTER YOOX0
2
4
NET-A-PORTER YOOX
DesktopTabletSmartphone
1%8%
20%30%
43%
55% 59%
2010 2011 2012 2013 2014 2015 Q1 2016
Mobile Visits
Smartphone sales growth outpaced other devices
Within Mobile, Native Apps are gaining share
Increased traffic on mobile devices has been
the key driver behind mobile sales growth
More Loyal… …More Engaged… …Spend More!!
Note: Net Revenues and traffic split by device include data from all 3 business lines. Customer data (Retention rate, orders per annum, annual spend) refers to Net-A-Porter and YOOX only.Mobile customer defined as a customer who placed at least 1 order on a mobile device in previous 12 months. This customer could be either a mobile-only customer or a cross-channel customer.
Mobile Customer Desktop-Only Customer
41%31%25%17%7%1% 37%
Retention Rate Orders Per Annum Annual Spend (€)
Mobile sales penetration
YNAP Net Revenues and Traffic Split by Device
YNAP MOBILE CUSTOMERS PROVING THE MOST VALUABLE (2015)

P A G E N U M B E R
95% of luxury consumers are already mobile equipped
Mobile will be at the heart of our strategy, with native apps as the strongest tool for conversion, engagement and retention
Conversion Driver
Physical and Digital Store Bridge
Personalization Enabler
Media Gateway
Constant Engagement Tool
Service Delivery Channel

P A G E N U M B E R
Converge multiple customer data sources, both internal (across all of our online stores) and external
Refine this data and develop a holistic view of our customer; that is smart and actionable
Use this smart view to inform Marketing and Retailing strategies to unlock value from:
TWO OF OUR BIGGEST ASSETS
UNMATCHED BASE OF 2.5 MILLIONHIGH-VALUE CUSTOMERS GLOBALLY
Personalisationacross all customer touchpoints
Extending insights into our luxury ecosystem to our Brand Partners
THE WORLD’S BIGGEST LUXURY FASHION CLOSET
“Omni-stock” Program: Develop intelligent stock allocation and
fulfilment decisions across our global logistics network to maximise return on inventory

P A G E N U M B E R
Rest of Europe 48.8%
MULTI-BRAND IN-SEASON MULTI-BRAND OFF-SEASON ONLINE FLAGSHIP STORES
Strong growth in High Net Worth customer base
International expansion
Product to cement positioning and launch of fine jewellery & watches
Content to drive acquisitionand engagement
Unparalleled one-to-one serviceto increase retention
Strong increase in customer base focused on higher-value customers
Marketing investments to drive YOOX brand awareness
THE OUTNET international expansion
Growth in product offering, preserving the best quality
Private labels to complement current offer
Strong organic growth frommore focused portfolio of higher-potential existing partnerships
New select business developments with promising online potential
Business model evolution for brands to seize the omni-channel opportunity
New suite of luxury value-added services to complement our offer
….all empowered by mobile
“POWERED BY YOOX NET-A-PORTER GROUP”
JVCo with Kering
and many more …

P A G E N U M B E R
United States– the world’s biggest online luxury market –
to remain our no. 1 country
Expand our presence in Japan and China to harness their full potential
Break into the Middle Eastwith a full in-country presence that
completes our coverage of all relevant luxury markets
Strong focus on internationalisation while maintaining our leadership position in the US
Increase focus on most promising European opportunities (incl. Russia)
Extend outreach in large e-commerce markets where YNAP is underpenetrated
(Germany, France)

P A G E N U M B E R
THE PLATFORM
Convergingwhile enhancing
The world’s biggest fashion closet
seamlessly accessiblefrom anywhere
SHARED SCALABLE
Investing now,leveraging much
beyond 2020
~340,000 SQMby 2019 able to
accommodate sales growth of over €5bn
Setting the standardfor service in luxury
fashion
Premier same-daydelivery in NY, London,
Milan, Dubai,Shanghai, Tokyo
TAILOREDFOR LUXURY
INNOVATIVE
Empoweringinnovation leveraging
smart data
Knowing our prospective ~6M
customersone-by-one
[…]

P A G E N U M B E R
Uniquely positioned at the high-end of the fast-growing online fashion market
Talented, experienced and forward-looking management team
The independent global partner of choice of the world’s leading luxury brands
A proven and highly resilient business model:The world’s most geographically diversified fashion e-tailer
Broad and well-balanced offer across customer profiles and price points through 3 business lines
One Scalable Global Platform tailored to luxury fashion
Successful track record of strong profitable growth and industry-leading innovation


P A G E N U M B E R
1. FY2015 Average Exchange Rates.
Q2 2016 Order Value growth in the high teens until
mid-June
Growth accelerated compared to Q1 across all
three business lines
Multi-brand Off-Season outpaced the Group’s
average
From Mid-June onwards, Order Value growth
slowed down, but still in the double digits
UK flat year-on-year

P A G E N U M B E R
2. Average 2015 exchange ratesFor all the definitions (indicated with " * "), please refer to slide 35
Sensitivity to average GBP/EUR in H2 2016
FY2016 Group Net Revenue Growth2
Adjusted EBITDA*
0.80 0.85
-1.5% -2.5%
~nil ~nil
Comments
Well-balanced GBP-denominated revenues and costs
SevereUK Flat y-o-y
Europe Mid Teens
(2 - 3%)
Sensitivity to UK & Europe Slowdown Scenario in H2 2016
Adjusted EBITDA margin
+10bps +20bps
ModerateUK Single Digit
Europe High Teens
(1 - 1.5%)
Impact on
FY2016 Group Net Revenue Growth2
Adjusted EBITDA margin
-20bps -40bps
Impact on
CURRENCY IMPACT
SLOWDOWN IN DEMAND

P A G E N U M B E R
5-Year Plan already accounts for a declining share of the UK contribution to Group Net
Revenues, moving from 15.8% in FY2015 to ~12.0% in FY2020, to reflect already relatively
high penetration of online luxury goods and stage of e-commerce maturity
Conservative view on UK growth already factored into plan
assumptions
Whilst Brexit will not automatically lead to an introduction of customs between the UK and
the EU, the potential risk has been taken into account starting from mid 2018
By then, the new Omni-stock logistics set-up will be in place and will significantly mitigate
any potential additional customs burden. Its impact would be limited to ~10% of Group
COGS by 2020 under the theoretical assumption that no price adjustment is made to
mitigate the effect
No meaningful impact from potential
introduction of custom duties
Impact expected to be neutral on Group’s profitability due to balanced GBP-denominated
revenues and costs
Depreciation of GBP/EUR FX

P A G E N U M B E R
Category 1 Category 2
Forecasts provided at FY2015 average exchange rates
Annual Net Revenue (NR) growth progression to reflect revenue synergy ramp-up
YNAP Pro-forma Net Revenues and CAGR Online Personal Luxury Goods Market CAGR3
€1.7bn
YNAP 2020 Market Share
YNAP AND MARKET GROWTH EXPECTATIONS
17 - 20%
€3.7 - 4.1bn
15%
20202015
YNAP 2015 Market Share
Note: For sources cited on this slide, please refer to slide 36

P A G E N U M B E R
FREE CASH FLOW GENERATION
Note: 2015 pro-forma financials, 2020 forecasts.
PROFITABILITY ENHANCEMENT
2015A 2020E
8.0%
11 - 13%
Adjusted EBITDA* Margin as % of NR
20202015
2015A 2020E
5.0% 4 - 5%
Capital Expenditure as % of NR
20202015
Position within the range dependent upon sales growth
Margin enhancement to reflect P&L synergyramp-up
Comments
2014 2015 2020
Ordinary Net Working Capital* as % of NR
5.8% 5 - 6%6.6%
Dec 2014 Dec 2015 Dec 2020
Capex as % of NR to peak in 2016 and 2017 and expected to decrease to 4-5% of Net Revenues by 2020
Optimised inventory management driven by Omni-stock programme
Forecasts provided at FY2015 average exchange rates

P A G E N U M B E R
53.7%35.8%
10.5%
2015 2020
Multi-brand In-Season Multi-brand Off-Season Online Flagship Stores
Mix to remain broadly stable
Multi-brand In-Season still the largest contributor
Multi-brand Off-Season likely to outpace the Group’s
average growth in periods of uncertainty
Share of the Online Flagship Stores to slightly diminish as
a result of partial adoption of new partnership model,
entailing YNAP to book its fee as opposed to the entire
transaction value
6.7%
15.8%
26.4%30.2
%
14.6%
6.3%
Italy UK Rest of Europe
APACNorth America Rest of the World and NCR*
20202015
North America to remain no. 1 country
Rest of Europe to maintain its share
APAC and Rest of the World gaining share over the UK
– Over-indexed growth in Mainland China, Singapore,
South Korea and Taiwan
– Rest of the World growth fuelled by the Middle East
BY BUSINESS LINE
BY GEOGRAPHY
15.8%
26.4%30.2%
14.6%
6.3% 6.7%
P A G E N U M B E R
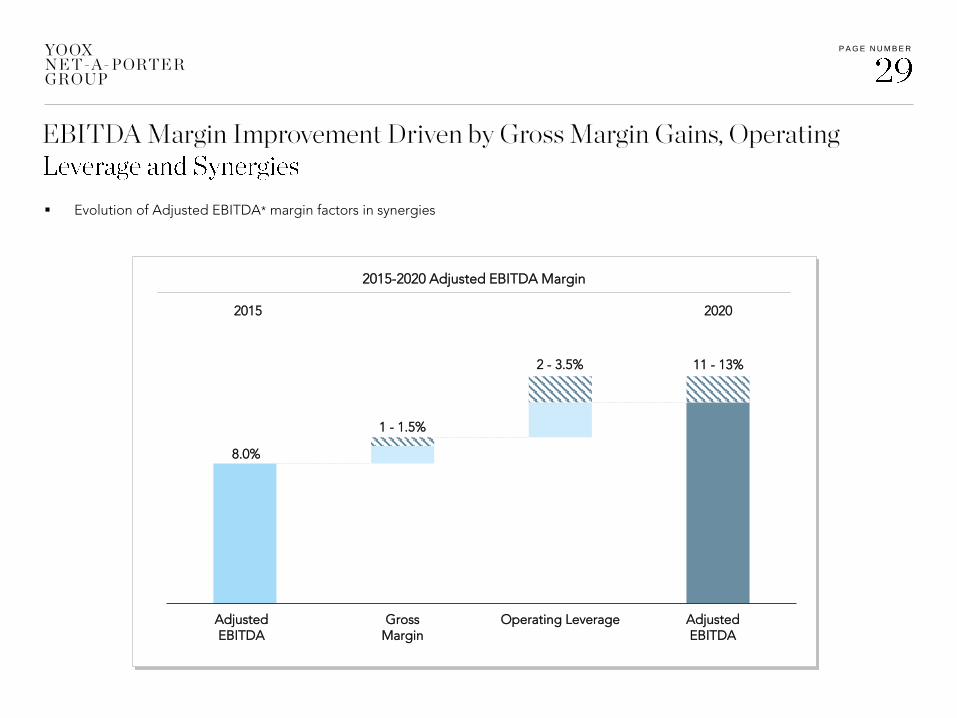
AdjustedEBITDA
GrossMargin
Operating Leverage AdjustedEBITDA
1 - 1.5%
8.0%
2015-2020 Adjusted EBITDA Margin
11 - 13%2 - 3.5%
Evolution of Adjusted EBITDA* margin factors in synergies
2015 2020

P A G E N U M B E R
2015 - 2020 GROSS MARGIN*
2014A 2015A 2020E
39.2%39.5%
40.5 - 41.0%
Omni-stock programme enabling lower average markdown and higher sell-through for Multi-brand In-Season and The Outnet
Improved buying terms across Multi-brand In-Season and Off-Season upon volume increase
Growing share of higher-margin private label
Further pricing sophistication yielding increased margins
INITIATIVES DRIVING GROSS MARGIN
2014 2015 2020

P A G E N U M B E R
Lower handling costs as a result of greater stock allocation in Italy as opposed to New York and London
Increased efficiency of customer care
2014A 2015A 2020E
2014A 2015A 2020E
2014A 2015A 2020E
Efficiency in personnel costs and vendor terms reinvested into marketing spend
Operating leverage on fixed costs
9.2%10.0%
11.9% 12.2%
9.8% 9.3%
2014 2015 2020
FULFILMENTAS % OF NR
Comments
2014 2015 2020
2014 2015 2020
SALES & MARKETING AS
% OF NR
G&A + OTHER INCOME &
EXPENSES AS % OF NR

P A G E N U M B E R
0%
2%
4%
6%
8%
10%
0
20
40
60
80
100
120
140
160
180
200
2015 2016 2017 2018 2019 2020
Capex /
NR Ratio (%)
€84m
~€150m
€m
Free Cash Flow
MAIN INITIATIVES
Technology integration investments and significant upgrades
Expansion of global logistics network to accommodate volume growth and implement Omni-stock programme
0%
2%
4%
6%
8%
10%
0
50
100
150
200
250
2015 2016 2017 2018 2019 2020
NWC /
NR Ratio (%)
€96m
€m
Ordinary Net Working Capital* and % of NR Capital Expenditure and % of NR
-100
-50
0
50
100
150
200
250
2015 2016 2017 2018 2019 2020
€5m
5-6%
NET WORKING CAPITAL* CAPEX
Improvement mainly driven by inventory: better sell-through thanks to Omni-stock programme, increased share of private label, extended off-season buying opportunities throughout the year and shorter lead times due to in-bound process improvement
€m
4-5%
5.8%5.0%

P A G E N U M B E R
ANNUAL RUN-RATE SYNERGIES (2018)
EBITDA + CAPEX SAVINGS: €85M
CUMULATED ONE-OFF COSTS (2015-2018)
OPEX + CAPEX: €95M
Expected synergies mainly arising from P&L benefits
One-off capital expenditure mainly concentrated in FY2016 - FY2017
HIGHLIGHTS
OPEX Capital ExpenditureCapital Expenditure SavingsEBITDA

T H I S D O C U M E N T I S P R O P R I E T A R Y A N D C O N F I D E N T I A L . N O P A R T O F T H I S D O C U M E N T M A Y B E D I S C L O S E D I N
A N Y M A N N E R T O A T H I R D P A R T Y W I T H O U T T H E P R I O R W R I T T E N C O N S E N T O F YO O X N E T - A - P O R T E R G R O U P
Investor [email protected]

P A G E N U M B E R
Adjusted EBITDA: reported EBITDA before the non-cash costs associated with Stock Option Plans and Share-based Incentive Plans
EBITDA Pre Corporate Costs is defined as earnings before general and administrative expenses, other income and expenses, depreciation and amortisation, non-recurring expenses, income/loss from investment in associates, financial income and expenses and income taxes. Since EBITDA Pre Corporate Costs is not recognised as an accounting measure under Italian GAAP or the IFRS endorsed by the European Union, its calculation might not be standard, and the measurement criterion adopted by the Group might not be consistent with that used by other groups. Accordingly, the resulting figures may not be comparable. EBITDA Pre Corporate Costs corresponds to the operating profit by business line reported in the Group's consolidated financial statements.
Gross profit is earnings before fulfilment costs, sales and marketing costs, general and administrative expenses, other operating income and expenses, depreciation and amortisation, non-recurring expenses, income/loss from investment in associates, financial income and expenses and income taxes. Since grossprofit is not recognised as an accounting measure under Italian GAAP or the IFRS endorsed by the European Union, its calculation might not be standard, and the measurement criterion adopted by the Group might not be consistent with that adopted by other groups. Accordingly, the resulting figures may not be comparable.
NCR: Not Country Related
Net working capital is current assets, net of current liabilities, with the exception of cash and cash equivalents, bank loans and borrowings and other financial payables falling due within one year and financial assets and liabilities included under other current assets and liabilities. Net working capital is not recognised as an accounting measure under Italian GAAP or the IFRS endorsed by the European Union. The measurement criterion adopted by the Company might not be consistent with that adopted by other groups. Accordingly, the balance obtained by the Company may not be comparable with the figures obtained by other groups.
Gross Merchandise Value (“GMV”) is defined as retail value of sales to final customers of all the Online Flagship Stores (including the JV), net of returns and customer discounts. Set-up, design and maintenance fees for the Online Flagship Stores, accounted for within “Rest of the World and Not Country Related”, are excluded
EIPs are defined as customers with a yearly net spend of over £7,500, converted into Euros at the FY2015 average EUR/GBP exchange rate of 0.726

P A G E N U M B E R
4. Bain & Company Altagamma, October 2015. “2015 Worldwide Markets Monitor”, for size of 2015 online personal luxury goods market (€16.8bn)5. Bain & Company, “Worldwide Luxury Market Monitor 2016 Spring Update” for estimate of 2015-2020 CAGR of online personal luxury goods.
STRATEGIC VISION
3. Bain & Company, May 2016. “Worldwide Luxury Market Monitor 2016 Spring Update” for estimate of 2015-2020 CAGR of online personal luxury goods; Bain & Company Altagamma, October 2015. “2015 Worldwide Markets Monitor”, for size of 2015 online personal luxury goods market (€16.8bn)
FINANCIAL TARGETS