consolidated financial statements - saint …...compagnie de saint-gobain statutory auditors’...
TRANSCRIPT
CONSOLIDATED FINANCIAL
STATEMENTS
December 31, 2018
CONSOLIDATION REPORTING GROUP DEPARTMENT

Compagnie de Saint-Gobain
STATUTORY AUDITORS’ REPORT
ON THE CONSOLIDATED FINANCIAL STATEMENTS
For the year ended December 31, 2018
The Statutory Auditors
PricewaterhouseCoopers Audit
Crystal Park
63, rue de Villiers
92208 Neuilly-sur-Seine Cedex
France
KPMG Audit
Tour Eqho
2, avenue Gambetta
CS 60055
92066 Paris La Défense Cedex
France

PricewaterhouseCoopers Audit
Crystal Park
63, rue de Villiers
92208 Neuilly-sur-Seine Cedex
France
KPMG Audit
Tour Eqho
2, avenue Gambetta
CS 60055
92066 Paris La Défense Cedex
France
STATUTORY AUDITORS’ REPORT ON THE CONSOLIDATED FINANCIAL STATEMENTS
For the year ended December 31, 2018
This is a free translation into English of the Statutory Auditors’ report issued in French and is provided solely for the
convenience of English speaking readers. This report includes information specifically required by European regulations
or French law, such as information about the appointment of Statutory Auditors. This report should be read in
conjunction with, and construed in accordance with, French law and professional auditing standards applicable in
France.
Compagnie de Saint-Gobain SA
Les Miroirs
18, avenue d’Alsace
92400 Courbevoie
France
To the Shareholders,
1. Opinion
In compliance with the engagement entrusted to us by your Shareholders’ Meeting, we have audited the accompanying
consolidated financial statements of Compagnie de Saint-Gobain for the year ended December 31, 2018.
In our opinion, the consolidated financial statements give a true and fair view of the assets and liabilities and of the
financial position of the Group at December 31, 2018 and of the results of its operations for the year then ended in
accordance with International Financial Reporting Standards as adopted by the European Union.
The audit opinion expressed above is consistent with our report to the Audit and Risk Committee.
2. Basis for opinion
Audit framework
We conducted our audit in accordance with professional standards applicable in France. We believe that the audit
evidence we have obtained is sufficient and appropriate to provide a basis for our opinion.
Our responsibilities under these standards are further described in the “Responsibilities of the Statutory Auditors relating
to the audit of the consolidated financial statements” section of our report.
Independence
We conducted our audit engagement in compliance with the independence rules applicable to us for the period from
January 1, 2018 to the date of our report and, in particular, we did not provide any non-audit services prohibited by
article 5(1) of Regulation (EU) No 537/2014 or the French Code of Ethics (Code de déontologie) for Statutory Auditors.

Compagnie de Saint-Gobain
STATUTORY AUDITORS’ REPORT ON THE CONSOLIDATED FINANCIAL STATEMENTS
For the year ended December 31, 2018
Page 2
3. Emphasis of matter
Without qualifying our opinion, we draw your attention to Note 3 “Impact of new standards” to the consolidated financial
statements, which describes the consequences of the adoption on January 1, 2018 of IFRS 15 – “Revenue from Contracts
with Customers” and IFRS 9 – “Financial Instruments”.
4. Justification of assessments – Key audit matters
In accordance with the requirements of articles L.823-9 and R.823-7 of the French Commercial Code (Code de
commerce) relating to the justification of our assessments, we inform you of the key audit matters relating to the risks of
material misstatement that, in our professional judgment, were the most significant in our audit of the consolidated
financial statements, as well as how we addressed those risks.
These matters were addressed as part of our audit of the consolidated financial statements as a whole, and therefore
contributed to the opinion we formed as expressed above. We do not provide a separate opinion on specific items of the
consolidated financial statements.
Measurement of goodwill, intangible assets and property, plant & equipment
Description of risk
The carrying amounts of goodwill, intangible assets and property, plant & equipment were significant at
December 31, 2018, amounting to €9,988 million, €2,526 million and €11,335 million, respectively. These assets may be
impaired due to internal or external factors, including decisions to change the Group’s strategy in certain markets, a
decline in Group performance, changes in competition, unfavorable market conditions and changes in legislation or
regulations. These changes are likely to have an impact on the Group’s forecast cash flow and, consequently, the assets’
recoverable amount.
The impairment tests and analyses of fair value less costs to sell performed by Management using the method described
in Note 6.5 to the consolidated financial statements led to the recognition of impairment losses of €2,003 million in the
fiscal year ended December 31, 2018, as indicated in Note 4 to the consolidated financial statements.
Determining the assets’ recoverable amount is a key audit matter given the potentially significant nature of any
impairment, the importance of estimates and the level of judgment required by Management in assessing impairment
losses. Management exercises judgment when making assumptions regarding future changes in sales (in both volume and
value terms), profitability, investments and the other cash flows required to operate the assets, and when determining an
appropriate discount rate to apply to future cash flows.
How our audit addressed this risk
We familiarized ourselves with the procedures implemented by Group Management for impairment testing and analysis
purposes, verified the consistency of the method used for impairment testing, and tested the effectiveness of the controls
performed by Management to ensure the quality and reliability of the impairment testing process and its consistency with
budget data and the strategic plan prepared by General Management and presented to the Board of Directors in
September 2018. We assessed the consistency and relevance of the modifications made to certain forecast data in the
September 2018 strategic plan in light of subsequent events, such as the announcement of the Transform & Grow plan
and developments in Brexit negotiations.
We also assessed the consistency and relevance of Management’s approach to determine the cash generating units for
asset impairment testing. We adapted our audit approach to the risk of impairment, which varies depending on the cash
generating unit.
Compagnie de Saint-Gobain
STATUTORY AUDITORS’ REPORT ON THE CONSOLIDATED FINANCIAL STATEMENTS
For the year ended December 31, 2018
Page 3
Our valuation specialists performed an independent analysis of certain key assumptions used by Management for
impairment testing and analysis purposes, in particular the discount rate and average annual growth rate to infinity of
future cash flows, by referring to both external market data and comparable company analyses.
For a selection of cash generating units, we analyzed the consistency of future cash flow projections with regard to past
performance, our knowledge of the business, confirmed by interviews with the Heads of the relevant Sectors and
Activities and, where available, external market or competition data. We carefully reviewed the calculation of the
normalized amount of the terminal cash flows projected until perpetuity. We performed our own sensitivity analyses of
certain key variables of the measurement model to assess the materiality of their potential impact on the recoverable
amount of the most high-risk assets.
We verified that the disclosures provided in the notes to the consolidated financial statements on the measurement of
goodwill, intangible assets and property, plant & equipment, the underlying assumptions and sensitivity analyses was
appropriate.
Measurement of provisions for liabilities and litigation related to asbestos
Description of risk
The Group is exposed to various legal risks, including asbestos-related litigation in the United States and Brazil.
As indicated in Note 8 to the consolidated financial statements, provisions amounting to €1,328 million were recognized
at December 31, 2018 for contingent liabilities and litigation. Significant contingent liabilities, whose amount or timing
cannot be estimated with sufficient reliability, are disclosed in the notes to the consolidated financial statements.
With regard to asbestos-related risks in the United States and Brazil, determining and measuring the provisions
recognized for contingent liabilities and litigation and assessing the appropriateness of the related disclosures in the notes
to the consolidated financial statements are a key audit matter given the amounts involved, the importance of estimates
and the level of judgment required by Management in determining those provisions. Judgment was required, in
particular, in estimating the number and cost of future disputes.
How our audit addressed this risk
To obtain an understanding of contingent liabilities and litigation regarding asbestos in the United States and Brazil and
the related matters of judgment, we held discussions with Management at Group, Sector and Delegation level as well as
at the main subsidiaries.
In addition, we:
- reviewed the minutes of the Board of Directors’ meetings and the Group’s risk mapping prepared by Management
and presented to the Audit and Risk Committee;
- familiarized ourselves with the procedures implemented by Management when measuring the provisions for
asbestos-related risks in the United States and Brazil and determining the disclosures thereon in the notes to the
consolidated financial statements;
- carried out a critical review of internal analyses relating to the probability and possible impact of these liabilities and
items of litigation, examining the available information relating to the proceedings (correspondence, claims,
judgments, notifications, etc.). We also reviewed the legal or technical opinions of the law firms or external
specialists chosen by Management, as well as their responses to confirmation letters. We used our professional
judgment to assess the positions adopted by Management, to see where they fell within risk assessment ranges and
the consistency of those positions over time;
- measured the asbestos-related provisions, based on a statistical model, verified that the consistency principle was
complied with and checked the relevance and reliability of the source data and calculation formulas used. Where
applicable, we compared the amounts paid with previously recognized provisions in order to form an opinion on the
quality of Management’s estimates.

Compagnie de Saint-Gobain
STATUTORY AUDITORS’ REPORT ON THE CONSOLIDATED FINANCIAL STATEMENTS
For the year ended December 31, 2018
Page 4
We assessed the appropriateness of the disclosures provided in the notes to the consolidated financial statements
regarding these items of litigation and contingent liabilities identified.
Agreement relating to the purchase of Sika shares
Description of risk
As indicated in Notes 2.2 and 2.5 to the consolidated financial statements, the Saint-Gobain Group announced on
May 11, 2018 that it had entered into an overall agreement with Sika and the Burkard family under which, following
several successive transactions over the year 2018, Saint-Gobain, through SWH, became Sika’s largest shareholder,
holding 10.75% of the share capital and voting rights, and agreed to certain lock-up periods on shares and standstill
obligations over specific time frames. This overall agreement terminated and resolved the disputes between Sika, the
Burkard family and Saint-Gobain.
For Saint-Gobain, the agreement resulted in total income of €781 million, including a financial gain of €601 million
(i.e., the difference between the fair value of the shares at the date of the transaction and the value of the call entered into
in December 2014), and a compensatory indemnity of €180 million recorded in other business income. The Group has
elected to recognize subsequent changes in the fair value of the Sika shares held by SWH within income and expenses
recognized directly in equity.
The allocation of the overall amount from this agreement to the various lines in the income statement, the presentation of
the shares in the balance sheet and the accounting treatment of the transaction in Swiss francs are a key audit matter
given the amounts at stake, the complex nature of the components making up the overall agreement, the multiple
accounting impacts and the degree of judgment required by Management in the choice and use of the applicable
accounting standards.
How our audit addressed this risk
In order to obtain a thorough understanding of the various components making up the overall agreement, including its
terms and conditions, and to assess the accounting treatment of the agreement, we:
- analyzed the various contracts entered into by the Group: firstly those between the Group and Sika and the Burkard
family, and secondly those entered into as part of the financing and currency hedges associated with the agreement;
- familiarized ourselves with the minutes of the related Board of Directors’ meetings;
- performed a critical assessment of the methods used to determine the fair value of the Sika shares at the time of the
transaction; and
- conducted interviews with the main Group departments involved.
We familiarized ourselves with the procedures implemented by the Group to ensure that the agreement and related
transactions were properly accounted for in the consolidated financial statements and to determine the disclosures to be
provided in the notes to the consolidated financial statements.
With regard to how the overall amount of the agreement was determined and presented in the consolidated income
statement and the consolidated statement of cash flows, we:
- assessed compliance with IFRS;
- corroborated the amounts with the items in the underlying contracts; and
- verified the accuracy of the calculations.
We ensured that the presentation and subsequent accounting and valuation rules applied to the shares held by the Group
following the transaction complied with IFRS.
We assessed the appropriateness of the disclosures provided in the notes to the consolidated financial statements
regarding the agreement and its accounting impact.

Compagnie de Saint-Gobain
STATUTORY AUDITORS’ REPORT ON THE CONSOLIDATED FINANCIAL STATEMENTS
For the year ended December 31, 2018
Page 5
Measurement of supplier discounts in the Building Distribution Sector
Description of risk
The Building Distribution Sector accounted for 46% of the Group’s sales for fiscal year 2018. The profitability of the
Sector’s business activities varies depending on supplier discounts received, which lower the cost price of negotiated
goods. As indicated in Notes 4.1.2, 4.5.1 and 4.5.2 to the consolidated financial statements, the recognition of supplier
discounts specifically affects “Cost of sales” in the consolidated income statement as well as “Inventories” and “Other
receivables” in the consolidated balance sheet.
Given the diversity of products and suppliers in the Building Distribution Sector, supplier contracts are numerous,
complex and varied. They give rise to several supplier discounts, some of which are subject to volume conditions or
targets, granted at various Sector levels (local, regional, national and international). Measuring accrued supplier discounts
is a key audit matter as the monitoring thereof is complex and requires estimates to be made by Management.
Determining the amounts of supplier discounts to be taken into account when measuring inventories for brands in the
Building Distribution Sector is also a significant audit matter.
How our audit addressed this risk
We gained an understanding of the process used by the Sales and Finance Departments of the Building Distribution
Sector to estimate accrued supplier discounts at the reporting date and performed tests on the effectiveness of the controls
performed by Management.
We also assessed, on a multi-year basis, the consistency of the supplier discount rates obtained per brand and country,
confirmed by interviews with the Sales and Finance Departments at various levels within the Sector. Using a sample, we
remeasured the supplier discounts obtained based on the terms and conditions of the relevant agreements and volumes
purchased. We also retrospectively cross-checked cash and credit notes received after the reporting date against the
receivables recognized and asked a sample of suppliers to directly confirm the discount amounts due for the fiscal year.
With regard to the accuracy of the supplier discounts taken into account when measuring inventories for brands in the
Building Distribution Sector, we verified that the accounting methods were applied consistently across all the brands.
Using sampling techniques, we cross-checked the measurement of certain inventory items against supplier invoices,
estimating supplier discounts granted subsequently.
We verified that the disclosures provided in the notes to the consolidated financial statements regarding supplier
discounts was appropriate.
5. Specific verifications
As required by legal and regulatory provisions and in accordance with professional standards applicable in France, we
have also verified the information pertaining to the Group presented in the Board of Directors’ management report.
We have no matters to report as to its fair presentation and its consistency with the consolidated financial statements.

Compagnie de Saint-Gobain
STATUTORY AUDITORS’ REPORT ON THE CONSOLIDATED FINANCIAL STATEMENTS
For the year ended December 31, 2018
Page 6
We attest that the information pertaining to the Group provided in the management report comprises the consolidated
non-financial information statement required under article L.225-102-1 of the French Commercial Code. However, in
accordance with article L.823-10 of the French Commercial Code, we have not verified the fair presentation and
consistency with the consolidated financial statements of the information given in that statement, which will be the
subject of a report by an independent third party.
6. Report on other legal and regulatory requirements
Appointment of the Statutory Auditors
We were appointed Statutory Auditor of Compagnie de Saint-Gobain by the Shareholders’ Meetings held on
June 26, 1986 for Petiteau Scacchi (subsequently PricewaterhouseCoopers Audit) and on June 10, 2004 for
KPMG Audit.
As of December 31, 2018, PricewaterhouseCoopers Audit and KPMG Audit were in the thirty-third year and the fifteenth
consecutive year of their engagement, respectively.
7. Responsibilities of Management and those charged with governance for the consolidated financial
statements
Management is responsible for preparing consolidated financial statements giving a true and fair view in accordance with
International Financial Reporting Standards as adopted by the European Union and for implementing the internal control
procedures it deems necessary for the preparation of consolidated financial statements that are free of material
misstatement, whether due to fraud or error.
In preparing the consolidated financial statements, Management is responsible for assessing the Company’s ability to
continue as a going concern, disclosing, as applicable, matters related to going concern, and using the going concern
basis of accounting, unless it expects to liquidate the Company or to cease operations.
The Audit and Risk Committee is responsible for monitoring the financial reporting process and the effectiveness of
internal control and risk management systems, as well as, where applicable, any internal audit systems, relating to
accounting and financial reporting procedures.
The consolidated financial statements were approved by the Board of Directors.
8. Responsibilities of the Statutory Auditors relating to the audit of the consolidated financial
statements
Objective and audit approach
Our role is to issue a report on the consolidated financial statements. Our objective is to obtain reasonable assurance
about whether the consolidated financial statements as a whole are free of material misstatement. Reasonable assurance is
a high level of assurance, but is not a guarantee that an audit conducted in accordance with professional standards will
always detect a material misstatement when it exists. Misstatements can arise from fraud or error and are considered
material if, individually or in the aggregate, they could reasonably be expected to influence the economic decisions taken
by users on the basis of these consolidated financial statements.
As specified in article L.823-10-1 of the French Commercial Code, our audit does not include assurance on the viability
or quality of the Company’s management.
As part of an audit conducted in accordance with professional standards applicable in France, the Statutory Auditors
exercise professional judgment throughout the audit. They also:

Compagnie de Saint-Gobain
STATUTORY AUDITORS’ REPORT ON THE CONSOLIDATED FINANCIAL STATEMENTS
For the year ended December 31, 2018
Page 7
identify and assess the risks of material misstatement in the consolidated financial statements, whether due to
fraud or error, design and perform audit procedures in response to those risks, and obtain audit evidence
considered to be sufficient and appropriate to provide a basis for their opinion. The risk of not detecting a material
misstatement resulting from fraud is higher than for one resulting from error, as fraud may involve collusion,
forgery, intentional omissions, misrepresentations, or the override of internal control;
obtain an understanding of the internal control procedures relevant to the audit in order to design audit procedures
that are appropriate in the circumstances, but not for the purpose of expressing an opinion on the effectiveness of
the internal control;
evaluate the appropriateness of accounting policies used and the reasonableness of accounting estimates and
related disclosures made by Management in the consolidated financial statements;
assess the appropriateness of Management’s use of the going concern basis of accounting and, based on the audit
evidence obtained, whether a material uncertainty exists related to events or conditions that may cast significant
doubt on the Company’s ability to continue as a going concern. This assessment is based on the audit evidence
obtained up to the date of the audit report. However, future events or conditions may cause the Company to cease
to continue as a going concern. If the Statutory Auditors conclude that a material uncertainty exists, they are
required to draw attention in the audit report to the related disclosures in the consolidated financial statements or,
if such disclosures are not provided or are inadequate, to issue a qualified opinion or a disclaimer of opinion;
evaluate the overall presentation of the consolidated financial statements and assess whether these statements
represent the underlying transactions and events in a manner that achieves fair presentation;
obtain sufficient appropriate audit evidence regarding the financial information of the entities or business
activities within the Group to express an opinion on the consolidated financial statements. The Statutory Auditors
are responsible for the management, supervision and performance of the audit of the consolidated financial
statements and for the opinion expressed thereon.
Report to the Audit and Risk Committee
We submit a report to the Audit and Risk Committee which includes, in particular, a description of the scope of the audit
and the audit program implemented, as well as the results of our audit. We also report any significant deficiencies in
internal control that we have identified regarding the accounting and financial reporting procedures.
Our report to the Audit and Risk Committee includes the risks of material misstatement that, in our professional
judgment, were the most significant for the audit of the consolidated financial statements and which constitute the key
audit matters that we are required to describe in this report.
We also provide the Audit and Risk Committee with the declaration provided for in article 6 of
Regulation (EU) No 537/2014, confirming our independence within the meaning of the rules applicable in France, as
defined in particular in articles L.822-10 to L.822-14 of the French Commercial Code and in the French Code of Ethics
for Statutory Auditors. Where appropriate, we discuss any risks to our independence and the related safeguard measures
with the Audit and Risk Committee.

Compagnie de Saint-Gobain
STATUTORY AUDITORS’ REPORT ON THE CONSOLIDATED FINANCIAL STATEMENTS
For the year ended December 31, 2018
Page 8
Neuilly-sur-Seine and Paris La Défense, February 21, 2019
The Statutory Auditors
PricewaterhouseCoopers Audit
Edouard Sattler Cécile Saint-Martin
KPMG Audit
Department of KPMG SA
Jean-Paul Thill Bertrand Pruvost

CONSOLIDATION REPORTING GROUP DEPARTMENT
CONTENTS
CONSOLIDATED FINANCIAL STATEMENTS ........................................................................................ 2
CONSOLIDATED BALANCE SHEET ..................................................................................................................... 2
CONSOLIDATED INCOME STATEMENT ............................................................................................................. 3
CONSOLIDATED STATEMENT OF RECOGNIZED INCOME AND EXPENSE ......................................................... 4
CONSOLIDATED STATEMENT OF CASH FLOWS ................................................................................................ 5
CONSOLIDATED STATEMENT OF CHANGES IN EQUITY .................................................................................. 6
NOTES TO THE CONSOLIDATED FINANCIAL STATEMENTS ......................................................... 7
NOTE 1 Accounting principles and policies .................................................................................................. 7
1.1. Standards applied ........................................................................................................................ 7
1.2. Estimates and assumptions ......................................................................................................... 9
NOTE 2 Scope of consolidation ....................................................................................................................... 9
2.1. Accounting principles related to consolidation ......................................................................... 9
2.2. Changes in Group structure ...................................................................................................... 11
2.3. Assets and liabilities held for sale ............................................................................................. 13
2.4. Changes in the number of consolidated companies ................................................................ 14
2.5. Off-balance sheet commitments related to companies within the scope of
consolidation ............................................................................................................................... 14
NOTE 3 Impact of new standards................................................................................................................. 14
3.1. Accounting policies applied as from January 1, 2018 ............................................................. 14
3.2. Impact on the consolidated balance sheet ................................................................................ 15
NOTE 4 Information concerning the Group’s operating activities ........................................................... 16
4.1. Income statement items ............................................................................................................. 16
4.2. Segment information ................................................................................................................. 18
4.3. Information by geographic area ............................................................................................... 20
4.4. Performance indicators ............................................................................................................. 20
4.5. Working capital .......................................................................................................................... 22
4.6. Off-balance sheet commitments related to operating activities ............................................. 24
NOTE 5 Employees, personnel expenses and employee benefit obligations ............................................. 25
5.1. Employees of fully consolidated companies ............................................................................. 25
5.2. Management compensation ....................................................................................................... 26
5.3. Provisions for pensions and other employee benefits ............................................................. 26
5.4. Share-based payments ............................................................................................................... 30
NOTE 6 Property, plant and equipment and intangible assets .................................................................. 34
6.1. Goodwill ...................................................................................................................................... 34
6.2. Other intangible assets............................................................................................................... 35
6.3. Property, plant and equipment ................................................................................................. 36
6.4. Finance leases and operating leases .......................................................................................... 38
6.5. Impairment review ..................................................................................................................... 39
NOTE 7 Investments in equity-accounted companies and other non-current assets ............................... 41
7.1. Changes in investments in equity-accounted companies ........................................................ 41
7.2. Transactions with equity-accounted companies – related parties ......................................... 42
7.3. Other non-current assets ........................................................................................................... 42
NOTE 8 Other current and non-current liabilities and provisions, contingent liabilities and
litigation ...................................................................................................................................... 44
8.1. Provisions for other liabilities and charges .............................................................................. 44

Consolidated financial statements of the Saint-Gobain Group
1
8.2. Contingent liabilities and litigation .......................................................................................... 45
NOTE 9 Financing and financial instruments ............................................................................................. 49
9.1. Risk factors: financial risks ....................................................................................................... 49
9.2. Net financial expense ................................................................................................................. 52
9.3. Net debt ....................................................................................................................................... 52
9.4. Financial instruments ................................................................................................................ 56
9.5. Financial assets and liabilities ................................................................................................... 59
NOTE 10 Shareholders’ equity and earnings per share ............................................................................. 60
10.1. Equity .......................................................................................................................................... 60
10.2. Earnings per share ..................................................................................................................... 60
NOTE 11 tax ................................................................................................................................................... 61
11.1. Income taxes ............................................................................................................................... 61
11.2. Deferred tax ................................................................................................................................ 62
11.3. Tax loss carry-forwards............................................................................................................. 63
NOTE 12 Subsequent events ......................................................................................................................... 63
NOTE 13 Fees paid to the Statutory Auditors ............................................................................................. 63
NOTE 14 Principal consolidated companies ................................................................................................ 64

Consolidated financial statements of the Saint-Gobain Group
2
CONSOLIDATED FINANCIAL STATEMENTS
CONSOLIDATED BALANCE SHEET
At December 31
The accompanying notes are an integral part of the consolidated financial statements.
(in € millions) Notes 2018 2017
Assets
Goodwill (6) 9,988 10,575
Other intangible assets (6) 2,526 2,603
Property, plant and equipment (6) 11,335 11,590
Investments in equity-accounted companies (7) 412 379
Deferred tax assets (11) 837 938
Other non-current assets (7) 2,527 774
Non-current assets 27,625 26,859
Inventories (4) 6,252 6,041
Trade accounts receivable (4) 4,968 5,134
Current tax receivable (11) 286 204
Other receivables (4) 1,609 1,395
Assets held for sale (2) 614 0
Cash and cash equivalents (9) 2,688 3,284
Current assets 16,417 16,058
Total assets 44,042 42,917
Equity and liabilities
Capital stock (10) 2,186 2,214
Additional paid-in capital and legal reserve (10) 5,646 5,944
Retained earnings and consolidated net income (10) 11,969 12,167
Cumulative translation adjustments (1,640) (1,756)
Fair value reserves (124) 22
Treasury stock (10) (106) (123)
Shareholders’ equity 17,931 18,468
Minority interests 331 384
Total equity 18,262 18,852
Non-current portion of long-term debt (9) 9,218 7,655
Provisions for pensions and other employee benefits (5) 2,525 2,927
Deferred tax liabilities (11) 472 427
Other non-current liabilities and provisions (8) 1,036 1,053
Non-current liabilities 13,251 12,062
Current portion of long-term debt (9) 1,184 1,064
Current portion of other liabilities and provisions (8) 465 412
Trade accounts payable (4) 6,116 6,027
Current tax liabilities (11) 104 157
Other payables (4) 3,859 3,823
Liabilities held for sale (2) 322 0
Short-term debt and bank overdrafts (9) 479 520
Current liabilities 12,529 12,003
Total equity and liabilities 44,042 42,917

Consolidated financial statements of the Saint-Gobain Group
3
CONSOLIDATED INCOME STATEMENT
The accompanying notes are an integral part of the consolidated financial statements.
(in € millions) Notes 2018 2017
Net sales (4) 41,774 40,810
Cost of sales (4) (31,172) (30,420)
General expenses including research (4) (7,510) (7,395)
Share in net income of core business equity-accounted companies (7) 30 33
Operating income 3,122 3,028
Other business income (4) 435 121
Other business expense (4) (2,759) (638)
Business income 798 2,511
Borrowing costs, gross (300) (298)
Income from cash and cash equivalents 22 23
Borrowing costs, net (278) (275)
Other financial income and expense 467 (173)
Net financial expense (9) 189 (448)
Share in net income of non-core business equity-accounted companies (7) 0 0
Income taxes (11) (490) (438)
Net income 497 1,625
Group share of net income 420 1,566
Minority interests 77 59
Earnings per share, Group share (in €) (10) 0.77 2.83
Weighted average number of shares in issue 547,105,985 553,383,836
Diluted earnings per share, Group share (in €) (10) 0.76 2.81
Weighted average number of shares assuming full dilution 550,016,438 556,655,598

Consolidated financial statements of the Saint-Gobain Group
4
CONSOLIDATED STATEMENT OF RECOGNIZED INCOME AND EXPENSE
The accompanying notes are an integral part of the consolidated financial statements.
(in € millions) Notes 2018 2017
Net income 497 1,625
Items that may be subsequently reclassified to profit or loss
Translation adjustments (56) (1,048)
Changes in fair value of financial instruments (9) (77) (169)
Tax on items that may be subsequently reclassified to profit or loss 24 59
Items that will not be reclassified to profit or loss
Changes in actuarial gains and losses (5) 307 465
Tax on items that will not be reclassified to profit or loss (11) (69) (89)
Changes in assets at fair value through equity (7) (69) 0
Liability method on items that will not be reclassified to profit or loss (11) (1) (252)
Other (45) (2)
Income and expense recognized directly in equity 14 (1,036)
Total recognized income and expense for the year 511 589
Group share 452 563
Minority interests 59 26
Consolidated financial statements of the Saint-Gobain Group
5
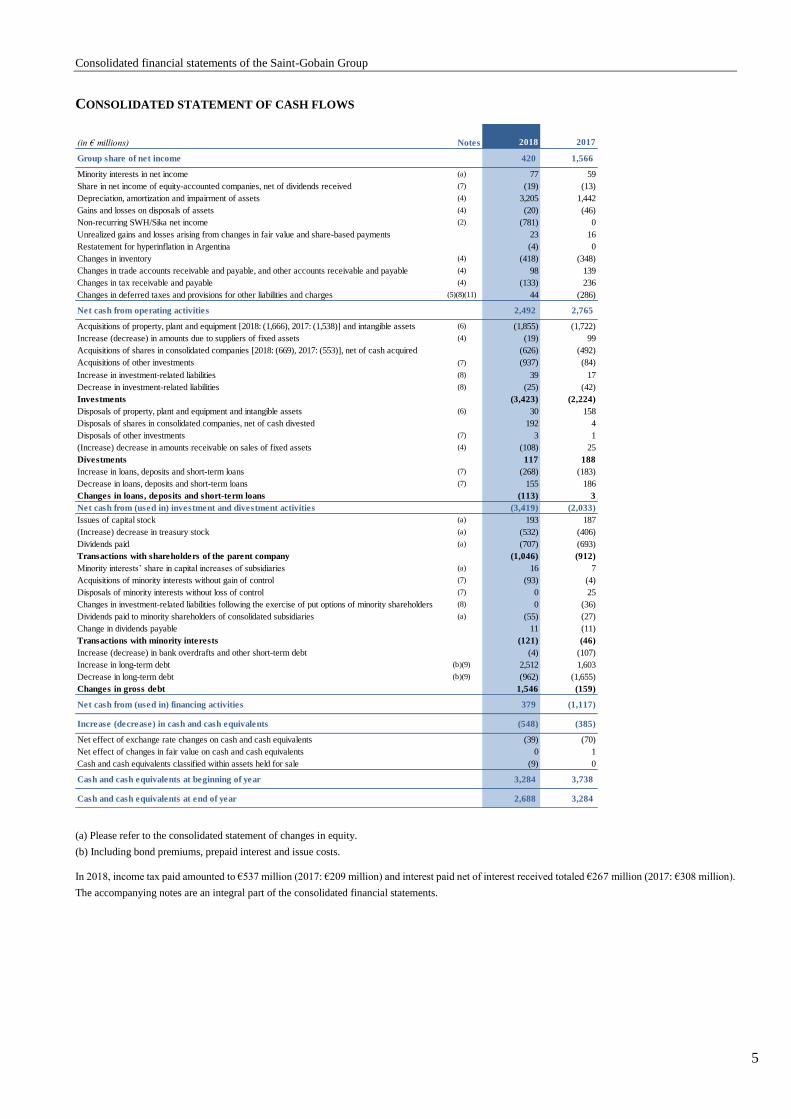
CONSOLIDATED STATEMENT OF CASH FLOWS
(a) Please refer to the consolidated statement of changes in equity.
(b) Including bond premiums, prepaid interest and issue costs.
In 2018, income tax paid amounted to €537 million (2017: €209 million) and interest paid net of interest received totaled €267 million (2017: €308 million).
The accompanying notes are an integral part of the consolidated financial statements.
(in € millions) Notes 2018 2017
Group share of net income 420 1,566
Minority interests in net income (a) 77 59
Share in net income of equity-accounted companies, net of dividends received (7) (19) (13)
Depreciation, amortization and impairment of assets (4) 3,205 1,442
Gains and losses on disposals of assets (4) (20) (46)
Non-recurring SWH/Sika net income (2) (781) 0
Unrealized gains and losses arising from changes in fair value and share-based payments 23 16
Restatement for hyperinflation in Argentina (4) 0
Changes in inventory (4) (418) (348)
Changes in trade accounts receivable and payable, and other accounts receivable and payable (4) 98 139
Changes in tax receivable and payable (4) (133) 236
Changes in deferred taxes and provisions for other liabilities and charges (5)(8)(11) 44 (286)
Net cash from operating activities 2,492 2,765
Acquisitions of property, plant and equipment [2018: (1,666), 2017: (1,538)] and intangible assets (6) (1,855) (1,722)
Increase (decrease) in amounts due to suppliers of fixed assets (4) (19) 99
Acquisitions of shares in consolidated companies [2018: (669), 2017: (553)], net of cash acquired (626) (492)
Acquisitions of other investments (7) (937) (84)
Increase in investment-related liabilities (8) 39 17
Decrease in investment-related liabilities (8) (25) (42)
Investments (3,423) (2,224)
Disposals of property, plant and equipment and intangible assets (6) 30 158
Disposals of shares in consolidated companies, net of cash divested 192 4
Disposals of other investments (7) 3 1
(Increase) decrease in amounts receivable on sales of fixed assets (4) (108) 25
Divestments 117 188
Increase in loans, deposits and short-term loans (7) (268) (183)
Decrease in loans, deposits and short-term loans (7) 155 186
Changes in loans, deposits and short-term loans (113) 3
Net cash from (used in) investment and divestment activities (3,419) (2,033)
Issues of capital stock (a) 193 187
(Increase) decrease in treasury stock (a) (532) (406)
Dividends paid (a) (707) (693)
Transactions with shareholders of the parent company (1,046) (912)
Minority interests’ share in capital increases of subsidiaries (a) 16 7
Acquisitions of minority interests without gain of control (7) (93) (4)
Disposals of minority interests without loss of control (7) 0 25
Changes in investment-related liabilities following the exercise of put options of minority shareholders (8) 0 (36)
Dividends paid to minority shareholders of consolidated subsidiaries (a) (55) (27)
Change in dividends payable 11 (11)
Transactions with minority interests (121) (46)
Increase (decrease) in bank overdrafts and other short-term debt (4) (107)
Increase in long-term debt (b)(9) 2,512 1,603
Decrease in long-term debt (b)(9) (962) (1,655)
Changes in gross debt 1,546 (159)
Net cash from (used in) financing activities 379 (1,117)
Increase (decrease) in cash and cash equivalents (548) (385)
Net effect of exchange rate changes on cash and cash equivalents (39) (70)
Net effect of changes in fair value on cash and cash equivalents 0 1
Cash and cash equivalents classified within assets held for sale (9) 0
Cash and cash equivalents at beginning of year 3,284 3,738
Cash and cash equivalents at end of year 2,688 3,284

Consolidated financial statements of the Saint-Gobain Group
6
CONSOLIDATED STATEMENT OF CHANGES IN EQUITY
* The restatements are explained in Note 3 “Impact of new standards”.
The accompanying notes are an integral part of the consolidated financial statements.
Issued Outstanding Capital stock
Additional
paid-in capital
and legal
reserve
Retained
earnings and
consolidated
net income
Cumulative
translation
adjustments
Fair value
reserves
Treasury
stock
Shareholders’
equity
Minority
interests Total equity
555,280,358 553,388,403 At December 31, 2016 2,221 6,090 11,077 (742) 191 (72) 18,765 375 19,140
Income and expenses recognized directly in equity 0 0 180 (1,014) (169) 0 (1,003) (33) (1,036)
Net income for the year 1,566 1,566 59 1,625
Total income and expense for the year 0 0 1,746 (1,014) (169) 0 563 26 589
Issues of capital stock
4,593,807 4,593,807 Group Savings Plan 18 150 168 168
682,926 682,926 Stock option plans 3 16 19 19
Other 0 7 7
Dividends paid (€1.26 per share) (693) (693) (27) (720)
(9,595,036) Shares purchased (15) (462) (477) (477)
1,715,619 Shares sold 71 71 71
(7,000,000) Shares canceled (28) (312) 340 0 0
Share-based payments 17 17 17
Changes in Group structure and other 35 35 3 38
553,557,091 550,785,719 At December 31, 2017 2,214 5,944 12,167 (1,756) 22 (123) 18,468 384 18,852
IFRS 9 and IFRS 15* restatements (24) (24) 0 (24)
Restatement for hyperinflation in Argentina (93) 154 61 61
553,557,091 550,785,719 Restated at January 1, 2018 2,214 5,944 12,050 (1,602) 22 (123) 18,505 384 18,889
Income and expenses recognized directly in equity 0 0 216 (38) (146) 0 32 (18) 14
Net income for the year 420 420 77 497
Total income and expense for the year 0 0 636 (38) (146) 0 452 59 511
Issues of capital stock
4,932,767 4,932,767 Group Savings Plan 20 159 179 179
556,595 556,595 Stock option plans 2 12 14 14
Other 0 16 16
Dividends paid (€1.30 per share) (707) (707) (55) (762)
(14,050,245) Shares purchased (30) (583) (613) (613)
1,654,431 Shares sold 81 81 81
(12,461,449) Shares canceled (50) (469) 519 0 0
Share-based payments 28 28 28
Changes in Group structure and other (8) (8) (73) (81)
546,585,004 543,879,267 At December 31, 2018 2,186 5,646 11,969 (1,640) (124) (106) 17,931 331 18,262
(number of shares) (in € millions)
Consolidated financial statements of the Saint-Gobain Group
7
NOTES TO THE CONSOLIDATED FINANCIAL STATEMENTS
The consolidated financial statements reflect the accounting position of Compagnie de Saint-Gobain and its subsidiaries
(“the Group”), as well as the Group’s interests in associate companies and joint ventures. They are expressed in euros rounded
to the nearest million.
These consolidated financial statements were adopted on February 21, 2019 by the Board of Directors and will be submitted
to the Shareholders’ Meeting of June 6, 2019 for approval.
Accounting principles and policies are highlighted in a distinct color.
NOTE 1 ACCOUNTING PRINCIPLES AND POLICIES
The accounting policies applied are consistent with those used to prepare the financial statements for the year ended December 31,
2017, except for (i) the application of the new standards and interpretations described below and (ii) IAS 29, “Financial Reporting
in Hyperinflationary Economies”. The consolidated financial statements have been prepared using the historical cost convention,
except for certain assets and liabilities that have been measured using the fair value model as explained in these notes.
1.1. Standards applied
The consolidated financial statements have been prepared in accordance with the International Financial Reporting Standards
(IFRS) and interpretations adopted for use in the European Union at December 31, 2018. These financial statements have
also been prepared in accordance with the IFRS issued by the International Accounting Standards Board (IASB). Standards
adopted by the European Union may be consulted on the European Commission website, at
https://ec.europa.eu/info/law/international-accounting-standards-regulation-ec-no-1606-2002/
1.1.1. Standards, interpretations and amendments to existing standards applicable for reporting periods beginning on or
after January 1, 2018
Certain new standards, interpretations and amendments to existing standards are applicable for the 2018 reporting period.
The Group changed its accounting policies accordingly and recorded retrospective restatements following the adoption of:
IFRS 9, “Financial Instruments”
IFRS 15, “Revenue from Contracts with Customers”
The impact of adopting these standards is set out in Note 3.
Amendments to IFRS 2, “Share-based Payment”
Amendments to IFRS 4, “Insurance Contracts”
Amendments to IAS 40, “Investment Property”
IFRIC 22, “Foreign Currency Transactions”
Annual improvements to IFRSs – 2014-2016 cycle.
The adoption of these amendments and interpretations did not have a material impact on the Group’s consolidated financial
statements.
1.1.2. Standards, interpretations and amendments to existing standards available for early adoption in reporting periods
beginning on or after January 1, 2018
The new standards, interpretations and amendments to existing standards applicable to accounting periods starting on or after
January 1, 2019 were not early adopted by the Group at December 31, 2018.
Consolidated financial statements of the Saint-Gobain Group
8
IFRS 16, “Leases”
Saint-Gobain has chosen to apply IFRS 16 using the full retrospective method with effect from January 1, 2019 and will
restate all of its leases that fall within the scope of the standard. IFRS 16 provides for a number of recognition exemptions:
- leases with a lease term of 12 months or less;
- leases where the underlying asset has a value of less than USD 5,000 when new.
After organizing its IFRS 16 projects in 2017, the Group continued to identify and compile data on its leases in 2018. The
Group identified some 47,000 leases, including 5,500 property leases.
In order to calculate the relevant impacts and monitor the leases from an operational standpoint, the Group put in place an IT
solution enabling it to:
- record and perform calculations for all leases,
- update information in real time,
- generate accounting entries,
- manage forecast data,
- analyze financial impacts.
The estimated impact of applying IFRS 16 on the opening balance sheet at January 1, 2018 is as follows:
- recognition of a right-of-use asset of between €2.8 billion and €3.0 billion,
- recognition of a lease liability of between €3.0 billion and €3.3 billion,
- decrease in equity of between €0.2 billion and €0.3 billion.
The lease liability approximates the amount disclosed in off-balance sheet commitments for leases.
The estimated impact of applying IFRS 16 on the 2018 income statement is as follows:
- a positive impact of between €0.7 billion and €0.8 billion on EBITDA,
- a negative impact of around €0.1 billion on net financial income (expense).
These amounts include assets and liabilities held for sale and any related gains and losses (see section 2.3).
Leases of property assets: the Group has reviewed and analyzed all of its property leases in light of the lease definition criteria
set out in IFRS 16. The lease term corresponds to the non-cancelable period of the lease, plus any renewal (termination)
options that the Group is reasonably certain to exercise (not to exercise). The Group has adopted the position of the French
accounting standard-setter (Autorité des normes comptables – ANC) in respect of “3/6/9-year” commercial leases in France,
i.e., limiting the term of such leases to nine years. The discount rate used to determine the right-of-use asset and the lease
liability for each country and leased asset is calculated based on the incremental borrowing rate at inception of the lease. The
Group calculated the rate applicable to each lease contract on the basis of the lease term.
Leases of non-property assets: the Group has reviewed and analyzed all of its non-property leases to ensure they meet the
definition and recognition criteria set out in IFRS 16. Based on this analysis, the main leases identified correspond to leases
of vehicles, machinery and production equipment.
IFRIC 23, “Uncertainty over Income Tax Treatments”
The Group is currently analyzing the impact of IFRIC 23 on its consolidated financial statements. It did not elect to early
adopt IFRIC 23, which it does not expect to have a material impact on its consolidated financial statements.
Amendments to IFRS 9, “Financial Instruments”
The Group did not elect to early adopt IFRS 9, which it does not expect to have a material impact on its consolidated financial
statements.

Consolidated financial statements of the Saint-Gobain Group
9
1.2. Estimates and assumptions
The preparation of consolidated financial statements in compliance with IFRS requires management to make estimates and
assumptions that affect the amounts of assets and liabilities reported in the balance sheet and the disclosure of contingent
assets and liabilities in the notes to the financial statements, as well as the reported amounts of income and expenses during
the period. These estimates and assumptions are based on past experience and on various other factors seen in the prevailing
economic and financial environment, which makes it difficult to predict future business performance. Actual amounts may
differ from those obtained through the use of these estimates and assumptions.
The main estimates and assumptions described in these notes concern the measurement of employee benefit obligations and
share-based payment (Note 5 “Employees, personnel expenses and employee benefit obligations”), asset impairment tests
(Note 6 “Intangible assets and property, plant and equipment”), provisions for other liabilities and charges (Note 8 “Other
current and non-current liabilities and provisions, contingent liabilities and litigation”), the measurement of financial
instruments (Note 9 “Financing and financial instruments”), and taxes (Note 11 “Taxes”).
NOTE 2 SCOPE OF CONSOLIDATION
2.1. Accounting principles related to consolidation
The Group’s consolidated financial statements include the accounts of Compagnie de Saint-Gobain and of all companies
controlled by the Group, as well as those of jointly controlled companies and companies over which the Group exercises
significant influence.
2.1.1. Consolidation methods
a) Full consolidation
Companies over which the Group exercises exclusive control, either directly or indirectly, are fully consolidated.
b) Joint arrangements
Joint arrangements that meet the definition of joint ventures are accounted for by the equity method. Balance sheet and
income statement items relating to joint arrangements that meet the definition of joint operations are consolidated line-by-
line based on the amount actually contributed by the Group.
c) Equity accounting
Companies over which the Group directly or indirectly exercises significant influence are accounted for by the equity method.
The Group’s share of the income of equity-accounted companies is shown on two separate lines of the income statement.
The income of equity-accounted companies whose main business activity is in keeping with the Group’s core operational
business is presented in business income under “Share in net income of core business equity-accounted companies” while
the income of other equity-accounted companies is shown under “Share in net income of non-core business equity-accounted
companies” in pre-tax income.
2.1.2. Business combinations
a) Step acquisitions and partial disposals
When the Group acquires control of an entity in which it already holds an equity interest, the transaction is treated as a step
acquisition (an acquisition in stages), as follows: (i) as a disposal of the previously-held interest, with recognition of any
resulting gain or loss in the consolidated financial statements, and (ii) as an acquisition of all of the shares, with recognition
of the corresponding goodwill on the entire interest (previous and new acquisitions).
When the Group disposes of a portion of an equity interest leading to the loss of control (but retains a minority interest), the
transaction is also treated as both a disposal and an acquisition, as follows: (i) as a disposal of the entire interest, with

Consolidated financial statements of the Saint-Gobain Group
10
recognition of any resulting gain or loss in the consolidated financial statements, and (ii) as an acquisition of a minority
interest, measured at fair value.
b) Potential voting rights and share purchase commitments
Potential voting rights conferred by call options on minority interests are taken into account in determining whether the Group
exclusively controls an entity only when the Group has control.
When calculating its percentage interest in controlled companies, the Group considers the impact of cross put and call options
on minority interests in the companies concerned. This approach gives rise to the recognition in the financial statements of
an investment-related liability, included within other provisions and non-current liabilities, corresponding to the present value
of the estimated exercise price of the put option, with a corresponding reduction in minority interests and equity attributable
to equity holders of the parent. Any subsequent changes in the fair value of the liability are recognized by adjusting equity.
c) Minority interests
Under IFRS 10, minority interests (referred to as “non-controlling interests” in IFRS 3R) are considered as a shareholder
category (single economic entity approach). As a result, changes in minority interests with no loss of control continue to be
recorded in the statement of changes in equity and have no impact on the income statement or balance sheet, except for
changes in cash and cash equivalents.
2.1.3. Non-current assets and liabilities held for sale – Discontinued operations
Assets and liabilities that are immediately available for sale and for which a sale is highly probable within the next 12 months
are classified as non-current assets and liabilities held for sale. When several assets are held for sale in a single transaction,
they are accounted for as a disposal group, which also includes any liabilities directly associated with those assets. The assets
or disposal groups held for sale are measured at the lower of carrying amount and fair value less costs to sell.
Depreciation/amortization ceases when non-current assets are classified as held for sale. Non-current assets and liabilities
held for sale are presented separately on two lines of the consolidated balance sheet, and income and expenses continue to be
recognized in the consolidated income statement on a line-by-line basis. The reclassified assets are carried at the lower of
their fair value less costs to sell and their carrying amount. At the end of each reporting period, the value of the assets and
liabilities held for sale is reviewed to determine whether any provision adjustments should be recorded due to a change in
their fair value less costs to sell.
An operation is classified as discontinued when it represents a separate major line of business for the Group, and when the
criteria for classification as an asset held for sale have been met, or when the Group has sold the asset. Discontinued operations
are reported on a single line in the Group’s income statement. This line shows the after-tax net income from discontinued
operations until the date of disposal and the gains or losses net of taxes realized on the disposals of these operations. In
addition, cash flows generated by the discontinued operations are reported, by type of operation, on a separate line in the
consolidated statement of cash flows for the relevant periods.
2.1.4. Intragroup transactions
All intragroup balances and transactions are eliminated in consolidation.
2.1.5. Translation of the financial statements of foreign companies
The consolidated financial statements are presented in euros, which is Compagnie de Saint-Gobain’s functional and
presentation currency.
Assets and liabilities of subsidiaries outside the Eurozone are translated into euros at the closing exchange rate, while income
and expense items are translated using the average exchange rate for the period. In the event of significant volatility in
exchange rates or in the exchange rates of hyperinflationary economies, the financial statements of the subsidiaries concerned
are translated at the exchange rates prevailing at year-end.
The Group’s share of any translation gains or losses is included in equity under “Cumulative translation adjustments” until
the assets or liabilities and all foreign operations to which they relate are sold, liquidated or deconsolidated. In this case, these

Consolidated financial statements of the Saint-Gobain Group
11
translation differences are either taken to the income statement, if the transaction results in a loss of control, or recognized
directly in the statement of changes in equity, if the change in minority interests does not result in a loss of control.
2.1.6. Foreign currency transactions
Expenses and income from operations in currencies other than the Company’s functional currency are translated at the
exchange rates prevailing at the transaction date. Assets and liabilities denominated in foreign currencies are translated at the
closing rate and any exchange differences are recorded in the income statement. However, exchange differences relating to
loans and borrowings between consolidated Group companies are recorded in equity net of tax under “Cumulative translation
adjustments”, as they are in substance an integral part of the net investment in a foreign subsidiary.
2.1.7. Hyperinflation in Argentina
Argentina is classified as a hyperinflationary economy with effect from July 1, 2018. IAS 29, “Financial Reporting in
Hyperinflationary Economies” is therefore applicable to entities using the Argentine peso as their functional currency. Under
IAS 29, financial statements prepared based on historical cost must be restated. This involves applying a general price index
that enables the financial statements to be presented in terms of the measuring unit current at the reporting date. All non-
monetary assets and liabilities must therefore be adjusted for inflation in order to reflect their ‘actual value’ at the reporting
date. Similarly, the income statement is adjusted for inflation during the period. Monetary items do not need to be restated as
they already reflect purchasing power at the reporting date.
IAS 29 is to be applied as from the start of the reporting period during which the country concerned is classified as
hyperinflationary. In the 2018 financial statements, the provisions of IAS 29 are applied with effect from January 1, 2018 as
if Argentina had always been a hyperinflationary economy. Under IAS 21, published data for reporting periods prior to the
adoption of hyperinflationary accounting cannot be restated. Accordingly, no restatement is required for 2017 financial data.
The Group does not have significant exposure to Argentina. The impacts of hyperinflationary accounting are included in
certain non-cash balance sheet items.
2.2. Changes in Group structure
Significant changes in the Group’s structure during 2018 and 2017 are presented below and a list of the main consolidated
companies at December 31, 2018 is provided in Note 14 “Principal consolidated companies”.
2.2.1. Transactions carried out in 2018
In 2018, Saint-Gobain continued to actively manage its portfolio of businesses, fully in line with its strategy. Various
operations were completed in order to strengthen the Group’s profile in high added-value businesses and growing markets.
The Group carried out 27 acquisitions of consolidated companies for €669 million in 2018, plus €93 million in acquisitions
of minority interests that did not involve taking control of the company concerned.
The main transactions are summarized below:
On January 11, 2018, Saint-Gobain and the Kuwait-based company Alghanim Industries, who are already partners in
insulation manufacturing joint ventures in Turkey (Izocam) and Saudi Arabia (SIIMCO), decided to extend their partnership
in Kuwait with the KIMMCO joint venture,
On March 1, 2018, Saint-Gobain acquired all of the shares of Per Strand. With 12 outlets in northern Norway, Per Strand is
the leading building distribution generalist in its region,
On March 1, 2018, Saint-Gobain acquired HyComp, a leading supplier of composite components made with proprietary
carbon fibers and thermoplastic materials, used in high-temperature and long-life applications in the aerospace industry,
On April 13, 2018, Saint-Gobain acquired the pharmaceutical business of Micro Hydraulics, an Ireland-based supplier and
manufacturer of single-use fluid handling components and systems in high-performance plastics for high purity applications
in the pharmaceutical and biopharmaceutical industries,
On July 3, 2018, Saint-Gobain signed an agreement to purchase Hunter Douglas’ North American ceilings business. A
leading manufacturer of architectural ceilings, this business has two production sites in Norcross (Georgia) and Denver
(Colorado),
On August 1, 2018, Saint-Gobain acquired the German company HKO, which designs, produces and distributes a complete
range of very high temperature thermal insulation and fire protection solutions made from various types of glass fibers able
to cover temperature resistance between 600°C and 1,000°C,

Consolidated financial statements of the Saint-Gobain Group
12
On September 20, 2018, Hankuk Glass Industries (HGI), a South Korean subsidiary of Saint-Gobain on the Seoul stock
exchange, launched a tender offer to acquire the 23% of shares owned by minority shareholders. As a result of this successful
offer, Saint-Gobain and HGI now hold 96.8% of the company’s share capital, with a delisting planned,
On October 5, 2018, Saint-Gobain signed an agreement to acquire all of the capital of Kaimann, one of Europe’s leading
manufacturers of elastomeric insulation products.
The Group's acquisitions in 2018 represent full-year sales of around €570 million.
In the first half of 2018, Saint-Gobain also pressed ahead with its plan to acquire a controlling interest in Sika (see Section
1.2, Chapter 3, of the 2017 Registration Document) A decision from the Zug Supreme Court was expected for the second
half of 2018.
On May 11, 2018, Saint-Gobain, Sika and the Burkard family announced that they had found an overall agreement under
which:
- Saint-Gobain acquired all outstanding shares of Schenker-Winkler Holding AG (SWH) from the Burkard family for a
purchase price of CHF 3.22 billion.
- Sika purchased 6.97% of its own capital from SWH (representing a 23.7% voting interest in the company) for a total
consideration of CHF 2.08 billion.
- Sika held an extraordinary general meeting on June 11, 2018 which decided to convert all of its shares into a single class of
registered shares (“one share, one vote”), to eliminate the opting-out clause and the 5% share transfer restriction, and to cancel
the 6.97% shares acquired from SWH.
- The two groups announced that they would also continue their existing business relationship and seek to further expand it
into areas of mutual benefit, while preserving and respecting each group’s economic and legal independence.
Saint-Gobain, through SWH, became Sika’s largest shareholder, holding 10.75% of the share capital and voting rights. With
regard to this stake, the parties agreed on a two-year lock-up period and on standstill obligations (up to 10.75% of Sika’s
capital for four years and up to 12.875% of its capital for the following two years). In the event of an intended sale by SWH,
these shares would first be offered to Sika, within the limit of 10.75% of Sika's capital.
This overall agreement terminated and resolved the disputes between Sika, the Burkard family and Saint-Gobain to the
common benefit of all parties involved and that of their respective shareholders and stakeholders.
For Saint-Gobain, the transaction results in total income of €781 million, which includes a financial gain of €601 million
(i.e., the difference between the fair value of the shares at the date of the transaction and the value of the call entered into in
December 2014), and a compensatory indemnity of €180 million recorded in other business income. The Group has elected
to recognize subsequent changes in the fair value of the Sika shares held by SWH within income and expenses recognized
directly in equity.
The Group’s Venezuelan subsidiaries have been deconsolidated: operational oversight of the businesses has become
increasingly difficult owing to (i) the country’s worsening political and economic climate, (ii) exchange rate volatility, as a
result of which our Venezuelan operations are not material, and (iii) increasing difficulties in obtaining reliable financial
information within the appropriate time frames.
The Group stepped up restructuring measures in China aimed at restoring the profitability of its Pipe business. Following the
decision of the Xuzhou city council on April 8 to request operations at the local plant to be suspended in light of new
environmental regulations, the Group concluded that it was unable to profitably operate the facility and that it would
definitively shut down operations, with a portion of production being transferred to the other Chinese factory in Ma’anshan.
In parallel with the immediate launch of a process to close down the plant, the Group has entered into talks with several
investors with a view to selling the shares of the three legal entities concerned. On November 23, 2018, the Group completed
the sale of the entities operating at the Xuzhou plant along with their industrial and real estate assets, to Nanjing Manyuan
Technology Co., Ltd. (NMT).

Consolidated financial statements of the Saint-Gobain Group
13
2.2.2. Transactions carried out in 2017
In 2017, Saint-Gobain continued to actively manage its portfolio of businesses, fully in line with its strategy. Various
operations were completed in order to strengthen the Group’s profile in high added-value businesses and growing markets.
Saint-Gobain, supported by its Board of Directors, continued with the plan to acquire a controlling interest in Sika, a value-
creating industrial project for all parties, pending the decision from the Zug Supreme Court initially expected at the start of
2018.
2.3. Assets and liabilities held for sale
The exhaustive review of the Group’s business portfolio announced in November 2018 and currently in progress, has led
Saint-Gobain to launch a process to divest the following businesses, the assets and liabilities of which are classified as held
for sale at December 31, 2018:
Silicon carbide business: Saint-Gobain has entered into exclusive negotiations to sell its silicon carbide operations (part of
the High-Performance Materials Sector). It granted exclusivity to private equity firm OpenGate Capital after having received
a purchase offer from the latter for the Group’s silicon carbide operations. This firm and binding offer is not subject to any
financing conditions. The planned transaction may be finalized following the customary information and consultation
procedures with the competent employee representative bodies. Completion of the deal is subject to clearance from the anti-
trust authorities and should be effective in the first half of 2019.
Building Distribution business in Germany: as part of the acceleration of the rotation of its portfolio, in November 2018 the
Group also announced it was planning to sell its Building Distribution operations in Germany.
As a result, since these businesses meet the qualifying criteria set out in IFRS 5 (see section 2.1.3), the balance sheet accounts
of the entities concerned were combined and measured within assets and liabilities held for sale in the consolidated balance
sheet at December 31, 2018, with the exception of debt owed to other Group companies and equity.
The breakdown of assets and liabilities held for sale at the end of the reporting period is as follows:
(in € millions) Total
Intangible assets, property, plant and equipment and goodwill 161
Inventories, trade accounts receivable, other receivables and other non-
current assets444
Cash and cash equivalents 9
Assets held for sale 614
Provisions for pensions and other employee benefits 82
Other current and non-current liabilities and provisions 22
Trade accounts payable, other payables and other current liabilities 195
Debt and bank overdrafts 23
Liabilities held for sale 322
Net assets (liabilities) held for sale 292

Consolidated financial statements of the Saint-Gobain Group
14
2.4. Changes in the number of consolidated companies
At December 31, 2018, the number of consolidated companies was as follows:
2.5. Off-balance sheet commitments related to companies within the scope of consolidation
At December 31, 2017, non-cancelable purchase commitments included the commitment on equity holdings in the Sika group
totaling €2,369 million. On May 11, 2018, this commitment was terminated following Saint-Gobain’s purchase of Sika group
shares from SWH.
The Group unwound the currency hedges taken out in connection with the acquisition of a controlling interest in Sika further
to the purchase of shares in the company.
NOTE 3 IMPACT OF NEW STANDARDS
This note sets out the new accounting policies applied with effect from January 1, 2018 and explains the impact on the
consolidated balance sheet of adopting IFRS 9, “Financial Instruments” and IFRS 15, “Revenue from Contracts with
Customers”.
The Group has chosen to apply the simplified retrospective method and has recorded the cumulative impact of IFRS 9 and
IFRS 15 in equity at January 1, 2018.
The restatements made are described below in further detail.
3.1. Accounting policies applied as from January 1, 2018
IFRS 9, “Financial Instruments” supersedes IAS 39, “Financial Instruments: Recognition and Measurement”. It sets out new
principles for recognizing financial instruments and in particular requires entities to apply an impairment model for trade
accounts receivable based on expected losses. The impacts of IFRS 9 chiefly concern the impairment of trade accounts
receivable. Debt was also adjusted for the remaining expenses to be amortized on one of the two undrawn credit lines. The
total impact on equity net of tax was a negative €23 million, including a negative €20 million impact relating to the impairment
of trade accounts receivable.
IFRS 15,”Revenue from Contracts with Customers” supersedes IAS 18 “Revenue” and IAS 11, “Construction Contracts”,
along with the related interpretations, in terms of revenue recognition. The new revenue recognition rules did not lead to
significant changes in the accounting policies at Group level.
The Group’s sales generally comprise only one performance obligation. Saint-Gobain does not usually offer additional
or optional warranties beyond the statutory or customary warranty period (resulting from market conditions) covering
design or manufacturing defects of products delivered. As a result, no separate performance obligation was recognized
in this respect.
Under IFRS 15, the estimated amount of any variable consideration is to be included in the transaction price.
France
Outside
France Total
Fully consolidated companies
At December 31, 2017 143 628 771
Newly consolidated companies 2 42 44
Merged companies (5) (14) (19)
Deconsolidated companies 0 (29) (29)
Change in consolidation method 0 1 1
At December 31, 2018 140 628 768
Equity-accounted companies and joint arrangements
At December 31, 2017 4 95 99
Newly consolidated companies 0 6 6
Merged companies 0 0 0
Deconsolidated companies 0 (3) (3)
Change in consolidation method 0 (1) (1)
At December 31, 2018 4 97 101
Total at December 31, 2017 147 723 870
Total at December 31, 2018 144 725 869

Consolidated financial statements of the Saint-Gobain Group
15
Discounts, refunds and rebates, performance-based penalties or bonuses relating to late/early production/delivery, and
rights of return granted to customers, have the effect of decreasing or increasing revenue provided that, in the case of
performance-based bonuses, they are highly probable. Rights of return are recorded against a refund liability, which is
classified within current items. An asset is recognized in inventories to reflect the Group’s right to recover products.
Saint-Gobain estimates any such variable consideration based on historical data and limits the amount recognized in this
respect to the amount it deems highly probable it will receive.
In most cases, revenue is recognized for performance obligations at a point in time, i.e., when control of the goods or
services is transferred to the customer. This generally occurs upon delivery or installation of the goods, when the
installation is not a separate performance obligation. When the installation is a separate performance obligation, the
related revenue is recognized over time, based on costs incurred.
Revenue under some Group contracts is recognized over time. This is the case for sales of specific products to certain
customers in the Innovative Materials Sector whenever an unconditional right to payment exists.
The application of IFRS 15 does not have a material impact on the financial statements, reducing equity by €1 million
net of tax. This chiefly relates to adjustments concerning the recognition of rights to return goods in the Building
Distribution Sector and adjustments concerning performance bonuses and the timing of revenue recognition applicable
to specific products for certain customers in the Innovative Materials Sector.
3.2. Impact on the consolidated balance sheet
(in € millions) Dec. 31, 2017
Impact of IFRS 9
and IFRS 15
Jan. 1, 2018,
restated
Assets
Non-current assets 26,859 9 26,868
Inventories 6,041 9 6,050
Trade accounts receivable 5,134 (27) 5,107
Other receivables 1,395 6 1,401
Other current assets 3,488 0 3,488
Total assets 42,917 (3) 42,914
Equity and liabilities
Shareholders’ equity 18,468 (24) 18,444
Minority interests 384 0 384
Other non-current assets 12,062 4 12,066
Other payables 3,823 17 3,840
Other short-term debt 8,180 0 8,180
Total equity and liabilities 42,917 (3) 42,914

Consolidated financial statements of the Saint-Gobain Group
16
NOTE 4 INFORMATION CONCERNING THE GROUP’S OPERATING ACTIVITIES
4.1. Income statement items
4.1.1. Revenue recognition
Revenue generated by the sale of goods or services is recognized net of rebates, discounts and sales taxes when control of
the goods or services has been transferred to the customer. Revenue generated by the sale of goods is primarily recognized
at the time the goods are delivered. Revenue generated by the sale of services is recognized when the services have been
rendered, or by reference to the stage of completion of the services, as calculated based on costs incurred. Similarly, within
the Building Distribution Sector, estimated returns are recognized as a deduction from revenue (net sales) and reclassified
within inventories for their net carrying amount, since there is a possibility that goods will be returned within the allotted
timeframe. A liability relating to future refunds for goods returned is also recognized.
Revenue generated under construction contracts is accounted for by the Group’s companies on a percentage-of-completion
basis, as calculated based on costs incurred. The related costs are expensed as incurred. When the outcome of a construction
contract cannot be estimated reliably, contract revenue is recognized to the extent of contract costs incurred that it is probable
will be recovered. When it is probable that total contract costs will exceed total contract revenue, the expected loss is
recognized as an expense immediately.
Construction contract revenues are not material in relation to total consolidated net sales.
4.1.2. Operating income
Operating income is a measure of the performance of the different sectors and has been used by the Group as its key external
and internal management indicator for many years. Foreign exchange gains and losses are included in operating income, as
are changes in the fair value of financial instruments that do not qualify for hedge accounting when they relate to operating
items. The share of income of core business equity-accounted companies is also posted under operating income.
Discounts granted by suppliers to the Building Distribution Sector are included in operating income. Contractual supplier
discounts are customary practice in the industrial goods distribution sector. These discounts are mostly calculated by applying
a contractually guaranteed rate by product type to volumes purchased. The calculation is made automatically, based on the
supplier invoices. Consequently, little judgment is needed when determining the amounts to be recognized in the income
statement for these discounts. Other discounts are calculated based on a step mechanism linked to specified targets, whereby
the percentage discount increases as the entity achieves the various targets over a given period. In this case, judgment is
required based on historical data, past performance and future trends in order to determine the discount to be recognized in
the income statement. Such judgment is exercised in a prudent manner and consistently from one period to the next.

Consolidated financial statements of the Saint-Gobain Group
17
4.1.3. Business income
Business income includes all income and expenses other than financial income and expense, the Group’s share in net income
of non-core business equity-accounted companies, and income taxes.
Business income is detailed by type below:
(a) Share-based payments (IFRS 2 expense) and changes in employee benefit expense are detailed in Note 5 “Employees, personnel
expenses and employee benefit obligations”. (b) The “Other” operating income line relates to cost of sales, supplier discounts and selling expenses for the Building Distribution Sector,
and to transport costs, raw materials costs, and other production costs for the other sectors. This item also includes research and
development costs recorded under operating expenses, amounting to €454 million in 2018 (2017: €450 million) and the settlement of
one-off disputes in favor of the Group for around €70 million in 2018. (c) “Other business income” mainly includes the compensatory indemnity of €180 million in connection with SWH/Sika and the gain on
the disposal of entities operating at the Group’s Xuzhou plant in China (see section 2.2).
4.1.3.1. Other business income and expense
Other business income and expense mainly include changes in provisions for claims and litigation (excluding those arising
in the ordinary course of operations) and environmental matters, disposal gains and losses, asset impairment, restructuring
costs incurred upon the disposal or discontinuation of operations and the costs of workforce reduction measures.
Other business income and expense can be analyzed as follows:
(a) Restructuring costs in 2018 mainly consist of retirement benefits totaling €127 million (2017: €65 million). (b) In both 2018 and 2017, changes in provisions and expenses relating to litigation as detailed and explained in Note 8 “Other current
and non-current liabilities and provisions, contingent liabilities and litigation” chiefly concern asbestos-related litigation. (c) In 2018, “Other” mainly includes the compensatory indemnity of €180 million in connection with SWH/Sika (see section 2.2). In
2017, it mainly related to the cost of the June 27, 2017 cyber-attack. (d) The “Impairment of assets and other business expense” line essentially includes (i) impairment of goodwill, other intangible assets
and property, plant and equipment for €2,003 million in 2018 (2017: €236 million) (see sections 6.1, 6.2 and 6.3), (ii) the impairment
of other assets for €34 million (2017: €1 million), and (iii) acquisition fees and contingent consideration incurred in connection with
business combinations, representing a net expense of €23 million in 2018 (net income of €11 million in 2017).
(in € millions) 2018 2017
Net sales 41,774 40,810
Personnel expenses:
Salaries and payroll taxes (8,243) (8,110)
Share-based payments(a)
(35) (38)
Pensions and employee benefit obligations(a)
(180) (125)
Depreciation and amortization (1,202) (1,206)
Share in net income of core business equity-accounted companies 30 33
Other(b)
(29,022) (28,336)
Operating income 3,122 3,028
Other business income(c)
435 121
Other business expense(a)
(2,759) (638)
Other business income and expense (2,324) (517)
Business income 798 2,511
(in € millions) 2018 2017
Restructuring costs(a)
(308) (120)
Provisions and expenses relating to claims and litigation(b)
(116) (150)
Other(c)
140 (67)
Non-operating income and expense (284) (337)
Impairment of assets and other(d)
(2,060) (226)
Other business expense(e)
(235) (75)
Impairment of assets and other business expenses (2,295) (301)
Gains on disposals of property, plant and equipment and intangible assets 255 121
Capital gains and losses on disposals, asset impairment, acquisition fees
and contingent consideration(2,040) (180)
Other business income and expense (2,324) (517)
Consolidated financial statements of the Saint-Gobain Group
18
(e) Other business expense in 2018 relates primarily to capital losses on disposals, the impacts of deconsolidating the Group’s Venezuelan
subsidiaries, and assets that were scrapped.
4.2. Segment information
In accordance with IFRS 8, segment information reflects the Group’s internal organization as presented to management. The
Group has chosen to present segment information by sector and business in line with its internal reporting. There were no
changes in the presentation of segment information in 2018 compared with prior years.
Segment assets and liabilities include net property, plant and equipment, working capital, goodwill and net other intangible
assets, after deducting deferred taxes on brands and land.
Capital expenditure corresponds to acquisitions of property, plant and equipment and does not include the cost of acquiring
non-current assets under finance leases.
Segment information is presented by sector and by business as follows:
Innovative Materials (IM) Sector
Flat Glass
High-Performance Materials (HPM)
Construction Products (CP) Sector
Interior Solutions: Insulation and Gypsum
Exterior Solutions: Industrial Mortars, Pipe and Exterior Products
Building Distribution Sector (BD).
Management uses several different internal indicators to measure operational performance and to make resource allocation
decisions. These indicators are based on the data used to prepare the consolidated financial statements and meet financial
reporting requirements. Intragroup (“internal”) sales are generally carried out on the same terms as sales to external customers
and are eliminated in consolidation. The “Other” column includes holding companies and certain corporate support functions
(tax, cash management, purchasing, etc.).
Following the announcement of the Group’s “Transform & Grow” program in November 2018, changes in the Group’s
organizational structure in 2019 will alter the breakdown of reporting segments to be presented.

Consolidated financial statements of the Saint-Gobain Group
19
Segment information for 2018 and 2017 by sector and by business is as follows:
2018
*“Other” corresponds to the elimination of intragroup transactions for internal sales, and holding company transactions for the other captions.
2017
*“Other” corresponds to the elimination of intragroup transactions for internal sales, and holding company transactions for the other captions.
Building
DistributionOther
* Total
(in € millions)
Flat
Glass
High-
Performance
Materials
Intra-segment
eliminations Total
Interior
Solutions
Exterior
Solutions
Intra-
segment
eliminations Total
External sales 5,593 4,824 10,417 6,475 5,472 11,947 19,397 13 41,774
Internal sales 39 96 (28) 107 692 317 (101) 908 3 (1,018) 0
Net sales 5,632 4,920 (28) 10,524 7,167 5,789 (101) 12,855 19,400 (1,005) 41,774
Operating income 501 803 1,304 756 436 1,192 634 (8) 3,122
Business income 320 564 884 698 (48) 650 (782) 46 798
Share in net income of equity-accounted
companies15 2 17 6 7 13 0 0 30
Depreciation and amortization 271 167 438 304 153 457 269 38 1,202
Impairment of assets 59 60 119 2 530 532 1,352 2,003
EBITDA 772 970 1,742 1,060 589 1,649 903 30 4,324
Capital expenditure 486 227 713 402 219 621 263 69 1,666
Cash flow from operations 1,186 1,030 583 224 3,023
Goodwill, net 201 1,826 2,027 3,804 2,182 5,986 1,975 9,988
Non-amortizable brands 0 0 0 732 89 821 1,080 1,901
Total segment assets and liabilities 8,242 12,140 6,431 255 27,068
Innovative Materials Construction Products
Building
DistributionOther
* Total
(in € millions)
Flat
Glass
High-
Performance
Materials
Intra-segment
eliminations Total
Interior
Solutions
Exterior
Solutions
Intra-
segment
eliminations Total
External sales 5,633 4,588 10,221 6,246 5,527 11,773 18,797 19 40,810
Internal sales 39 150 (27) 162 638 307 (94) 851 3 (1,016) 0
Net sales 5,672 4,738 (27) 10,383 6,884 5,834 (94) 12,624 18,800 (997) 40,810
Operating income 571 715 1,286 652 491 1,143 631 (32) 3,028
Business income 580 608 1,188 556 394 950 493 (120) 2,511
Share in net income of equity-accounted
companies22 2 24 3 5 8 0 1 33
Depreciation and amortization 280 167 447 301 165 466 261 32 1,206
Impairment of assets 48 1 49 47 37 84 103 0 236
EBITDA 851 882 1,733 953 656 1,609 892 0 4,234
Capital expenditure 468 192 660 374 208 582 251 45 1,538
Cash flow from operations 1,188 1,015 653 164 3,020
Goodwill, net 189 1,602 1,791 3,615 2,399 6,014 2,770 0 10,575
Non-amortizable brands 0 0 0 735 89 824 1,191 0 2,015
Total segment assets and liabilities 7,389 12,209 7,645 120 27,363
Innovative Materials Construction Products
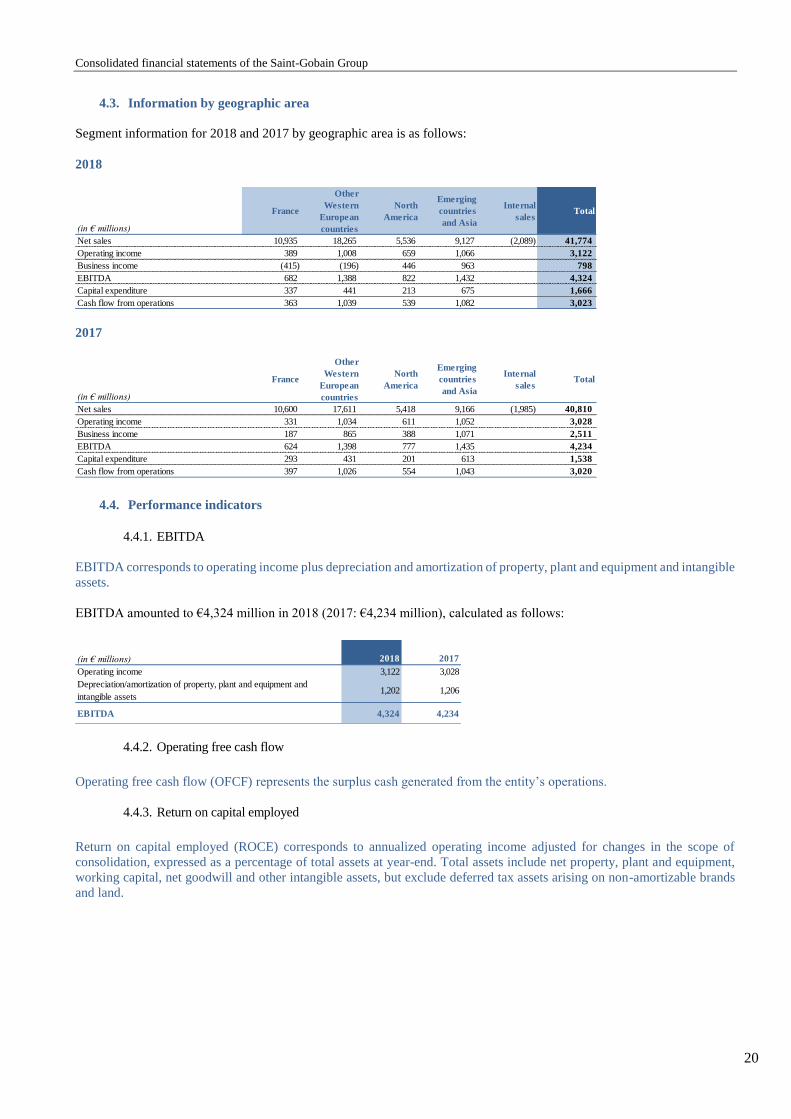
Consolidated financial statements of the Saint-Gobain Group
20
4.3. Information by geographic area
Segment information for 2018 and 2017 by geographic area is as follows:
2018
2017
4.4. Performance indicators
4.4.1. EBITDA
EBITDA corresponds to operating income plus depreciation and amortization of property, plant and equipment and intangible
assets.
EBITDA amounted to €4,324 million in 2018 (2017: €4,234 million), calculated as follows:
4.4.2. Operating free cash flow
Operating free cash flow (OFCF) represents the surplus cash generated from the entity’s operations.
4.4.3. Return on capital employed
Return on capital employed (ROCE) corresponds to annualized operating income adjusted for changes in the scope of
consolidation, expressed as a percentage of total assets at year-end. Total assets include net property, plant and equipment,
working capital, net goodwill and other intangible assets, but exclude deferred tax assets arising on non-amortizable brands
and land.
(in € millions)
France
Other
Western
European
countries
North
America
Emerging
countries
and Asia
Internal
salesTotal
Net sales 10,935 18,265 5,536 9,127 (2,089) 41,774
Operating income 389 1,008 659 1,066 3,122
Business income (415) (196) 446 963 798
EBITDA 682 1,388 822 1,432 4,324
Capital expenditure 337 441 213 675 1,666
Cash flow from operations 363 1,039 539 1,082 3,023
(in € millions)
France
Other
Western
European
countries
North
America
Emerging
countries
and Asia
Internal
salesTotal
Net sales 10,600 17,611 5,418 9,166 (1,985) 40,810
Operating income 331 1,034 611 1,052 3,028
Business income 187 865 388 1,071 2,511
EBITDA 624 1,398 777 1,435 4,234
Capital expenditure 293 431 201 613 1,538
Cash flow from operations 397 1,026 554 1,043 3,020
(in € millions) 2018 2017
Operating income 3,122 3,028
Depreciation/amortization of property, plant and equipment and
intangible assets1,202 1,206
EBITDA 4,324 4,234

Consolidated financial statements of the Saint-Gobain Group
21
4.4.4. Recurring net income
Recurring net income corresponds to income after tax and minority interests but before disposal gains or losses, asset
impairment, material non-recurring provisions and the related tax and minority interests.
Recurring net income totaled €1,729 million in 2018 (2017: €1,631 million). Based on the weighted average number of shares
outstanding at December 31 (547,105,985 shares in 2018 and 553,383,836 shares in 2017), recurring earnings per share
amounted to €3.16 in 2018 and €2.95 in 2017.
The difference between net income and recurring net income corresponds to the following items:
4.4.5. Cash flow from operations
Cash flow from operations corresponds to net cash generated from operating activities before the impact of changes in
working capital, changes in current taxes and changes in provisions for pensions and other employee benefit obligations as
well as for other liabilities and charges and deferred taxes. Cash flow from operations is adjusted for the effect of material
non-recurring provision charges.
Cash flow from operations before tax on disposal gains and losses and non-recurring provisions corresponds to cash flow
from operations less the tax effect of asset disposals, asset impairment and non-recurring provisions.
Cash flow from operations totaled €3,023 million in 2018 (€3,020 million in 2017) and cash flow from operations excluding
income tax on disposal gains and losses and non-recurring provisions amounted to €2,936 million in the year (€2,891 million
in 2017).
These amounts are calculated as follows:
(in € millions) 2018 2017
Group share of net income 420 1,566
Less:
Gains and losses on disposals of assets 20 46
Impairment of assets and other (2,060) (226)
Non-recurring SWH/Sika net income 781 0
Changes in provisions for non-recurring items and other (139) 4
Impact of minority interests 2 (18)
Tax on disposal gains and losses, asset impairment and non-recurring
charges to provisions87 129
Group share of recurring net income 1,729 1,631
(in € millions) 2018 2017
Group share of net income 420 1,566
Minority interests in net income 77 59
Share in net income of equity-accounted companies, net of dividends
received(19) (13)
Depreciation, amortization and impairment of assets 3,205 1,442
Gains and losses on disposals of assets (20) (46)
Changes in provisions for non-recurring items 122 (4)
Non-recurring SWH/Sika net income (781) 0
Unrealized gains and losses arising from changes in fair value and
share-based payments23 16
Restatement for hyperinflation in Argentina (4) 0
Cash flow from operations 3,023 3,020
Tax on disposal gains and losses, asset impairment and non-recurring
charges to provisions(87) (129)
Cash flow from operations before tax on disposal gains and
losses and non-recurring provisions 2,936 2,891

Consolidated financial statements of the Saint-Gobain Group
22
4.5. Working capital
Working capital can be analyzed as follows:
4.5.1. Inventories
Inventories are stated at the lower of cost and net realizable value. The cost of inventories includes purchase costs (net of
supplier discounts), processing costs and other costs incurred in bringing the inventories to their present location and
condition. Cost is generally determined using the weighted-average cost method, and in some cases the First-In-First-Out
(FIFO) method. Inventory costs may also include the transfer from equity of any gains/losses on qualifying cash flow hedges
of foreign currency purchases of raw materials. Net realizable value is the selling price in the ordinary course of business,
less estimated completion and selling costs. No account is taken in the inventory valuation process of the impact of below-
normal capacity utilization rates.
At December 31, 2018 and 2017, inventories were as follows:
The net value of inventories was €6,252 million at December 31, 2018 compared with €6,041 million at December 31, 2017.
Impairment losses on inventories recorded in the 2018 income statement totaled €179 million (2017: €207 million). Reversals
of impairment losses on inventories amounted to €159 million in 2018 (2017: €183 million).
4.5.2. Operating and non-operating receivables and payables
Trade accounts receivable and payable and other receivables and payables are stated at their carrying amount, which
approximates their fair value as they generally have maturities of less than three months. Provisions for impairment are
booked to cover the risk of total or partial non-recovery, within the limit of expected credit losses.
The Group deems that its exposure to concentrations of credit risk is limited due to its diversified business line-up, broad
customer base and global presence. Past-due trade receivables are regularly monitored and analyzed, and impairment losses
recognized are adjusted where appropriate.
(in € millions) Dec. 31, 2018 Dec. 31, 2017
Inventories, net 6,252 6,041
Trade receivables, net 4,968 5,134
Other operating receivables 1,407 1,278
Other non-operating receivables 202 117
Other receivables 1,609 1,395
Current tax receivable 286 204
Trade accounts payable 6,116 6,027
Other operating payables 3,284 3,286
Other non-operating payables 575 537
Other payables 3,859 3,823
Current tax liabilities 104 157
Operating working capital 3,227 3,140
Non-operating working capital (including current tax receivables and
liabilities)(191) (373)
Working capital 3,036 2,767
(in € millions) Dec. 31, 2018 Dec. 31, 2017
Gross value
Raw materials 1,494 1,391
Work in progress 363 330
Finished goods 4,849 4,770
Gross inventories 6,706 6,491
Provision for impairment
Raw materials (149) (139)
Work in progress (13) (12)
Finished goods (292) (299)
Total provision for impairment (454) (450)
Net 6,252 6,041

Consolidated financial statements of the Saint-Gobain Group
23
For trade receivables transferred under securitization programs, the contracts concerned are analyzed and if substantially all
the risks associated with the receivables are not transferred in substance to the financing institutions, they remain on the
balance sheet and a corresponding liability is recognized in short-term debt (further information is provided in Note 9.3.8).
a) Trade and other accounts receivable
Trade and other accounts receivable can be analyzed as follows:
As a result of applying IFRS 9, the Group recognized an additional €28 million provision for impairment of trade accounts
receivable at January 1, 2018 (€20 million net of tax).
Changes in impairment provisions for trade accounts receivable in 2018 primarily reflect €87 million in additions
(2017: €98 million) and €114 million in reversals (2017: €111 million), resulting from recoveries as well as write-offs. Write-
offs of doubtful and bad debts are also reported under this caption for €76 million (2017: €78 million).
Trade accounts receivable at December 31, 2018 and 2017 are analyzed below by maturity:
b) Trade and other accounts payable
Trade and other accounts payable and accrued expenses can be analyzed as follows:
(in € millions) Dec. 31, 2018 Dec. 31, 2017
Gross value 5,347 5,527
Provision for impairment (379) (393)
Trade accounts receivable 4,968 5,134
Discounts and advances to suppliers 633 637
Prepaid payroll taxes 36 25
Other prepaid and recoverable taxes (other than income tax) 478 372
Miscellaneous operating receivables 269 250
Other non-operating receivables and provisions 204 117
Provision for impairment of other operating receivables (9) (6)
Provision for impairment of other non-operating receivables (2) 0
Other receivables 1,609 1,395
(in € millions)
Dec. 31, 2018 Dec. 31, 2017 Dec. 31, 2018 Dec. 31, 2017 Dec. 31, 2018 Dec. 31, 2017
Trade accounts receivable not yet due 4,172 4,318 (32) (30) 4,140 4,288
Trade accounts receivable past due
Less than 1 month 478 478 (22) (12) 456 466
1-3 months 206 201 (25) (21) 181 180
More than three months 491 530 (300) (330) 191 200
Trade accounts receivable past due 1,175 1,209 (347) (363) 828 846
Trade accounts receivable 5,347 5,527 (379) (393) 4,968 5,134
Gross value Impairment Net value
(in € millions) Dec. 31, 2018 Dec. 31, 2017
Trade accounts payable 6,116 6,027
Downpayments received and rebates granted to customers 1,161 1,133
Payables to suppliers of non-current assets 372 367
Grants received 87 78
Accrued personnel expenses 1,242 1,231
Accrued taxes other than on income 416 423
Other operating payables 465 499
Other non-operating payables 116 92
Other payables 3,859 3,823

Consolidated financial statements of the Saint-Gobain Group
24
4.6. Off-balance sheet commitments related to operating activities
4.6.1. Obligations under finance leases
Non-current assets acquired under finance leases are recognized as an asset and a liability in the balance sheet (see Note 6.4
for further information).
Future payment commitments under finance leases are as follows:
At December 31, 2018, future finance lease payment commitments represented €69 million under equipment and machinery
leases and €22 million under leases of land and buildings.
4.6.2. Obligations under operating leases
The Group leases equipment, vehicles, offices, warehouses and production or sales premises. Lease terms generally range
from one to nine years. The liability for total future minimum payments over the lease terms is discounted. The leases contain
rollover options for varying periods of time and some include clauses covering the payment of real estate taxes and insurance.
In most cases, management expects that these leases will be rolled over or replaced by other leases in the normal course of
business.
Payments due under non-cancelable operating leases are as follows:
In 2018, rental expenses amounted to €859 million, including €577 million for land and buildings, and revenue from subleases
represented €19 million. Net rental expense was €840 million.
4.6.3. Non-cancelable purchase commitments
Non-cancelable purchase commitments include contractual commitments to purchase raw materials and services along with
firm orders for property, plant and equipment and intangible assets.
(in € millions) Dec. 31, 2018 Dec. 31, 2017
Future minimum lease payments
Due within 1 year 25 19
Due in 1 to 5 years 51 43
Due beyond 5 years 15 17
Total future minimum lease payments 91 79
Less finance charge (16) (13)
Present value of future minimum lease payments 75 66
(in € millions)
Due within 1
year
Due in 1 to 5
years
Due beyond 5
years
Rental expense 3,248 697 1,550 1,001 3,209
Subletting revenue (88) (15) (31) (42) (81)
Total 3,160 682 1,519 959 3,128
Payments due by period
Total 2018 Total 2017
(in € millions)
Due within 1
year
Due in 1 to 5
years
Due beyond 5
years
Property, plant and equipment and intangible assets 43 42 1 0 48
Commodities and energy 1,501 396 860 245 1,308
Services 128 49 61 18 157
Total 1,672 487 922 263 1,513
Payments due by period
Total 2018 Total 2017

Consolidated financial statements of the Saint-Gobain Group
25
4.6.4. Guarantee commitments
In some cases, the Group grants seller’s warranties to the buyers of divested businesses. A provision is set aside whenever a
risk is identified and the related cost can be estimated reliably.
The Group also receives guarantees, amounting to €83 million at December 31, 2018 (December 31, 2017: €78 million).
4.6.5. Commercial commitments
The Group’s commercial commitments are shown below:
Guarantees given to the Group in respect of receivables totaled €107 million at December 31, 2018 (December 31, 2017:
€104 million). At December 31, 2018, pledged assets represented €577 million (December 31, 2017: €330 million) and
chiefly concerned fixed assets pledged in the United Kingdom. Other commitments given by the Group also include the €77.5
million take-up guarantee granted in connection with its future head office premises at La Défense up to April 6, 2020.
4.6.6. Other commitments
A provision for greenhouse gas emissions allowances is recorded in the consolidated financial statements to cover any
difference between the Group’s emissions and the allowances granted.
Greenhouse gas emissions allowances allocated to Group companies by the European Union in 2018 represented
approximately 3.2 million metric tons of CO2. The new 2019 allowances will be added to the residual inventory of prior
allocations and will cover the level of greenhouse gas emissions for the year. As a result, no provision has been recorded in
this respect in the Group’s financial statements.
NOTE 5 EMPLOYEES, PERSONNEL EXPENSES AND EMPLOYEE BENEFIT OBLIGATIONS
5.1. Employees of fully consolidated companies
The total number of Group employees for fully consolidated companies was 181,001 at December 31, 2018 and 179,149 at
December 31, 2017.
(in € millions)
Due within 1
year
Due in 1 to 5
years
Due beyond 5
years
Security for borrowings 48 21 18 9 39
Other commitments given 217 78 95 44 237
Total 265 99 113 53 276
Commitment amounts by period
Total 2018 Total 2017
2018 2017
Managerial-grade employees 30,292 28,991
Administrative employees 77,416 75,664
Other employees 73,828 71,795
Total average number of employees 181,536 176,450

Consolidated financial statements of the Saint-Gobain Group
26
5.2. Management compensation
Direct and indirect compensation and benefits paid to members of the Board of Directors and the Group’s senior management
were as follows in 2018 and 2017:
Total gross compensation and benefits paid in 2018 to Saint-Gobain management by the French and foreign companies in
the Group (excluding any long-term cash settled compensation) amounted to €18.1 million (2017: €14.5 million), including
€5.7 million in gross variable compensation (2017: €5.8 million) in respect of the gross variable portion and €2.7 million in
termination benefits (2017: €0.1 million).
Provisions for pensions and other post-employment benefits (defined benefit obligations [DBO] in respect of length-of-
service awards and pensions) accruing to Group management totaled €50.9 million at December 31, 2018 (December 31,
2017: €46.6 million).
5.3. Provisions for pensions and other employee benefits
5.3.1. Description of defined benefit plans
After retirement, the Group’s former employees are eligible for pension benefits in accordance with the applicable laws and
regulations in the respective countries in which the Group operates. There are also additional pension obligations in certain
Group companies, both in France and in other countries.
The Group’s obligation for the payment of pensions and length-of-service awards is determined at the end of the reporting
period by independent actuaries using the projected unit credit method, taking into account changes in salaries until retirement
and the economic conditions in each country. These obligations may be financed by pension funds, with a provision
recognized in the balance sheet for the unfunded portion.
When plan assets exceed the defined benefit obligation, the excess is recognized in other non-current assets under “net
pension assets”. The asset ceiling corresponds to the maximum future economic benefit. Changes in the asset ceiling are
recognized in equity.
Actuarial gains and losses result from changes in actuarial assumptions, experience adjustments and the difference between
the funds’ actual and estimated (calculated) rates of return. They are recognized against equity as and when they arise.
The interest cost of these obligations and the return on the related plan assets are measured by the Group using the discount
rate applied to estimate the obligation at the beginning of the period, and are recognized as financial income or expense.
The Group’s main defined benefit plans are as follows:
In France, employees receive length-of-service awards on retirement based on years of service and the calculation methods
prescribed in the applicable collective bargaining agreements.
In addition to length-of-service awards, there are three defined benefit plans, all of which are final salary plans. These plans
were closed to new entrants by the companies concerned between 1969 and 1997. Effective March 1, 2012, a defined benefit
plan complying with Article L.137-11 of France’s Social Security Code (Code de la sécurité sociale) was set up by
Compagnie de Saint-Gobain.
(in € millions) 2018 2017
Attendance fees 1.1 1.1
Direct and indirect compensation (gross)
Fixed portion 9.7 8.6
Variable portion 5.7 5.8
Estimated cost of pensions and other employee benefit obligations
(IAS 19)2.5 3.2
Share-based payment expense (IFRS 2) 9.2 11.1
Termination, retirement and other benefits 2.7 0.1
Total 30.9 29.9
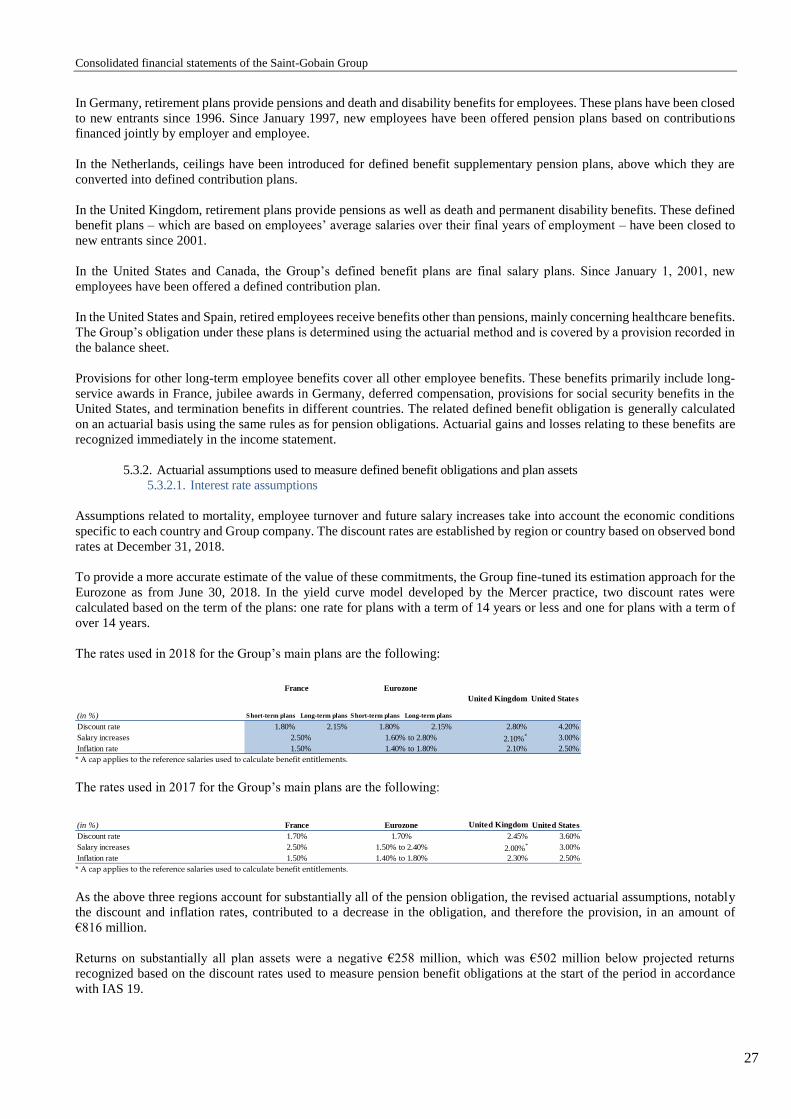
Consolidated financial statements of the Saint-Gobain Group
27
In Germany, retirement plans provide pensions and death and disability benefits for employees. These plans have been closed
to new entrants since 1996. Since January 1997, new employees have been offered pension plans based on contributions
financed jointly by employer and employee.
In the Netherlands, ceilings have been introduced for defined benefit supplementary pension plans, above which they are
converted into defined contribution plans.
In the United Kingdom, retirement plans provide pensions as well as death and permanent disability benefits. These defined
benefit plans – which are based on employees’ average salaries over their final years of employment – have been closed to
new entrants since 2001.
In the United States and Canada, the Group’s defined benefit plans are final salary plans. Since January 1, 2001, new
employees have been offered a defined contribution plan.
In the United States and Spain, retired employees receive benefits other than pensions, mainly concerning healthcare benefits.
The Group’s obligation under these plans is determined using the actuarial method and is covered by a provision recorded in
the balance sheet.
Provisions for other long-term employee benefits cover all other employee benefits. These benefits primarily include long-
service awards in France, jubilee awards in Germany, deferred compensation, provisions for social security benefits in the
United States, and termination benefits in different countries. The related defined benefit obligation is generally calculated
on an actuarial basis using the same rules as for pension obligations. Actuarial gains and losses relating to these benefits are
recognized immediately in the income statement.
5.3.2. Actuarial assumptions used to measure defined benefit obligations and plan assets
5.3.2.1. Interest rate assumptions
Assumptions related to mortality, employee turnover and future salary increases take into account the economic conditions
specific to each country and Group company. The discount rates are established by region or country based on observed bond
rates at December 31, 2018.
To provide a more accurate estimate of the value of these commitments, the Group fine-tuned its estimation approach for the
Eurozone as from June 30, 2018. In the yield curve model developed by the Mercer practice, two discount rates were
calculated based on the term of the plans: one rate for plans with a term of 14 years or less and one for plans with a term of
over 14 years.
The rates used in 2018 for the Group’s main plans are the following:
* A cap applies to the reference salaries used to calculate benefit entitlements.
The rates used in 2017 for the Group’s main plans are the following:
* A cap applies to the reference salaries used to calculate benefit entitlements.
As the above three regions account for substantially all of the pension obligation, the revised actuarial assumptions, notably
the discount and inflation rates, contributed to a decrease in the obligation, and therefore the provision, in an amount of
€816 million.
Returns on substantially all plan assets were a negative €258 million, which was €502 million below projected returns
recognized based on the discount rates used to measure pension benefit obligations at the start of the period in accordance
with IAS 19.
(in %) Short-term plans Long-term plans Short-term plans Long-term plans
Discount rate 1.80% 2.15% 1.80% 2.15% 2.80% 4.20%
Salary increases 2.10%* 3.00%
Inflation rate 2.10% 2.50%
United StatesUnited Kingdom
France Eurozone
1.50% 1.40% to 1.80%
2.50% 1.60% to 2.80%
(in %) United Kingdom United States
Discount rate 2.45% 3.60%
Salary increases 2.00%* 3.00%
Inflation rate 2.30% 2.50%
1.70%
2.50%
1.50%
1.70%
1.50% to 2.40%
1.40% to 1.80%
France Eurozone
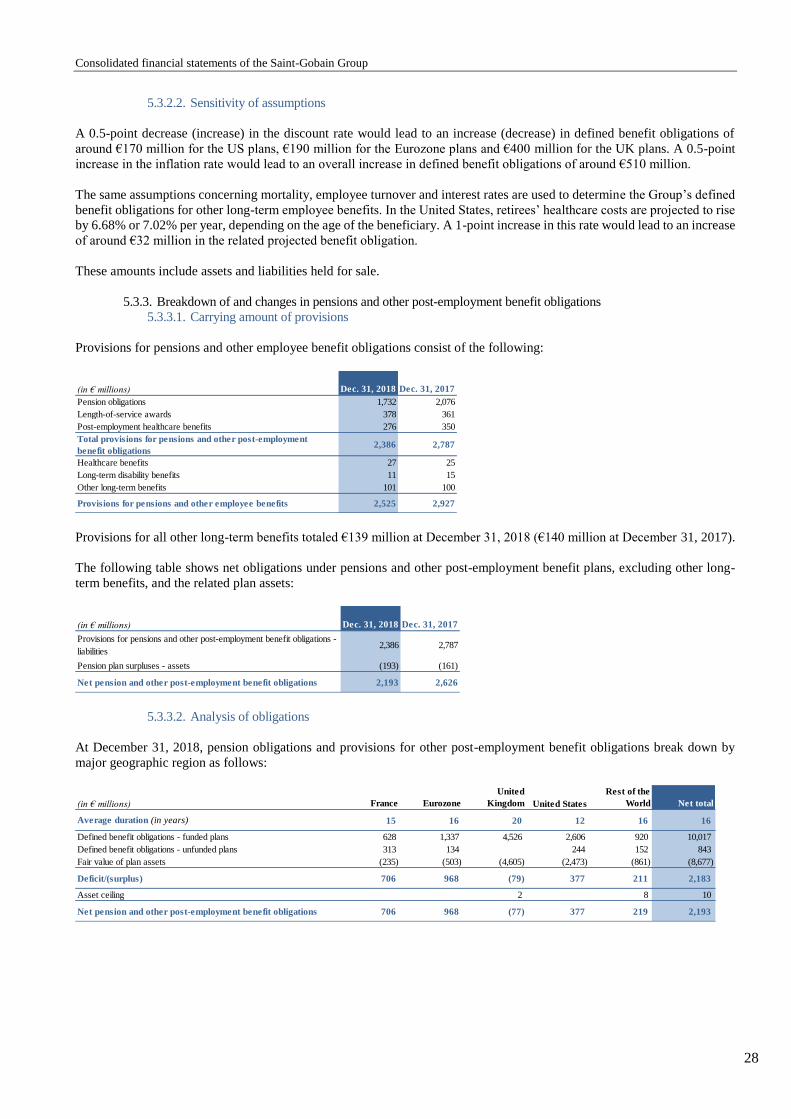
Consolidated financial statements of the Saint-Gobain Group
28
5.3.2.2. Sensitivity of assumptions
A 0.5-point decrease (increase) in the discount rate would lead to an increase (decrease) in defined benefit obligations of
around €170 million for the US plans, €190 million for the Eurozone plans and €400 million for the UK plans. A 0.5-point
increase in the inflation rate would lead to an overall increase in defined benefit obligations of around €510 million.
The same assumptions concerning mortality, employee turnover and interest rates are used to determine the Group’s defined
benefit obligations for other long-term employee benefits. In the United States, retirees’ healthcare costs are projected to rise
by 6.68% or 7.02% per year, depending on the age of the beneficiary. A 1-point increase in this rate would lead to an increase
of around €32 million in the related projected benefit obligation.
These amounts include assets and liabilities held for sale.
5.3.3. Breakdown of and changes in pensions and other post-employment benefit obligations
5.3.3.1. Carrying amount of provisions
Provisions for pensions and other employee benefit obligations consist of the following:
Provisions for all other long-term benefits totaled €139 million at December 31, 2018 (€140 million at December 31, 2017).
The following table shows net obligations under pensions and other post-employment benefit plans, excluding other long-
term benefits, and the related plan assets:
5.3.3.2. Analysis of obligations
At December 31, 2018, pension obligations and provisions for other post-employment benefit obligations break down by
major geographic region as follows:
(in € millions) Dec. 31, 2018 Dec. 31, 2017
Pension obligations 1,732 2,076
Length-of-service awards 378 361
Post-employment healthcare benefits 276 350
Total provisions for pensions and other post-employment
benefit obligations2,386 2,787
Healthcare benefits 27 25
Long-term disability benefits 11 15
Other long-term benefits 101 100
Provisions for pensions and other employee benefits 2,525 2,927
(in € millions) Dec. 31, 2018 Dec. 31, 2017
Provisions for pensions and other post-employment benefit obligations -
liabilities2,386 2,787
Pension plan surpluses - assets (193) (161)
Net pension and other post-employment benefit obligations 2,193 2,626
(in € millions) France Eurozone
United
Kingdom United States
Rest of the
World Net total
Average duration (in years) 15 16 20 12 16 16
Defined benefit obligations - funded plans 628 1,337 4,526 2,606 920 10,017
Defined benefit obligations - unfunded plans 313 134 244 152 843
Fair value of plan assets (235) (503) (4,605) (2,473) (861) (8,677)
Deficit/(surplus) 706 968 (79) 377 211 2,183
Asset ceiling 2 8 10
Net pension and other post-employment benefit obligations 706 968 (77) 377 219 2,193
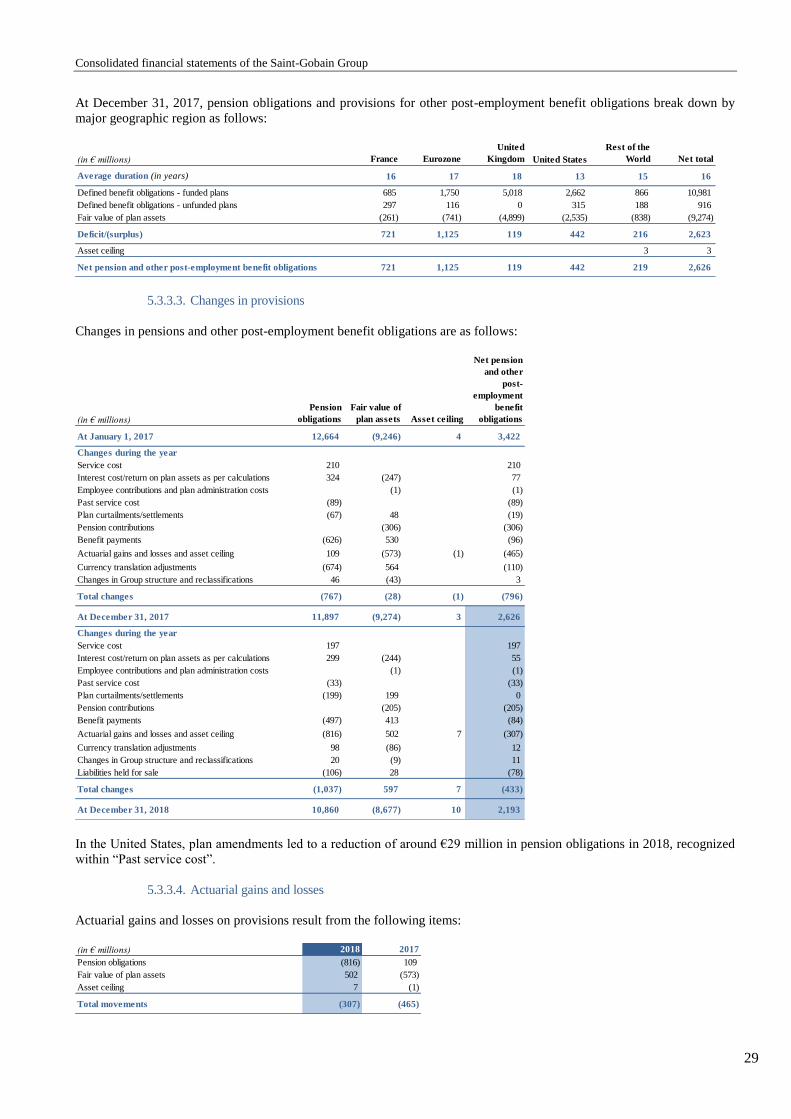
Consolidated financial statements of the Saint-Gobain Group
29
At December 31, 2017, pension obligations and provisions for other post-employment benefit obligations break down by
major geographic region as follows:
5.3.3.3. Changes in provisions
Changes in pensions and other post-employment benefit obligations are as follows:
In the United States, plan amendments led to a reduction of around €29 million in pension obligations in 2018, recognized
within “Past service cost”.
5.3.3.4. Actuarial gains and losses
Actuarial gains and losses on provisions result from the following items:
(in € millions) France Eurozone
United
Kingdom United States
Rest of the
World Net total
Average duration (in years) 16 17 18 13 15 16
Defined benefit obligations - funded plans 685 1,750 5,018 2,662 866 10,981
Defined benefit obligations - unfunded plans 297 116 0 315 188 916
Fair value of plan assets (261) (741) (4,899) (2,535) (838) (9,274)
Deficit/(surplus) 721 1,125 119 442 216 2,623
Asset ceiling 3 3
Net pension and other post-employment benefit obligations 721 1,125 119 442 219 2,626
(in € millions)
Pension
obligations
Fair value of
plan assets Asset ceiling
Net pension
and other
post-
employment
benefit
obligations
At January 1, 2017 12,664 (9,246) 4 3,422
Changes during the year
Service cost 210 210
Interest cost/return on plan assets as per calculations 324 (247) 77
Employee contributions and plan administration costs (1) (1)
Past service cost (89) (89)
Plan curtailments/settlements (67) 48 (19)
Pension contributions (306) (306)
Benefit payments (626) 530 (96)
Actuarial gains and losses and asset ceiling 109 (573) (1) (465)
Currency translation adjustments (674) 564 (110)
Changes in Group structure and reclassifications 46 (43) 3
Total changes (767) (28) (1) (796)
At December 31, 2017 11,897 (9,274) 3 2,626
Changes during the year
Service cost 197 197
Interest cost/return on plan assets as per calculations 299 (244) 55
Employee contributions and plan administration costs (1) (1)
Past service cost (33) (33)
Plan curtailments/settlements (199) 199 0
Pension contributions (205) (205)
Benefit payments (497) 413 (84)
Actuarial gains and losses and asset ceiling (816) 502 7 (307)
Currency translation adjustments 98 (86) 12
Changes in Group structure and reclassifications 20 (9) 11
Liabilities held for sale (106) 28 (78)
Total changes (1,037) 597 7 (433)
At December 31, 2018 10,860 (8,677) 10 2,193
(in € millions) 2018 2017
Pension obligations (816) 109
Fair value of plan assets 502 (573)
Asset ceiling 7 (1)
Total movements (307) (465)

Consolidated financial statements of the Saint-Gobain Group
30
The obligation under the Guaranteed Minimum Pension (GMP) in the United Kingdom, which is designed to equalize benefits
for men and women, is reflected in the provision for pensions and other post-employment benefit obligations at December
31, 2018. This additional obligation was included in the consolidated statement of recognized income and expense.
5.3.3.5. Plan assets
Plan assets have been progressively built up by contributions, primarily in the United Kingdom and the United States.
Contributions paid by the Group in 2018 totaled €205 million (2017: €306 million).
A 0.5-point increase or decrease in the actual return on plan assets would have an impact of approximately €43 million on
equity.
Plan assets mainly comprise:
Contributions to pension plans for 2019 are estimated at around €110 million.
5.3.3.6. Employee benefit expense
Provisions for pensions and other post-employment benefit plans are as follows:
5.3.4. Defined contribution plans
Contributions to defined contribution plans are expensed as incurred.
Contributions to defined contribution plans for 2018 represented an estimated €667 million (2017: €644 million), including
€442 million for government-sponsored basic pension schemes (2017: €434 million), €137 million for government-sponsored
supplementary pension schemes, mainly in France (2017: €131 million), and €88 million for corporate-sponsored
supplementary pension plans (2017: €79 million).
5.4. Share-based payments
5.4.1. Group Savings Plan
The Group Savings Plan (Plan Epargne Group - PEG) is an employee stock purchase plan open to all Group employees in
France and most other countries where the Group is present. Eligible employees must have completed a minimum of three
months’ service with the Group. Eligible employees are able to invest in Saint-Gobain shares at a preferential subscription
price. These shares are held either directly or through the employee saving plan’s mutual funds, depending on local
legislation, and are subject to a mandatory five- or ten-year lock-up, except following the occurrence of certain events. The
Board of Directors delegates authorization for setting the subscription price to the Chief Executive Officer of Compagnie de
Saint-Gobain. It corresponds to the average of the opening prices for the Saint-Gobain share on Euronext Paris over the 20
trading days preceding the date of the decision, subject to a 20% discount, in accordance with applicable laws, the
Shareholders’ Meeting resolutions and the deliberations of the Board of Directors.
The compensation cost recorded in accordance with IFRS 2 is measured by reference to the fair value of a discount offered
on restricted stock (i.e., stock subject to a lock-up). The cost of the lock-up for the employee is defined as the cost of a two-
step strategy that involves first selling the restricted stock forward five or ten years and then purchasing the same number of
shares on the spot market and financing the purchase with debt. The borrowing cost is estimated at the rate that would be
Dec. 31, 2018 Dec. 31, 2017
Equities 23% 29%
Bonds 58% 48%
Other 19% 23%
(in € millions) 2018 2017
Service cost 197 210
Interest cost 299 324
Return on plan assets (244) (247)
Past service cost, plan curtailments and settlements (33) (108)
Employee contributions and plan administration costs (1) (1)
Pensions, length-of-service awards and
other post-employment benefits218 178

Consolidated financial statements of the Saint-Gobain Group
31
charged by a bank to an individual with an average risk profile for a general-purpose, five- or ten-year consumer loan
repayable at maturity. The cost of the plans is recognized in full at the end of the subscription period.
In 2018, 4,932,767 new shares with a par value of €4 were issued to employees under the PEG at an average subscription
price of €36.31 (2017: 4,593,807 shares at an average price of €36.72), representing a share capital increase of €179 million
(€168 million in 2017), net of transaction fees.
No amount was expensed in respect of the plans in 2018 or 2017 owing to the lock-in cost.
The following table shows the main features of the standard plans, the amounts invested in the plans and the valuation
assumptions applied in 2018 and 2017:
* A 0.5-point decline in borrowing costs for the employee would have no material impact on the 2018 share-based payment expense as calculated in accordance with IFRS 2.
5.4.2. Stock option plans
Compagnie de Saint-Gobain has stock option plans available to certain employees.
The Board of Directors grants options allowing beneficiaries to obtain Saint-Gobain shares at a price set, at no discount, by
reference to the average of the opening prices for the Saint-Gobain share over the 20 stock market trading days preceding the
date of the decision by the Board of Directors.
For all of the plans, options may only be exercised after four years of the grant date. During this period, none of the options
received may be exercised. Options must be exercised within 10 years of the grant date. Except in specified circumstances,
grantees forfeit these options if they leave the Group.
Among the plans outstanding at December 31, 2018, plans launched between 2009 and 2012 offer subscription options, while
the 2013 and 2014 plans offer purchase options. For plans launched between 2015 and 2018, the Board of Directors has
decided that it would determine the type of option (subscription or purchase) at the latest on the day before the start of the
exercise period, with any options exercised prior to such decision considered as subscription options.
Until 2008, options were subject to a performance condition for certain grantees only. A performance condition applies for
all grantees in plans awarded since 2009.
For options granted under the 2018 plan, the value used to calculate the 30% contribution sociale tax due by grantees
employed by French companies in the Group is €1.88 per option granted.
2018 2017
Plan characteristics
Date of Shareholders’ MeetingJune 8, 2017 (17
th
Resolution)
June 4, 2015 (17th
Resolution)
Date of the Chief Executive Officer’s decision fixing the
subscription priceMarch 19 March 20
Plan duration (in years) 5 or 10 5 or 10
Reference price (in €) 45.38 45.89
Subscription price (in €) 36.31 36.72
Discount (in %) 20.00% 20.00%
Total discount on the date of the Chief Executive Officer’s
decision (in %) (a)20.76% 21.25%
Employee investments (in € millions) 179.1 168.7
Total number of shares subscribed 4,932,767 4,593,807
Valuation assumptions (5-year maturity)
Interest rate applicable to employees* 4.80% 4.80%
Risk-free interest rate 0.09% 0.19%
Repo rate 0.34% 0.47%
Lock-up discount (in %) (b) 20.93% 21.17%
Total cost to the Group (in %) (a-b) -0.17% 0.08%

Consolidated financial statements of the Saint-Gobain Group
32
The following table presents changes in the number of outstanding options:
* Including 655,186 subscription options granted under the 2008 plan that had not been exercised when the plan expired, and 234,550 purchase options granted under the 2014 plan that had lapsed because the
performance condition had only partly been met.
The cost of stock option plans is calculated using the Black & Scholes option pricing model.
The following inputs were used:
volatility assumptions that take into account the historical volatility of the share price over a rolling 10-year period, as
well as implied volatility from traded share options. Periods of extreme share price volatility are disregarded;
assumptions relating to the average holding period of options, based on observed behavior of option holders;
expected dividends, as estimated on the basis of historical dividend information dating back to 1988;
a risk-free interest rate corresponding to the yield on long-term government bonds;
the effect of any stock market performance conditions, which is taken into account in the initial measurement of IFRS 2
share-based payment expense.
The cost calculated using this method is recognized in the income statement over the vesting period of the options, which is
a maximum of four years.
Stock option expense recorded in the income statement amounted to €2 million in 2018 (2017: €1 million). The fair value of
options granted in 2018 amounted to €1 million.
The table below summarizes information about stock options outstanding at December 31, 2018, after taking into account
partial fulfillment of the performance criteria attached to certain plans.
* 2015, 2016, 2017 and 2018 plans: see above.
For subscription options, the sum received by the Company when options are exercised is recorded in “Capital stock” for the
portion representing the par value of the shares, with the balance – net of directly attributable transaction costs – recorded
under “Additional paid-in capital”.
At December 31, 2018, 768,057 stock options were exercisable (at an average exercise price of €36.50) and 1,079,950 options
(with an average exercise price of €40.38) had not yet vested.
€4 par value
shares
Average
exercise
price (in €)
Options outstanding at December 31, 2016 6,922,327 47.97
Options granted 284,500 49.38
Options exercised (689,997) 28.39
Options forfeited (3,501,207) 63.99
Options outstanding at December 31, 2017 3,015,623 33.97
Options granted 290,500 32.24
Options exercised (568,380) 26.64
Options forfeited* (889,736) 28.05
Options outstanding at December 31, 2018 1,848,007 38.78
Grant date
Exercise
price (in €)
Number of
options
Weighted
average
contractual
life (in months)
Exercise
price (in €)
Number of
options
Number of
options Type of options
2009 36.34 627,748 11 627,748 Subscription
2010 35.19 0 23 0 Subscription
2011 31.22 0 35 0 Subscription
2012 27.71 19,962 47 19,962 Subscription
2013 38.80 120,347 59 120,347 Purchase
2014 34.13 71 0 Purchase
2015 83 39.47 224,950 224,950 Subscription or purchase*
2016 95 40.43 280,000 280,000 Subscription or purchase*
2017 107 49.38 284,500 284,500 Subscription or purchase*
2018 119 32.24 290,500 290,500 Subscription or purchase*
Total 768,057 1,079,950 1,848,007
Exercisable options Non-exercisable options Total options outstanding
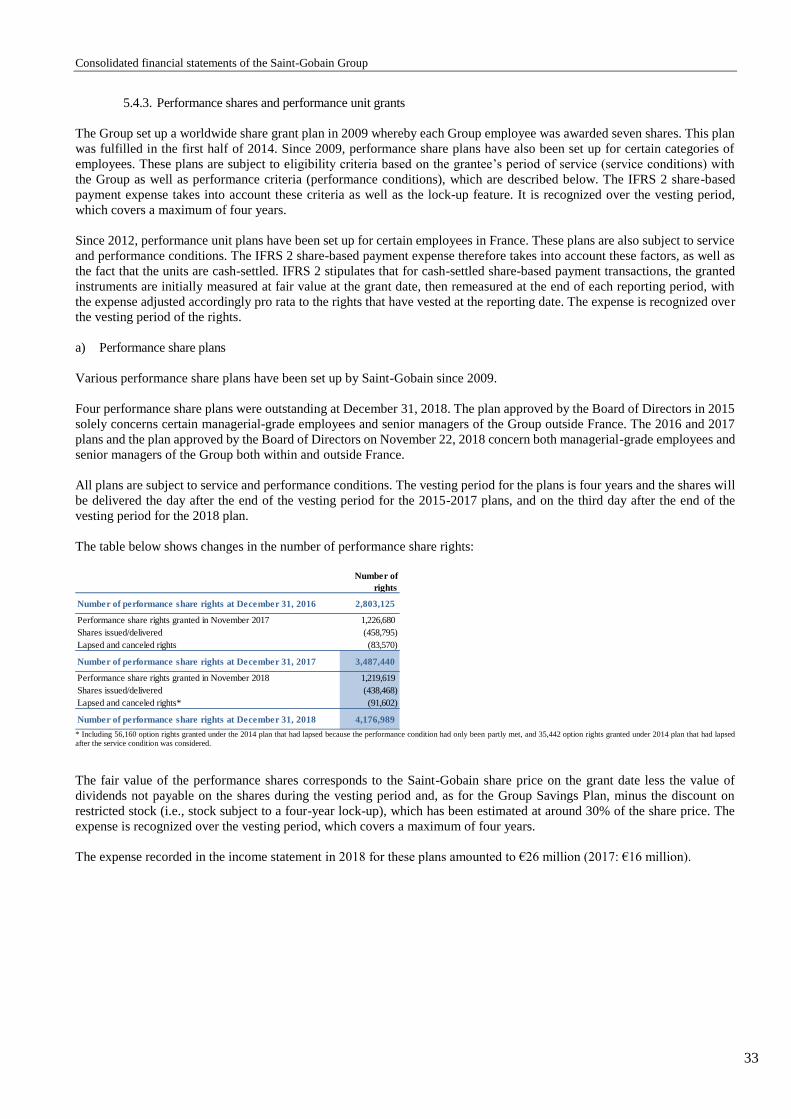
Consolidated financial statements of the Saint-Gobain Group
33
5.4.3. Performance shares and performance unit grants
The Group set up a worldwide share grant plan in 2009 whereby each Group employee was awarded seven shares. This plan
was fulfilled in the first half of 2014. Since 2009, performance share plans have also been set up for certain categories of
employees. These plans are subject to eligibility criteria based on the grantee’s period of service (service conditions) with
the Group as well as performance criteria (performance conditions), which are described below. The IFRS 2 share-based
payment expense takes into account these criteria as well as the lock-up feature. It is recognized over the vesting period,
which covers a maximum of four years.
Since 2012, performance unit plans have been set up for certain employees in France. These plans are also subject to service
and performance conditions. The IFRS 2 share-based payment expense therefore takes into account these factors, as well as
the fact that the units are cash-settled. IFRS 2 stipulates that for cash-settled share-based payment transactions, the granted
instruments are initially measured at fair value at the grant date, then remeasured at the end of each reporting period, with
the expense adjusted accordingly pro rata to the rights that have vested at the reporting date. The expense is recognized over
the vesting period of the rights.
a) Performance share plans
Various performance share plans have been set up by Saint-Gobain since 2009.
Four performance share plans were outstanding at December 31, 2018. The plan approved by the Board of Directors in 2015
solely concerns certain managerial-grade employees and senior managers of the Group outside France. The 2016 and 2017
plans and the plan approved by the Board of Directors on November 22, 2018 concern both managerial-grade employees and
senior managers of the Group both within and outside France.
All plans are subject to service and performance conditions. The vesting period for the plans is four years and the shares will
be delivered the day after the end of the vesting period for the 2015-2017 plans, and on the third day after the end of the
vesting period for the 2018 plan.
The table below shows changes in the number of performance share rights:
* Including 56,160 option rights granted under the 2014 plan that had lapsed because the performance condition had only been partly met, and 35,442 option rights granted under 2014 plan that had lapsed
after the service condition was considered.
The fair value of the performance shares corresponds to the Saint-Gobain share price on the grant date less the value of
dividends not payable on the shares during the vesting period and, as for the Group Savings Plan, minus the discount on
restricted stock (i.e., stock subject to a four-year lock-up), which has been estimated at around 30% of the share price. The
expense is recognized over the vesting period, which covers a maximum of four years.
The expense recorded in the income statement in 2018 for these plans amounted to €26 million (2017: €16 million).
Number of
rights
Number of performance share rights at December 31, 2016 2,803,125
Performance share rights granted in November 2017 1,226,680
Shares issued/delivered (458,795)
Lapsed and canceled rights (83,570)
Number of performance share rights at December 31, 2017 3,487,440
Performance share rights granted in November 2018 1,219,619
Shares issued/delivered (438,468)
Lapsed and canceled rights* (91,602)
Number of performance share rights at December 31, 2018 4,176,989
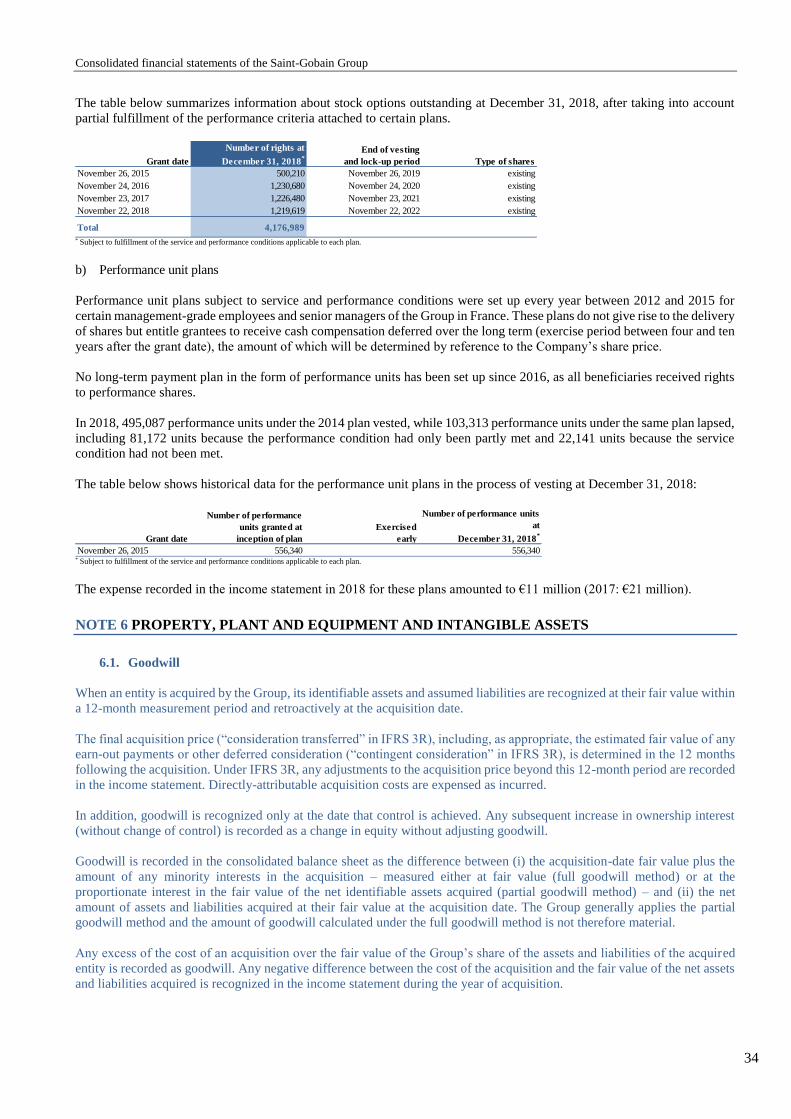
Consolidated financial statements of the Saint-Gobain Group
34
The table below summarizes information about stock options outstanding at December 31, 2018, after taking into account
partial fulfillment of the performance criteria attached to certain plans.
* Subject to fulfillment of the service and performance conditions applicable to each plan.
b) Performance unit plans
Performance unit plans subject to service and performance conditions were set up every year between 2012 and 2015 for
certain management-grade employees and senior managers of the Group in France. These plans do not give rise to the delivery
of shares but entitle grantees to receive cash compensation deferred over the long term (exercise period between four and ten
years after the grant date), the amount of which will be determined by reference to the Company’s share price.
No long-term payment plan in the form of performance units has been set up since 2016, as all beneficiaries received rights
to performance shares.
In 2018, 495,087 performance units under the 2014 plan vested, while 103,313 performance units under the same plan lapsed,
including 81,172 units because the performance condition had only been partly met and 22,141 units because the service
condition had not been met.
The table below shows historical data for the performance unit plans in the process of vesting at December 31, 2018:
* Subject to fulfillment of the service and performance conditions applicable to each plan.
The expense recorded in the income statement in 2018 for these plans amounted to €11 million (2017: €21 million).
NOTE 6 PROPERTY, PLANT AND EQUIPMENT AND INTANGIBLE ASSETS
6.1. Goodwill
When an entity is acquired by the Group, its identifiable assets and assumed liabilities are recognized at their fair value within
a 12-month measurement period and retroactively at the acquisition date.
The final acquisition price (“consideration transferred” in IFRS 3R), including, as appropriate, the estimated fair value of any
earn-out payments or other deferred consideration (“contingent consideration” in IFRS 3R), is determined in the 12 months
following the acquisition. Under IFRS 3R, any adjustments to the acquisition price beyond this 12-month period are recorded
in the income statement. Directly-attributable acquisition costs are expensed as incurred.
In addition, goodwill is recognized only at the date that control is achieved. Any subsequent increase in ownership interest
(without change of control) is recorded as a change in equity without adjusting goodwill.
Goodwill is recorded in the consolidated balance sheet as the difference between (i) the acquisition-date fair value plus the
amount of any minority interests in the acquisition – measured either at fair value (full goodwill method) or at the
proportionate interest in the fair value of the net identifiable assets acquired (partial goodwill method) – and (ii) the net
amount of assets and liabilities acquired at their fair value at the acquisition date. The Group generally applies the partial
goodwill method and the amount of goodwill calculated under the full goodwill method is not therefore material.
Any excess of the cost of an acquisition over the fair value of the Group’s share of the assets and liabilities of the acquired
entity is recorded as goodwill. Any negative difference between the cost of the acquisition and the fair value of the net assets
and liabilities acquired is recognized in the income statement during the year of acquisition.
Grant date
Number of rights at
December 31, 2018*
End of vesting
and lock-up period Type of shares
November 26, 2015 500,210 November 26, 2019 existing
November 24, 2016 1,230,680 November 24, 2020 existing
November 23, 2017 1,226,480 November 23, 2021 existing
November 22, 2018 1,219,619 November 22, 2022 existing
Total 4,176,989
Grant date
Number of performance
units granted at
inception of plan
Exercised
early
Number of performance units
at
December 31, 2018*
November 26, 2015 556,340 556,340

Consolidated financial statements of the Saint-Gobain Group
35
Changes in goodwill in 2018 and 2017 are detailed below:
In 2018, changes in Group structure relate mainly to newly consolidated companies in all sectors (see section 2.2.1).
Impairment recognized in 2018 is detailed in Note 6.5.3. The 2018 currency translation adjustments primarily reflect the
impacts of fluctuations in the US dollar, Brazilian real, pound sterling, Argentine peso and Turkish lira.
In 2017, changes in Group structure related mainly to newly consolidated companies in the Construction Products Sector
representing €474 million. Impairment tests performed in 2017 led to the recognition of goodwill impairment, primarily in
the Flat Glass business in the United States and the United Kingdom. Currency translation adjustments primarily reflected
the impacts of fluctuations in the US dollar, pound sterling, Norwegian krone and Brazilian real.
The net value of goodwill by sector and by business can be analyzed as follows:
Goodwill is essentially allocated to the Construction Products Sector, mainly Gypsum (€3,304 million at December 31, 2018)
and Industrial Mortars (€2,077 million at December 31, 2018), and to the Building Distribution Sector, primarily in France
and Scandinavia.
6.2. Other intangible assets
Other intangible assets primarily include patents, brands, software and development costs. They are measured at historical
cost less accumulated amortization and impairment.
Acquired retail brands and certain manufacturing brands are treated as intangible assets with indefinite useful lives as they
have a strong national and/or international reputation. These brands are not amortized but are tested systematically for
impairment on an annual basis. Other brands are amortized over their useful lives, not exceeding 40 years.
Costs incurred to develop software in-house – primarily configuration, programming and testing costs – are recognized as
intangible assets. Patents and purchased computer software are amortized over their estimated useful lives, not exceeding
20 years for patents and three to five years for software.
Research costs are expensed as incurred. Development costs meeting the recognition criteria under IAS 38 are included in
intangible assets and amortized over their estimated useful lives (not exceeding five years) from the date when the products
to which they relate are first marketed.
(in € millions) 2018 2017
At January 1
Gross value 12,023 12,160
Accumulated impairment (1,448) (1,491)
Net value 10,575 10,669
Changes during the year
Impairment (1,116) (70)
Translation adjustments 30 (497)
Restatement for hyperinflation in Argentina 27 0
Changes in Group structure 476 473
Assets held for sale (4) 0
Total changes (587) (94)
At December 31
Gross value 12,394 12,023
Accumulated impairment (2,406) (1,448)
Net value 9,988 10,575
(in € millions) Dec. 31, 2018 Dec. 31, 2017
Flat Glass 201 189
High-Performance Materials 1,826 1,602
Construction Products 5,986 6,014
Building Distribution 1,975 2,770
Total 9,988 10,575
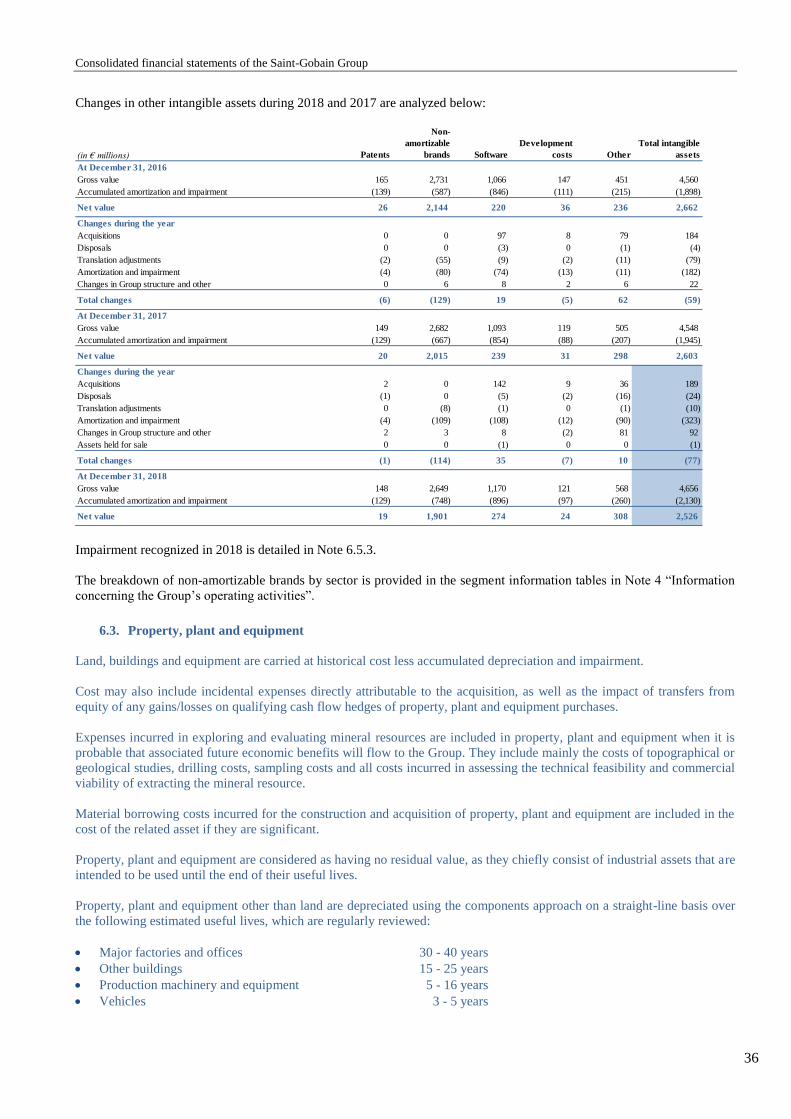
Consolidated financial statements of the Saint-Gobain Group
36
Changes in other intangible assets during 2018 and 2017 are analyzed below:
Impairment recognized in 2018 is detailed in Note 6.5.3.
The breakdown of non-amortizable brands by sector is provided in the segment information tables in Note 4 “Information
concerning the Group’s operating activities”.
6.3. Property, plant and equipment
Land, buildings and equipment are carried at historical cost less accumulated depreciation and impairment.
Cost may also include incidental expenses directly attributable to the acquisition, as well as the impact of transfers from
equity of any gains/losses on qualifying cash flow hedges of property, plant and equipment purchases.
Expenses incurred in exploring and evaluating mineral resources are included in property, plant and equipment when it is
probable that associated future economic benefits will flow to the Group. They include mainly the costs of topographical or
geological studies, drilling costs, sampling costs and all costs incurred in assessing the technical feasibility and commercial
viability of extracting the mineral resource.
Material borrowing costs incurred for the construction and acquisition of property, plant and equipment are included in the
cost of the related asset if they are significant.
Property, plant and equipment are considered as having no residual value, as they chiefly consist of industrial assets that are
intended to be used until the end of their useful lives.
Property, plant and equipment other than land are depreciated using the components approach on a straight-line basis over
the following estimated useful lives, which are regularly reviewed:
Major factories and offices 30 - 40 years
Other buildings 15 - 25 years
Production machinery and equipment 5 - 16 years
Vehicles 3 - 5 years
(in € millions) Patents
Non-
amortizable
brands Software
Development
costs Other
Total intangible
assets
At December 31, 2016
Gross value 165 2,731 1,066 147 451 4,560
Accumulated amortization and impairment (139) (587) (846) (111) (215) (1,898)
Net value 26 2,144 220 36 236 2,662
Changes during the year
Acquisitions 0 0 97 8 79 184
Disposals 0 0 (3) 0 (1) (4)
Translation adjustments (2) (55) (9) (2) (11) (79)
Amortization and impairment (4) (80) (74) (13) (11) (182)
Changes in Group structure and other 0 6 8 2 6 22
Total changes (6) (129) 19 (5) 62 (59)
At December 31, 2017
Gross value 149 2,682 1,093 119 505 4,548
Accumulated amortization and impairment (129) (667) (854) (88) (207) (1,945)
Net value 20 2,015 239 31 298 2,603
Changes during the year
Acquisitions 2 0 142 9 36 189
Disposals (1) 0 (5) (2) (16) (24)
Translation adjustments 0 (8) (1) 0 (1) (10)
Amortization and impairment (4) (109) (108) (12) (90) (323)
Changes in Group structure and other 2 3 8 (2) 81 92
Assets held for sale 0 0 (1) 0 0 (1)
Total changes (1) (114) 35 (7) 10 (77)
At December 31, 2018
Gross value 148 2,649 1,170 121 568 4,656
Accumulated amortization and impairment (129) (748) (896) (97) (260) (2,130)
Net value 19 1,901 274 24 308 2,526

Consolidated financial statements of the Saint-Gobain Group
37
Furniture, fixtures, office and computer equipment 4 - 16 years
Gypsum quarries are depreciated over their estimated useful lives, based on the quantity of gypsum extracted during the year
compared with extraction capacity.
Provisions for site restoration are recognized as components of assets whenever the Group has a legal or constructive
obligation to restore a site in accordance with contractually determined conditions or in the event of a sudden deterioration
in site conditions. These provisions are reviewed periodically and may be discounted over the expected useful lives of the
assets concerned. The component is depreciated over the same useful life as that used for mines and quarries.
Government grants for purchases of property, plant and equipment are recorded under “Other payables” and taken to the
income statement over the estimated useful lives of the relevant assets.

Consolidated financial statements of the Saint-Gobain Group
38
Changes in property, plant and equipment in 2018 and 2017 are analyzed below:
In 2018, “Changes in Group structure and other” related mainly to newly consolidated companies in the Construction
Products and Innovative Materials Sectors and to deconsolidated items in the Construction Products Sector, mainly assets
belonging to entities operating at the PAM Xuzhou plant (see Note 2). Impairment recognized in 2018 is detailed in Note
6.5.3.
6.4. Finance leases and operating leases
Assets held under finance leases that transfer to the Group substantially all of the risks and rewards of ownership are
recognized as property, plant and equipment (land, buildings and equipment). They are recorded at the inception of the lease
term at the lower of the fair value of the leased assets and the present value of the minimum lease payments.
Property, plant and equipment acquired under finance leases are depreciated on a straight-line basis over the shorter of the
estimated useful life of the asset – determined using the same criteria as for assets owned by the Group – or the lease term.
The corresponding liability is shown in the balance sheet net of related interest.
Rental payments under operating leases are expensed as incurred.
In 2018, other changes in property, plant and equipment include an amount of €24 million (2017: €15 million) relating to
assets acquired under new finance leases not included in the cash flow statement in accordance with IAS 7. At
December 31, 2018, total property, plant and equipment acquired under finance leases amounted to €99 million
(December 31, 2017: €83 million).
(in € millions)
Land and
quarries Buildings
Machinery
and
equipment
Assets under
construction
Total property,
plant and
equipment
At December 31, 2016
Gross value 2,510 8,607 19,744 1,067 31,928
Accumulated depreciation and impairment (560) (5,068) (14,596) (50) (20,274)
Net value 1,950 3,539 5,148 1,017 11,654
Changes during the year
Acquisitions 15 68 269 1,186 1,538
Disposals (31) (18) (31) (17) (97)
Translation adjustments (67) (158) (251) (64) (540)
Depreciation and impairment (33) (263) (883) (11) (1,190)
Transfers 0 213 687 (900) 0
Changes in Group structure and other 43 61 53 68 225
Total changes (73) (97) (156) 262 (64)
At December 31, 2017
Gross value 2,454 8,558 19,575 1,335 31,922
Accumulated depreciation and impairment (577) (5,116) (14,583) (56) (20,332)
Net value 1,877 3,442 4,992 1,279 11,590
Changes during the year
Acquisitions 12 72 286 1,296 1,666
Disposals (29) (13) (25) (7) (74)
Translation adjustments 2 (32) (43) (10) (83)
Restatement for hyperinflation in Argentina 2 12 13 4 31
Depreciation and impairment (145) (500) (1,083) (38) (1,766)
Transfers 0 255 862 (1,117) 0
Changes in Group structure and other 71 (13) 73 (4) 127
Assets held for sale (56) (26) (45) (29) (156)
Total changes (143) (245) 38 95 (255)
At December 31, 2018
Gross value 2,463 8,331 19,802 1,421 32,017
Accumulated depreciation and impairment (729) (5,134) (14,772) (47) (20,682)
Net value 1,734 3,197 5,030 1,374 11,335
Consolidated financial statements of the Saint-Gobain Group
39
6.5. Impairment review
6.5.1. Impairment of property, plant and equipment, intangible assets and goodwill
Property, plant and equipment, goodwill and other intangible assets are tested for impairment on a regular basis. These tests
consist of comparing the asset’s carrying amount to its recoverable amount. The recoverable amount is the higher of the
asset’s fair value less costs to sell and its value in use, calculated by reference to the net present value of the future cash flows
expected to be derived from the asset.
For property, plant and equipment and amortizable intangible assets, an impairment test is performed whenever revenues
from the asset decline or the asset generates operating losses due to either internal or external factors, and no material
improvement is forecast in the annual budget or the relevant business plan.
For goodwill and other intangible assets (including brands with indefinite useful lives), an impairment test is performed at
least annually based on the business plan. Goodwill is reviewed systematically and exhaustively at the level of each cash-
generating unit (CGU). The Group’s reporting segments are its business sectors, which may each include several CGUs. A
CGU is a reporting sub-segment, generally defined as a core business of the segment in a given geographic area. It typically
reflects the level at which the Group organizes its businesses and analyzes its results for internal reporting purposes.
The number of CGUs in both 2018 and 2017 was 30. Since the Building Distribution business in Germany is classified as
held for sale (see section 2.3), the assets and liabilities relating to the Building Distribution CGU in Germany are carried at
the lower of their fair value less costs to sell and their carrying amount.
The method used for these impairment tests is consistent with that employed by the Group for the valuation of companies
acquired in business combinations or acquisitions of equity interests. The carrying amount of the CGUs is compared to their
value in use, corresponding to the net present value of future cash flows excluding interest but including tax. It is determined
using assumptions made by senior management based on estimates and judgments including future changes in net sales,
profitability, investments and other cash flows arising from the use of the corresponding assets, as well as the discount rate
applied to future cash flows. Cash flows for the last year of the business plan are rolled forward over the following two years.
For impairment tests of goodwill, normative cash flows (corresponding to cash flows at the mid-point in the business cycle)
are then projected to perpetuity using a low annual growth rate (generally 1.5%, except for emerging markets or businesses
with a high organic growth potential where a 2% rate is used). Growth data are supported by external data issued by prominent
organizations. In light of continued falling interest rates on the Group’s borrowings, the discount rate was reduced to 6.85%
in 2018 from 7.25% in 2017 and 2016. This rate corresponds to the Group’s average cost of capital, plus a country risk
premium where applicable depending on the geographic area concerned. The discount rates applied in 2018 were 6.85% for
Western Europe and North America, 7.85% for Eastern Europe and emerging Asia-Pacific and 8.75% for South America,
Russia and the Middle East.
The recoverable amount calculated using a post-tax discount rate gives the same result as a pre-tax rate applied to pre-tax
cash flows.
6.5.2. CGU impairment tests
When the annual impairment test reveals that the recoverable amount of an asset is less than its carrying amount, an
impairment loss is recorded.
Impairment losses on goodwill can never be reversed through income. For property, plant and equipment and other intangible
assets, an impairment loss recognized in prior periods may be reversed, taking into account depreciation/amortization
adjustments, if there is an indication that the impairment no longer exists and that the recoverable amount of the asset
concerned exceeds its carrying amount.
During the impairment tests, different assumptions measuring the method’s sensitivity are systematically tested using the
following inputs:
0.5-point increase or decrease in the discount rate applied to cash flows;
0.5-point increase or decrease in the annual average rate of growth in cash flows projected to perpetuity;
1-point decrease in the operating income rate for industrial activities and 0.5-point decrease for distribution activities.

Consolidated financial statements of the Saint-Gobain Group
40
At December 31, 2018, a 0.5-point increase in the discount rate for all CGUs would have led to approximately €147 million
in additional impairment of non-current assets, while a 0.5-point decrease in the average annual cash flow growth rate
projected to perpetuity for all CGUs would have resulted in additional non-current asset impairment of around €115 million.
The impact of a 1-point decrease in the operating income rate for all industrial CGUs would have generated additional non-
current asset impairment of roughly €105 million, while a 0.5-point decrease in the rate for distribution activities would have
generated additional impairment of €223 million. The sensitivity for the Building Distribution Sector takes into account a no-
deal Brexit risk assumption at the reporting date.
6.5.3. Impairment recognized in the year
The Group reviewed its impairment tests in light of the current situation and the downward revision to the outlook for certain
business and countries.
With the United Kingdom facing uncertainty due to Brexit in a more competitive environment which is weighing on margins,
the Group recognized a €750 million impairment loss against goodwill relating to the Building Distribution business.
In the first half of 2018, impairment totaling €223 million was recognized in respect of the Pipe business. Following the
closure of the PAM Xuzhou plant in China, the Group conducted impairment tests on assets allocated to the Pipe CGU,
leading it to recognize impairment of €130 million against the corresponding goodwill. In the second half of 2018, Saint-
Gobain completed the sale of the entities operating at the PAM Xuzhou plant and continued to restructure the Pipe business,
recognizing additional impairment against the corresponding assets. Annual impairment totaled €511 million, including
€224 million charged against goodwill.
Lapeyre continued to roll out restructuring measures, and an impairment loss was recognized against its assets in an amount
of €372 million, including €131 million in respect of other intangible assets.
The value of the Building Distribution business in Germany was adjusted in the context of its sale (see section 2.3) in an
amount of €212 million, including €130 million relating to goodwill.
The breakdown of asset impairment by sector for 2018 and 2017 is provided in the segment information tables in Note 4
“Information concerning the Group’s operating activities”.
(in € millions)
0.5% increase in the
discount rate
0.5% decrease in the
growth rate
1 point decrease in
the operating income
rate
0.5 point decrease in the
operating income rate
Flat Glass (2)
High-Performance Materials
Construction Products (31) (24) (103)
Building Distribution (116) (91) (223)
Total (147) (115) (105) (223)
Impact of

Consolidated financial statements of the Saint-Gobain Group
41
NOTE 7 INVESTMENTS IN EQUITY-ACCOUNTED COMPANIES AND OTHER NON-CURRENT
ASSETS
A joint venture is a joint arrangement whereby the parties have joint control of the arrangement and decisions about the
relevant activities require the unanimous consent of the parties sharing control. The parties that have joint control of the
arrangement have rights to the net assets of the arrangement. By contrast, an associate is an entity over which a partner has
significant influence over the power to participate in decisions, but not control.
Under IAS 28, investments in both associates and joint ventures must be recognized using the same equity-accounting
consolidation method.
7.1. Changes in investments in equity-accounted companies
Changes in investments in equity-accounted companies in 2018 and 2017 can be analyzed as follows:
(in € millions) Dec. 31, 2018 Dec. 31, 2017
At January 1
Group share in:
Associates 173 181
Joint ventures 187 183
Total 360 364
Goodwill 19 12
Investments in equity-accounted companies 379 376
Changes during the year
Group share in net income of:
Associates 11 3
Joint ventures 19 30
Total 30 33
Dividends paid (11) (20)
Translation adjustments (2) (18)
Transfers, share issues and other movements 16 6
Changes in Group structure 0 2
Total changes 33 3
At December 31
Group share in:
Associates 185 173
Joint ventures 207 187
Total 392 360
Goodwill 20 19
Investments in equity-accounted companies 412 379
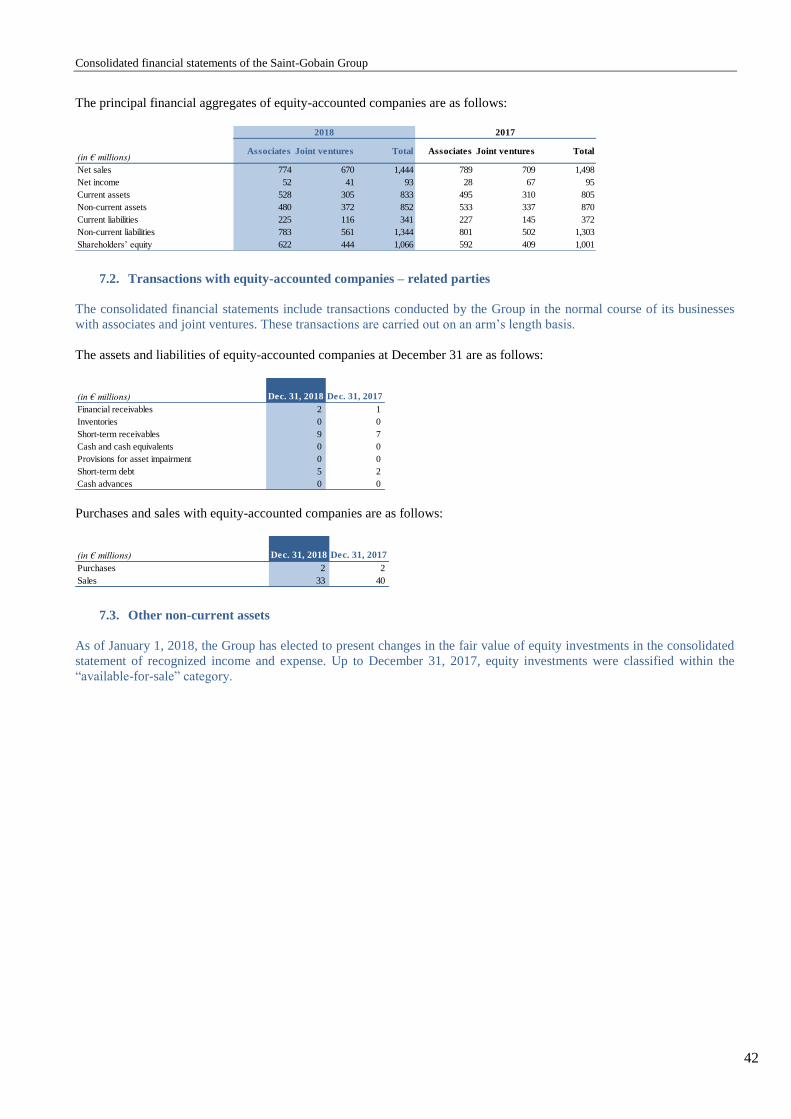
Consolidated financial statements of the Saint-Gobain Group
42
The principal financial aggregates of equity-accounted companies are as follows:
7.2. Transactions with equity-accounted companies – related parties
The consolidated financial statements include transactions conducted by the Group in the normal course of its businesses
with associates and joint ventures. These transactions are carried out on an arm’s length basis.
The assets and liabilities of equity-accounted companies at December 31 are as follows:
Purchases and sales with equity-accounted companies are as follows:
7.3. Other non-current assets
As of January 1, 2018, the Group has elected to present changes in the fair value of equity investments in the consolidated
statement of recognized income and expense. Up to December 31, 2017, equity investments were classified within the
“available-for-sale” category.
(in € millions)Associates Joint ventures Total Associates Joint ventures Total
Net sales 774 670 1,444 789 709 1,498
Net income 52 41 93 28 67 95
Current assets 528 305 833 495 310 805
Non-current assets 480 372 852 533 337 870
Current liabilities 225 116 341 227 145 372
Non-current liabilities 783 561 1,344 801 502 1,303
Shareholders’ equity 622 444 1,066 592 409 1,001
2018 2017
(in € millions) Dec. 31, 2018 Dec. 31, 2017
Financial receivables 2 1
Inventories 0 0
Short-term receivables 9 7
Cash and cash equivalents 0 0
Provisions for asset impairment 0 0
Short-term debt 5 2
Cash advances 0 0
(in € millions) Dec. 31, 2018 Dec. 31, 2017
Purchases 2 2
Sales 33 40
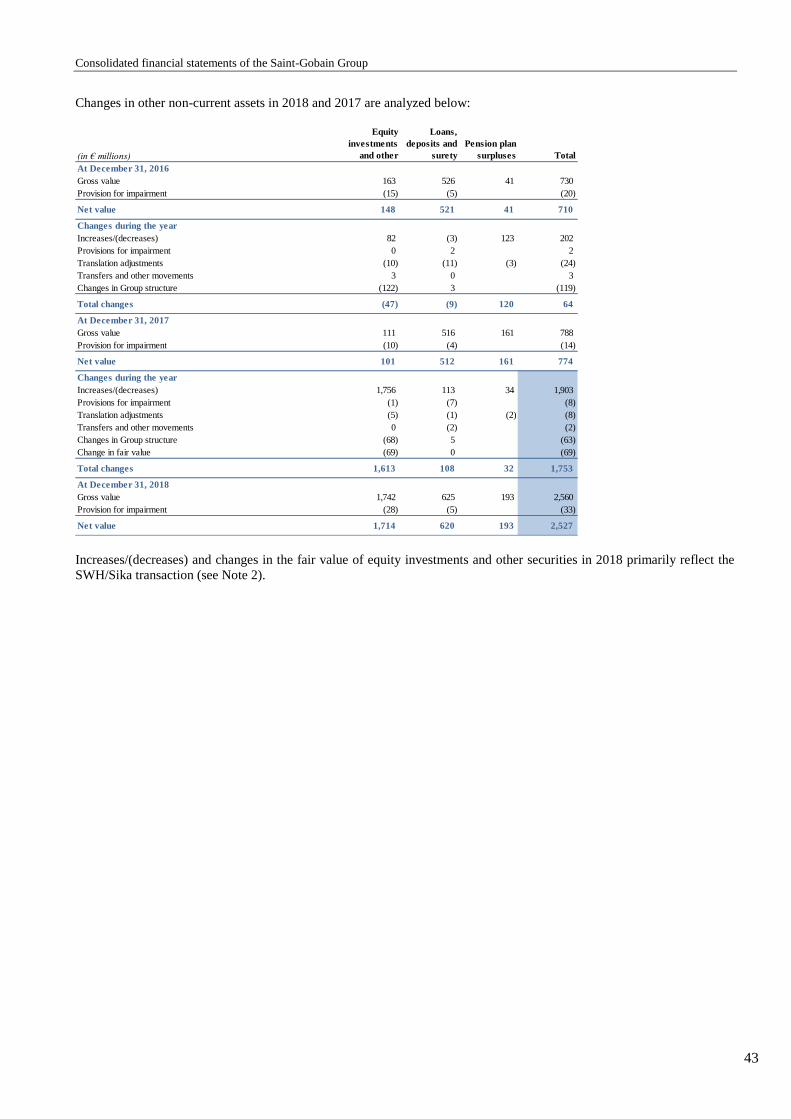
Consolidated financial statements of the Saint-Gobain Group
43
Changes in other non-current assets in 2018 and 2017 are analyzed below:
Increases/(decreases) and changes in the fair value of equity investments and other securities in 2018 primarily reflect the
SWH/Sika transaction (see Note 2).
(in € millions)
Equity
investments
and other
Loans,
deposits and
surety
Pension plan
surpluses Total
At December 31, 2016
Gross value 163 526 41 730
Provision for impairment (15) (5) (20)
Net value 148 521 41 710
Changes during the year
Increases/(decreases) 82 (3) 123 202
Provisions for impairment 0 2 2
Translation adjustments (10) (11) (3) (24)
Transfers and other movements 3 0 3
Changes in Group structure (122) 3 (119)
Total changes (47) (9) 120 64
At December 31, 2017
Gross value 111 516 161 788
Provision for impairment (10) (4) (14)
Net value 101 512 161 774
Changes during the year
Increases/(decreases) 1,756 113 34 1,903
Provisions for impairment (1) (7) (8)
Translation adjustments (5) (1) (2) (8)
Transfers and other movements 0 (2) (2)
Changes in Group structure (68) 5 (63)
Change in fair value (69) 0 (69)
Total changes 1,613 108 32 1,753
At December 31, 2018
Gross value 1,742 625 193 2,560
Provision for impairment (28) (5) (33)
Net value 1,714 620 193 2,527

Consolidated financial statements of the Saint-Gobain Group
44
NOTE 8 OTHER CURRENT AND NON-CURRENT LIABILITIES AND PROVISIONS,
CONTINGENT LIABILITIES AND LITIGATION
A provision is booked when (i) the Group has a present legal or constructive obligation towards a third party as a result of a
past event, (ii) it is probable that an outflow of resources will be required to settle the obligation, and (iii) the amount of the
obligation can be estimated reliably.
If the amount or due date of the obligation cannot be estimated reliably, it is classified as a contingent liability and reported
as an off-balance sheet commitment.
Provisions for other material liabilities and charges whose timing can be estimated reliably are discounted to present value.
8.1. Provisions for other liabilities and charges
The table below provides a breakdown by type along with details of changes in other provisions and current and non-current
liabilities:
8.1.1. Provisions for claims and litigation
At December 31, 2018 and 2017, provisions for claims and litigation mainly covered asbestos- and PFOA-related lawsuits
filed against the Group. These provisions are described in further detail in Note 8.2 “Contingent liabilities and litigation” .
8.1.2. Provisions for environmental risks
These provisions cover costs relating to environmental protection measures, as well as site rehabilitation and clean-up costs.
8.1.3. Provisions for restructuring costs
Provisions for restructuring costs amounted to €137 million at December 31, 2018 (December 31, 2017: €79 million),
including net additions of €141 million during the year.
8.1.4. Provisions for personnel expenses
These provisions primarily cover indemnities due to employees that are unrelated to the Group’s reorganization plans.
(in € millions)
Provisions
for claims and
litigation
Provisions for
environmental
risks
Provisions for
restructuring
costs
Provisions
for personnel
expenses
Provisions
for customer
warranties
Provisions
for other
contingencies
Total
provisions for
other
liabilities
Investment-
related
liabilities Total
At December 31, 2016
Current portion 125 36 52 29 122 60 424 12 436
Non-current portion 475 122 47 76 111 221 1,052 190 1,242
Total provisions for other liabilities and investment-related
liabilities600 158 99 105 233 281 1,476 202 1,678
Movements during the year
Additions 155 12 49 62 64 73 415 415
Reversals (3) (3) (9) (13) (23) (25) (76) (76)
Utilizations (135) (12) (58) (34) (54) (99) (392) (392)
Changes in Group structure 2 1 3 6 12 12
Other movements (reclassifications and translation adjustments) (71) (1) (4) (6) (25) (1) (108) (64) (172)
Total movements (54) (4) (20) 10 (35) (46) (149) (64) (213)
At December 31, 2017
Current portion 137 30 38 21 102 71 399 13 412
Non-current portion 409 124 41 94 96 164 928 125 1,053
Total provisions for other liabilities and investment-related
liabilities546 154 79 115 198 235 1,327 138 1,465
Movements during the year
Additions 122 10 150 35 71 51 439 439
Reversals (3) (2) (9) (14) (23) (53) (104) (104)
Utilizations (126) (13) (47) (31) (54) (49) (320) (320)
Changes in Group structure 2 (32) 1 (29) (29)
Other movements (reclassifications and translation adjustments) 25 (4) (2) 2 (6) 15 35 50
Total movements 18 (3) 58 (12) (4) (56) 1 35 36
At December 31, 2018
Current portion 127 27 106 19 102 73 454 11 465
Non-current portion 437 124 31 84 92 106 874 162 1,036
Total provisions for other liabilities and investment-related
liabilities564 151 137 103 194 179 1,328 173 1,501

Consolidated financial statements of the Saint-Gobain Group
45
8.1.5. Provisions for customer warranties
These provisions cover the Group’s commitments under warranties granted to customers mainly in the United States. They
are determined on a statistical basis using a range of criteria and take into account contractual warranty payments made in
prior years in the business and region concerned. In addition, specific provisions may be set aside for identified risks.
8.1.6. Provisions for other contingencies
At December 31, 2018, provisions for other contingencies amounted to €179 million (December 31, 2017: €235 million) and
mainly concerned the United States (€39 million), Brazil (€34 million), Germany (€33 million), France (€29 million) and
Italy (€13 million).
8.1.7. Investment-related liabilities
Investment-related liabilities correspond to commitments to purchase minority interests, liabilities relating to the acquisition
of shares in Group companies, and minority shareholder puts.
In 2018, changes in investment-related liabilities primarily concerned minority shareholder puts.
8.2. Contingent liabilities and litigation
8.2.1. Asbestos-related litigation
Current legal actions related to asbestos are described below.
8.2.1.1. Asbestos-related litigation in France
a) Inexcusable fault lawsuits
In France, seven further individual lawsuits were filed in 2018 by former employees (or persons claiming through them) of
Everite and Saint-Gobain PAM – which in the past had carried out fiber-cement operations – for asbestos-related occupational
diseases that affect or have affected them. As of December 31, 2018, a total of 822 such lawsuits had been issued against the
two companies since 1996 with the aim of obtaining supplementary compensation over and above the amounts paid by the
French Social Security authorities in this respect.
As of December 31, 2018, 789 of these 822 lawsuits had been completed in terms of both liability and quantum. In all these
cases, the employers were held liable on the grounds of “inexcusable fault”.
Compensation paid by Everite and Saint-Gobain PAM in settlement of these lawsuits totaled approximately €4.6 million.
Concerning the 33 lawsuits outstanding against Everite and Saint-Gobain PAM at December 31, 2018, five have been
completed in terms of both liability and quantum, but are still pending on the determination of who will pay the compensation
due.
Out of the 28 remaining lawsuits, at December 31, 2018 the procedures relating to the merits of 24 cases were at different
stages, with three in the process of being investigated by the French Social Security authorities and 21 pending before the
Social Security or Appeal Courts. The last four actions have been canceled but the plaintiffs may request their restoration at
any time within a two-year period following their cancellation.
In addition, as of December 31, 2018, 237 similar suits had been filed since the outset of the litigation by current or former
employees, or persons claiming through them, of 13 French companies of the Group (excluding suits against companies that
are no longer part of the Group), in particular by current or former employees who used equipment containing asbestos to
protect themselves against heat from furnaces.
As of December 31, 2018, 211 lawsuits had been completed. In 129 of these cases, the employer was held liable for
“inexcusable fault”.
At the same date, compensation paid by these companies totaled approximately €7.0 million.

Consolidated financial statements of the Saint-Gobain Group
46
As regards the 26 suits outstanding at December 31, 2018, two cases were still being investigated by the French Social
Security authorities and 23 were being tried – including 20 pending before the Social Security Courts and three before the
Appeal Courts. Lastly, for one lawsuit, a decision has been rendered on the finding of liability but is still pending regarding
the determination of who will pay the compensation due.
b) Anxiety claims
Eight of the Group’s French subsidiaries, including six that operate or have operated facilities in France classified as
containing asbestos, are the subject of damages claims that are different from those described above.
“Facilities classified as containing asbestos” are defined as industrial facilities that have been closed or are still operating,
which previously manufactured materials containing asbestos or used protection and insulation equipment containing
asbestos and that are included by ministerial decree on the official list of facilities whose current or former employees are
entitled to the early-retirement benefit paid to asbestos workers (ACAATA).
As of December 31, 2018, a total of 822 suits had been brought by current or former employees claiming compensation for
prejudice of anxiety suffered as a result of their alleged exposure to asbestos. None of these plaintiffs were suffering from an
asbestos-related disease and some of them were not receiving the ACAATA benefit. Of these 822 lawsuits, 720 have been
finally disposed of, representing total amount of compensation of €7.6 million at December 31, 2018. The remaining
102 lawsuits are pending before the competent labor tribunals.
It should be clarified that the above figures do not take into account suits filed against companies that are no longer part of
the Group.
8.2.1.2. Asbestos-related litigation in the United States
In the United States, several companies that once manufactured products containing asbestos such as asbestos-cement pipes,
roofing products, specialized insulation or gaskets, are facing legal action from persons other than their employees or former
employees. These claims for compensatory – and in some cases punitive – damages are based on alleged exposure to these
products, although in many instances the claimants cannot demonstrate any specific exposure to one or more products, or
any specific illness or physical disability. The vast majority of these claims are made simultaneously against many other non-
Group entities that have been manufacturers, distributors, installers or users of products containing asbestos.
a) Developments in 2018
Approximately 2,600 new asbestos-related claims were filed against CertainTeed in the United States in 2018 (compared to
3,100 new claims in 2017). The number of new claims is significantly down on the past few years.
Virtually all lawsuits involving CertainTeed have either been settled out of court or dismissed. Around 4,300 of the pending
claims were settled in 2018, compared to 3,900 in 2017 and 3,700 in 2016. Taking into account the number of claims
outstanding at the end of 2017 (34,300), new claims arising during the year and settled claims, some 32,600 claims remain
outstanding at December 31, 2018. A large number of these pending claims were filed more than five years ago by individuals
who have been unable to demonstrate any significant asbestos-related impairment, and it is likely that many of these claims
will ultimately be dismissed.
b) Impact on the Group’s financial statements
The Group recorded a USD 106 million charge in 2018 to cover future developments in relation to claims. This amount is
stable compared to the amount recorded in 2017 and 2016. At December 31, 2018, the Group’s provision for asbestos-related
litigation against CertainTeed in the United States amounts to USD 568 million (compared to USD 555 million at
December 31, 2017 and USD 562 million at December 31, 2016).
c) Cash flow impact
Compensation paid in respect of these claims against CertainTeed (including claims settled prior to 2018 but only paid out
in 2018 as well as claims fully settled and paid out in 2018), as well as compensation paid in 2018 by other Group businesses
in the United States in connection with asbestos litigation, amounted to USD 67 million (compared to USD 76 million in
2017 and USD 97 million in 2016).

Consolidated financial statements of the Saint-Gobain Group
47
8.2.1.3. Situation in Brazil
In Brazil, former employees of Brasilit suffering from asbestos-related occupational illnesses are offered, depending on the
case, either financial compensation alone or lifetime medical assistance combined with financial compensation. Around
1,200 contractual instruments have accordingly been signed to date.
Two class actions were initiated against Brasilit in 2017 by two associations defending former employees exposed to asbestos
at the São Caetano (São Paulo state) and Recife (Pernambouc state) plants, asking for their medical assistance and
compensation to be revised. These suits are currently at a very early stage.
Brasilit is subject to controls by the Ministry of Labor and continues to comply with all of its legal obligations with regard to
medical assistance for its current and former employees.
In November 2017, the Supreme Court of Brazil decided to ban asbestos definitively across the country. Brasilit stopped
using asbestos voluntarily as early as 2002.
8.2.2. Anti-trust law and related proceedings
8.2.2.1. Investigation by the Swiss Competition Commission in the sanitary products wholesale industry
In November 2011, the Swiss Competition Commission (Commission Suisse de la Concurrence) opened an investigation
into anti-competitive practices in the sanitary products wholesale industry. In May 2014, the Commission Secretariat issued
a notice of complaints against Sanitas Troesch and other wholesalers in the industry alleging that Sanitas Troesch and some
of its competitors had, among other things, agreed in 2005 and 2012 to lower gross prices.
The total fine imposed on all companies involved is CHF 80 million. For Sanitas Troesch, the fine is CHF 28.5 million.
Sanitas Troesch appealed this decision on May 2, 2016 and continues to firmly refute the claims made. However, a provision
for claims and litigation was recognized at December 31, 2015 in an amount equivalent to the fine (unchanged at
December 31, 2018).
8.2.2.2. Investigation by the French Competition Authority in the building insulation products industry
On August 6, 2014, the French Competition Authority sent a statement of objections to Saint-Gobain Isover and Compagnie
de Saint-Gobain (as parent company of the Saint-Gobain Group). A hearing took place on May 11, 2016, whereupon the
Competition Authority sent the case back for further investigation in light of the arguments put forward by Saint-Gobain
Isover and Compagnie de Saint-Gobain. In October 2018, Saint-Gobain Isover and Compagnie de Saint-Gobain received a
second statement of objections, in which the Competition Authority alleges anti-competitive practices in the building
insulation products market, between 2001 and 2013.
Saint-Gobain Isover and Compagnie de Saint-Gobain reject the allegations.
On the civil law front, Actis served in March 2013 a damages claim on Saint-Gobain Isover, the Centre Scientifique et
Technique du Bâtiment, and the FILMM before the Paris Civil Court (Tribunal de grande instance) based on the facts being
investigated by the Competition Authority. In an order dated December 16, 2014, the pre-trial judge declared a stay of
proceedings while waiting for the decision from the Competition Authority.
8.2.2.3. Investigation by the Anti-trust Division of the United States Department of Justice in the United States
drywall industry
In July 2015, the Anti-trust Division of the United States Department of Justice opened a criminal investigation into potential
anti-competitive practices, specifically a price agreement, in the United States drywall industry. This investigation followed
complaints filed in late 2012 in the form of class actions in the civil courts against eight drywall manufacturers in the sector,
including CertainTeed, by some of their customers.
On the basis of testimony and documents submitted in the civil proceedings, CertainTeed and its attorneys have not identified
any element that might create liability for CertainTeed, and as a result filed a motion for summary judgment in May 2015 in
order to end the civil proceedings. This application was accepted on February 18, 2016 by the competent court.
In autumn 2018, the lawsuit was terminated: no liability was assigned to CertainTeed and no fine was levied.

Consolidated financial statements of the Saint-Gobain Group
48
8.2.3. Environmental disputes
8.2.3.1. PFOA matters in the United States
Levels of PFOA (perfluorooctanoic acid) in excess of U.S. Environmental Protection Agency (EPA) or state health advisories
have been found in municipal water systems and private wells near current Saint-Gobain Performance Plastics (SG PPL)
facilities in Hoosick Falls (New York) and Merrimack (New Hampshire), and two former facilities in North Bennington
(Vermont) in the United States. PFOA and PTFE (polytetrafluorethylene) have never been manufactured by these plants.
SG PPL is a processor of PTFE which it purchases from third party suppliers and which in the past contained traces of PFOA.
SG PPL has voluntarily provided bottled water in all three communities, installed point-of-entry treatment systems to
residents and businesses in the Hoosick Falls and North Bennington areas, installed carbon filtration systems on the municipal
water supply in Hoosick Falls and agreed to fund the installation of a carbon filtration system on the Merrimack Valley
District’s municipal water supply. In addition, it has voluntarily funded both completed and on-going construction of water
line extensions in certain communities in the Merrimack and Bennington areas. The investigations are on-going and the scope
of responsibility for SG PPL arising from environmental remediation and clean-up obligations at these sites has not yet been
established. Without admitting liability, SG PPL has signed consent orders with the environmental regulators in New York
in 2016, in Vermont in 2017, and in New Hampshire in 2018, pursuant to which SG PPL has agreed to complete
investigations, implement interim or final remediation measures at its current and former facilities and in the case of Vermont
and New Hampshire, fund construction of water lines. Responsibility, if any, is expected to be shared with other parties as
regards in particular the Hoosick Falls site.
PFOA-related lawsuits alleging both health-related and economic damages claims have been filed in civil courts in New
York, New Hampshire and Vermont, some of which are in the form of proposed class actions. It is difficult to predict the
timing or outcome of any such litigation, or whether any additional litigation will be brought against SG PPL.
On December 31, 2018, the provision recorded by the Company in respect of this matter amounts to €30 million.
8.2.4. Other contingent liabilities
8.2.4.1. Grenfell Tower fire in the United Kingdom
Celotex provides insulation materials for specific applications for the building and construction industry.
Insulation materials from two Celotex ranges were purchased via distributors and used in refurbishing Grenfell Tower,
London in 2015/2016, including as one component of the rainscreen cladding system designed and installed (by third parties)
on the tower’s external facade.
Following the Grenfell Tower fire on 14 June 2017, a Public Inquiry is underway, which will consider, among other things,
the modifications made to the building as part of the refurbishment, the role played by the various construction professionals,
and the information provided by the manufacturers of the products used. A criminal investigation into the circumstances of
the fire is also in progress.
There are a large number of issues and circumstances that need to be explored and the implications for Celotex are unlikely
to be known for some time.
The extent to which Celotex may incur civil or criminal liability in connection with the production, marketing, supply or use
of its products is currently unclear.
8.2.5. Other proceedings and disputes
Some of the Group’s companies may also be the subject of other claims made by their employees or by the tax authorities.
Apart from the proceedings and litigation described above, to the best of the Company’s knowledge no other government,
court or arbitration proceedings exist (including pending proceedings or proceedings where the Company and/or the Group
might be threatened) which could have or have had, in the last 12 months, a significant impact on the financial position or
profitability of the Company and/or Group.

Consolidated financial statements of the Saint-Gobain Group
49
NOTE 9 FINANCING AND FINANCIAL INSTRUMENTS
9.1. Risk factors: financial risks
9.1.1. Liquidity risk
9.1.1.1. Liquidity risk on financing
In a crisis environment, the Group might be unable to raise the financing or refinancing needed to cover its investment plans
on the credit or capital markets, or to obtain such financing or refinancing on acceptable terms.
The Group’s overall exposure to liquidity risk on its net debt is managed by the Treasury and Financing Department of
Compagnie de Saint-Gobain, the Group’s parent company. The subsidiaries generally enter into short- or long-term financing
arrangements with Compagnie de Saint-Gobain or with the regional cash pools.
The Group’s policy is to ensure that the Group’s financing will be rolled over at maturity and to optimize borrowing costs.
Long-term debt therefore systematically represents a high percentage of overall debt. At the same time, the maturity schedules
of long-term debt are set in such a way that replacement capital market issues are spread over time.
The Group’s main source of long-term financing is bonds, which are generally issued under the Medium Term Notes program.
Saint-Gobain also uses perpetual bonds, participating securities, a long-term securitization program, bank borrowings and
lease financing.
Short-term debt comprises borrowings under Negotiable European Commercial Paper (NEU CP), and occasionally Euro
Commercial Paper and US Commercial Paper, but also includes receivables securitization programs and bank financing.
Financial assets comprise marketable securities and cash and cash equivalents.
Compagnie de Saint-Gobain’s liquidity position is secured by confirmed syndicated lines of credit.
A breakdown of long- and short-term debt by type and maturity is provided in Note 9.3, which also details the main
characteristics of the Group’s financing programs and confirmed credit lines.
Saint-Gobain’s long-term debt issues have been rated BBB with a stable outlook by Standard & Poor’s since
December 9, 2014.
Saint-Gobain’s long-term debt issues have been rated Baa2 with a stable outlook by Moody’s since December 9, 2014.
There is no guarantee that the Company will be in a position to maintain its credit risk ratings at current levels. Any
deterioration in the Group’s credit risk rating could limit its capacity to raise funds and could lead to higher rates of interest
on future borrowings.
9.1.1.2. Liquidity risk on investments
Short-term investments consist of bank deposits and mutual fund units. To reduce liquidity and high volatility risks, whenever
possible, the Group invests in money market and/or bond funds.
9.1.2. Financial counterparty credit risk
The Group is exposed to the risk of default by the financial institutions that manage its cash or other financial instruments,
since such default could lead to losses for the Group.
The Group limits its exposure to risk of default by its counterparties by dealing solely with reputable financial institutions
and regularly monitoring their credit ratings. However, the credit quality of a financial counterparty can change rapidly, and
a high credit rating cannot eliminate the risk of a rapid deterioration of its financial position. As a result, the Group’s policy
in relation to the selection and monitoring of its counterparties is unable to entirely eliminate exposure to a risk of default.

Consolidated financial statements of the Saint-Gobain Group
50
To limit the Group’s exposure to credit risk, the Treasury and Financing Department deals primarily with counterparties with
a long-term rating of A- or above from Standard & Poor’s or A3 or above from Moody’s. Concentrations of credit risk are
also closely monitored to ensure that they remain at reasonable levels, taking into account the relative CDS (“Credit Default
Swap”) level of each counterparty.
9.1.3. Market risk
9.1.3.1. Energy and commodity risk
The Group is exposed to changes in the price of the energy it consumes and the raw materials used in its activities. Its energy
and commodity hedging programs may be insufficient to protect the Group against significant or unforeseen price swings
that could result from the prevailing financial and economic environment.
The Group may limit its exposure to energy price fluctuations by using swaps and options to hedge part of its fuel oil, natural
gas and electricity purchases. The swaps and options are mainly contracted in the functional currency of the entities
concerned. Hedges of fuel oil, gas and electricity purchases are contracted in accordance with the Group’s purchasing policy.
These hedges (excluding fixed-price purchases negotiated directly with suppliers by the Purchasing Department) are
generally arranged by the Group Treasury and Financing Department (or with regional treasury departments) in accordance
with instructions received from the Purchasing Department.
From time to time, the Group may enter into contracts to hedge purchases of certain commodities, in accordance with the
same principles as those outlined above for energy purchases.
Note 9.4 provides a breakdown of instruments used to hedge energy and commodity risks.
9.1.3.2. Interest rate risk
The Group’s overall exposure to interest rate risk on consolidated debt is managed by the Treasury and Financing Department
of Compagnie de Saint-Gobain. Where subsidiaries use derivatives to hedge interest rate risks, their counterparty is generally
Compagnie de Saint-Gobain, the Group’s parent company.
The Group’s policy is aimed at fixing the cost of its medium-term debt against interest rate risk and optimizing borrowing
costs. According to Group policy, the derivative financial instruments used to hedge these risks can include interest rate
swaps, cross-currency swaps, options – including caps, floors and swaptions – and forward rate agreements.
The table below shows the sensitivity at December 31, 2018 of pre-tax income and pre-tax equity to fluctuations in the interest
rate on the Group’s net debt after hedging:
Note 9.4 to the consolidated financial statements provides a breakdown of interest rate risk hedging instruments and of gross
debt by type of interest (fixed or variable) after hedging.
(in € millions)
Impact on
pre-tax
income
Impact on
pre-tax
equity
Interest rate increase of 50 basis points 4 12
Interest rate decrease of 50 basis points (4) (12)

Consolidated financial statements of the Saint-Gobain Group
51
9.1.3.3. Foreign exchange risk
The currency hedging policies described below could be insufficient to protect the Group against unexpected or sharper than
expected fluctuations in exchange rates resulting from economic and financial market conditions.
Foreign exchange risks are managed by hedging virtually all transactions entered into by Group entities in currencies other
than the functional currency of the particular entity. Compagnie de Saint-Gobain and its subsidiaries may use forward
contracts and options to hedge exposures arising from current and forecast transactions.
The subsidiaries set up contracts generally through the Group’s parent company, Compagnie de Saint-Gobain, which then
carries out the corresponding forex hedging transaction, or through the regional cash pools. Failing this, contracts are taken
out with one of the subsidiary’s banks.
Most forward contracts have short maturities of around three months. However, forward contracts taken out to hedge firm
orders may have longer terms.
The Group monitors its exposure to foreign exchange risk using a monthly reporting system that captures the foreign
exchange positions taken by its subsidiaries. At December 31, 2018, 97% of the Group’s foreign exchange exposure eligible
for hedging was hedged.
The residual net foreign exchange exposure of subsidiaries for the currencies presented below was as follows at
December 31, 2018:
The table below gives an analysis, as of December 31, 2018, of the sensitivity of the Group’s pre-tax income to a 10%
increase in the exchange rates of the following currencies given the subsidiaries’ residual net foreign exchange exposure:
Assuming that all other variables remained unchanged, a 10% fall in the exchange rates for these currencies at
December 31, 2018 would have the opposite impact.
Note 9.4 provides a breakdown of foreign exchange risk hedging instruments.
9.1.3.4. Saint-Gobain share price risk
The Group is exposed to changes in the Saint-Gobain share price as a result of its performance unit incentive plans. To reduce
its exposure to fluctuations in the share price, the Group uses hedging instruments such as equity swaps.
As a result, if the price of the Saint-Gobain share changes, any changes in the expense recorded in the income statement will
be fully offset by the hedges in place.
Note 9.4 provides a breakdown of these share price risk hedging instruments.
(in millions of € equivalent) Long Short
EUR 2 8
USD 13 7
Other currencies 0 5
Total 15 20
Currency of exposure
(in millions of € equivalent)
Impact on
pre-tax
income
EUR (0.6)
USD 0.6
Other currencies (0.5)
Total (0.5)

Consolidated financial statements of the Saint-Gobain Group
52
9.2. Net financial expense
Net financial expense includes borrowing and other financing costs, income from cash and cash equivalents, interest cost for
pensions and other post-employment benefit obligations, net of the return on plan assets, and other financial income and
expense such as exchange gains and losses and bank charges.
Net financial income/expense in 2018 and 2017 includes:
* Including €601 million relating to the SWH/Sika transaction.
9.3. Net debt
9.3.1. Long- and short-term debt
9.3.1.1. Long-term debt
Long-term debt includes bonds, perpetual bonds, participating securities, long-term securitizations and all other types of long-
term financial liabilities, including finance lease liabilities and the fair value of interest rate hedging derivatives.
Under IAS 32, the distinction between financial liabilities and equity is based on the substance of the contracts concerned
rather than their legal form. As a result, participating securities are classified as debt.
At the end of the reporting period, long-term debt (excluding interest rate derivatives) is measured at amortized cost.
Premiums and issuance costs are amortized using the effective interest method.
9.3.1.2. Short-term debt
Short-term debt includes the current portion of long-term debt described above, short-term financing programs such as
commercial paper, short-term securitizations, bank overdrafts and other short-term bank borrowings, the fair value of
derivatives related to debt, and accrued interest on borrowings.
Short-term debt, excluding derivatives related to debt, is measured at amortized cost at the end of the reporting period.
Premiums and issuance costs are amortized using the effective interest rate method.
9.3.1.3. Cash and cash equivalents
Cash and cash equivalents mainly consist of bank accounts and marketable securities that are short-term (i.e., generally with
maturities of less than three months), highly liquid investments readily convertible into known amounts of cash and subject
to an insignificant risk of changes in value.
Marketable securities are measured at fair value through profit or loss.
(in € millions) 2018 2017
Borrowing costs, gross (300) (298)
Income from cash and cash equivalents 22 23
Borrowing costs, net (278) (275)
Interest cost – pensions and other post-employment
benefit obligations(303) (327)
Return on plan assets 244 247
Interest cost – pension and other post-employment
benefit obligations, net(59) (80)
Other financial expense (107) (118)
Other financial income* 633 25
Other financial income and expense 526 (93)
Net financial expense 189 (448)
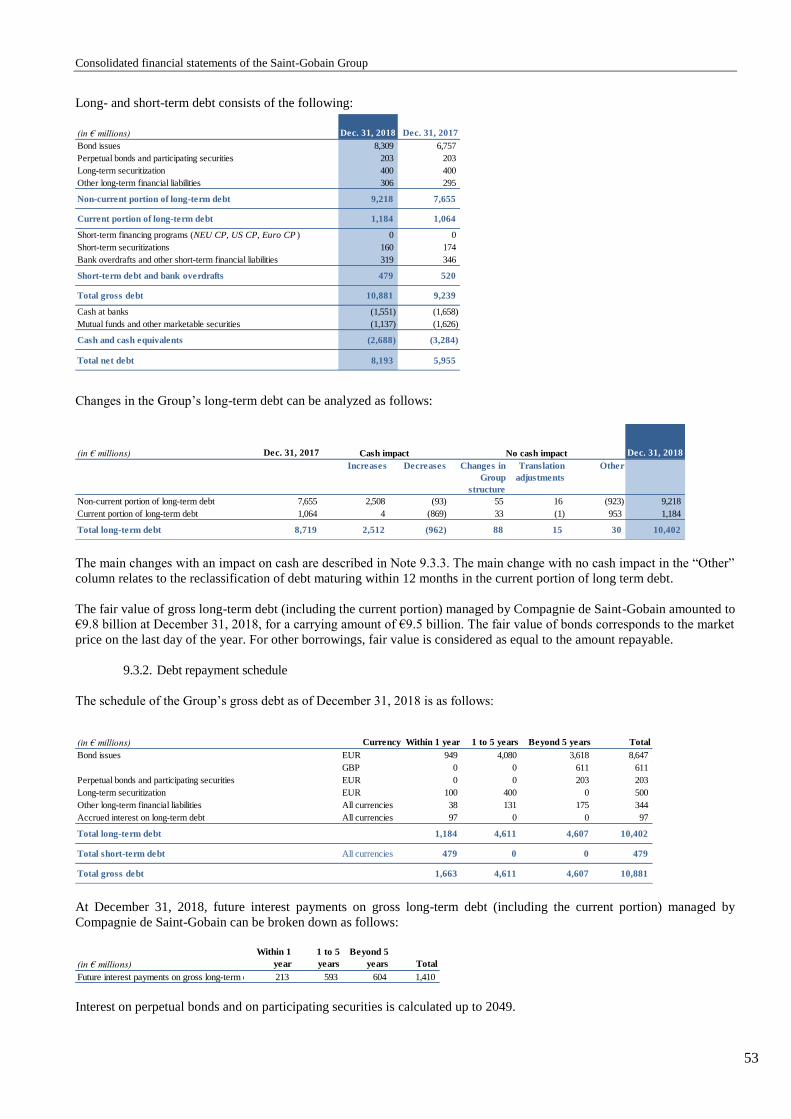
Consolidated financial statements of the Saint-Gobain Group
53
Long- and short-term debt consists of the following:
Changes in the Group’s long-term debt can be analyzed as follows:
The main changes with an impact on cash are described in Note 9.3.3. The main change with no cash impact in the “Other”
column relates to the reclassification of debt maturing within 12 months in the current portion of long term debt.
The fair value of gross long-term debt (including the current portion) managed by Compagnie de Saint-Gobain amounted to
€9.8 billion at December 31, 2018, for a carrying amount of €9.5 billion. The fair value of bonds corresponds to the market
price on the last day of the year. For other borrowings, fair value is considered as equal to the amount repayable.
9.3.2. Debt repayment schedule
The schedule of the Group’s gross debt as of December 31, 2018 is as follows:
At December 31, 2018, future interest payments on gross long-term debt (including the current portion) managed by
Compagnie de Saint-Gobain can be broken down as follows:
Interest on perpetual bonds and on participating securities is calculated up to 2049.
(in € millions) Dec. 31, 2018 Dec. 31, 2017
Bond issues 8,309 6,757
Perpetual bonds and participating securities 203 203
Long-term securitization 400 400
Other long-term financial liabilities 306 295
Non-current portion of long-term debt 9,218 7,655
Current portion of long-term debt 1,184 1,064
Short-term financing programs (NEU CP, US CP, Euro CP ) 0 0
Short-term securitizations 160 174
Bank overdrafts and other short-term financial liabilities 319 346
Short-term debt and bank overdrafts 479 520
Total gross debt 10,881 9,239
Cash at banks (1,551) (1,658)
Mutual funds and other marketable securities (1,137) (1,626)
Cash and cash equivalents (2,688) (3,284)
Total net debt 8,193 5,955
(in € millions) Dec. 31, 2017 Dec. 31, 2018
Increases Decreases Changes in
Group
structure
Translation
adjustments
Other
Non-current portion of long-term debt 7,655 2,508 (93) 55 16 (923) 9,218
Current portion of long-term debt 1,064 4 (869) 33 (1) 953 1,184
Total long-term debt 8,719 2,512 (962) 88 15 30 10,402
No cash impactCash impact
(in € millions) Currency Within 1 year 1 to 5 years Beyond 5 years Total
Bond issues EUR 949 4,080 3,618 8,647
GBP 0 0 611 611
Perpetual bonds and participating securities EUR 0 0 203 203
Long-term securitization EUR 100 400 0 500
Other long-term financial liabilities All currencies 38 131 175 344
Accrued interest on long-term debt All currencies 97 0 0 97
Total long-term debt 1,184 4,611 4,607 10,402
Total short-term debt All currencies 479 0 0 479
Total gross debt 1,663 4,611 4,607 10,881
(in € millions)
Within 1
year
1 to 5
years
Beyond 5
years Total
Future interest payments on gross long-term debt 213 593 604 1,410
Consolidated financial statements of the Saint-Gobain Group
54
9.3.3. Bonds
Compagnie de Saint-Gobain issued:
€750 million worth of 1.125% bonds on March 23, 2018, maturing on March 23, 2026;
a €20 million private placement on April 18, 2018, indexed to the 20-year CMS curve and maturing on April 18, 2033;
a €60 million private placement on May 25, 2018, indexed to the 20-year CMS curve and maturing on May 25, 2033,
the Group entered into swaps in order to fix the interest rate on these two private placements;
two floating-rate 3-month Euribor +0.23% private placements on June 25, 2018, maturing on June 25, 2020, amounting
to €180 million and €300 million, respectively;
€500 million worth of 0.875% bonds on September 21, 2018, maturing on September 21, 2023, and €500 million worth
of 1.875% bonds maturing on September 21, 2028. The nominal amount of the latter bond issue was increased to €700
million through two €100 million additions on October 11 and October 12, 2018, respectively.
These issues extended the average maturity of the Group's debt while also optimizing average borrowing costs.
Compagnie de Saint-Gobain also redeemed the following instruments at maturity:
NOK 750 million worth of 4% bonds on March 27, 2018;
€750 million worth of 4% bonds on October 8, 2018.
9.3.4. Perpetual bonds
In 1985, Compagnie de Saint-Gobain issued 25,000 perpetual bonds with a face value of ECU 5,000 (€5,000 today).
A total of 18,496 perpetual bonds have since been bought back and canceled, and 6,504 perpetual bonds were outstanding at
end-2018, representing a total face value of €33 million.
The bonds bear interest at a variable rate (average of interbank rates offered by the five reference banks for six-month euro
deposits). The amount paid out per bond in 2018 was zero.
The bonds are not redeemable and interest on the bonds is classified as a component of finance costs.
9.3.5. Participating securities
In June 1983, Compagnie de Saint-Gobain issued 1,288,299 non-voting participating securities with a face value of
FRF 1,000. Their face value is now €152.45, following their translation into euros in 1999.
A certain number of these participating securities have been bought back over the years. At December 31, 2018,
606,883 securities were still outstanding with an aggregate face value of €92.5 million.
Interest on the securities ranges from 75% to 125% of the average corporate bond yield (TMO), based on the Group’s
consolidated income. The amount paid out per security in 2018 was €2.
In April 1984, 194,633 non-voting participating securities were issued with a face value of ECU 1,000 (€1,000 today).
A certain number of these securities have been bought back over the years. At December 31, 2018, 77,516 securities were
still outstanding with an aggregate face value of €77.5 million.
Interest comprises (i) a fixed portion of 7.5% paid per year applicable to 60% of the nominal amount of the security, and
(ii) a variable portion applicable to the remaining 40% of the nominal amount of the participating security, which is linked
to consolidated net income of the previous year and to the reference six-month Libor EUR rate +7/8%. The amount paid per
security in 2018 was €66.33, paid in two installments (€32.80 and €33.53).
These participating securities are not redeemable and the interest paid on them is reported under borrowing costs.

Consolidated financial statements of the Saint-Gobain Group
55
9.3.6. Financing programs
The Group has a number of medium- and long-term financing programs (Medium-Term Notes) and short-term financing
programs (commercial paper).
At December 31, 2018, issuance under these programs was as follows:
* Equivalent of USD 1,000 million based on the exchange rate at December 31, 2018.
In accordance with market practices, Negotiable European Commercial Paper (NEU CP), US Commercial Paper and Euro
Commercial Paper are generally issued with maturities of one to six months. They are treated as variable-rate debt since they are
rolled over at frequent intervals.
9.3.7. Syndicated lines of credit
Compagnie de Saint-Gobain has two syndicated lines of credit that are intended to provide a secure source of financing for
the Group (including as additional backing for its NEU CP, US Commercial Paper and Euro Commercial Paper programs):
a €2.5 billion syndicated line of credit expiring in December 2022 with two one-year rollover options. The first option was
exercised, extending maturity until December 2023;
a second €1.5 billion syndicated line of credit also expiring in December 2022 with two one-year rollover options. The first
option was exercised, extending maturity until December 2023.
Based on the Group’s current credit rating for long-term debt issues, the two facilities are not subject to any hard covenants.
Neither of these two lines of credit had been drawn down at December 31, 2018.
9.3.8. Receivables securitization programs
The Group has set up two receivables securitization programs, one through its French subsidiary Point.P Finances GIE, and
the other through its US subsidiary, Saint-Gobain Receivables Corporation.
The €500 million French program was rolled over on November 10, 2016. It amounted to €500 million at both December 31,
2018 and December 31, 2017. Based on observed seasonal fluctuations in receivables included in the program and on the
contract’s features, €400 million of this amount was classified as non-current and the balance as current.
The US program was renewed on December 19, 2018 for a maximum amount of USD 400 million. Its euro-equivalent value
at December 31, 2018 was €160 million (December 31, 2017: €174 million).
9.3.9. Collateral
At December 31, 2018, €9 million of Group debt was secured by various non-current assets (real estate and securities).
(in € millions)
Authorized
drawings
Authorized
limits at Dec.
31, 2018
Balance
outstanding
at Dec. 31,
2018
Balance
outstanding
at Dec. 31,
2017
Medium Term Notes 15,000 9,435 7,776
NEU CP up to 12 months 3,000 0 0
US Commercial Paper up to 12 months 873 * 0 0
Euro Commercial Paper up to 12 months 873 * 0 0
Consolidated financial statements of the Saint-Gobain Group
56
9.4. Financial instruments
The Group uses interest rate, foreign exchange and commodity derivatives to hedge its exposure to changes in interest rates,
exchange rates and commodity prices that may arise in the normal course of business.
In accordance with IAS 32 and IFRS 9, all such instruments are recognized in the balance sheet and measured at fair value,
irrespective of whether or not they are part of a hedging relationship that qualifies for hedge accounting under IFRS 9.
Changes in fair value of both derivatives that are designated and qualified as fair value hedges and derivatives that do not
qualify for hedge accounting during the period are taken to the income statement (in business income and expense for
operational foreign exchange derivatives and commodity derivatives not qualifying for hedge accounting, and in net financial
income and expense for all other derivatives). However, in the case of derivatives that qualify as cash flow hedges, the
effective portion of the gain or loss arising from changes in fair value is recognized directly in equity, and only the ineffective
portion is recognized in the income statement.
a) Fair value hedges
Fair value hedge accounting is applied by the Group mainly for derivative instruments which swap fixed rates against variable
rates (fixed-for-floating interest rate swaps). These derivatives hedge fixed-rate debts exposed to a fair value risk. In
accordance with hedge accounting principles, debt included in a designated fair value hedging relationship is remeasured at
fair value and at the level of risk covered. As the loss or gain on the underlying hedged item offsets the effective portion of
the gain or loss on the fair value hedge, the income statement is only impacted by the ineffective portion of the hedge.
b) Cash flow hedges
Cash flow hedge accounting is applied by the Group mainly for derivative instruments which fix the cost of future investments
(financial assets or property, plant and equipment) and the price of future purchases, mostly gas and fuel oil (commodity
swaps) or foreign currencies (foreign exchange forwards). Transactions hedged by these instruments are qualified as highly
probable. The application of cash flow hedge accounting allows the Group to defer the impact on the income statement of
the effective portion of changes in the fair value of these derivatives by recording them in a hedging reserve in equity. This
reserve is reclassified to the income statement when the hedged transaction occurs and the hedged item itself affects income.
In the same way as for fair value hedges, cash flow hedging limits the Group’s exposure to changes in the fair value of these
derivatives to the ineffective portion of the hedge.
c) Derivatives that do not qualify for hedge accounting
Changes in the fair value of derivatives that do not qualify for hedge accounting are recognized in the income statement.
Instruments concerned are primarily foreign exchange swaps and foreign exchange forwards.
d) Fair value of financial instruments
The fair value of financial assets and financial liabilities corresponds to their quoted price on an active market (if any): this
represents level 1 in the fair value hierarchy defined in IFRS 7 and IFRS 13. The fair value of instruments not quoted in an
active market, such as derivatives or financial assets and liabilities, is determined by reference to commonly used valuation
techniques such as the fair value of another recent and similar transaction, or discounted cash flow analysis based on
observable market inputs. This represents level 2 in the fair value hierarchy defined in IFRS 7 and IFRS 13.
The fair value of short-term financial assets and liabilities is considered as being the same as their carrying amount due to
their short maturities.
Saint-Gobain has applied IFRS 9 in its entirety since January 1, 2018, including the standard’s hedge accounting
requirements. The Group’s risk management and hedging documentation strategies are compliant with IFRS 9. Given the
nature of the Group’s transactions, applying IFRS 9 has no impact on hedge accounting at the transition or reporting date.

Consolidated financial statements of the Saint-Gobain Group
57
The following table presents a breakdown of the principal derivatives used by the Group:
9.4.1. Currency instruments
a) Currency swaps
The Group uses currency swaps mainly to convert euro-denominated funds into foreign currencies for cash management purposes.
b) Forward foreign exchange contracts and currency options
Forward foreign exchange contracts and currency options are used to hedge foreign currency transactions, particularly commercial
transactions (purchases and sales) and investments.
9.4.2. Interest rate instruments
a) Interest rate swaps
The Group uses interest rate swaps to convert part of its fixed (variable) rate bank debt and bond debt to variable (fixed)
rates.
b) Cross-currency swaps
The Group uses cross-currency swaps to convert foreign currency debt (euro debt) into euro debt (foreign currency debt).
9.4.3. Energy and commodities
a) Energy and commodity swaps
Energy and commodity swaps are used to hedge the risk of changes in the price of certain purchases used in Group
subsidiaries’ operating activities, particularly energy (fuel oil, natural gas and electricity) purchases.
9.4.4. Other risks
a) Equity derivatives
Equity derivatives are used to hedge the risk of changes in the Saint-Gobain share price in connection with the performance
units long-term incentive plan.
(in € millions)
Derivatives
recorded in
assets
Derivatives
recorded in
liabilities
Dec. 31,
2018 Dec. 31, 2017 Within 1 year 1 to 5 years
Beyond 5
years
Dec. 31,
2018
Fair value hedges 0 0 0
Cash flow hedges
Currency 3 (1) 2 (17) 342 0 0 342
Interest rate 0 (85) (85) (71) 0 0 424 424
Energy and commodities 1 (8) (7) 4 54 11 0 65
Other risks: equities 0 (13) (13) 14 0 33 12 45
Cash flow hedges – total 4 (107) (103) (70) 396 44 436 876
Currency 3 (5) (2) 72 1,424 3 0 1,427
Interest rate 0 0 0 0 0 0 0 0
Energy and commodities 0 0 0 0 0 0 0 0
Derivatives not qualifying for hedge
accounting – total3 (5) (2) 72 1,424 3 0 1,427
Total 7 (112) (105) 2 1,820 47 436 2,303
Derivatives not qualifying for hedge accounting mainly contracted
by Compagnie de Saint-Gobain
Fair value Nominal amount by maturity

Consolidated financial statements of the Saint-Gobain Group
58
9.4.5. Credit value adjustments to derivative instruments
Credit value adjustments to derivative instruments are calculated in accordance with IFRS 13 based on historical probabilities
of default derived from calculations performed by a leading rating agency and on the estimated loss given default. At
December 31, 2018, credit value adjustments were not material.
9.4.6. Impact on equity of financial instruments qualifying for cash flow hedge accounting
At December 31, 2018, the cash flow hedging reserve carried in equity in accordance with IFRS had a debit balance of
€57 million, consisting mainly of:
a debit balance of €38 million in relation to cross-currency swaps designated as cash flow hedges that are used to convert
a GBP bond issue into euros;
a debit balance of €12 million corresponding to changes in the value of interest rate hedges classified as cash flow hedges;
a debit balance of €7 million corresponding to changes in the value of energy and raw materials hedges classified as cash
flow hedges.
The ineffective portion of cash flow hedging derivatives is not material.
9.4.7. Impact on income of financial instruments not qualifying for hedge accounting
The fair value of derivatives classified as “Financial assets and liabilities at fair value through profit or loss” represented a
loss of €2 million in 2018 compared to a gain of €2 million in 2017.
9.4.8. Embedded derivatives
The Saint-Gobain Group regularly analyzes its contracts in order to separately identify financial instruments classified as
embedded derivatives under IFRS.
At December 31, 2018, no embedded derivatives deemed to be material at Group level were identified.
9.4.9. Group debt structure
The weighted average interest rate on total gross debt under IFRS and after hedging (interest rate swaps, currency swaps and
cross-currency swaps) was 2.3% at December 31, 2018, compared with 2.8% at December 31, 2017.
The average internal rate of return on the Group’s main component of long-term debt item before hedging (bonds) was 2.4%
in 2018 compared to 3.2% in 2017.
The table below presents the breakdown by interest rate (fixed or variable) of the Group’s gross debt at December 31, 2018, taking
into account interest rate, currency and cross-currency swaps.
(in € millions)
Variable rate Fixed rate Total
EUR 1,478 8,550 10,028
Other currencies 320 343 663
Total 1,798 8,893 10,691
(in %) 17% 83% 100%
Accrued interest and other financial liabilities 190
Total gross debt 10,881
Gross debt after hedging
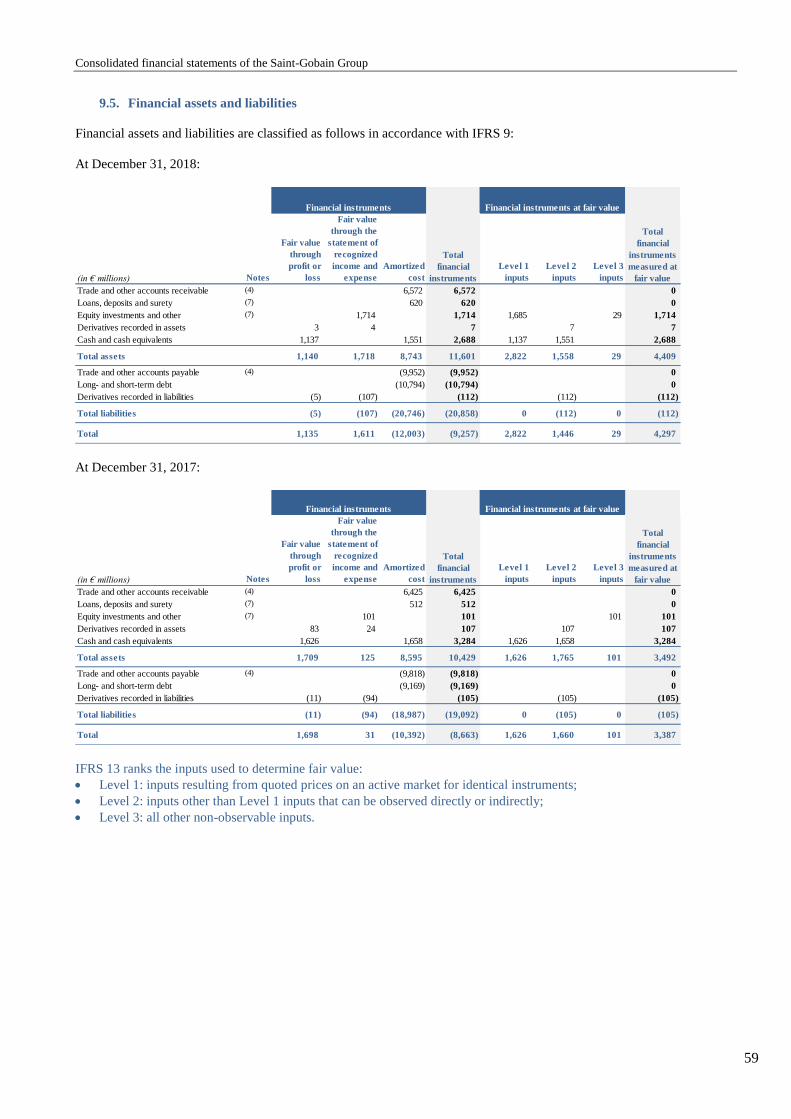
Consolidated financial statements of the Saint-Gobain Group
59
9.5. Financial assets and liabilities
Financial assets and liabilities are classified as follows in accordance with IFRS 9:
At December 31, 2018:
At December 31, 2017:
IFRS 13 ranks the inputs used to determine fair value:
Level 1: inputs resulting from quoted prices on an active market for identical instruments;
Level 2: inputs other than Level 1 inputs that can be observed directly or indirectly;
Level 3: all other non-observable inputs.
(in € millions) Notes
Fair value
through
profit or
loss
Fair value
through the
statement of
recognized
income and
expense
Amortized
cost
Level 1
inputs
Level 2
inputs
Level 3
inputs
Trade and other accounts receivable (4) 6,572 6,572 0
Loans, deposits and surety (7) 620 620 0
Equity investments and other (7) 1,714 1,714 1,685 29 1,714
Derivatives recorded in assets 3 4 7 7 7
Cash and cash equivalents 1,137 1,551 2,688 1,137 1,551 2,688
Total assets 1,140 1,718 8,743 11,601 2,822 1,558 29 4,409
Trade and other accounts payable (4) (9,952) (9,952) 0
Long- and short-term debt (10,794) (10,794) 0
Derivatives recorded in liabilities (5) (107) (112) (112) (112)
Total liabilities (5) (107) (20,746) (20,858) 0 (112) 0 (112)
Total 1,135 1,611 (12,003) (9,257) 2,822 1,446 29 4,297
Financial instruments
Total
financial
instruments
Financial instruments at fair value
Total
financial
instruments
measured at
fair value
(in € millions) Notes
Fair value
through
profit or
loss
Fair value
through the
statement of
recognized
income and
expense
Amortized
cost
Level 1
inputs
Level 2
inputs
Level 3
inputs
Trade and other accounts receivable (4) 6,425 6,425 0
Loans, deposits and surety (7) 512 512 0
Equity investments and other (7) 101 101 101 101
Derivatives recorded in assets 83 24 107 107 107
Cash and cash equivalents 1,626 1,658 3,284 1,626 1,658 3,284
Total assets 1,709 125 8,595 10,429 1,626 1,765 101 3,492
Trade and other accounts payable (4) (9,818) (9,818) 0
Long- and short-term debt (9,169) (9,169) 0
Derivatives recorded in liabilities (11) (94) (105) (105) (105)
Total liabilities (11) (94) (18,987) (19,092) 0 (105) 0 (105)
Total 1,698 31 (10,392) (8,663) 1,626 1,660 101 3,387
Financial instruments
Total
financial
instruments
Financial instruments at fair value
Total
financial
instruments
measured at
fair value

Consolidated financial statements of the Saint-Gobain Group
60
NOTE 10 SHAREHOLDERS’ EQUITY AND EARNINGS PER SHARE
10.1. Equity
10.1.1. Equity
As of December 31, 2018, the number of shares composing the capital stock of Saint-Gobain was 546,585,004 shares with a
par value of €4 (553,557,091 shares at December 31, 2017).
10.1.2. Additional paid-in capital and legal reserve
This item includes capital contributions in excess of the par value of capital stock as well as the legal reserve, which
corresponds to a cumulative portion of the yearly net income of Compagnie de Saint-Gobain.
10.1.3. Retained earnings and consolidated net income
Retained earnings and consolidated net income correspond to the Group’s share in the undistributed earnings of all
consolidated companies.
10.1.4. Treasury stock
Treasury stock is measured at cost and recorded as a deduction from equity. Gains and losses on disposals of treasury stock
are recognized directly in equity and have no impact on net income for the period.
Forward purchases of treasury stock are treated in the same way. When a fixed number of shares is purchased forward at a
fixed price, this amount is recorded in “Other liabilities” against a deduction from equity under “Retained earnings and net
income for the year”.
Saint-Gobain shares held or controlled by Compagnie de Saint-Gobain and Saint-Gobain Corporation are shown as a
deduction from equity under “Treasury stock” at acquisition cost.
The liquidity agreement signed with Exane BNP Paribas on November 16, 2007 and implemented on December 3, 2007 for
a period up to December 31, 2007 has been automatically renewed since that date.
At December 31, 2018, 2,705,737 shares were held in treasury stock (December 31, 2017: 2,771,372 shares). In 2018, the
Group acquired 14,050,245 shares (2017: 9,595,036 shares) directly on the market and sold 1,654,431 shares
(2017: 1,715,619 shares). Lastly, 12,461,449 shares were canceled in 2018 and 7,000,000 shares in 2017.
For the purposes of a compensation plan set up in January 2008 for certain employees in the United States, Compagnie de
Saint-Gobain shares are held by the trustee, Wachovia Bank, National Association. In the consolidated financial statements,
these shares are treated as being controlled by Saint-Gobain Corporation.
10.1.5. Dividends
The Annual Shareholders’ Meeting of June 7, 2018 approved the recommended dividend payout for 2017, representing €1.30
per share.
10.2. Earnings per share
10.2.1. Basic earnings per share
Basic earnings per share are calculated by dividing net income by the weighted average number of shares of the Group
outstanding during the period.

Consolidated financial statements of the Saint-Gobain Group
61
Basic earnings per share are as follows:
10.2.2. Diluted earnings per share
Diluted earnings per share are calculated by adjusting earnings per share and the average number of shares outstanding for
the effects of all potential dilutive common shares, such as stock options and performance shares.
Diluted earnings per share are as follows:
The weighted average number of shares assuming full dilution is calculated based on the weighted average number of shares
outstanding, assuming conversion of all dilutive instruments. The Group’s dilutive instruments include stock options and
performance share grants corresponding to a weighted average of 200,702 and 2,709,751 shares, respectively, at
December 31, 2018.
NOTE 11 TAX
11.1. Income taxes
Current income tax is the estimated amount of tax payable in respect of income for a given period, calculated by reference to
the tax rates that have been enacted or substantively enacted at the end of the reporting period, plus any adjustments to current
taxes recorded in previous financial periods.
Income tax expense breaks down as follows:
2018 2017
Group share of net income (in € millions) 420 1,566
Weighted average number of shares in issue 547,105,985 553,383,836
Basic earnings per share, Group share (in €) 0.77 2.83
2018 2017
Group share of net income (in € millions) 420 1,566
Weighted average number of shares assuming full dilution 550,016,438 556,655,598
Diluted earnings per share, Group share (in €) 0.76 2.81
(in € millions) 2018 2017
Current taxes (404) (445)
France (36) (18)
Outside France (368) (427)
Deferred taxes (86) 7
France 25 64
Outside France (111) (57)
Total income tax expense (490) (438)

Consolidated financial statements of the Saint-Gobain Group
62
Theoretical tax expense was reconciled with current tax expense using a tax rate of 34.43% in 2018 and 2017, and can be
analyzed as follows:
The contribution of countries with low tax rates explains the impact of the different tax rates applicable outside France. The
main contributors are the United States, India, Germany and the United Kingdom.
11.2. Deferred tax
Deferred taxes are recorded using the balance sheet method for temporary differences between the carrying amount of assets
and liabilities and their tax basis. Deferred tax assets and liabilities are measured at the tax rates expected to apply to the
period when the asset is realized or the liability settled, based on the tax laws that have been enacted or substantively enacted
at the end of the reporting period.
No deferred tax liability is recognized in respect of undistributed earnings of subsidiaries that are not intended to be
distributed.
For investments in subsidiaries, deferred tax is recognized on the difference between the consolidated carrying amount of the
investments and their tax basis when it is probable that the temporary difference will reverse in the foreseeable future.
Deferred taxes are recognized as income or expense in the income statement, unless they relate to items that are recognized
directly in equity, in which case the deferred tax is also recognized in equity. Income tax resulting from changes in tax rates
is recognized in income, except where it relates to items initially recognized in equity.
In the balance sheet, changes in the net deferred tax liability break down as follows:
* In 2018, the “Changes in Group structure and other” line mainly reflects the impact of applying IFRS 9 and IFRS 15 for €9 million.
(in € millions) 2018 2017
Net income 497 1,625
Less:
Share in net income of equity-accounted companies 30 33
Income taxes (490) (438)
Pre-tax income of consolidated companies 957 2,030
French tax rate 34.43% 34.43%
Theoretical tax expense at French tax rate (330) (699)
Impact of different tax rates 136 161
Asset impairment, capital gains and losses on asset disposals (297) (37)
Deferred tax assets not recognized (57) (10)
Liability method (7) 98
Research tax credit, tax credit for competitiveness and employment
(CICE) and value-added contribution for businesses (CVAE)6 9
Costs related to dividends (10) 31
Other taxes and provision writebacks 69 9
Total income tax expense (490) (438)
(in € millions)
Net deferred tax
asset/(liability)
At December 31, 2016 825
Deferred tax (expense)/benefit 7
Changes in deferred taxes relating to actuarial gains and losses (IAS 19) (89)
Liability method on actuarial gains and losses (252)
Translation adjustments (40)
Changes in Group structure and other 60
At December 31, 2017 511
Deferred tax (expense)/benefit (86)
Changes in deferred taxes relating to actuarial gains and losses (IAS 19) (69)
Liability method on actuarial gains and losses (1)
Translation adjustments 9
Assets and liabilities held for sale (20)
Changes in Group structure and other* 21
At December 31, 2018 365

Consolidated financial statements of the Saint-Gobain Group
63
The table below shows the main deferred tax components:
Deferred taxes are offset at the level of each tax entity, i.e., by tax group where applicable (mainly in France, the United
Kingdom, Spain, Germany, the United States and the Netherlands).
Deferred tax assets of €837 million were recognized at December 31, 2018 (€938 million at December 31, 2017), primarily
in France (€209 million), the United States (€197 million) and Germany (€153 million). Deferred tax liabilities of
€472 million were recognized at December 31, 2018 (€427 million at December 31, 2017), including €179 million in the
United Kingdom, €65 million in India, €58 million in Switzerland, and €42 million in Denmark. Deferred tax liabilities
recognized in other countries represented considerably smaller amounts.
11.3. Tax loss carry-forwards
Deferred tax assets are recognized only if it is considered probable that there will be sufficient future taxable income against
which the temporary difference can be utilized. They are reviewed at the end of each reporting period and written down to
the extent that it is no longer probable that there will be sufficient taxable income against which the temporary difference can
be utilized. In determining whether to recognize deferred tax assets for tax loss carry-forwards, the Group applies a range of
criteria that take into account the probable recovery period based on business plan projections and the strategy for the long-
term recovery of tax losses applied in each country.
The Group recognized deferred tax assets for tax loss carry-forwards for a net amount of €562 million at December 31, 2018
and €633 million at December 31, 2017. This principally relates to the United States, for which the recovery period is shorter
than the maximum utilization period of 20 years, and to France, Germany and Spain, where tax consolidation generally
ensures that deferred tax can be recovered. In these countries, tax losses may be carried forward indefinitely. Nevertheless,
after analyzing each situation, the Group may decide not to recognize them.
At December 31, 2018, deferred tax assets whose recovery is not considered probable totaled €451 million
(December 31, 2017: €330 million) and a provision had been accrued for the full amount. Unrecognized deferred tax assets
chiefly relate to France, China, Spain and the United States.
NOTE 12 SUBSEQUENT EVENTS
None.
NOTE 13 FEES PAID TO THE STATUTORY AUDITORS
Total fees paid to the Statutory Auditors and recognized in the income statement in 2018 and 2017 are detailed in the
“Additional information and cross-reference tables” section of the Registration Document.
(in € millions) Dec. 31, 2018 Dec. 31, 2017
Pensions 460 562
Brands (397) (425)
Depreciation and amortization, accelerated capital
allowances and tax-driven provisions(705) (711)
Tax loss carry-forwards 562 633
Other 445 452
Net deferred tax 365 511
Of which:
Deferred tax assets 837 938
Deferred tax liabilities (472) (427)

Consolidated financial statements of the Saint-Gobain Group
64
NOTE 14 PRINCIPAL CONSOLIDATED COMPANIES
The table below shows the Group’s principal consolidated companies, typically those with annual sales of over €100 million.
INNOVATIVE MATERIALS SECTOR
FLAT GLASS Country Consolidation methodPercentage held
directly and indirectly
Saint-Gobain Glass Deutschland GmbH, Stolberg* Germany Full consolidation 99.99%
Flachglas Torgau GmbH, Torgau* Germany Full consolidation 99.99%
Saint-Gobain Weisswasser GmbH, Aachen* Germany Full consolidation 99.99%
Saint-Gobain Deutsche Glas GmbH, Stolberg* Germany Full consolidation 99.99%
Glasverarbeitungs-Gesellschaft Bremen mbH, Bremen* Germany Full consolidation 99.99%
Saint-Gobain Glassolutions Nord GmbH, Melsdorf* Germany Full consolidation 99.99%
Saint-Gobain Glassolutions Süd GmbH, Tuttlingen* Germany Full consolidation 99.99%
Glas-Funke GmbH, Kall* Germany Full consolidation 99.99%
Glasverarbeitungs-Gesellschaft Deggendorf mbH, Deggendorf* Germany Full consolidation 99.99%
Vetrotech Saint-Gobain Kinon GmbH, Aachen* Germany Full consolidation 99.99%
Saint-Gobain Autoglas GmbH, Herzogenrath* Germany Full consolidation 99.99%
Saint-Gobain Sekurit Deutschland Beteiligungen GmbH, Herzogenrath* Germany Full consolidation 99.99%
Saint-Gobain Sekurit Deutschland GmbH & CO Kg, Herzogenrath* Germany Full consolidation 99.99%
FABA Autoglas Technik GmbH & Co. Betriebs-KG, Berlin* Germany Full consolidation 99.99%
Freeglass GmbH & Co. KG, Schwaikheim* Germany Full consolidation 99.99%
Saint-Gobain Autover Deutschland GmbH, Kerpen* Germany Full consolidation 99.99%
Freudenberger Autoglas GmbH, München* Germany Full consolidation 99.99%
Saint-Gobain Glassolutions Objekt-Center GmbH, Radeburg* Germany Full consolidation 99.99%
Saint-Gobain Construction Products Belgium Belgium Full consolidation 100.00%
Cebrace Cristal Plano Ltda Brazil Full consolidation 50.00%
Saint-Gobain Do Brasil Ltda Brazil Full consolidation 100.00%
SG Hanglas Sekurit (Shanghaï) Co., Ltd China Full consolidation 98.99%
Hankuk Glass Industries Inc. South Korea Full consolidation 97.98%
Hankuk Sekurit Limited South Korea Full consolidation 97.87%
Saint-Gobain Cristaleria S.L Spain Full consolidation 99.83%
Saint-Gobain Glass Solutions Menuisiers Industriels France Full consolidation 100.00%
Saint-Gobain Glass France France Full consolidation 100.00%
Saint-Gobain Sekurit France France Full consolidation 100.00%
Eurofloat France Full consolidation 100.00%
Saint-Gobain India Private Limited India Full consolidation 99.14%
Saint-Gobain Glass Italia S.p.a Italy Full consolidation 100.00%
Saint-Gobain Mexico Mexico Full consolidation 99.83%
Saint-Gobain Polska Sp Zoo Poland Full consolidation 99.90%
Saint-Gobain Innovative Materials Polska Sp Zoo Poland Full consolidation 99.85%
Saint-Gobain Sekurit CZ, Spol S.R.O Czech Republic Full consolidation 100.00%
Saint-Gobain Glass (United Kingdom) Limited United Kingdom Full consolidation 100.00%
Vetrotech Saint-Gobain International Switzerland Full consolidation 100.00%
Dec. 31, 2018

Consolidated financial statements of the Saint-Gobain Group
65
HIGH PERFORMANCE MATERIALS Country Consolidation methodPercentage held
directly and indirectly
Saint-Gobain Diamantwerkzeuge GmbH, Norderstedt* Germany Full consolidation 100.00%
Saint-Gobain Abrasives GmbH, Wesseling* Germany Full consolidation 100.00%
Supercut Europe GmbH, Baesweiler* Germany Full consolidation 100.00%
Ernst Winter & Sohn Norderstedt GmbH & Co. KG, Norderstedt* Germany Full consolidation 100.00%
Saint-Gobain Performance Plastics Isofluor GmbH, Neuss* Germany Full consolidation 100.00%
Saint-Gobain Performance Plastics MG Silikon GmbH, Lindau* Germany Full consolidation 100.00%
Saint-Gobain Performance Plastics Pampus GmbH, Willich* Germany Full consolidation 100.00%
Saint-Gobain Performance Plastics L+S GmbH, Wertheim* Germany Full consolidation 100.00%
Saint-Gobain Performance Plastics Biolink GmbH, Waakirchen* Germany Full consolidation 100.00%
Saint-Gobain Adfors Deutschland GmbH, Neustadt an der Donau* Germany Full consolidation 100.00%
H.K.O. Isolier- und Textiltechnik GmbH, Oberhausen* Germany Full consolidation 100.00%
BEUHKO Fasertechnik GmbH, Leinefelde-Worbis* Germany Full consolidation 100.00%
SEPR Keramik GmbH & Co. KG, Aachen* Germany Full consolidation 100.00%
Saint-Gobain Innovative Materials Belgium Belgium Full consolidation 100.00%
Saint-Gobain Do Brasil Ltda Brazil Full consolidation 100.00%
Saint-Gobain Performance Plastics (Shanghaï) Co., Ltd China Full consolidation 100.00%
Saint-Gobain Abrasives (Shanghaï) Co., Ltd China Full consolidation 100.00%
Saint-Gobain Adfors America, Inc. United States Full consolidation 100.00%
Saint-Gobain Performance Plastics Corporation United States Full consolidation 100.00%
Saint-Gobain Abrasives, Inc. United States Full consolidation 100.00%
Saint-Gobain Ceramics & Plastics, Inc. United States Full consolidation 100.00%
Saint-Gobain Abrasifs France Full consolidation 99.98%
Société Européenne des Produits Réfractaires - SEPR France Full consolidation 100.00%
Grindwell Norton Ltd India Full consolidation 51.59%
Saint-Gobain K.K. Japan Full consolidation 100.00%
Saint-Gobain America S.A De C.V Mexico Full consolidation 99.83%
Saint-Gobain Abrasives BV Netherlands Full consolidation 100.00%
Saint-Gobain HPM Polska Sp Zoo Poland Full consolidation 100.00%
Saint-Gobain Adfors CZ S.R.O. Czech Republic Full consolidation 100.00%
Dec. 31, 2018

Consolidated financial statements of the Saint-Gobain Group
66
CONSTRUCTION PRODUCTS SECTOR
INTERIOR SOLUTIONS Country Consolidation methodPercentage held
directly and indirectly
Saint-Gobain Construction Products South Africa Ltd South Africa Full consolidation 100.00%
Saint-Gobain Isover G+H Aktiengesellschaft Germany Full consolidation 99.91%
Saint-Gobain Rigips GmbH Germany Full consolidation 100.00%
Saint-Gobain Construction Products Belgium Belgium Full consolidation 100.00%
CertainTeed Gypsum Canada, Inc. Canada Full consolidation 100.00%
Saint-Gobain Denmark A/S Denmark Full consolidation 99.97%
Saint-Gobain Placo Iberica Spain Full consolidation 99.83%
CertainTeed Corporation United States Full consolidation 100.00%
CertainTeed Gypsum & Ceillings USA, Inc. United States Full consolidation 100.00%
CertainTeed Ceilings Corporation United States Full consolidation 100.00%
Saint-Gobain Finland OY Finland Full consolidation 100.00%
Placoplatre SA France Full consolidation 99.75%
Saint-Gobain Isover France Full consolidation 100.00%
Saint-Gobain India Private Limited India Full consolidation 99.03%
Saint-Gobain Construction Products (Ireland) Limited Ireland Full consolidation 100.00%
Saint-Gobain PPC Italia S.p.a Italy Full consolidation 100.00%
Mag-Isover K.K. Japan Full consolidation 99.98%
Glava As Norway Full consolidation 100.00%
Saint-Gobain Byggevarer AS Norway Full consolidation 100.00%
Saint-Gobain Construction Products Nederland BV Netherlands Full consolidation 100.00%
Saint-Gobain Construction Products Polska Sp Zoo Poland Full consolidation 100.00%
Saint-Gobain Construction Products CZ AS Czech Republic Full consolidation 100.00%
Saint-Gobain Construction Products United Kingdom Ltd United Kingdom Full consolidation 100.00%
Saint-Gobain Construction Products Russia ooo Russia Full consolidation 100.00%
Saint-Gobain Ecophon AB Sweden Full consolidation 100.00%
Saint-Gobain Sweden AB Sweden Full consolidation 100.00%
Izocam Ticaret VE Sanayi A.S. Turkey Full consolidation 47.53%
Vinh Tuong Industrial Corporation Vietnam Full consolidation 98.65%
EXTERIOR SOLUTIONS Country Consolidation methodPercentage held
directly and indirectly
Saint-Gobain Weber GmbH Germany Full consolidation 100.00%
Saint-Gobain PAM Deutschland GmbH Germany Full consolidation 100.00%
Saint-Gobain Argentina S.A Argentina Full consolidation 100.00%
Saint-Gobain Do Brasil Ltda Brazil Full consolidation 100.00%
Saint-Gobain Canalizaçao Ltda Brazil Full consolidation 100.00%
Saint-Gobain Pipelines Co., Ltd China Full consolidation 100.00%
CertainTeed Corporation United States Full consolidation 100.00%
Saint-Gobain Finland OY Finland Full consolidation 100.00%
Saint-Gobain Weber France Full consolidation 100.00%
Saint-Gobain PAM France Full consolidation 100.00%
Saint-Gobain Construction Products United Kingdom Ltd United Kingdom Full consolidation 100.00%
Saint-Gobain Sweden AB Sweden Full consolidation 100.00%
Saint-Gobain Weber AG Switzerland Full consolidation 100.00%
Dec. 31, 2018
Dec. 31, 2018

Consolidated financial statements of the Saint-Gobain Group
67
BUILDING DISTRIBUTION SECTOR
* German consolidated subsidiary or sub-group with corporate or limited liability status and meeting the criteria under Articles 264 paragraph 3, 264b and
291 of the German Commercial Code (HGB) exempting the relevant entities and sub-groups from publishing their statutory and consolidated financial statements or notes to the financial statements and management reports (entities or sub-groups above or below the €100 million threshold).
Country Consolidation methodPercentage held
directly and indirectly
Saint-Gobain Building Distribution Deutschland GmbH, Offenbach/Main* Germany Full consolidation 100.00%
Fliesen Discount GmbH, Berlin* Germany Full consolidation 100.00%
Chr.Balzer GmbH & Co. KG, Marburg* Germany Full consolidation 67.34%
Balzer & Nassauer GmbH & Co. KG, Herborn* Germany Full consolidation 67.34%
Christian Balzer Beteiligungs GmbH & Co. KG, Allendorf (Eder)* Germany Full consolidation 67.34%
Balzer GmbH & Co. KG, Allendorf (Eder)* Germany Full consolidation 67.34%
Muffenrohr Tiefbauhandel GmbH, Ottersweier* Germany Full consolidation 67.34%
Platten-Peter Fliesenzentrum Nord GmbH, Münster* Germany Full consolidation 67.34%
Dr. Sporkenbach GmbH Holz- und Baufachhandel, Magdeburg* Germany Full consolidation 67.34%
Saint-Gobain Distribuiçao Brasil Ltda Brazil Full consolidation 100.00%
Saint-Gobain Distribution Denmark Denmark Full consolidation 100.00%
Saint-Gobain Idaplac, S.L. Spain Full consolidation 99.83%
Saint-Gobain Distribucion Construccion, S.L Spain Full consolidation 99.83%
Distribution Sanitaire Chauffage France Full consolidation 100.00%
Lapeyre France Full consolidation 100.00%
Saint-Gobain Distribution Bâtiment France France Full consolidation 100.00%
Optimera As Norway Full consolidation 100.00%
Saint-Gobain Distribution The Netherlands B.V Netherlands Full consolidation 100.00%
Saint-Gobain Building Distribution Ltd United Kingdom Full consolidation 100.00%
Saint-Gobain Distribution Nordic Ab Sweden Full consolidation 100.00%
Sanitas Troesch Ag Switzerland Full consolidation 100.00%
Dec. 31, 2018