consolidated financial statements - bbraun.com€¦ · income taxes 10) – 125,802 ... effects of...
TRANSCRIPT

CONSOLIDATED FINANCIAL STATEMENTS
72 Consolidated Statement of Income 72 Consolidated Statement of Comprehensive Income 73 Consolidated Statement of Financial Position 74 Consolidated Asset Analysis 76 Consolidated Statement of Changes in Equity 78 Consolidated Statement of Cash Flows 79 Notes 153 Independent Auditors’ Report154 Major Shareholdings

878.1 € millionEBITDA
319.7 € millionConsolidated net income
6,129.8 € millionSales
12.9 %Sales growth
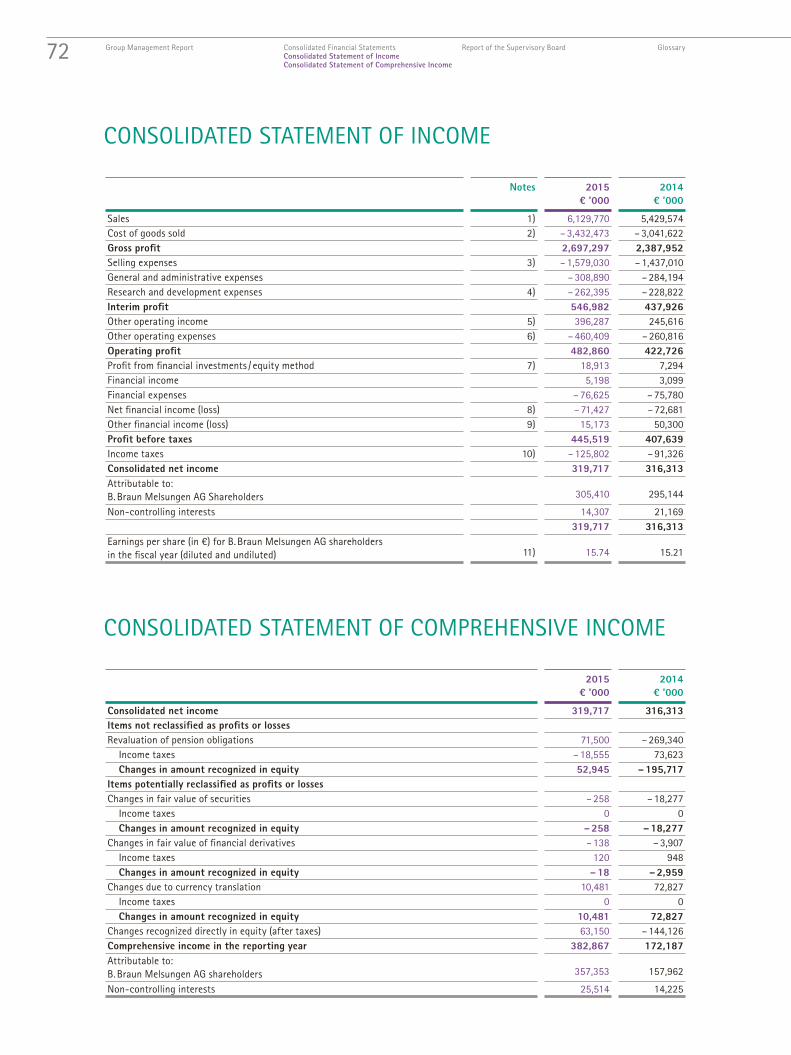
CONSOLIDATED STATEMENT OF INCOME
Notes 2015€ ’000
2014€ ’000
Sales 1) 6,129,770 5,429,574Cost of goods sold 2) – 3,432,473 – 3,041,622Gross profit 2,697,297 2,387,952Selling expenses 3) – 1,579,030 – 1,437,010General and administrative expenses – 308,890 – 284,194Research and development expenses 4) – 262,395 – 228,822Interim profit 546,982 437,926Other operating income 5) 396,287 245,616Other operating expenses 6) – 460,409 – 260,816Operating profit 482,860 422,726Profit from financial investments / equity method 7) 18,913 7,294Financial income 5,198 3,099Financial expenses – 76,625 – 75,780Net financial income (loss) 8) – 71,427 – 72,681Other financial income (loss) 9) 15,173 50,300Profit before taxes 445,519 407,639Income taxes 10) – 125,802 – 91,326Consolidated net income 319,717 316,313Attributable to: B. Braun Melsungen AG Shareholders 305,410 295,144
Non-controlling interests 14,307 21,169319,717 316,313
Earnings per share (in €) for B. Braun Melsungen AG shareholders in the fiscal year (diluted and undiluted) 11) 15.74 15.21
2015€ ’000
2014€ ’000
Consolidated net income 319,717 316,313Items not reclassified as profits or lossesRevaluation of pension obligations 71,500 – 269,340
Income taxes – 18,555 73,623Changes in amount recognized in equity 52,945 – 195,717
Items potentially reclassified as profits or lossesChanges in fair value of securities – 258 – 18,277
Income taxes 0 0Changes in amount recognized in equity – 258 – 18,277
Changes in fair value of financial derivatives – 138 – 3,907Income taxes 120 948Changes in amount recognized in equity – 18 – 2,959
Changes due to currency translation 10,481 72,827Income taxes 0 0Changes in amount recognized in equity 10,481 72,827
Changes recognized directly in equity (after taxes) 63,150 – 144,126Comprehensive income in the reporting year 382,867 172,187Attributable to:B. Braun Melsungen AG shareholders 357,353 157,962
Non-controlling interests 25,514 14,225
CONSOLIDATED STATEMENT OF COMPREHENSIVE INCOME
72 Glossary Group Management Report Consolidated Financial Statements Report of the Supervisory Board Consolidated Statement of Income Consolidated Statement of Comprehensive Income

CONSOLIDATED STATEMENT OF FINANCIAL POSITION
Notes Dec. 31, 2015€ ’000
Dec. 31, 2014€ ’000
AssetsNon-current assetsIntangible assets 14) 16) 566,648 514,626Property, plant, and equipment 15) 16) 3,642,325 3,302,552Financial investments (equity method) 17) 338,942 331,483Other financial investments 17) 45,984 30,319
of which financial assets (45,984) (30,319)Trade receivables 18) 20,186 19,836Other assets 19) 28,144 25,309
of which financial assets (23,853) (20,587)Income tax receivables 1,873 2,216Deferred tax assets 203,439 210,523
4,847,541 4,436,864Current assetsInventories 20) 1,056,725 1,005,716Trade receivables 18) 1,014,515 973,853Other assets 19) 238,300 227,795
of which financial assets (126,733) (130,100)Income tax receivables 46,093 38,226Cash and cash equivalents 21) 62,958 84,332
2,418,591 2,329,922Total assets 7,266,132 6,766,786EquitySubscribed capital 22) 800,000 800,000Capital reserves and retained earnings 23) 1,996,404 1,667,528Effects of foreign currency translation – 86,408 – 83,947Equity attributable to B. Braun Melsungen AG shareholders 2,709,996 2,383,581Non-controlling interests 24) 190,380 180,436Total equity 2,900,376 2,564,017LiabilitiesNon-current liabilitiesProvisions for pensions and similar obligations 25) 1,079,705 1,098,474Other provisions 26) 98,235 79,658Financial liabilities 27) 1,154,991 1,284,435Trade accounts payable 29) 4,502 6,323Other liabilities 29) 39,842 41,937
of which financial liabilities (19,251) (21,475)Deferred tax liabilities 99,740 84,113
2,477,015 2,594,940Current liabilitiesOther provisions 26) 49,632 39,630Financial liabilities 27) 768,374 585,718Trade accounts payable 29) 344,113 305,591Other liabilities 29) 681,183 640,022
of which financial liabilities (286,486) (253,887)Current income tax liabilities 45,439 36,868
1,888,741 1,607,829Total liabilities 4,365,756 4,202,769Total equity and liabilities 7,266,132 6,766,786
73Glossary Group Management Report Consolidated Financial Statements Report of the Supervisory Board Consolidated Statement of Financial Position

CONSOLIDATED ASSET ANALYSIS
Group Costs of acquisition and manufacture Depreciation and amortization Carrying amounts
Jan. 1, 2015
€ ’000
Foreign currency
translation
€ ’000
Additions to scope of
consolidation
€ ’000
Disposals from scope ofconsolidation
€ ’000
Additions
€ ’000
Transfers
€ ’000
Disposals
€ ’000
Changes infair value
€ ’000
Dec. 31, 2015
€ ’000
Accu-mulated
2014
€ ’000
Fiscal year 2015
€ ’000
Otherchanges*
€ ’000
Accu-mulated
2015
€ ’000
Dec. 31, 2015
€ ’000
Dec. 31, 2014
€ ’000
Intangible assets
Acquired goodwill 169,517 252 13,276 0 556 28 0 0 183,629 503 0 0 503 183,126 169,014
Licenses, trademarks, and other similar rights 421,528 8,346 10,338 0 16,907 20,605 – 4,104 0 473,620 256,681 34,698 3,041 294,420 179,200 164,847
Internally created intangible assets 85,705 9,734 0 0 12,961 0 0 0 108,400 13,810 761 1,419 15,990 92,410 71,895
Advance payments 108,870 – 12 0 0 26,822 – 19,814 – 3,954 0 111,912 0 3,912 – 3,912 0 111,912 108,870
Total 785,620 18,320 23,614 0 57,246 819 – 8,058 0 877,561 270,994 39,371 548 310,913 566,648 514,626
Property, plant, and equipment
Land and buildings 1,750,434 21,083 19,035 0 63,790 140,084 – 16,253 0 1,978,173 493,980 55,589 2,629 552,198 1,425,975 1,256,454
Technical plants and machinery 2,579,375 15,906 3,156 0 127,312 220,141 – 34,022 0 2,911,868 1,473,407 181,615 – 15,528 1,639,494 1,272,374 1,105,968
Other plants, operating and office equipment 864,494 – 401 1,807 0 74,089 30,724 – 32,781 0 937,932 557,566 79,496 – 26,426 610,636 327,296 306,928
Advance payments and assets under construction 634,051 10,215 53 0 372,482 – 391,768 – 5,059 0 619,974 849 5,056 – 2,611 3,294 616,680 633,202
Total 5,828,354 46,803 24,051 0 637,673 – 819 – 88,115 0 6,447,947 2,525,802 321,756 – 41,936 2,805,622 3,642,325 3,302,552
Financial investments
Financial investments (equity method) 331,483 581 514 0 8,739 – 2,375 0 0 338,942 0 0 0 0 338,942 331,483
Other holdings 18,406 0 1,275 – 65,567 77,858 2,375 – 3,850 0 30,497 29 0 0 29 30,468 18,377
Loans to companies in which the groups hold an interest 1,792 – 89 0 – 1,275 0 0 – 26 0 402 0 0 0 0 402 1,792
Securities 723 0 0 0 4,634 0 0 – 172 5,185 0 0 0 0 5,185 723
Other loans 9,447 0 34 0 852 0 – 384 0 9,949 20 0 0 20 9,929 9,427
Total 361,851 492 1,823 – 66,842 92,083 0 – 4,260 – 172 384,975 49 0 0 49 384,926 361,802
6,975,825 65,615 49,488 – 66,842 787,002 0 – 100,433 – 172 7,710,483 2,796,845 361,127 – 41,388 3,116,584 4,593,899 4,178,980
* Other changes include foreign currency translation effects, changes to the consolidation scope, transfers and disposals
74 Glossary Group Management Report Consolidated Financial Statements Report of the Supervisory Board Consolidated Asset Analysis

Group Costs of acquisition and manufacture Depreciation and amortization Carrying amounts
Jan. 1, 2015
€ ’000
Foreign currency
translation
€ ’000
Additions to scope of
consolidation
€ ’000
Disposals from scope ofconsolidation
€ ’000
Additions
€ ’000
Transfers
€ ’000
Disposals
€ ’000
Changes infair value
€ ’000
Dec. 31, 2015
€ ’000
Accu-mulated
2014
€ ’000
Fiscal year 2015
€ ’000
Otherchanges*
€ ’000
Accu-mulated
2015
€ ’000
Dec. 31, 2015
€ ’000
Dec. 31, 2014
€ ’000
Intangible assets
Acquired goodwill 169,517 252 13,276 0 556 28 0 0 183,629 503 0 0 503 183,126 169,014
Licenses, trademarks, and other similar rights 421,528 8,346 10,338 0 16,907 20,605 – 4,104 0 473,620 256,681 34,698 3,041 294,420 179,200 164,847
Internally created intangible assets 85,705 9,734 0 0 12,961 0 0 0 108,400 13,810 761 1,419 15,990 92,410 71,895
Advance payments 108,870 – 12 0 0 26,822 – 19,814 – 3,954 0 111,912 0 3,912 – 3,912 0 111,912 108,870
Total 785,620 18,320 23,614 0 57,246 819 – 8,058 0 877,561 270,994 39,371 548 310,913 566,648 514,626
Property, plant, and equipment
Land and buildings 1,750,434 21,083 19,035 0 63,790 140,084 – 16,253 0 1,978,173 493,980 55,589 2,629 552,198 1,425,975 1,256,454
Technical plants and machinery 2,579,375 15,906 3,156 0 127,312 220,141 – 34,022 0 2,911,868 1,473,407 181,615 – 15,528 1,639,494 1,272,374 1,105,968
Other plants, operating and office equipment 864,494 – 401 1,807 0 74,089 30,724 – 32,781 0 937,932 557,566 79,496 – 26,426 610,636 327,296 306,928
Advance payments and assets under construction 634,051 10,215 53 0 372,482 – 391,768 – 5,059 0 619,974 849 5,056 – 2,611 3,294 616,680 633,202
Total 5,828,354 46,803 24,051 0 637,673 – 819 – 88,115 0 6,447,947 2,525,802 321,756 – 41,936 2,805,622 3,642,325 3,302,552
Financial investments
Financial investments (equity method) 331,483 581 514 0 8,739 – 2,375 0 0 338,942 0 0 0 0 338,942 331,483
Other holdings 18,406 0 1,275 – 65,567 77,858 2,375 – 3,850 0 30,497 29 0 0 29 30,468 18,377
Loans to companies in which the groups hold an interest 1,792 – 89 0 – 1,275 0 0 – 26 0 402 0 0 0 0 402 1,792
Securities 723 0 0 0 4,634 0 0 – 172 5,185 0 0 0 0 5,185 723
Other loans 9,447 0 34 0 852 0 – 384 0 9,949 20 0 0 20 9,929 9,427
Total 361,851 492 1,823 – 66,842 92,083 0 – 4,260 – 172 384,975 49 0 0 49 384,926 361,802
6,975,825 65,615 49,488 – 66,842 787,002 0 – 100,433 – 172 7,710,483 2,796,845 361,127 – 41,388 3,116,584 4,593,899 4,178,980
* Other changes include foreign currency translation effects, changes to the consolidation scope, transfers and disposals
75Glossary Group Management Report Consolidated Financial Statements Report of the Supervisory Board Consolidated Asset Analysis

CONSOLIDATED STATEMENT OF CHANGES IN EQUITY
See notes 22 – 24 Subscribedcapital
€ ’000
Capitalreserves
€ ’000
Retainedearnings
€ ’000
Otherreserves
€ ’000
Equity attributable
to owners
€ ’000
Non- controlling
interests
€ ’000
Equity
€ ’000
January 1, 2014 600,000 10,226 1,797,036 – 134,588 2,272,674 172,311 2,444,985
Dividend of B. Braun Melsungen AG 0 0 – 32,000 0 – 32,000 0 – 32,000
Increase in subscribed capital 200,000 0 – 200,000 0 0 0 0
Consolidated net income 0 0 295,144 0 295,144 21,169 316,313
Changes recognized directly in equity (after taxes)
Changes in fair value of securities 0 0 0 – 18,277 – 18,277 0 – 18,277
Cash flow hedging instruments 0 0 0 – 2,871 – 2,871 – 88 – 2,959
Revaluation of pension obligations 0 0 – 184,141 0 – 184,141 – 11,576 – 195,717
Changes due to currency translation 0 0 0 68,107 68,107 4,720 72,827
Comprehensive income over the period 0 0 111,003 46,959 157,962 14,225 172,187
Other changes 0 0 – 15,055 0 – 15,055 – 6,100 – 21,155
December 31, 2014 / January 1, 2015 800,000 10,226 1,660,984 – 87,629 2,383,581 180,436 2,564,017
Dividend of B. Braun Melsungen AG 0 0 – 32,000 0 – 32,000 0 – 32,000
Increase in subscribed capital 0 0 0 0 0 0 0
Consolidated net income 0 0 305,410 0 305,410 14,307 319,717
Changes recognized directly in equity (after taxes)
Changes in fair value of securities 0 0 0 – 254 – 254 – 4 – 258
Cash flow hedging instruments 0 0 0 – 140 – 140 122 – 18
Revaluation of pension obligations 0 0 54,797 0 54,797 – 1,852 52,945
Changes due to currency translation 0 0 0 – 2,460 – 2,460 12,941 10,481
Comprehensive income over the period 0 0 360,207 – 2,854 357,353 25,514 382,867
Other changes 0 0 1,062 0 1,062 – 15,570 – 14,508
December 31, 2015 800,000 10,226 1,990,253 – 90,483 2,709,996 190,380 2,900,376
76 Glossary Group Management Report Consolidated Financial Statements Report of the Supervisory Board Consolidated Statement of Changes in Equity

See notes 22 – 24 Subscribedcapital
€ ’000
Capitalreserves
€ ’000
Retainedearnings
€ ’000
Otherreserves
€ ’000
Equity attributable
to owners
€ ’000
Non- controlling
interests
€ ’000
Equity
€ ’000
January 1, 2014 600,000 10,226 1,797,036 – 134,588 2,272,674 172,311 2,444,985
Dividend of B. Braun Melsungen AG 0 0 – 32,000 0 – 32,000 0 – 32,000
Increase in subscribed capital 200,000 0 – 200,000 0 0 0 0
Consolidated net income 0 0 295,144 0 295,144 21,169 316,313
Changes recognized directly in equity (after taxes)
Changes in fair value of securities 0 0 0 – 18,277 – 18,277 0 – 18,277
Cash flow hedging instruments 0 0 0 – 2,871 – 2,871 – 88 – 2,959
Revaluation of pension obligations 0 0 – 184,141 0 – 184,141 – 11,576 – 195,717
Changes due to currency translation 0 0 0 68,107 68,107 4,720 72,827
Comprehensive income over the period 0 0 111,003 46,959 157,962 14,225 172,187
Other changes 0 0 – 15,055 0 – 15,055 – 6,100 – 21,155
December 31, 2014 / January 1, 2015 800,000 10,226 1,660,984 – 87,629 2,383,581 180,436 2,564,017
Dividend of B. Braun Melsungen AG 0 0 – 32,000 0 – 32,000 0 – 32,000
Increase in subscribed capital 0 0 0 0 0 0 0
Consolidated net income 0 0 305,410 0 305,410 14,307 319,717
Changes recognized directly in equity (after taxes)
Changes in fair value of securities 0 0 0 – 254 – 254 – 4 – 258
Cash flow hedging instruments 0 0 0 – 140 – 140 122 – 18
Revaluation of pension obligations 0 0 54,797 0 54,797 – 1,852 52,945
Changes due to currency translation 0 0 0 – 2,460 – 2,460 12,941 10,481
Comprehensive income over the period 0 0 360,207 – 2,854 357,353 25,514 382,867
Other changes 0 0 1,062 0 1,062 – 15,570 – 14,508
December 31, 2015 800,000 10,226 1,990,253 – 90,483 2,709,996 190,380 2,900,376
77Glossary Group Management Report Consolidated Financial Statements Report of the Supervisory Board Consolidated Statement of Changes in Equity

CONSOLIDATED STATEMENT OF CASH FLOWS
Notes 2015€ ’000
2014€ ’000
Operating profit 482,860 422,726
Income tax paid – 124,171 – 115,958
Depreciation and amortization of property, plant, and equipment and intangible assets (net of appreciation) 361,127 318,060
Change in non-current provisions – 6,338 286,192
Interest received and other financial income 855 1,938
Interest paid and other financial expenditure – 47,624 – 40,927
Other non-cash income and expenses 94,760 – 297,347
Gain / loss on the disposal of property, plant, and equipment and intangible or other assets 6,223 – 8,747
Gross cash flow 34) 767,692 565,937
Change in inventories – 34,823 – 75,781
Change in receivables and other assets – 78,820 – 31,090
Change in liabilities, current provisions and other liabilities (excluding financial liabilities) 33,456 61,639
Cash flow from operating activities (net cash flow) 34) 687,505 520,705
Investments in property, plant, and equipment and intangible assets – 695,580 – 662,877
Investments in financial assets – 22,809 – 108,011
Acquisitions of subsidiaries, net of cash acquired – 39,049 – 77,865
Proceeds from sale of subsidiaries and holdings 4,034 4,727
Proceeds from sale of property, plant, and equipment, intangible assets and other financial assets 11,151 12,884
Dividends and similar revenues received 29,355 315,507
Cash flow from investing activities 35) – 712,898 – 515,635
Free cash flow – 25,393 5,070
Capital contributions 237 – 85
Dividends paid to B. Braun Melsungen AG shareholders – 32,000 – 32,000
Dividends paid to non-controlling interests – 10,052 – 10,008
Deposits and repayments for profit-sharing rights – 1,154 – 653
Loans 340,888 566,025
Loan repayments – 304,223 – 491,239
Cash flow from financing activities 36) – 6,304 32,040
Change in cash and cash equivalents – 31,697 37,110
Cash and cash equivalents at the start of the year 84,332 38,924
Exchange gains (losses) on cash and cash equivalents 10,323 8,298
Cash and cash equivalents at year end 37) 62,958 84,332
78 Glossary Group Management Report Consolidated Financial Statements Report of the Supervisory Board Consolidated Statement of Cash Flows

NOTES
GENERAL INFORMATION
The consolidated financial statements of B. Braun Melsungen AG – hereinafter also referred to as the B. Braun Group – as of December 31, 2015 have been prepared in compliance with Section 315a (3) of the German Commercial Code (HGB) according to International Financial Reporting Standards (IFRS) applicable as of the reporting date published by the International Accounting Standards Board (IASB), London, as well as the interpretations issued by the International Financial Reporting Interpretations Committee (IFRIC) as stipulated by the EU, and have been published in the online edition of the German Federal Gazette (Bundesanzeiger).
B. Braun Melsungen AG is a globally engaged, family-owned company headquartered in Melsungen, Germany. The company’s address is Carl-Braun-Str. 1, 34212 Melsungen.
B. Braun Holding GmbH & Co. KG is the parent company of B. Braun Melsungen AG, as defined in Sec-tion 290 (1) HGB, and as the chief parent company is required to produce consolidated financial state-ments that include the consolidated financial statements of B. Braun Melsungen AG.
B. Braun Melsungen AG and its subsidiaries manufacture, market, and sell a broad array of healthcare products and services for intensive care units, anesthesia and emergency care, extracorporeal blood treatment, and surgical core procedures. The major manufacturing facilities are located in the EU, Swit-zerland, the USA, Brazil, Vietnam and Malaysia. The company distributes its products via a worldwide network of subsidiaries and associated companies.
The Management Board of B. Braun Melsungen AG approved the consolidated financial statements for submission to the company’s Supervisory Board on March 2, 2016. The Audit Committee of the Super-visory Board plans to discuss the consolidated financial statements at its meeting on March 8, 2016, and the Supervisory Board shall approve the consolidated financial statements at its meeting on March 22, 2016.
The consolidated financial statements have been prepared based on historical costs, except for avail-able-for-sale financial assets and financial assets / liabilities including derivative financial instruments measured at fair value through profit and loss. Unless otherwise indicated, the accounting policies were used consistently for all periods referred to in this report.
In the statement of financial position, a distinction is made between current and non-current assets and liabilities. The statement of income is presented using the cost-of-sales method. Using this format, net sales are compared to expenses incurred to generate these sales, classified by the expense categories cost of goods sold, selling, general and administrative, and research and development. To improve the informational content of the consolidated statement of financial position and consolidated statement of income, further details on individual entries have been provided in the notes to the consolidated financial statements. The consolidated financial statements have been prepared in euros. Unless otherwise stated, all figures are presented in thousands of euros (€ ‘000).
79Glossary Group Management Report Consolidated Financial Statements Report of the Supervisory Board Notes

The financial statements of B. Braun Melsungen AG and its subsidiaries included in the consolidated financial statements have been prepared using standardized Group accounting policies.
New and amended International Financial Reporting Standards and Interpretations whose application is mandatory for the first time for fiscal years beginning on or after June 17, 2014 (IAS 8.28)
IFRIC 21, Levies IFRIC 21 provides guidance on when to recognize a liability for a levy imposed by a government, excluding income taxes as defined by IAS 12 Income Taxes. Application of this interpretation is man-datory for fiscal years beginning on or after June 17, 2014. The amendment is expected to have no material impact on the net assets, financial position and earnings situation of the B. Braun Group.
New and amended International Financial Reporting Standards and Interpretations that have already been published, but whose application is not yet mandatory for companies whose fiscal year ends on December 31, 2014 (IAS 8.30) and whose adoption is still pending in some EU countries
Amendments to IAS 19, Employee Benefits – Employee Contributions The amendment to IAS 19R (2011) adds an option to the standard with regard to accounting for defined benefit pension plans in which employees (or third parties) are involved through mandatory contributions. IAS 19R (2011) provides for assigning employee contributions, which are set out in the formal terms of a defined benefit plan and linked to job performance, to the service periods as negative benefits. Taking into account the now-published amendment to IAS 19R (2011), it is permissible to continue recognizing employee contributions linked to job performance that are not linked to the number of years of service during that period in which the corresponding work is done without applying the calculation-and-dis-tribution method using the “projected unit credit method.” However, if the employee contributions – depending on the number of years of service – vary, it is mandatory that the calculation-and-distribution method using the “projected unit credit method” be followed. This amendment should be applied for fiscal years beginning on or after February 1, 2015. Voluntary early application of these requirements is permitted, but the B. Braun Group does not elect to do this. The amendment is expected to have no material impact on the net assets, financial position and earnings situation of the B. Braun Group.
IFRS 14 Regulatory Deferral AccountsIFRS 14 permits an entity, which is a first-time adopter of the International Financial Reporting Stan-dards, to continue to account, with some limited changes, for “regulatory deferral account balances” in accordance with its previous GAAP, both on initial adoption of IFRS and in subsequent financial state-ments. Regulatory deferral account balances, and movements in them, are presented separately in the statement of financial position and statement of profit or loss and other comprehensive income, and specific disclosures are required. IFRS 14 applies to an entity’s first annual IFRS financial statements for a period beginning on or after January 1, 2016. It is not yet clear when widespread adoption of these rules by the EU (“endorsement”) can be expected. This interpretation is not relevant for the B. Braun Group.
80 Glossary Group Management Report Consolidated Financial Statements Report of the Supervisory Board Notes

Amendments to IFRS 11 Joint Arrangements – Acquisition of Shares in a Joint Operation The amendment clarifies that acquisitions and subsequent acquisitions of interests in jointly con-trolled operations, which constitute a business as defined by IFRS 3, Business Combinations, should be accounted for according to the principles of accounting for business combinations under IFRS 3 and other applicable IFRS, provided these do not conflict with the provisions in IFRS 11. The changes do not apply if the reporting entity and the parties thereto are under common control of the same ultimate controlling party. The new rules apply prospectively for share purchases that take place in reporting periods beginning on or after January 1, 2016. Earlier voluntary application is permitted, but the B. Braun Group will not elect to do this. The amendment is expected to have no material impact on the net assets, financial position and earnings situation of the B. Braun Group.
Amendments to IAS 16, Property, plant, and equipment, and IAS 38, Intangible Assets – Clarification of Acceptable Methods of Depreciation The aim of these amendments is to clarify which methods are appropriate with regard to the deprecia-tion of property, plant, and equipment and intangible assets. In principle, the depreciation of property, plant, and equipment and intangible assets shall reflect the company’s expected consumption of future economic benefits generated by the asset. In this regard, the IASB has now clarified that a depreciation of property, plant, and equipment on the basis of the sales of goods that it manufactures does not fol-low this approach, and thus is not appropriate, because the revenues depend not only on consumption of the asset, but also on other factors, such as sales volume, price, or inflation. With some exceptions, this clarification is also included in IAS 38 for amortizing intangible assets with finite useful lives. For both property, plant, and equipment and intangible assets, the clarification also states that the decline in the sale prices of goods and services produced with them might be an indication of their economic obsolescence, and therefore an indication of a decline in the economic benefit potential of the assets that are necessary for production. This amendment applies to reporting periods beginning on or after January 1, 2016. Voluntary early application of these requirements is permitted, but the B. Braun Group does not elect to do this. The amendment is expected to have no material impact on the net assets, financial position and earnings situation of the B. Braun Group.
Amendments to IAS 27, Separate Financial Statements – Applying the Equity Method in the Financial Statements Due to the amendments, investments in subsidiaries, joint ventures, and associated companies in future IFRS financial statements shall be accounted for using the equity method. This amendment applies to reporting periods beginning on or after January 1, 2016. Voluntary early application of these require-ments is permitted. This interpretation is not relevant for the B. Braun Group.
Amendments to IAS 16, Property, Plant, and Equipment, and IAS 41 Agriculture – Agriculture: Producing Plants Until the date of bearer plants’ production maturity, the amendments clarify that – similar to tangible assets – producing plants (bearer plants) should be accounted for either at acquisition or manufacturing
81Glossary Group Management Report Consolidated Financial Statements Report of the Supervisory Board Notes

cost, and should subsequently be accounted for using IAS 16 provisions, using either the acquisition cost model or the re-evaluation model. Accounting in accordance with IAS 41 will no longer be permitted. The amendment is effective for reporting periods beginning on or after January 1, 2016. An earlier voluntary application of the new rules is permitted. This interpretation is not relevant for the B. Braun Group.
IFRS 15, Revenue from Customer ContractsOn the one hand, the objective of the revised standards is, in particular, to unify the previous, less extensive regulations in the IFRS, and on the other, to standardize the very detailed and somewhat industry-specific regulations under US GAAP, thus improving the transparency and comparability of financial information. Under IFRS 15, revenue is then realized when the customer obtains control of the agreed goods and services, and can benefit from their use. The decisive factor is no longer a major transfer of risks and rewards, as under the old provisions of IAS 18, Revenue. Revenue is to be val-ued as quid pro quo, that is, the compensation that the company expects to receive. The new model provides a five-step scheme for determining the revenue recognition, whereby in the first step the customer agreement and the separate performance obligations contained therein must be identified. Subsequently, the transaction price of the customer’s contract shall be determined and divided up among the individual obligations. Finally, revenue should be realized according to the new model for each performance obligation at the allocated pro rata transaction price as soon as the agreed service has been performed or the customer has obtained the power of disposal over it. A distinction that is based on predefined criteria is made here between point-in-time-related and period-of-time-based performance fulfillments. The new standard does not distinguish between different job and activity types, but establishes standardized criteria for when a service that is rendered should be realized as a point-in-time or period-of-time. In the future, IFRS 15 provisions will replace both the contents of IAS 18, Revenue and IAS 11, Construction Contracts. In addition, a variety of other items are controlled for the first time and this could have implications for the current accounting policy, such as provi-sions for contract modifications or repurchase agreements. In September 2015, the IASB published an amendment to the standard postponing mandatory first-time application of the standard to reporting periods beginning on or after July 1, 2018. Voluntary early application of these requirements is permit-ted, but the B. Braun Group does not elect to do this. EU adoption of the these rules (“endorsement”) is expected for Q2 2016. The B. Braun Group is currently reviewing the impact on the net assets, financial position, and earnings situation.
IFRS 9 Financial Instruments The IASB completed its project to replace IAS 39, Financial Instruments: Recognition and Measure-ment in July 2014 with the publication of the final version of IFRS 9, Financial Instruments. In its final version, IFRS 9 contains in particular fundamentally revised regulations on classifying and measuring financial instruments, accounting for the depreciation of financial assets, and hedge accounting rela-tionships. For classifying and measuring financial assets, IFRS 9 provides the models “Hold to Achieve Contractual Cash Flows,” “Hold and Sell” and “Intention to Trade” as a function of the company’s business model. The classification and measurement rules for financial liabilities have changed very
82 Glossary Group Management Report Consolidated Financial Statements Report of the Supervisory Board Notes

little through IFRS 9. Due to the new rules governing accounting for depreciation, their recognition fundamentally changes, since not only incurred losses (current incurred loss model), but also expected losses (so-called expected loss model) are to be recognized, whereby the scope of recognition of expected losses is differentiated further based on whether or not the credit risk of financial assets has deteriorated markedly since their addition. Also, the rules for hedge accounting have been completely revised. The primary aim of the new rules is to orient hedge accounting more strongly toward the com-pany’s economic risk management. A hedging relationship must therefore be maintained for accounting purposes as long as the documented risk management objective for this hedging relationship has not changed, and the other conditions for hedge accounting are met. Furthermore, individual risk com-ponents can be considered under IFRS 9 in isolation under certain conditions, even in non-financial transactions. In addition, the requirements for demonstrating the effectiveness of hedging transactions are changing. IFRS 9 – subject to an expected EU endorsement – is effective for reporting periods beginning on or after January 1, 2018. In principle, the adoption must be applied retroactively, although various simplification options are granted. Earlier voluntary application is permitted, but the B. Braun Group will likely not elect to do this. EU adoption of the these rules (“endorsement”) is expected for Q2 2016. The B. Braun Group is currently reviewing the impact on the net assets, financial position, and earnings situation.
Amendments to IFRS 10, Consolidated Financial Statements, and IAS 28, Investments in Associate Corporations and Joint VenturesThe amendments have resolved a previously existing inconsistency between the two standards. IFRS 10 currently requires recognizing the full profit or loss resulting from the loss of control of a subsidiary, which is introduced in a joint venture or an associate concern. In contrast, IAS 28 only provides for profit or loss realization in the amount of shares held by other investors for non-financial assets introduced in associated companies or joint ventures. According to the published changes, in the future, the investor always has to realize a profit or loss in full if the transaction involves a business as defined in IFRS 3. If the transaction involves assets that do not constitute a business, then only the pro rata success shall be recognized. The changes are to be applied prospectively to corresponding transactions beginning on or after January 1, 2016. However, the IASB published a draft standard in August 2015 which calls for postponing mandatory first-time application indefinitely. This action was taken because of the finding of an unintended conflict between the proposed new rule and the existing rule in IAS 28.32. Neverthe-less, voluntary earlier application of the rules will continue to be allowed. However, the amendment is not yet applicable because there has been no endorsement made for IFRS EU accounting. The rule is expected to have no material impact on the net assets, financial position and earnings situation of the B. Braun Group.
Amendments to IAS 1, Presentation of Financial Statements: Information InitiativeThe objective of the information initiative is to eliminate obstacles that authors are faced with while exercising discretion when presenting financial statements. With respect to materiality, the amendments clarify that information should not be obscured by aggregating, that materiality must be applied to all
83Glossary Group Management Report Consolidated Financial Statements Report of the Supervisory Board Notes

elements of financial statements and that even then, significance shall be taken into account when the disclosure of certain information is prescribed in a standard. With regard to the statement of financial position and the representation in the income statement or in other comprehensive income, it is clar-ified that the list of ID lines can be split up or combined in the components of the financial statement on grounds of relevance and that additional guidance regarding subtotals in the financial statement components apply. It is clarified that a company’s share of the other comprehensive income of associ-ates or joint ventures that is accounted for using the equity method and aggregated as single ID lines on the basis of whether they are later recycled in the income statement should be identified. In terms of information, additional examples of possible sequences of information are included to clarify that understandability and comparability should be considered when the order of the information is being determined, and that the information does not have to be given in the order that is currently shown in IAS 1.114. In addition, those rules and examples referring to naming the significant accounting and valuation methods were eliminated if they were perceived as potentially unhelpful. These amendments are effective for fiscal years beginning on or after January 1, 2016. Earlier application is permitted, but the B. Braun Group will not elect to do this. As the amendment merely affects the presentation of the financial statement, it will have no impact on the net assets, financial position and earnings situation of the B. Braun Group.
Amendments to IFRS 10, IFRS 12, and IAS 28, Investment Entities: Application of the Consolidation Exemption The changes address issues that have arisen in connection with the application of the consolidation exemption for investment entities. With these changes, it has been confirmed that a company can also apply the consolidation exemption when its parent company accounts for its subsidiaries at fair value under IFRS 10. In addition, it is clarified that a subsidiary that provides services related to the invest-ment activities of the parent company is not to be consolidated if the subsidiary is itself an investment entity. In applying the equity method to an associated company or joint venture that is an investment entity, an investor who is not an investment entity can maintain that valuation at fair market value that the investment entity is using for its investments in subsidiaries. With regard to disclosures, it is clarified that an investment entity valuing all its subsidiaries at fair market value shall disclose the information relating to investment entities that is prescribed by IFRS 12. These amendments are effec-tive for fiscal years beginning on or after January 1, 2016. Early application is permitted Widespread EU adoption of these rules (“endorsement”) is expected for Q2 2016. This interpretation is not relevant for the B. Braun Group.
IFRS 16, LeasesOn January 13, 2016, the IASB published a new standard which fundamentally reforms the financial reporting of leases. Previously, all leases had been recognized either as finance leases or as operating leases. This distinction will cease to apply in the future for the lessee. Under the new standard, all leases are recognized in the balance sheet in the form of right-of-use assets and the financial liabilities, comparable to the existing procedure for finance leases. The relevant values are based on the present
84 Glossary Group Management Report Consolidated Financial Statements Report of the Supervisory Board Notes

value of the minimum lease payments over the term of the lease. In the income statement, the lessee will disclose a depreciation charge for the lease assets and an interest expense on lease liabilities for each lease, in lieu of straight-line lease expenses. The disclosure of leases can only deviate from these rules if one of two possible exemptions applies (short-term leases and low-value leases). Unlike lessees, lessors will still have to classify leases as either finance leases or operating leases under IFRS 16. IFRS 16 is to be applied for the first time in reporting periods beginning on or after January 1, 2019. First-time application is generally to be retrospective, but various simplification options are available. Voluntary early application is permitted if IFRS 15 (revenue from contracts with customers) is also fully applied (early). It is not yet clear when widespread adoption of these rules by the EU (“endorsement”) can be expected. The B. Braun Group is currently reviewing the impact on the net assets, financial position, and earnings situation.
Amendments to IAS 12, Income TaxesThe IASB has published final amendments to IAS 12, Income Taxes, in order to address the different methods for handling the recognition of deferred tax claims based on assets measured at fair value, which are largely attributable to the uncertainties in connection with the application of a few principles in IAS 12. The amendments clarify that unrealized losses on debt instruments measured at fair value but measured at cost for tax purposes give rise to deductible temporary differences. This applies regardless of whether the holder expects to recover the carrying amount of the asset by holding it to maturity and collecting all contractual payments or whether the holder intends to sell the asset. It is furthermore clarified that the carrying amount of an asset dos not limit the estimation of probable future taxable profit and that estimates of future taxable profit exclude tax deductions resulting from the reversal of deductible temporary differences. It was also clarified that an entity is required to assess a deferred tax asset in combination with other deferred tax assets. When tax law restricts the utilization of tax losses, an entity is required to assess a deferred tax asset in comibation with other deferred tax assets of the same (permitted) type. The amendments take effect for reporting periods beginning on or after January 1, 2017. Early application is permitted. Widespread EU adoption of these amendments (“endorse-ment”) is currently expected for the fourth quarter of 2016. These amendments are not expected to have an impact on the net assets, financial position and earnings situation of the B. Braun Group.
Disclosure initiative (amendments to IAS 7, Statement of Cash Flows)The final changes in the disclosure initiative (amendments to IAS 7) follow the IASB’s objective of requiring entities to make disclosures which allow those to whom financial statements are addressed to assess changes in liabilities arising from financing activities. In order to accomplish this objective, the following changes in liabilities arising from financing activities are to be disclosed: (i) changes from financing cash flows; (ii) changes arising from obtaining or losing control of subsidiaries or other businesses; (iii) the effect of changes in foreign exchange rates; (iv) changes in fair values; and (v) other changes. Liabilities from financing activities are defined as liabilities “for which cash flows were, or future cash flows will be, classified in the statement of cash flows as cash flows from financing activities.” The new disclosure requirements also apply to changes in financial assets that meet this
85Glossary Group Management Report Consolidated Financial Statements Report of the Supervisory Board Notes
definition. One way to meet the new disclosure requirements is to provide a reconciliation between the opening and closing balances for liabilities arising from financing activities. Finally, the amendments state that changes in liabilities arising from financing activities are to be disclosed separately from changes in other assets and liabilities. The amendments take effect for reporting periods beginning on or after January 1, 2017. Widespread EU adoption of these amendments (“endorsement”) is currently expected for the fourth quarter of 2016. Since the amendments merely relate to the presentation of the financial statements, they will have no impact on the net assets, financial position and earnings situation of the B. Braun Group.
As part of the ongoing improvement project of the IFRS, adjustments to wordings for clarification and changes were also made. These have no major impact on the net assets, financial position, and results of operations of the B. Braun Group.
Critical assumptions and estimates for accounting policies The preparation of financial statements in accordance with IFRS requires management to make assump-tions and estimates that have an effect on the reported amounts and their related statements. While management makes these estimates to the best of its knowledge and abilities based on current events and measures, there is a possibility that actual results may differ. Estimates are necessary in particular when:
– Assessing the need for and the amount of write-downs and other value adjustments; – Measuring pension obligations; – Recognizing and measuring provisions; – Establishing inventory provisions; – Evaluating the probability of realizing deferred tax assets; – Calculating the value in use of cash-generating units (CGU) for impairment testing.
The Group’s management determines the expected useful life of intangible assets and property, plant, and equipment, and therefore their depreciation or amortization, based on estimates. These assumptions can change materially, for example, as a result of technological innovations or changes in the competi-tive environment. Should their actual useful life be shorter than the estimate, management adjusts the amount of depreciation or amortization. Assets that are technologically outdated or no longer usable under the current business strategy are fully or partially written off.
The present value of pension obligations depends on a number of factors, which are based on actuarial assumptions. The assumptions used for the calculation of net pension expenses (and income) include the applicable discount rate for pension obligations. Any change in such assumptions will have an effect on the carrying amount of the pension provisions. Obligations from defined benefit pension plans, as well as pension expenses for the following year, are determined based on the parameters outlined under Note 25.
The calculation of the discount rate was subjected to review this year. The decision was made to switch data providers, resulting in the loss of a rating from a rating agency. In addition, further refinements were made. If the discount rate had been calculated on December 31, 2015 without these changes, the result would have been about 15 basis points higher and the DBO would have been about € 29.9 million
86 Glossary Group Management Report Consolidated Financial Statements Report of the Supervisory Board Notes

lower. The service cost for fiscal 2016 would have been about € 1.4 million lower and interest expenses for pension obligations in 2016 would have been about € 0.6 million higher.
The general method of determining interest rates is unchanged from the year before. An interest yield curve is derived from the analysis of corporate bonds. The discount rate is calculated by measuring a sample cash flow comparable to the circumstances of B. Braun using the interest yield curve and deriving an equivalent standard discount rate.
The recognition and measurement of other provisions is based on estimates regarding the probability of a future outflow of resources, as well as experience and known circumstances as of the reporting date. The actual liability may differ from the amounts of the provisions established.
The estimate of inventory provisions is based on the projected net realizable value (i. e. the estimated selling price, less the estimated cost of completion and the estimated selling expenses). Actual sales and actual costs incurred may differ from these estimates.
Deferred tax assets are only recognized to the extent that it is probable that taxable profit will be available in the future. The actual taxable profits in future periods may differ from the estimates made on the date such deferred tax assets are capitalized.
Goodwill is tested for impairment annually based on a three-year forecast using projections of specific annual growth rates for the subsequent period. An increase or decrease in the projected annual growth rates would alter the estimated fair value of a given cash-generating unit.
Scope of consolidationIn addition to B. Braun Melsungen AG, the consolidated financial statements include 68 domestic and 194 foreign subsidiaries for which B. Braun Melsungen AG is exposed to variable returns and has the ability to influence them.
Subsidiaries are included in the consolidated financial statements effective on the day control is assumed by the Group. Consolidation is discontinued as of the day on which such control ends.
The change in the number of Group companies as of December 31, 2015 and 2014 respectively is shown below:
2015 2014
Included as of December 31 of previous year 252 227
Companies included for the first time 20 31
Company consolidations discontinued – 1 – 1
Business combinations – 9 – 5
Companies now consolidated using the equity method due to the sale of shares 0 0
Included as of December 31 of reporting year 262 252
87Glossary Group Management Report Consolidated Financial Statements Report of the Supervisory Board Notes

Deconsolidated companies had no material impact on the statement of financial position or the state-ment of income in fiscal year 2015.
The impact of company acquisitions on the statement of financial position at the time of initial con-solidation and on the principal items in the statement of income for fiscal year 2015 is shown below:
The total cost of the acquisitions made during the fiscal year, which was not significant individually or in aggregate, was € 58.2 million. Acquisition costs are comprised of cash payments in the amount of € 56.6 million and a conditional purchase price obligation in the amount of € 1.6 million. The final amount of the purchase price is not limited and will depend on future sales in some cases. The amount indicated represents the fair value of the actual purchase price obligation based on the agreed-upon parameters, which is estimated at between € 1.0 million and € 2.0 million.
In the context of acquisitions, unrecognized assets in the amount of € 9.4 million have been recognized in the reporting year so far. Receivables amounting to € 11.5 million (gross receivables: € 12.2 million) were acquired. The goodwill remaining after purchase price allocation amounted to € 12.4 million. This amount is not tax-deductible and is largely attributable to sales and production synergies.
Carrying amount€ ’000
Fair value
€ ’000
Non-current assets 31,992 41,438
Current assets 39,337 39,337
Acquired assets 71,329 80,775
Non-current provisions and liabilities 8,250 11,346
Current provisions and liabilities 20,338 20,381
Acquired liabilities 28,588 31,728
Net assets acquired 42,741 49,047
Non-controlling interests 424 555
Prorated net assets 42,317 48,492
Goodwill 12,389
Cost of acquisition 58,243
of which non-controlling interests 830
Cash and cash equivalents acquired 20,416
Cash outflow from acquisitions 37,826
Sales 14,375
Operating profit – 161
Consolidated net income – 547
88 Glossary Group Management Report Consolidated Financial Statements Report of the Supervisory Board Notes

If all of the acquisitions had been made at the start of the current year, the Group’s sales would have been € 45.8 million higher. After-tax earnings would have been € 1.5 million higher.
The acquisitions made during the fiscal year relate primarily to the expansion of product offerings in the B. Braun Avitum division and further expansion of the network of dialysis centers.
On June 1, 2015, an additional 74 percent of shares in Aquaboss Holding AG, Basel, Switzerland were acquired in the context of a share deal. The B. Braun Group now holds 100 percent of the shares in the company. In Aquaboss Holding and its subsidiary, Lauer Membran Wassertechnik GmbH in Wittlingen, a leading global manufacturer of premium water treatment system was acquired, adding to B. Braun’s extensive dialysis product offerings.
69.52 percent of shares in Teparak Medical Center Co. Ltd., Bangkok, Thailand, were acquired on April 1, 2015 as part of a share deal. This acquisition expanded the B. Braun Avitum’s division network of dialysis centers into a new market. The company operates two dialysis centers in Thailand.
On November 1, 2015, 100 percent of shares in DTZ Dialyse Traningszentren GmbH, Nuremberg, were acquired as part of a share deal. This acquisition strengthened our network of dialysis centers in Europe. The company operates 14 dialysis centers in Germany, three in Austria and one in Italy.
These changes did not adversely impact the comparability of the financial statements with those of the previous year.
Holdings in two joint ventures and 20 associated companies are recognized in the consolidated financial statements as of the reporting date. Three associated companies were not measured using the equity method on materiality grounds.
REVIUM Rückversicherung AG is included in the consolidated financial statements of B. Braun Melsun-gen AG as a wholly-owned subsidiary. The only business purpose of REVIUM Rückversicherung AG is to arrange reinsurance with companies (direct insurers) with which B. Braun Melsungen AG has taken out insurance contracts. It does not arrange any insurance contracts with third parties that extend beyond this and does not cover risks outside of the B. Braun Group. Due to its narrowly defined business purpose, REVIUM Rückversicherung AG has no material impact on the net assets, financial position, and earnings situation of the B. Braun Group as a whole.
As part of an asset-backed securities program, trade receivables for individual Group companies are assigned to a structured unit. This structured unit shall not be consolidated in the B. Braun Melsungen AG consolidated financial statements. Please see Note 18 for further information.
The complete list of shareholdings belonging to the Group, and to B. Braun Melsungen AG, is provided in Notes to the consolidated financial statements.
89Glossary Group Management Report Consolidated Financial Statements Report of the Supervisory Board Notes

The following companies are included in the consolidated financial statements of B. Braun Melsungen AG:
– B. Braun Facility Services GmbH & Co. KG, Melsungen, – Hansepharm GmbH & Co. KG, Roth, – Invitec GmbH & Co. KG, Duisburg, – MAT Adsorption Technologies GmbH & Co. KG, Elsenfeld, – medical experts online GmbH & Co. KG, Melsungen,
They meet the conditions of Section 264 b of the German Commercial Code (HGB) and are thus exempted from the requirement to compile notes and a management report as well as the publishing of financial statements.
The following companies meet the conditions of Section 264 (3) of the German Commercial Code (HGB) and are thus also exempted from the requirement to compile notes and a management report as well as the publishing of financial statements:
– Aesculap AG, Tuttlingen, – Aesculap Akademie GmbH, Tuttlingen, – Aesculap International GmbH, Tuttlingen, – Aesculap Suhl GmbH, Suhl, – Avitum Transcare Germany GmbH, Melsungen, – BBM Group Insurance Broker GmbH, Melsungen, – B. Braun Medical AG, Melsungen, – B. Braun Avitum AG, Melsungen, – B. Braun Avitum Saxonia GmbH, Radeberg, – B. Braun Surgical GmbH, Melsungen, – B. Braun Petzold GmbH, Melsungen, – B. Braun Mobilien GmbH, Melsungen, – B. Braun Nordamerika Verwaltungsgesellschaft mbH, Melsungen, – B. Braun International GmbH, Melsungen, – B. Braun TravaCare GmbH, Hallbergmoos, – B. Braun Vertriebs GmbH, Melsungen, – B. Braun VetCare GmbH, Tuttlingen, – Bibliomed medizinische Verlagsgesellschaft mbH, Melsungen, – CoachIT GmbH, Kassel, – Inko Internationale Handelskontor GmbH, Roth, – Nierenzentrum Bad Kissingen MVZ, GmbH, Bad Kissingen, – Nutrichem diät + pharma GmbH, Roth, – Paul Müller Technische Produkte GmbH, Melsungen, – PNS Professional Nutrition Services GmbH, Melsungen, – SteriLog GmbH, Tuttlingen, – Transcare Gesundheitsservice GmbH, Melsungen.
The companies listed above exercise their right to the exemptions.
90 Glossary Group Management Report Consolidated Financial Statements Report of the Supervisory Board Notes

PRINCIPLES OF CONSOLIDATION
a) SubsidiariesSubsidiaries, that is, such corporations that are controlled by B. Braun Melsungen AG, are included in the scope of consolidation. B. Braun Melsungen AG controls an entity when it is exposed to variable returns from its involvement with the investee, has entitlements to these, and has the ability to affect those returns through its power over the investee.
Subsidiaries are initially consolidated on the first day on which B. Braun Melsungen AG assumes right of disposal of the acquired company; they are excluded from consolidation once B. Braun Melsungen AG forfeits such control. Right of disposal occurs when B. Braun Melsungen AG has the ability to direct the relevant activities of the investee because it possesses the majority of the voting rights or other contractual rights. The acquisition of subsidiaries is recognized using the purchase method. The cost of acquiring a subsidiary is calculated based on payments of cash and cash equivalents, together with the fair value of assets transferred, shares issued, and / or liabilities acquired when initial control is gained. Acquisition-related costs for a business combination are expensed. Conditional purchase price compo-nents are recognized at fair value on the date of acquisition. Subsequent changes in the fair value of the contingent purchase price liability are recognized in profit or loss or in other comprehensive income. Acquisition costs that exceed the proportionate acquired share of the fair value of the subsidiary’s net assets are recognized as goodwill.
Assets, debts, and contingent liabilities identifiable upon a merger of companies are valued on initial consolidation at the fair values attributable to them, regardless of the size of any non-controlling inter-ests. For each company acquisition, it is determined on an individual basis whether the non-controlling interests in the company acquired are recognized at fair value or using the proportionate share of net assets of the acquired company. The option to recognize non-controlling interests at fair value is cur-rently not exercised. Therefore, non-controlling interests are recognized at their proportionate share of net assets and no goodwill is recognized for non-controlling interests.
Goodwill generated by the acquisition of non-controlling interests in fully consolidated companies is offset against retained earnings. Where assets and liabilities are measured at fair value for the gradual acquisition of companies fully consolidated for the first time, the revaluation of the “old” tranches is recognized through profit or loss.
Intercompany receivables and payables, as well as expenditure and income are offset against each other. Unrealized gains on transactions between companies within the Group are eliminated in full; unrealized losses are eliminated insofar as the resulting costs of acquisition or manufacture do not exceed the recoverable amount of the underlying asset. The recoverable amount is the higher of an asset’s fair value less costs to sell or its value in use.
Subsidiary companies’ accounting policies are, where necessary, adapted to those used to produce the consolidated financial statements.
91Glossary Group Management Report Consolidated Financial Statements Report of the Supervisory Board Notes
b) Associated companiesAssociated companies are those companies over which the Group has significant influence but no con-trol, generally accompanied by a holding of between 20 percent and 50 percent of the voting rights. Investments in associates are accounted for using the equity method and are initially recognized at cost. The Group’s investment in associated companies includes goodwill identified on acquisition (net of any accumulated impairments).
The Group’s share of associated companies’ post-acquisition profits or losses is recognized in the state-ment of income, and its share of post-acquisition changes in retained earnings is recognized in the Group’s retained earnings. The cumulative post-acquisition changes are adjusted against the carrying amount of the investment. When the Group’s share of losses in an associated company equals or exceeds its interest in the associated company, including any other unsecured receivables, the Group does not recognize further losses unless it has incurred obligations or made payments on behalf of the associated company.
Unrealized gains from transactions between the Group and its associated companies are, where mate-rial, eliminated to the extent of the Group’s share in the associate. Unrealized losses are also eliminated unless the transaction provides evidence of an impairment of the transferred asset. Accounting policies of associated companies were adjusted, where necessary, to align them with the policies of the Group.
c) Joint agreements Investments in joint agreements are classified as either a joint operation or a joint venture. The B. Braun Melsungen AG joint agreements represent joint ventures. These are included in the consolidated financial statements using the equity method. The shares are initially recognized at cost and subsequently updated in order to reflect the Group’s share in the profits and losses in other comprehensive income. When the Group’s share of losses in a joint venture equals or exceeds its interest in this company, including any other unsecured receivables, the Group does not recognize further losses unless it has incurred obligations or made payments on behalf of the joint venture company. Unrealized gains arising from transactions with joint ventures are eliminated in the amount equal to the Group’s share. Unrealized losses are also eliminated unless the transferred assets are impaired.
d) Owners of non-controlling interestsTransactions with owners of non-controlling interests are treated in the same way as transactions with parties within the Group. Sales of shares to owners of non-controlling interests result in gains or losses being recognized in the consolidated financial statements. Reciprocally, purchases of shares from owners of non-controlling interests result in the recognition of goodwill equivalent to the difference between the purchase price and the proportional carrying amount of the subsidiary’s net assets.
92 Glossary Group Management Report Consolidated Financial Statements Report of the Supervisory Board Notes

FOREIGN CURRENCY TRANSLATION
a) Functional and reporting currencyItems included in the financial statements of each of the Group’s subsidiaries are stated using the currency of the primary economic environment in which the company operates (functional currency).
The consolidated financial statements are stated in euro, that being the Group’s functional and reporting currency.
b) Transactions and balancesForeign currency transactions are translated into the functional currency using the prevailing exchange rate on the date of the transaction. Foreign exchange gains and losses resulting from the settlement of such transactions and from the translation of monetary assets and liabilities denominated in foreign currencies at the exchange rates prevailing on the reporting date are recognized in the statement of income.
Translation differences on monetary items, such as equities classified as available-for-sale financial assets, where fair value changes are directly recognized in equity, are reported as part of the gain or loss from fair value measurement. On the other hand, translation differences on non-monetary items, where fair value changes are directly recognized in equity, are included in the revaluation reserve in equity.
c) SubsidiariesAll items in the statements of income and statements of financial position of all Group subsidiaries that are in a currency other than the Group reporting currency are translated into the reporting currency as follows:
– Assets and liabilities are translated at the closing rate on the reporting date; – Income and expenses are translated at average exchange rates; and – all resulting exchange differences are recognized as a separate component of equity (under effects of foreign currency translation).
Goodwill and fair value adjustments arising from the acquisition of foreign companies are treated as assets and liabilities of the foreign company and translated at the closing rate.
Upon the sale of a foreign business operation, currency differences formerly recognized in equity are taken to the statement of income as gains or losses on disposal.
93Glossary Group Management Report Consolidated Financial Statements Report of the Supervisory Board Notes

COMPARISON OF SELECTED CURRENCIES
Closing mid-rate on reporting date Average annual rate
ISO code Dec. 31, 2015 Dec. 31, 2014 + –in %
2015 2014 + –in %
1 EUR = USD 1.089 1.216 – 10.4 1.110 1.329 – 16.5
1 EUR = GBP 0.735 0.779 – 5.6 0.726 0.806 – 10.0
1 EUR = CHF 1.082 1.202 – 10.0 1.068 1.215 – 12.1
1 EUR = MYR 4.676 4.250 10.0 4.332 4.347 – 0.4
1 EUR = JPY 131.120 145.030 – 9.6 134.285 140.377 – 4.3
94 Glossary Group Management Report Consolidated Financial Statements Report of the Supervisory Board Notes

ACCOUNTING POLICIES
INTANGIBLE ASSETS
a) GoodwillGoodwill represents the excess of the cost of an acquisition over the fair value of identifiable net assets and liabilities of the acquired company on the date of the acquisition. Goodwill on acquisitions of sub-sidiaries is included in intangible assets. Goodwill on acquisitions of associates is included in the carrying amount for investments in affiliates. Goodwill is tested for impairment at least once a year and is carried at cost less accumulated impairment losses. Write-downs of goodwill are reported under other operating expenses. Write-ups in value are not permitted. Gains and losses on the sale of companies include the carrying amount of the goodwill relating to the company sold.
b) Development CostsThe B. Braun Group invests a significant portion of its financial assets in research and development. In addition to internal research and development activities, the Group maintains numerous cooperative relationships with third parties.
Development expenses are defined as costs related to applying research findings or specialized knowl-edge for production planning and the manufacturing process before production or use has commenced. Development expenses are capitalized as intangible assets where it is regarded as likely that the project will be commercially successful, technically feasible, and the costs can be reliably measured. Other devel-opment costs that do not meet these criteria are expensed as they occur. Development costs that have previously been expensed are not capitalized in subsequent years. Capitalized development costs are shown as internally created intangible assets. Please see c below regarding the useful life, amortization method, and review of residual carrying amounts.
c) Other intangible assetsAcquired intangible assets are recognized at acquisition cost. Internally developed intangible assets where future economic benefit is likely to flow to the Group and the costs of the asset can be reliably measured are recognized at the cost incurred during the development phase. This includes all costs directly related to the development process, as well as appropriate portions of relevant overhead costs. Intangible assets with finite useful lives are amortized by the straight line method over a period of four to eight years. In cases were an exception is justified, the units of production method of depreciation is used.
Residual carrying amounts and expected useful lives are reviewed at each reporting date and adjusted if necessary.
95Glossary Group Management Report Consolidated Financial Statements Report of the Supervisory Board Accounting Policies

A write-down is taken at the reporting date if the recoverable amount of an intangible asset falls below its carrying amount.
Amortization expense related to other intangible assets is recognized in the functional areas that are using the respective asset. Write-ups to a maximum of amortized acquisition or manufacturing cost are shown under other operating income.
Intangible assets with indefinite useful lives, if present, are tested for impairment at least once a year. Besides goodwill, the Group did not own any intangible assets with indefinite useful lives in the reporting periods presented.
IMPAIRMENT OF NON-FINANCIAL ASSETS
At each reporting date, the carrying amounts of intangible assets and property, plant, and equipment are evaluated for indications of impairment. Where there is such an indication, an impairment test is conducted by comparing the carrying amount of the asset in question with its recoverable amount. The recoverable amount is the higher of an asset’s fair value less costs to sell or its value in use (net present value of expected free cash flows). The test can be conducted for a cash-generating unit (CGU) where the recoverable amount cannot be determined because the asset does not generate cash inflows that are largely independent of those from other assets. If an asset’s recoverable amount is less than its carrying amount, an impairment is recognized through profit and loss. This impairment can be reversed through profit and loss at a later point in time if the recoverable amount of the asset is later found to be higher. However, the increased carrying amount due to reversal may not be higher than what it would have been if the impairment had not been recognized.
PROPERTY, PLANT, AND EQUIPMENT
Tangible assets that are utilized during the ordinary course of business for more than one year are rec-ognized at their acquisition or manufacturing cost less depreciation using the straight line method. The manufacturing costs include all costs directly related to the manufacturing process and appropriate portions of relevant overhead costs. Scheduled depreciation of tangible assets is based on the straight-line method, in which the cost will be recognized over the estimated useful life until the residual value is reached. The useful lives applied correspond to the expected useful lives within the Group. In cases were an exception is justified, the units of production method of depreciation is used.
The following useful lives are the basis for depreciation of property, plant, and equipment:
Land is not depreciated.
Buildings 25 to 50 years
Technical plant and machinery* 5 to 20 years
Vehicles 6 years
Operating and office equipment 4 to 20 years
* 1-shift operation
96 Glossary Group Management Report Consolidated Financial Statements Report of the Supervisory Board Accounting Policies
Acquisition and manufacturing costs that are incurred at a later point are recognized as part of the asset or as a separate asset only when it is likely that the future economic benefits associated with the asset will flow to the Group and that the cost of the asset can be reliably measured. All other repairs and maintenance are reported as expenses in the statement of income of the fiscal year in which they occur.
Residual carrying amounts and expected useful lives are reviewed at each reporting date and adjusted if necessary.
A write-down is taken at the reporting date if the recoverable amount of an item of property, plant, and equipment falls below its carrying amount.
Depreciation expense related to property, plant, and equipment is recognized in the functional areas that are using the respective asset. Write-ups to a maximum of amortized acquisition or manufacturing cost are shown under other operating income. Gains and losses from disposals of property, plant, and equipment are recognized in the statement of income.
Government grants are recognized at fair value if receipt of the grant and the Group compliance with any conditions associated with the grant are highly likely.
Outside borrowing costs directly attributable to the acquisition, construction, or development of a qual-ifying asset are recognized as part of its acquisition or manufacturing cost.
FINANCE LEASING
Leasing contracts for intangible assets and property, plant, and equipment, where the Group carries the substantial risks and rewards of ownership of the leased asset, are classified as finance leases. At commencement of the lease term, finance leases are recognized as an asset at the lower of the fair value of the asset or the net present value of the minimum lease payments. Each leasing payment is apportioned between the finance charge and the reduction of the outstanding liability so as to produce a constant periodic rate of interest on the leasing liability. This liability is reported under financial lia-bilities excluding the interest payments. The interest portion of the leasing payment is recognized as expense through the statement of income. Assets held under finance leases are depreciated over the useful life of the asset. If there is no reasonable certainty that the Group will obtain ownership of an asset at the end of the lease, the asset is depreciated in full over the shorter of the lease term or the useful life of the asset.
FINANCIAL INVESTMENTS RECOGNIZED USING THE EQUITY METHOD OF ACCOUNTING AND OTHER FINANCIAL INVESTMENTS
Equity investments are initially recognized at cost and in subsequent periods at the amortized prorated net assets. The carrying amounts are increased or decreased annually by the share in profit, distributions, and other changes in equity. Goodwill is not reported separately, but is included in the value of partic-ipation. Goodwill is not amortized. Equity investments are written down when the recoverable amount of an investment in an associate falls below its carrying amount.
97Glossary Group Management Report Consolidated Financial Statements Report of the Supervisory Board Accounting Policies

CATEGORIES OF FINANCIAL ASSETS
Financial assets are classified using the following categories:
– Financial assets at fair value through profit and loss, – Loans and receivables, – Held-to-maturity financial assets, – Available-for-sale financial asset.
The categorization depends on the purpose for which the assets were acquired. Management determines the categorization of financial assets at initial recognition and re-evaluates this categorization on each reporting date.
a) Financial assets at fair value through profit and lossFinancial assets are measured at fair value through profit and loss if the financial asset is either held for trading or designated as being measured at fair value.
A financial asset is classified as held for trading if it has been acquired principally for the purpose of earning profits from short-term price changes. This category also includes derivatives that have not been designated as hedging instruments.
To date, the Group has not exercised the option of designating financial assets upon initial recognition as financial assets at fair value through profit and loss.
b) Loans and receivablesLoans and receivables with fixed or determinable payments that are not quoted on an active market are categorized as loans and receivables. At initial recognition, loans and receivables are measured at fair value plus transaction costs. They are subsequently measured using the effective interest method at amortized cost less any impairments. With the exception of current receivables, where the interest rate effect is not material, interest income is recognized using the effective interest method.
c) Held-to-maturity financial assetsBills of exchange and debt instruments with fixed or determinable payments and fixed maturities, which the Group has the intention and ability to hold to maturity, are categorized as “investments held-to-maturity.” At initial recognition, held-to-maturity investments are measured at fair value plus transaction costs. They are subsequently measured at amortized cost using the effective interest method less impairments.
d) Available-for-sale financial assetsListed shares and redeemable bonds held by the Group that are traded on an active market are recog-nized as available-for-sale financial assets and, at initial recognition, are measured at fair value plus
98 Glossary Group Management Report Consolidated Financial Statements Report of the Supervisory Board Accounting Policies
transaction costs. Investments in unlisted shares held by the Group that are not traded on an active market are also recognized at fair value as available- for-sale financial assets, to the extent that this can be reliably measured. Otherwise, they are subsequently measured at the cost of acquisition. Gains and losses arising from changes in fair value are included directly in the revaluation reserve (equity) rather than in other net financial income. Exceptions are impairment losses, interest calculated using the effective interest method, and gains and losses from foreign currency translation of monetary items, which are recognized in the income statement. If a financial asset is disposed of or is acknowledged to have an impairment, its accumulated gains and losses recognized in the revaluation reserve for financial investments up to that point are reclassified as profits or losses.
Dividends from equity instruments classified as available-for-sale financial assets are recognized in the statement of income as soon as the Group has acquired a right to the dividend.
IMPAIRMENT OF FINANCIAL ASSETS
With the exception of financial assets measured at fair value through profit and loss, financial assets are examined at each reporting date for the presence of any indications of impairment. Financial assets are considered impaired if, following one or more events that occurred after the initial recognition of the asset, there is objective evidence that the estimated future cash flows of the investment have changed adversely.
In the case of listed and unlisted equity investments that were categorized as available-for-sale, any significant or prolonged reduction in the fair value of the assets below their acquisition cost must be regarded as objective evidence of impairment.
For all other financial assets, the following may be objective evidence of impairment:
– Either the issuer or the counterparty is facing significant financial difficulties, – Default or delinquency in payments of interest or principal – A high probability that the debtor will enter bankruptcy or financial reorganization.
For some classes of financial assets, such as trade receivables, asset values for which no impairment has been determined on an individual basis are tested for impairment on a portfolio basis. Objective evidence of impairment on a portfolio of receivables is based on the past experience of the Group regarding pay-ments received, an increase in the frequency of payment defaults within the portfolio over the average borrowing period, and observable changes in the national or local economic environment with which the defaults can be linked.
In the case of financial assets valued at amortized cost, the impairment loss corresponds to the differ-ence between the carrying amount of the asset and the net present value of expected future cash flows determined on the basis of the original effective interest rate on the asset.
99Glossary Group Management Report Consolidated Financial Statements Report of the Supervisory Board Accounting Policies
An impairment leads to a direct reduction in the carrying amount of all the relevant financial assets, with the exception of trade receivables, whose carrying amount is reduced through a valuation adjust-ment account. If a trade receivables item is considered to be irrecoverable, it is written off against the valuation adjustment account. Changes in the carrying amount of the valuation adjustment account are recognized in the statement of income.
In the event that a financial asset, classified as available-for-sale, is considered to be impaired, gains and losses previously recognized in the revaluation reserve (equity) are reclassified to the statement of income in the period in which the impairment occurred.
If the level of impairment of a financial asset that is not an available-for-sale equity instrument decreases in a subsequent reporting period, and if the decrease can be related objectively to an event occurring after the impairment was recognized, the previously recognized impairment is reversed through the statement of income. The increased carrying amount due to reversal may not be higher than what the amortized cost would have been if the impairment had not been recognized.
In the case of equity instruments classified as available-for-sale, any impairments recognized in the past are not reversed. Any increase in the fair value after an impairment was recognized is recorded in the revaluation reserve (equity).
INVENTORY
Under IAS 2, inventories include assets that are held for sale in the ordinary course of business (finished products and merchandise), assets that are in the production process for sale in the ordinary course of business (work in progress), and assets that are consumed in the production process or performance of services (raw materials and supplies). Inventories are measured at the lower of cost and net realizable value, which is the estimated selling price in the ordinary course of business, less the estimated costs of completion and the estimated selling expenses, applying the weighted average cost formula. Related to this, the risks, in particular those arising from the storage period, reduced usability, etc., are taken into account by means of devaluations.
In addition to direct expenses, manufacturing costs include allocated raw material and production over-heads and depreciation related to production plant and equipment. Allocated costs related to pensions and voluntary social contributions made by the company are also included. Administrative expenses are included in the costs if they relate to manufacturing.
PROVISIONS FOR PENSIONS AND SIMILAR OBLIGATIONS
Our actuary calculates provisions for pensions and similar obligations using the projected unit credit method in accordance with IAS 19, taking into account future pay and pension increases and
100 Glossary Group Management Report Consolidated Financial Statements Report of the Supervisory Board Accounting Policies

staffing fluctuations. Revaluations of net financial debt are recognized in equity in the period in which they occur.
Net interest on net financial debt is reported under financial income.
Any excess of plan assets over the pension obligations is recognized as an asset only if it represents the net present value of the economic benefits.
OTHER PROVISIONS
Provisions are recognized when a present legal or constructive obligation has arisen for the Group as a result of a past event, an outflow of resources to settle the obligation is likely, and the amount can be estimated reliably. If a number of obligations of a similar type exist, the provisions are recognized at the most probable value for the population of events.
Provisions are recognized for onerous contracts if the expected benefit from the contractual claim is less than the expected costs to settle the obligation. Any associated assets are tested for impairment before such a provision is created.
Provisions due after more than one year are measured at discounted present value.
Provisions are released against the expense items for which they were created. If additions to provisions were recognized under other operating expenses, the release of these amounts is shown under the cor-responding other operating income item.
FINANCIAL DEBT
Financial liabilities are initially recognized at fair value less transaction costs. In subsequent periods, they are measured at amortized cost. Any difference between the amount disbursed (less transaction costs) and the repayment amount is spread across the term of the loan using the effective interest method and recognized in the statement of income.
Liabilities from loans are recognized as current liabilities unless the Group has the unconditional right to defer repayment of the liability to at least twelve months after the reporting date.
LIABILITIES
Financial liabilities comprise trade accounts payable and other liabilities, and are initially recognized at fair value less transaction costs.
101Glossary Group Management Report Consolidated Financial Statements Report of the Supervisory Board Accounting Policies
Current liabilities have a residual maturity of up to one year and are stated at their repayment or set-tlement amount. Non-current liabilities that are not the underlying transaction in permissible hedge accounting are recognized at the cost of acquisition.
Accruals and deferrals are recognized under other liabilities.
DERIVATIVE FINANCIAL INSTRUMENTS
Derivative financial instruments are recognized using trade date accounting. They are initially measured at their fair value on the date the contract is entered into. They are subsequently measured at their fair value as of each reporting date. The method of recording gains and losses depends on whether the deriv-ative financial instruments in question have been designated as hedging instruments and, if so, on the nature of the hedged item. B. Braun designates derivative financial instruments as a hedge against the risk of fluctuating payment flows in connection with expected future transactions that are highly likely to occur (cash flow hedge). On entering into a transaction, the Group documents the hedge relationship between the hedging instrument and the underlying transaction, the goal of its risk management, and the underlying hedging strategy. In addition, the assessment of whether the derivatives employed effec-tively compensate for the changes in the fair values or in the cash flows of the underlying transactions is documented at the time the hedging relationship is created and subsequently on an ongoing basis. The fair values of the various derivative financial instruments used for hedging purposes are recognized under other assets / liabilities. Changes in the valuation reserve for cash flow hedges are shown in the consolidated statement of changes in equity. The full fair value of derivative financial instruments designated as hedge instruments is shown as a non-current asset or liability if the residual term of the hedged underlying transaction is more than twelve months after the reporting date, and as a current asset or liability if it is shorter than that. Derivative financial instruments held for trading are recognized as current assets or liabilities unless the residual term is more than twelve months, in which case they are recognized as non-current assets or liabilities.
When a hedging transaction designated as a cash flow hedge expires, is sold, or the designation is deliberately reversed, or no longer meets the criteria to be accounted for as a hedging transaction, gains or losses accumulated in equity up to that point remain in equity and are only taken to the statement of income when the future transaction originally hedged occurs and is recognized in the statement of income. If the future transaction is no longer expected to occur, gains or losses accumulated in equity must be immediately reclassified to the income statement.
Certain derivative financial instruments are not eligible for hedge accounting. Note 32 provides additional explanatory information about the use of derivative financial instruments as part of risk management.
102 Glossary Group Management Report Consolidated Financial Statements Report of the Supervisory Board Accounting Policies

DEFERRED TAXES
Deferred taxes are recognized using the liability method for all temporary differences between the tax bases of assets and liabilities and their carrying amounts in the consolidated financial statements. If deferred tax arises from the initial recognition of an asset or liability in a transaction other than a busi-ness combination that at the time of the transaction affects neither accounting nor taxable profit or loss, however, it is not recognized. Deferred taxes are measured using tax rates and laws that have been enacted or substantially enacted as of the reporting date and are expected to apply when the related deferred tax assets are realized or the deferred tax liabilities are settled.
Deferred tax assets stem primarily from temporary differences between the tax bases of individual com-panies and the financial statements set forth using IFRS, and from consolidation. Deferred tax assets stemming from losses carried forward and tax credits are recognized to the extent that it is likely that future taxable income will be available against which the losses carried forward can be utilized.
Deferred tax liabilities arising from temporary differences in connection with investments in subsidiaries and associates are recognized except where the timing of the reversal of the temporary differences can be controlled by the Group and it is likely that the temporary differences will not be reversed in the foreseeable future. Please also see Note 10, “Income Taxes.”
103Glossary Group Management Report Consolidated Financial Statements Report of the Supervisory Board Accounting Policies

NOTES TO THE CONSOLIDATED STATEMENT OF INCOME (LOSS)
1 SALES
Sales include the fair value received for the sale of goods and services excluding sales tax, rebates, and discounts, and after eliminating intercompany sales. Sales are recognized as follows:
Sales resulting from the sale of products are recorded when the main risks and rewards associated with ownership have been transferred to the buyer and the collection of the associated receivables can be assumed with sufficient likelihood.
Estimates for sales reductions are based on experience. Adjustments are made if required by a change in conditions. No significant returns were recorded in the reporting period.
Sales resulting from the sale of services are recorded in the fiscal year during which the service is per-formed using the percentage of completion basis.
The following chart shows sales trends by division, region, and by type:
Sales by division 2015 € ’000 %
2014€ ’000 %
+ –in %
Hospital Care 2,855,924 46.6 2,527,766 46.5 13.0
Aesculap 1,662,905 27.1 1,497,729 27.6 11.0
OPM 740,611 12.1 643,895 11.9 15.0
B. Braun Avitum 846,256 13.8 737,922 13.6 14.7
Other sales 24,074 0.4 22,262 0.4 8.1
6,129,770 100.0 5,429,574 100.0 12.9
Sales by region 2015 € ’000 %
2014€ ’000 %
+ –in %
Germany 1,035,239 16.9 999,571 18.4 3.6
Europe 1,999,285 32.6 1,921,233 35.4 4.1
North America 1,428,257 23.3 1,090,076 20.1 31.0
Latin America 391,089 6.4 373,088 6.9 4.8
Asia-Pacific 1,073,426 17.5 869,906 16.0 23.4
Africa and the Middle East 202,474 3.3 175,700 3.2 15.2
6,129,770 100.0 5,429,574 100.0 12.9
104 Glossary Group Management Report Consolidated Financial Statements Report of the Supervisory Board Notes to the Consolidated Statement of Income (Loss)

2 COST OF GOODS SOLD
Cost of goods sold includes the manufacturing costs of goods sold and the acquisition costs of merchan-dise sold. In addition to direct costs such as material, personnel and energy costs, manufacturing costs contain production-related overhead expenses including depreciation of property, plant, and equipment. Cost of goods sold also includes inventory write-downs.
3 SELLING EXPENSES
Selling expenses include expenditures for marketing, sales organizations, and distribution. This category also contains the expenses related to customer training and consulting on technical product use.
4 RESEARCH AND DEVELOPMENT EXPENSES
Research and development expenses include costs for research, as well as for product and process development including expenditures for external services. All research costs are expensed at the time they are incurred.
Development costs are capitalized if all the conditions for capitalization under IAS 38 are met.
5 OTHER OPERATING INCOME
Sales by type 2015 € ’000 %
2014€ ’000 %
+ –in %
Sales of products 5,431,627 88.6 4,832,535 89.0 12.4
Sales of services 698,143 11.4 597,039 11.0 16.9
6,129,770 100.0 5,429,574 100.0 12.9
2015 € ’000
2014 € ’000
Currency translation gains 321,080 168,020
Additional income 18,044 26,909
Derivative financial instruments 21,526 9,033
Income from other periods 4,660 4,813
Proceeds from appreciation of current financial assets 2,502 5,134
Proceeds from the disposal of assets 2,792 2,002
Proceeds from the release of provisions 1,582 3,871
Other 24,101 25,834
396,287 245,616
105Glossary Group Management Report Consolidated Financial Statements Report of the Supervisory Board Notes to the Consolidated Statement of Income (Loss)

Currency translation gains mainly comprise gains from currency fluctuations between transaction and payment dates from receivables and payables denominated in foreign currencies, gains resulting from translation at the exchange rate prevailing on the reporting date, and gains resulting from forward exchange transactions in hedge accounting.
Ancillary revenues include in particular cost reimbursements from third parties and revenue from caf-eteria sales.
Changes in the fair value of forward foreign exchange contracts that are not designated for hedge accounting are reported under derivative financial instruments.
Other operating income includes primarily payments of damages as well as government grants related to income statement and miscellaneous items. Income-related grants are recognized in the period in which the corresponding expenses occur. These amounted to € 537,000 (previous year: € 1,465,000). During the fiscal year, grants of € 510,000 (previous year: € 1,709,000) were recognized through profit and loss. The grants were predominantly made to support structurally weak areas in Germany.
Other income includes numerous types of income; however their individual valuations are not materially significant.
6 OTHER OPERATING EXPENSES
Currency translation losses mainly comprise losses from currency fluctuations between transaction and payment dates from receivables and payables denominated in foreign currencies, losses resulting from translation at the exchange rate prevailing on the reporting date, and losses resulting from forward exchange transactions in hedge accounting.
Losses from impairment of current financial assets refer to value adjustments to trade receivables.
Changes in the fair value of forward foreign exchange contracts that are not designated for hedge accounting are reported under derivative financial instruments.
Other expenses include numerous types of expenses; however their individual valuations are not mate-rially significant.
2015 € ’000
2014 € ’000
Currency translation losses 376,190 181,662
Losses from impairment of current financial assets 16,728 8,578
Additions to provisions 5,243 2,617
Losses on the disposal of assets 6,359 5,392
Expenses from other periods 6,115 7,281
Derivative financial instruments 3,466 14,825
Other 46,308 40,461
460,409 260,816
106 Glossary Group Management Report Consolidated Financial Statements Report of the Supervisory Board Notes to the Consolidated Statement of Income (Loss)

7 FINANCIAL INVESTMENTS RECOGNIZED USING THE EQUITY METHOD OF ACCOUNTING
Net income from investments recognized using the equity method of accounting breaks down as follows:
8 NET FINANCIAL INCOME
Interest and similar expenses are primarily comprised of interest expense on financial liabilities. Expenses resulting from accruing interest from non-current other provisions are also recognized here.
9 OTHER NET FINANCIAL INCOME
Interest on derivative financial instruments is shown under net interest income.
10 INCOME TAXES
Income taxes include corporation tax and trade income taxes for German companies as well as compa-rable income-related taxes for companies in other countries. They are calculated on the basis of the tax regulations applicable to the individual company.
2015 € ’000
2014 € ’000
Income from financial investments recognized using the equity method 19,093 7,804
Expenses from financial investments recognized using the equity method – 180 – 510
18,913 7,294
2015 € ’000
2014 € ’000
Interest and similar income 5,198 3,099
Interest and similar expenses – 50,013 – 45,362
of which to affiliated companies (0) (0)
Interest expenses for pension provisions, less expected income from plan assets – 26,612 – 30,418
– 71,427 – 72,681
of which financial assets and liabilities not measured at fair value through profit and loss:
Interest income from discounting 1,144 704
Accrued interest expense – 2,833 – 3,141
2015 € ’000
2014 € ’000
Income from joint ventures (excluding income from financial investments recognized using the equity method) 15,191 51,186
Other net financial income – 18 – 886
15,173 50,300
107Glossary Group Management Report Consolidated Financial Statements Report of the Supervisory Board Notes to the Consolidated Statement of Income (Loss)

Deferred taxes stem from temporary differences between the tax base of the individual companies and the consolidated statement of financial position. They are measured using the liability method based on the application of anticipated future tax rates for the individual countries as of the realization date. Generally, these are based on the regulations in effect as of the reporting date. Deferred tax assets are offset only if the company has the legal right to settle current tax assets and current tax liabilities on a net basis and they are levied by the same tax authority. Income tax expenses and deferred taxes are as follows:
Deferred tax assets and deferred tax liabilities apply to differences stemming from recognition and measurement in the following items in the statement of financial position:
The amount of temporary differences related to holdings in subsidiaries and associates, as well as inter-ests in joint ventures for which according to IAS 12.39 no deferred tax liabilities were recognized, is € 4,557,000 (previous year: € 7,878,000).
2015 € ’000
2014 € ’000
Actual income taxes 123,536 104,209
Deferred taxes resulting from temporary differences 3,851 – 8,457
Deferred taxes resulting from losses carried forward – 1,585 – 4,426
125,802 91,326
Dec. 31, 2015 Dec. 31, 2014
Assets € ’000
Liabilities € ’000
Assets € ’000
Liabilities € ’000
Intangible assets 8,635 49,553 6,786 43,823
Property, plant, and equipment 4,294 193,260 1,626 156,672
Financial assets 491 8,036 71 8,045
Inventories 75,486 8,656 56,478 6,093
Trade accounts receivable 7,568 10,013 6,329 10,584
Pension provisions 165,536 368 174,879 187
Other provisions 24,163 863 18,751 1,172
Liabilities 53,308 534 53,555 1,330
Other items 17 3,474 5 4,342
339,498 274,757 318,480 232,248
of which non-current 201,641 256,226 204,077 214,378
Net balance – 175,017 – 175,017 – 148,135 – 148,135
164,481 99,740 170,345 84,113
Valuation allowance on deferred tax assets from temporary differences – 922 – – 457 –
Deferred taxes on tax credits 29,387 – 31,844 –
Losses carried forward (net, after valuation allowances) 10,493 – 8,791 –
203,439 99,740 210,523 84,113
108 Glossary Group Management Report Consolidated Financial Statements Report of the Supervisory Board Notes to the Consolidated Statement of Income (Loss)

Existing but not recognized tax losses carried forward can be used as follows:
Deferred tax assets for which utilization depends on future taxable profits in excess of the profits arising from the reversal of existing taxable temporary differences and where the company has incurred past losses amounted to € 6,655,000 (previous year: € 7,843,000). Recognition of these deferred tax assets is based on relevant forecasting, which justifies the expectation that they will be used.
Deferred taxes of € 125,321,000 (previous year: € 140,683,000) were recognized directly in equity This amount was primarily comprised of actuarial gains and losses related to pension obligations of € 115,502,000 (previous year: € 134,114,000), changes in the fair value of securities of € – 11,000 (pre-vious year: € – 11,000 and changes in the fair value of derivative financial instruments designated as cash flow hedges of € 1,278,000 (previous year: € 1,120,000).
The tax rate for B. Braun Melsungen AG is 29.0 percent (previous year: 28.3 percent). The tax expense which is calculated using B. Braun Melsungen AG’s tax rate can be reconciled to actual tax expense as follows:
Dec. 31, 2015 € ’000
Dec. 31, 2014 € ’000
Within one year 347 0
Within two years 378 0
Within three years 4,889 526
Within four years 0 4,881
Within five years or longer 3,714 1,466
9,328 6,873
Can be carried forward indefinitely 67,029 47,866
76,357 54,739
2015 € ’000
2014 € ’000
Tax rate of B. Braun Melsungen AG 29.0% 28.3%
Profit before tax 445,519 407,639
Expected income tax at parent company’s tax rate – 129,201 – 115,239
Differences due to other tax rates 6,745 4,291
Changes to deferred tax assets and liabilities due to changes in tax rates 1,515 3,750
Tax reductions due to tax-exempt income 26,766 27,715
Tax increases due to non-deductible expenses – 23,398 – 17,457
Addition / deduction of trade tax and similar foreign tax items – 1,861 – 1,459
Final withholding tax on profit distributions – 1,567 – 959
Tax credits 4,110 4,560
Tax expense relating to previous periods – 577 1,005
Change to valuation allowances on deferred tax assets – 11,248 – 1,476
Profit (loss) of financial investments recognized using the equity method 1,375 1,367
Other tax effects 1,539 2,576
Actual tax expense – 125,802 – 91,326
Effective tax rate 28.2% 22.4%
109Glossary Group Management Report Consolidated Financial Statements Report of the Supervisory Board Notes to the Consolidated Statement of Income (Loss)

11 EARNINGS PER SHARE
Earnings per share are calculated according to IAS 33 by dividing the consolidated net income less non-controlling interests by the number of shares in issue. The number of shares entitled to receive dividends remained unchanged at 19,404,000 during the fiscal year. There were no outstanding shares as of December 31, 2015 or December 31, 2014 that could have diluted the earnings per share. Earnings per share amounted to € 15.74 (previous year: € 15.21).
The dividends paid in 2015 for the previous fiscal year amounted to € 32 million (previous year: € 32 mil-lion). Dividends paid per share in 2015 were € 1.65 (previous year: € 1.65). The Management Board and Supervisory Board are proposing a dividend of € 1.65 per share for fiscal year 2015.
The proposed dividend must be ratified at the annual Shareholders’ Meeting on March 22, 2016. This dividend liability is not included in the consolidated financial statements.
12 OTHER NOTES TO THE CONSOLIDATED STATEMENT OF INCOME
Material costsThe following material costs are included in the cost of goods sold:
In the period under review, expenses related to inventory write-downs recognized in cost of goods sold were € 30,836,000 (previous year: € 30,860,000), and reversals of write-downs from previous periods (increase in net realizable value) of € 8,737,000 (previous year: € 9,214,000).
Payments under operating leases
Payments under operating leases include € 925,000 (previous year: € 1,054,000) of payments under sub-leases. Leasing expenses are predominantly included in cost of goods sold.
Personnel expenditures / employeesThe following personnel expenditures are recognized in the statement of income:
2015 € ’000
2014 € ’000
Expenses for raw materials, supplies and goods purchased 2,338,777 2,095,815
2015 € ’000
2014 € ’000
Payments made under operating leases 89,686 81,274
110 Glossary Group Management Report Consolidated Financial Statements Report of the Supervisory Board Notes to the Consolidated Statement of Income (Loss)
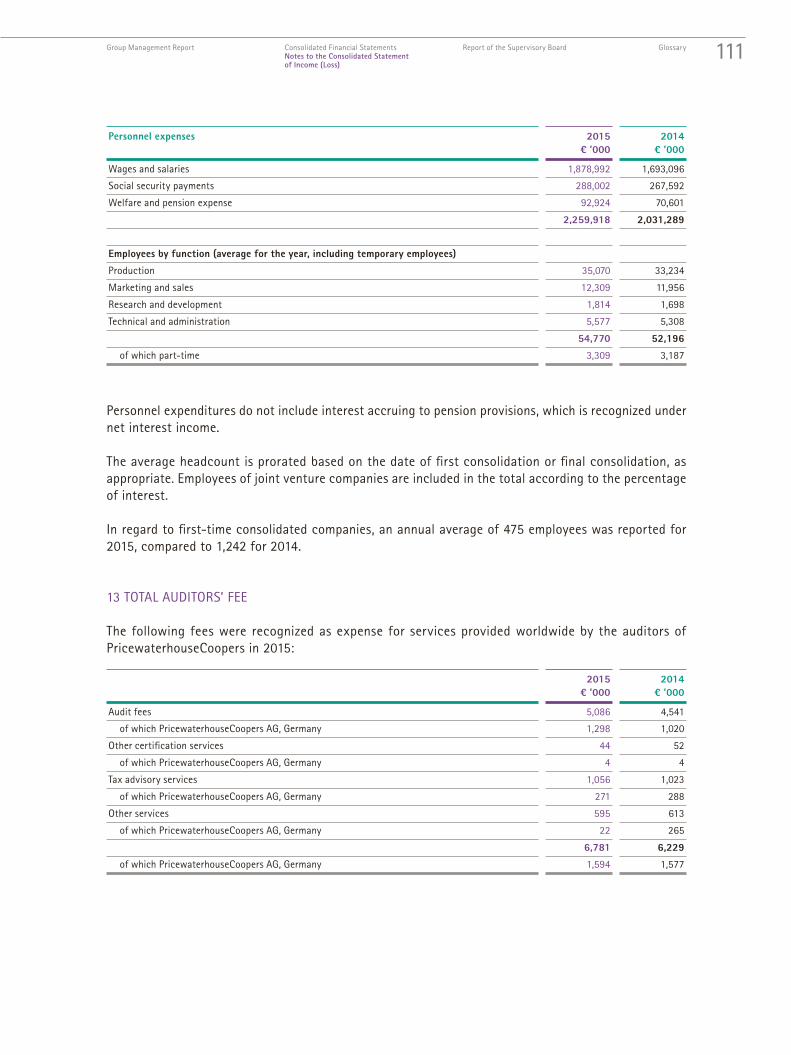
Personnel expenditures do not include interest accruing to pension provisions, which is recognized under net interest income.
The average headcount is prorated based on the date of first consolidation or final consolidation, as appropriate. Employees of joint venture companies are included in the total according to the percentage of interest.
In regard to first-time consolidated companies, an annual average of 475 employees was reported for 2015, compared to 1,242 for 2014.
13 TOTAL AUDITORS’ FEE
The following fees were recognized as expense for services provided worldwide by the auditors of PricewaterhouseCoopers in 2015:
Personnel expenses 2015 € ’000
2014 € ’000
Wages and salaries 1,878,992 1,693,096
Social security payments 288,002 267,592
Welfare and pension expense 92,924 70,601
2,259,918 2,031,289
Employees by function (average for the year, including temporary employees)
Production 35,070 33,234
Marketing and sales 12,309 11,956
Research and development 1,814 1,698
Technical and administration 5,577 5,308
54,770 52,196
of which part-time 3,309 3,187
2015 € ’000
2014 € ’000
Audit fees 5,086 4,541
of which PricewaterhouseCoopers AG, Germany 1,298 1,020
Other certification services 44 52
of which PricewaterhouseCoopers AG, Germany 4 4
Tax advisory services 1,056 1,023
of which PricewaterhouseCoopers AG, Germany 271 288
Other services 595 613
of which PricewaterhouseCoopers AG, Germany 22 265
6,781 6,229
of which PricewaterhouseCoopers AG, Germany 1,594 1,577
111Glossary Group Management Report Consolidated Financial Statements Report of the Supervisory Board Notes to the Consolidated Statement of Income (Loss)

The audit fees include all fees paid and outstanding to PricewaterhouseCoopers plus reimbursable expenses for the audit of the Group’s consolidated financial statements and the audit of the financial statements of B. Braun Melsungen AG and its subsidiaries. Fees for certification services mainly relate to certifications performed as part of acquisitions and divestitures, the examination of internal control systems, particularly IT systems, and expenses related to statutory or judicial requirements. The item tax advisory services mainly relates to fees for advice on completing tax returns, checking tax assessments, support for company audits or other inquiries conducted by the tax authorities as well as tax advice related to transfer pricing.
112 Glossary Group Management Report Consolidated Financial Statements Report of the Supervisory Board Notes to the Consolidated Statement of Income (Loss)

NOTES TO THE CONSOLIDATED STATEMENT OF FINANCIAL POSITION
14 INTANGIBLE ASSETS
Depreciation on intangible assets for the fiscal year was € 39.4 million (previous year: € 34.4 million) recognized in the income statement in functional costs.
The B. Braun Group capitalized € 13.0 million (previous year: € 13.8 million) of development costs during the year under review. All the prerequisites for capitalization were met.
Cost of acquisition or manufacture
Acquiredgoodwill
€ ’000
Licenses,trademarks
and other similar rights
€ ’000
Internally created
intangibleassets
€ ’000
Advancepayments
€ ’000
Total
€ ’000
January 1, 2014 123,544 363,293 63,703 79,801 630,341
Foreign currency translation – 6,007 9,872 8,197 – 22 12,040
Additions to scope of consolidation 51,980 34,321 0 4 86,305
Disposals from scope of consolidation 0 – 247 0 0 – 247
Additions 0 18,177 13,805 39,948 71,930
Transfers 0 14,777 0 – 10,741 4,036
Appreciation 0 0 0 0 0
Disposals 0 – 18,665 0 – 120 – 18,785
December 31, 2014 / January 1, 2015 169,517 421,528 85,705 108,870 785,620
Foreign currency translation 252 8,346 9,734 – 12 18,320
Additions to scope of consolidation 13,276 10,338 0 0 23,614
Disposals from scope of consolidation 0 0 0 0 0
Additions 556 16,907 12,961 26,822 57,246
Transfers 28 20,605 0 – 19,814 819
Appreciation 0 0 0 0 0
Disposals 0 – 4,104 0 – 3,954 – 8,058
December 31, 2015 183,629 473,620 108,400 111,912 877,561
Accumulated amortization 2015 503 294,420 15,990 0 310,913
Accumulated amortization 2014 503 256,681 13,810 0 270,994
Carrying amounts December 31, 2015 183,126 179,200 92,410 111,912 566,648
Carrying amounts December 31, 2014 169,014 164,847 71,895 108,870 514,626
Amortization in the fiscal year 0 34,698 761 3,912 39,371
of which unscheduled 0 50 0 3,912 3,962
113Glossary Group Management Report Consolidated Financial Statements Report of the Supervisory Board Notes to the Consolidated Statement of Financial Position

Goodwill is allocated to cash-generating units (CGUs) for the purpose of impairment testing. Each of these cash- generating units represents the Group’s investment by the primary reporting segment and the country of operation.
A summary of the distribution of goodwill by cash-generating unit and the assumptions for their impair-ment testing are listed below:
The recoverable amount of a CGU is determined by calculating its value in use. These calculations are based on projected cash flows derived from the three-year forecast approved by management.
Management has determined the budgeted gross margin based on past trends and expectations about future market trends. The weighted average growth rates largely correspond to the predictions from industry reports. The discount rates used are pre-tax rates and reflect the specific risks of the relevant cash-generating units.
If the actual future sales growth had been 10 percent less than the sales growth estimated by manage-ment on December 31, 2015, no impairment of goodwill would have occurred. The same holds true if the discount amount that was used to calculate the discounted cash flow had been 10 percent higher than management’s estimates.
Hospital Care
€ ’000
Aesculap
€ ’000
OPM
€ ’000
B. BraunAvitum€ ’000
Total
€ ’000
Dec. 31, 2014
Carrying amount of goodwill 43,113 9,627 19,153 97,121 169,014
Annual growth rate 2.6% 2.2% 2.1% 2.6%
Discount rate 8.0% 7.9% 7.6% 8.4%
Dec. 31, 2015
Carrying amount of goodwill 43,235 9,640 19,153 111,098 183,126
Annual growth rate 1.4% 1.2% 1.0% 1.4%
Discount rate 7.6% 7.5% 7.2% 7.9%
114 Glossary Group Management Report Consolidated Financial Statements Report of the Supervisory Board Notes to the Consolidated Statement of Financial Position

15 PROPERTY, PLANT, AND EQUIPMENT
Borrowing costs of € 6,291,000 (previous year: € 4,713,000) were capitalized in the year under review. An interest rate of 2.7 percent was utilized (previous year: 2.2 percent).
In the statement of financial position, government grants for investments in the amount of € 9,205,000 (previous year: € 1,459,000) have been deducted from the carrying amounts of the relevant assets. The current carrying amount of property, plant, and equipment acquired with government grants is € 41,021,000 (previous year: € 43,142,000). On the reporting date, no unfulfilled conditions or uncer-tainties with regards to market success existed, which would have required a modification of recognition in the statement of financial position.
The carrying amount of property, plant, and equipment with restricted title is € 13,532,000 (previous year: € 9,818,000).
Cost of acquisition or manufacture
Land andbuildings
€ ’000
Technicalplants andmachinery
€ ’000
Other plants,operating and officeequipment
€ ’000
Advancepayments
and assetsunder
construction
€ ’000
Total
€ ’000
January 1, 2014 1,507,142 2,250,829 774,720 615,756 5,148,447
Foreign currency translation 25,105 65,887 15,390 15,726 122,108
Additions to scope of consolidation 9,691 2,128 10,528 250 22,597
Disposals from scope of consolidation 0 – 2,720 – 1,076 0 – 3,796
Additions 80,185 121,799 75,772 366,031 643,787
Transfers 147,920 180,372 28,263 – 360,591 – 4,036
Disposals – 19,609 – 38,920 – 39,103 – 3,121 – 100,753
December 31, 2014 / January 1, 2015 1,750,434 2,579,375 864,494 634,051 5,828,354
Foreign currency translation 21,083 15,906 – 401 10,215 46,803
Additions to scope of consolidation 19,035 3,156 1,807 53 24,051
Additions 63,790 127,312 74,089 372,482 637,673
Transfers 140,084 220,141 30,724 – 391,768 – 819
Disposals – 16,253 – 34,022 – 32,781 – 5,059 – 88,115
December 31, 2015 1,978,173 2,911,868 937,932 619,974 6,447,947
Accumulated depreciation 2015 552,198 1,639,494 610,636 3,294 2,805,622
Accumulated depreciation 2014 493,980 1,473,407 557,566 849 2,525,802
Carrying amounts December 31, 2015 1,425,975 1,272,374 327,296 616,680 3,642,325
Carrying amounts December 31, 2014 1,256,454 1,105,968 306,928 633,202 3,302,552
Depreciation in the fiscal year 55,589 181,615 79,496 5,056 321,756
of which unscheduled 0 1,810 0 3,861 5,671
115Glossary Group Management Report Consolidated Financial Statements Report of the Supervisory Board Notes to the Consolidated Statement of Financial Position

16 FINANCE LEASING
Intangible assets and property, plant, and equipment include the following amounts for which the Group is lessee under a finance lease:
The minimum lease payments for liabilities under finance leases have the following maturities:
The two largest finance leasing agreements relate to the real estate for the Hospital Care Division’s LIFE facility (carrying amount € 25.5 million), and the Aesculap Division’s Benchmark factory (carrying amount € 15.9 million). These agreements have varying terms and conditions, interest rate adjustment clauses, and purchase options.
17 FINANCIAL INVESTMENTS AND JOINT VENTURES RECOGNIZED USING THE EQUITY METHOD OF ACCOUNTING AND OTHER FINANCIAL INVESTMENTS
The B. Braun Group has a 19.76 percent share in Rhön-Klinikum AG, which is headquartered in Bad Neustadt an der Saale. Rhön-Klinikum AG is a publicly traded private operator of hospitals, clinics, and medical centers. The B. Braun Group has significant influence over the company based on its percentage of voting rights and representation on its Supervisory Board.
Dec. 31, 2015 € ’000
Dec. 31, 2014 € ’000
Licenses, trademarks, and other similar rights 1,033 680
Accumulated amortization – 323 – 142
Buildings 133,521 133,581
Accumulated depreciation – 44,634 – 42,102
Technical plants and machinery 7,410 7,169
Accumulated depreciation – 5,321 – 4,738
Other plants, operating, and office equipment 12,840 11,218
Accumulated depreciation – 9,164 – 7,850
Net carrying amount 95,362 97,816
Dec. 31, 2015 Dec. 31, 2014
Nominal value
€ ’000
Discountamount€ ’000
Net present
€ ’000
Nominalvalue
€ ’000
Discountamount€ ’000
Net present
€ ’000
Less than one year 10,979 2,481 8,498 11,013 2,724 8,289
Between one and five years 33,007 6,459 26,548 30,508 7,527 22,981
Over five years 29,608 2,142 27,466 40,334 3,318 37,016
73,594 11,082 62,512 81,855 13,569 68,286
116 Glossary Group Management Report Consolidated Financial Statements Report of the Supervisory Board Notes to the Consolidated Statement of Financial Position

The company’s summarized financial information breaks down as follows:
Since Rhön-Klinikum AG’s net income for 2015 was not available at the B. Braun Group’s reporting date, the net income was estimated based on third quarter earnings. The balance sheet values are based on third quarter financial statements. The fair value of the investment as of the reporting date was € 362.2 million.
The reconciliation of financial information on the carrying value of the Group’s share is as follows:
The Group’s holdings in its other associated companies and joint ventures are as follows:
As of December 31, 2015, the goodwill of holdings in associated companies totaled € 16.5 million (pre-vious year: € 16.5 million).
Assets
€ ’000
Liabilities
€ ’000
Equity
€ ’000
Sales
€ ’000
Profit / loss
€ ’000
Totalearnings
€ ’000
Receiveddividends
€ ’000
2015
Rhön-Klinikum AG 1,774,686 702,383 1,072,303 964,043 65,970 65,970 10,588
Net carry-ing amountJanuary. 1,
2015€ ’000
Profit /loss
€ ’000
Capitalreduction
€ ’000
Dividendpayout
€ ’000
Net carry-ing amount
Dec. 31, 2015
€ ’000
Share incapital
19.76%
€ ’000
Change due tocapital
reduction€ ’000
Goodwill
€ ’000
Carrying amountDec. 31,
2015€ ’000
2015
Rhön- Klinikum AG 1,228,543 72,559 – 182,131 – 58,767 1,060,204 209,498 67,516 3,783 280,795
2015 € ’000
2014 € ’000
Other associated companies
Carrying value of shares 56,599 51,688
Share of profit / loss 2,960 1,638
Share of other income / expense 0 0
Share of net income 2,960 1,638
Joint ventures
Carrying value of shares 1,550 1,726
Share of profit / loss – 178 – 38
Share of other income / expense 0 0
Share of net income – 178 – 38
117Glossary Group Management Report Consolidated Financial Statements Report of the Supervisory Board Notes to the Consolidated Statement of Financial Position

Cost of acquisition Financial investments recognized using the
equity method of accounting
€ ’000
Other holdings
€ ’000
Loans tocompanies in
which theGroup holdsan interest
€ ’000
Securities
€ ’000
Other loans
€ ’000
Total
€ ’000
January 1, 2014 47,933 20,157 1,715 443,901 5,869 519,575
Foreign currency translation 0 0 14 0 2 16
Additions to scope of consolidation 1,722 3 0 0 0 1,725
Disposals from scope of consolidation 0 – 102,189 0 0 0 – 102,189
Additions 7,057 104,179 63 99,779 4,520 215,598
Transfers 274,771 0 0 – 274,771 0 0
Appreciation 0 0 0 0 0 0
Disposals 0 – 3,744 0 – 249,792 – 944 – 254,480
Fair value adjustments 0 0 0 – 18,394 0 – 18,394
December 31, 2014 / January 1, 2015 331,483 18,406 1,792 723 9,447 361,851
Foreign currency translation 581 0 – 89 0 0 492
Additions toscope of consolidation 514 1,275 0 0 34 1,823
Disposals fromscope of consolidation 0 – 65,567 – 1,275 0 0 – 66,842
Additions 8,739 77,858 0 4,634 852 92,083
Transfers – 2,375 2,375 0 0 0 0
Appreciation 0 0 0 0 0 0
Disposals 0 – 3,850 – 26 0 – 384 – 4,260
Fair value adjustments 0 0 0 – 172 0 – 172
December 31, 2015 338,942 30,497 402 5,185 9,949 384,975
Accumulated amortization 2015 0 29 0 0 20 49
Accumulated amortization 2014 0 29 0 0 20 49
Carrying amounts December 31, 2015 338,942 30,468 402 5,185 9,929 384,926
Carrying amounts December 31, 2014 331,483 18,377 1,792 723 9,427 361,802
Amortization in the fiscal year 0 0 0 0 0 0
118 Glossary Group Management Report Consolidated Financial Statements Report of the Supervisory Board Notes to the Consolidated Statement of Financial Position

18 TRADE RECEIVABLES
Age analysis of trade receivables
a) Non-impaired trade receivables
A significant proportion of the non-impaired and overdue trade receivables are attributable to receiv-ables from social security providers, government or government-sponsored companies. The decrease in receivables more than 180 days overdue is primarily attributable to receivables from state-run hospitals in Spain and Portugal.
b) Trade receivables for which specific impairments have been established
With regard to trade receivables that are neither impaired nor in arrears, there were no indications as of the reporting date that the debtors in question are not able to meet their payment obligations.
Total Not yetdue
Overdue up to
30 days
Overdue 31 to
60 days
Overdue 61 to
90 days
Overdue 91 to
180 days
Overdue more than
180 days
Dec. 31, 2014
Trade receivables 965,458 702,327 78,118 39,841 29,468 53,357 62,347
Dec. 31, 2015
Trade receivables 1,008,396 755,998 81,477 36,356 27,732 48,256 58,577
Total Not yetdue
Overdue up to
30 days
Overdue 31 to
60 days
Overdue 61 to
90 days
Overdue 91 to
180 days
Overdue more than
180 days
Dec. 31, 2014
Trade receivables 49,287 14,378 3,649 1,230 1,794 3,605 24,631
Impairment provisions – 21,056 – 3,380 – 1,410 – 611 – 367 – 1,122 – 14,166
Carrying amount 28,231 10,998 2,239 619 1,427 2,483 10,465
Dec. 31, 2015
Trade receivables 54,204 14,905 1,861 788 2,769 5,180 28,701
Impairment provisions – 27,899 – 3,862 – 1,004 – 345 – 1,508 – 3,630 – 17,550
Carrying amount 26,305 11,043 857 443 1,261 1,550 11,151
119Glossary Group Management Report Consolidated Financial Statements Report of the Supervisory Board Notes to the Consolidated Statement of Financial Position
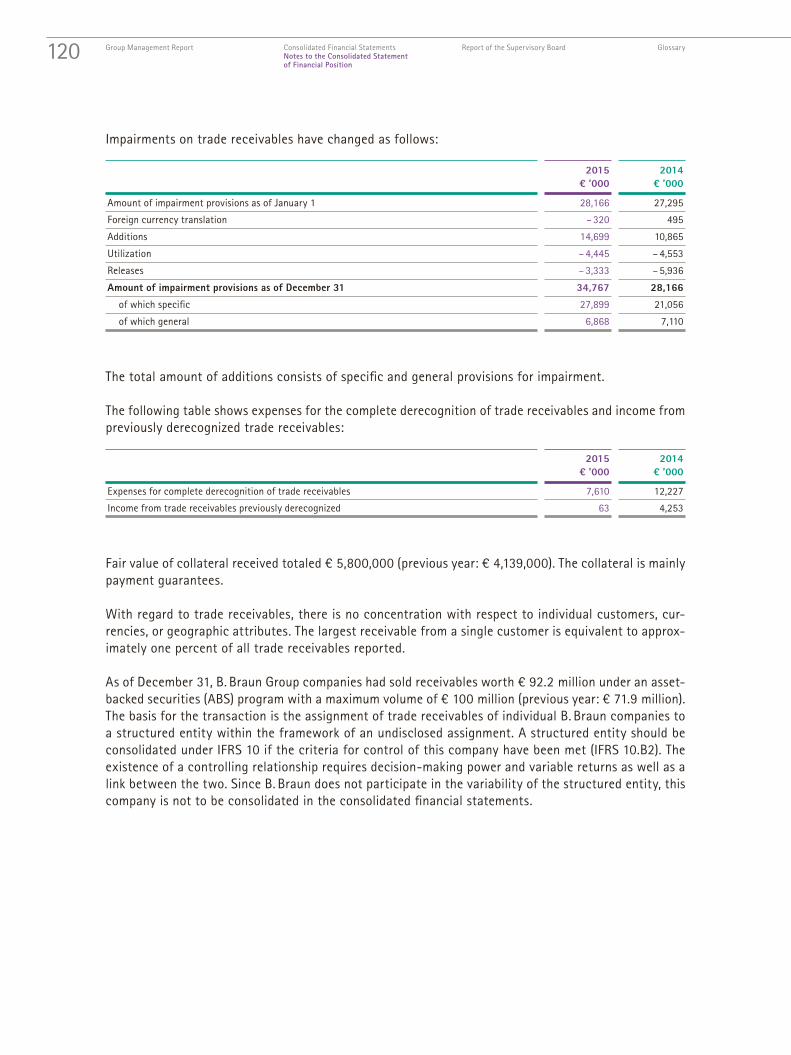
Impairments on trade receivables have changed as follows:
The total amount of additions consists of specific and general provisions for impairment.
The following table shows expenses for the complete derecognition of trade receivables and income from previously derecognized trade receivables:
Fair value of collateral received totaled € 5,800,000 (previous year: € 4,139,000). The collateral is mainly payment guarantees.
With regard to trade receivables, there is no concentration with respect to individual customers, cur-rencies, or geographic attributes. The largest receivable from a single customer is equivalent to approx-imately one percent of all trade receivables reported.
As of December 31, B. Braun Group companies had sold receivables worth € 92.2 million under an asset-backed securities (ABS) program with a maximum volume of € 100 million (previous year: € 71.9 million). The basis for the transaction is the assignment of trade receivables of individual B. Braun companies to a structured entity within the framework of an undisclosed assignment. A structured entity should be consolidated under IFRS 10 if the criteria for control of this company have been met (IFRS 10.B2). The existence of a controlling relationship requires decision-making power and variable returns as well as a link between the two. Since B. Braun does not participate in the variability of the structured entity, this company is not to be consolidated in the consolidated financial statements.
2015 € ’000
2014 € ’000
Amount of impairment provisions as of January 1 28,166 27,295
Foreign currency translation – 320 495
Additions 14,699 10,865
Utilization – 4,445 – 4,553
Releases – 3,333 – 5,936
Amount of impairment provisions as of December 31 34,767 28,166
of which specific 27,899 21,056
of which general 6,868 7,110
2015 € ’000
2014 € ’000
Expenses for complete derecognition of trade receivables 7,610 12,227
Income from trade receivables previously derecognized 63 4,253
120 Glossary Group Management Report Consolidated Financial Statements Report of the Supervisory Board Notes to the Consolidated Statement of Financial Position

The requirements for a receivables transfer according to IAS 39.15 are met, since the receivables are transferred according to IAS 39.18 a. Verification in accordance with IAS 39.20 shows that substan-tially all risks and rewards were neither transferred nor retained. The control of receivables remains with B. Braun, as a further sale of the receivables is economically detrimental for the structured entity. Therefore, according to IAS 39.30, B. Braun’s continuing involvement must be recognized. This includes, firstly, the maximum amount that B. Braun could conceivably have to pay back under the senior and third-ranking default guarantee assumed (€ 1,774,000, previous year: € 1,381,000). Secondly, the max-imum expected interest payments until payment is received for the carrying amount of the receivables transferred are recognized in the statement of financial position (€ 208,000, previous year: € 199,000). The fair value of the guarantee / interest payments to be assumed has been estimated at € 113,000 (previous year: € 91,000) and recorded under other liabilities.
Trade receivables include the following amounts in which the Group is a lessor in a finance lease:
The Group leases dialysis machines, infusion pumps and instrument sets in various operating leases. Total future lease payments under non-callable operating leases are as follows:
Dec. 31, 2015 Dec. 31, 2014
Maturity Grossinvestment
value
€ ’000
Interest portion
included
€ ’000
Present value
€ ’000
Grossinvestment
value
€ ’000
Interest portion
included
€ ’000
Present value
€ ’000
Less than one year 8,506 975 7,531 7,862 1,056 6,806
Between one and five years 13,312 1,239 12,073 11,569 782 10,787
Over five years 397 26 371 321 14 307
Total 22,215 2,240 19,975 19,752 1,852 17,900
Dec. 31, 2015 Dec. 31, 2014
Maturity Minimumlease
payments
€ ’000
Minimumlease
payments
€ ’000
Less than one year 2,192 4,058
Between one and five years 2,216 4,960
Over five years 1,665 1,776
Total 6,073 10,794
121Glossary Group Management Report Consolidated Financial Statements Report of the Supervisory Board Notes to the Consolidated Statement of Financial Position

19 OTHER ASSETS
Granted loans are mainly reported under other receivables and assets.
With regard to other receivables, as of the reporting date there were no indications that the debtors in question will not be able to meet their payment obligations. No material amounts of receivables were overdue or impaired as of the reporting date.
20 INVENTORIES
As in the previous year, no inventories were pledged as collateral for liabilities.
Dec. 31, 2015 Dec. 31, 2014
Residual term< 1 year
€ ’000
Residual term> 1 year
€ ’000
Residual term< 1 year
€ ’000
Residual term> 1 year
€ ’000
Other tax receivables 63,335 0 46,303 0Receivables from social security providers 594 558 777 451Receivables from employees 4,480 135 3,846 349Advance payments 12,520 1 10,083 417Accruals and deferrals 30,639 3,597 36,686 3,505
111,568 4,291 97,695 4,722
Receivables from derivative financial instruments 27,533 0 29,474 0Available-for-sale financial assets 9,456 0 7,793 0Held-for-trading financial assets 16,976 0 15,748 0Other receivables and assets 72,768 23,853 77,085 20,587
126,733 23,853 130,100 20,587238,301 28,144 227,795 25,309
Dec. 31, 2015 € ’000
Dec. 31, 2014 € ’000
Raw materials and supplies 252,247 245,227Impairment provisions – 17,661 – 14,607Raw materials and supplies – net 234,586 230,620
Work in progress 179,403 163,502Impairment provisions – 6,226 – 5,048Work in progress – net 173,177 158,454
Finished products, merchandise 716,866 682,589Impairment provisions – 67,904 – 65,947Finished products, merchandise - net 648,962 616,642
1,056,725 1,005,716
122 Glossary Group Management Report Consolidated Financial Statements Report of the Supervisory Board Notes to the Consolidated Statement of Financial Position

21 CASH AND CASH EQUIVALENTS
Cash and cash equivalents include cash on hand, demand deposits, other short-term highly liquid finan-cial assets with residual maturities of three months or less that are subject to no more than insignificant fluctuations in value, and bank overdraft facilities. In the statement of financial position, utilized bank overdraft facilities are shown under current financial liabilities as liabilities to banks.
Changes in cash and cash equivalents are shown in the consolidated statement of cash flows.
22 SUBSCRIBED CAPITAL
B. Braun Melsungen’s share capital of € 800 million is divided into 19,404,000 no-par-value bearer shares that are fully paid up. Each share without nominal value represents a calculated share of € 41.23 of the subscribed capital.
The Management Board is authorized, with the consent of the Supervisory Board, to increase the sub-scribed capital by up to € 100 million by issuing new bearer shares for cash on one or more occasions before December 31, 2018.
23 CAPITAL RESERVES AND RETAINED EARNINGS
The capital reserve includes the premium from previous capital increases of B. Braun Melsungen AG.
Retained earnings include past earnings of consolidated companies where these were not distributed, and the consolidated net income, net of the share attributable to non-controlling interests. The statutory reserve included in retained earnings amounts to € 29.4 million.
Changes in other provisions Reserve forcash flow
hedges
€ ’000
Fair value of available-
for-sale financial
assets
€ ’000
Reserve for currency
translationdifferences
€ ’000
Total
€ ’000
January 1, 2014 – 1,845 18,282 – 151,025 – 134,588
Changes recognized directly in equity (after taxes)
Changes in fair value of securities 0 – 18,277 0 – 18,277
Cash flow hedging instruments – 2,871 0 0 – 2,871
Changes due to currency translation 0 0 68,107 68,107
Total – 2,871 – 18,277 68,107 46,959
December 31, 2014 / January 1, 2015 – 4,716 5 – 82,918 – 87,629
Changes recognized directly in equity (after taxes)
Changes in fair value of securities 0 – 254 0 – 254
Cash flow hedging instruments – 140 0 0 – 140
Changes due to currency translation 0 0 – 2,460 – 2,460
Total – 140 – 254 – 2,460 – 2,854
December 31, 2015 – 4,856 – 249 – 85,378 – 90,483
123Glossary Group Management Report Consolidated Financial Statements Report of the Supervisory Board Notes to the Consolidated Statement of Financial Position

Changes in the other equity capital components are shown in the Consolidated Statement of Changes in Equity.
Claims of shareholders to dividend payments are reported as liabilities in the period in which the cor-responding resolution is passed.
24 NON-CONTROLLING INTERESTS
Non-controlling interests relate to third-party interests in the equity of consolidated subsidiaries They exist in particular at Almo-Erzeugnisse E. Busch GmbH, Bad Arolsen, B. Braun Medical AG, Emmenbrücke, Switzerland, and B. Braun Austria Ges.m.b.H., Maria Enzersdorf, Austria. The summarized financial infor-mation of these subsidiaries before inter-company elimination is as follows:
25 PROVISIONS FOR PENSIONS AND SIMILAR OBLIGATIONS
Payments of € 41.5 million are expected in 2016 (previous year: € 35,4 million). Of this, € 14.1 million is attributable to contributions to external plans (previous year: € 10,1 million) and € 27.4 million (previous year: € 25.3) to benefits that will be paid directly by the employer to beneficiaries.
The Group’s pension obligations relate to commitments under defined contribution and defined benefit plans.
attributable to
Assets
€ ’000
Liabilities
€ ’000
Sales
€ ’000
Profit / loss
€ ’000
Other earnings
€ ’000
Total earnings
€ ’000
Cash flow
€ ’000
Non-controlling interests
in %
Profit / loss
€ ’000
Dividends
€ ’000
2014
Almo-Erzeugnisse E. Busch GmbH, Germany 56,772 34,572 65,977 1,664 – 1,406 258 – 5 40 666 440
B. Braun Austria Ges.m.b.H., Austria 67,211 23,810 58,112 10,419 – 1,068 9,351 37 40 4,168 3,400
B. Braun Medical AG, Switzerland 337,085 125,098 268,221 23,491 – 30,038 – 6,547 – 1,689 49 11,511 4,836
461,068 183,480 392,310 35,574 – 32,512 3,062 – 1,657 16,344 8,676
2015
Almo-Erzeugnisse E. Busch GmbH, Germany 57,475 34,255 66,763 2,621 – 1,668 953 1 40 1,048 536
B. Braun Austria Ges.m.b.H., Austria 73,945 24,481 57,869 13,865 – 872 12,993 – 31 40 5,546 3,200
B. Braun Medical AG, Switzerland 360,618 127,717 298,191 13,153 – 33,502 – 20,349 44 49 6,445 5,659
492,038 186,453 422,823 29,639 – 36,042 – 6,403 14 0 13,039 9,395
Dec. 31, 2015 € ’000
Dec. 31, 2014 € ’000
Provisions for pension obligations 1,079,705 1,098,474
124 Glossary Group Management Report Consolidated Financial Statements Report of the Supervisory Board Notes to the Consolidated Statement of Financial Position

Changes in the other equity capital components are shown in the Consolidated Statement of Changes in Equity.
Claims of shareholders to dividend payments are reported as liabilities in the period in which the cor-responding resolution is passed.
24 NON-CONTROLLING INTERESTS
Non-controlling interests relate to third-party interests in the equity of consolidated subsidiaries They exist in particular at Almo-Erzeugnisse E. Busch GmbH, Bad Arolsen, B. Braun Medical AG, Emmenbrücke, Switzerland, and B. Braun Austria Ges.m.b.H., Maria Enzersdorf, Austria. The summarized financial infor-mation of these subsidiaries before inter-company elimination is as follows:
25 PROVISIONS FOR PENSIONS AND SIMILAR OBLIGATIONS
Payments of € 41.5 million are expected in 2016 (previous year: € 35,4 million). Of this, € 14.1 million is attributable to contributions to external plans (previous year: € 10,1 million) and € 27.4 million (previous year: € 25.3) to benefits that will be paid directly by the employer to beneficiaries.
The Group’s pension obligations relate to commitments under defined contribution and defined benefit plans.
attributable to
Assets
€ ’000
Liabilities
€ ’000
Sales
€ ’000
Profit / loss
€ ’000
Other earnings
€ ’000
Total earnings
€ ’000
Cash flow
€ ’000
Non-controlling interests
in %
Profit / loss
€ ’000
Dividends
€ ’000
2014
Almo-Erzeugnisse E. Busch GmbH, Germany 56,772 34,572 65,977 1,664 – 1,406 258 – 5 40 666 440
B. Braun Austria Ges.m.b.H., Austria 67,211 23,810 58,112 10,419 – 1,068 9,351 37 40 4,168 3,400
B. Braun Medical AG, Switzerland 337,085 125,098 268,221 23,491 – 30,038 – 6,547 – 1,689 49 11,511 4,836
461,068 183,480 392,310 35,574 – 32,512 3,062 – 1,657 16,344 8,676
2015
Almo-Erzeugnisse E. Busch GmbH, Germany 57,475 34,255 66,763 2,621 – 1,668 953 1 40 1,048 536
B. Braun Austria Ges.m.b.H., Austria 73,945 24,481 57,869 13,865 – 872 12,993 – 31 40 5,546 3,200
B. Braun Medical AG, Switzerland 360,618 127,717 298,191 13,153 – 33,502 – 20,349 44 49 6,445 5,659
492,038 186,453 422,823 29,639 – 36,042 – 6,403 14 0 13,039 9,395
Dec. 31, 2015 € ’000
Dec. 31, 2014 € ’000
Provisions for pension obligations 1,079,705 1,098,474
For defined contribution plans, the Group has no further payment obligations once the contributions have been paid. They are recognized as an operating expense in the amount of the contributions paid. In the previous fiscal year, this amount was € 24.2 million (previous year:€ 19.2 million). In addition, the Group makes contributions to statutory basic provision plans for employees in many countries (including Germany). However, since this covers various forms of social security bene-fits, no precise statement can be made with regard to the part that solely relates to retirement payments. These expenses are shown under social security payments, under Note 12 “Personnel Expenditures / Employees.”
Employees’ claims under defined benefit plans are based on legal or contractual provisions.
125Glossary Group Management Report Consolidated Financial Statements Report of the Supervisory Board Notes to the Consolidated Statement of Financial Position
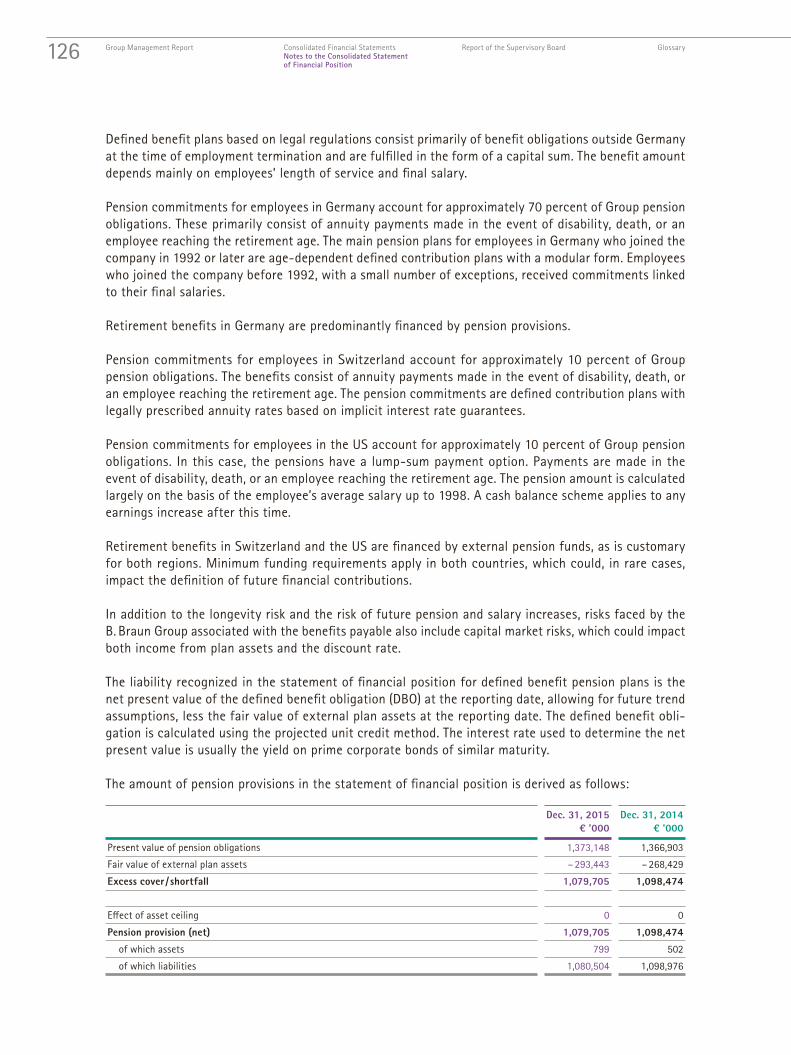
Defined benefit plans based on legal regulations consist primarily of benefit obligations outside Germany at the time of employment termination and are fulfilled in the form of a capital sum. The benefit amount depends mainly on employees’ length of service and final salary.
Pension commitments for employees in Germany account for approximately 70 percent of Group pension obligations. These primarily consist of annuity payments made in the event of disability, death, or an employee reaching the retirement age. The main pension plans for employees in Germany who joined the company in 1992 or later are age-dependent defined contribution plans with a modular form. Employees who joined the company before 1992, with a small number of exceptions, received commitments linked to their final salaries.
Retirement benefits in Germany are predominantly financed by pension provisions.
Pension commitments for employees in Switzerland account for approximately 10 percent of Group pension obligations. The benefits consist of annuity payments made in the event of disability, death, or an employee reaching the retirement age. The pension commitments are defined contribution plans with legally prescribed annuity rates based on implicit interest rate guarantees.
Pension commitments for employees in the US account for approximately 10 percent of Group pension obligations. In this case, the pensions have a lump-sum payment option. Payments are made in the event of disability, death, or an employee reaching the retirement age. The pension amount is calculated largely on the basis of the employee’s average salary up to 1998. A cash balance scheme applies to any earnings increase after this time.
Retirement benefits in Switzerland and the US are financed by external pension funds, as is customary for both regions. Minimum funding requirements apply in both countries, which could, in rare cases, impact the definition of future financial contributions.
In addition to the longevity risk and the risk of future pension and salary increases, risks faced by the B. Braun Group associated with the benefits payable also include capital market risks, which could impact both income from plan assets and the discount rate.
The liability recognized in the statement of financial position for defined benefit pension plans is the net present value of the defined benefit obligation (DBO) at the reporting date, allowing for future trend assumptions, less the fair value of external plan assets at the reporting date. The defined benefit obli-gation is calculated using the projected unit credit method. The interest rate used to determine the net present value is usually the yield on prime corporate bonds of similar maturity.
The amount of pension provisions in the statement of financial position is derived as follows:
Dec. 31, 2015 € ’000
Dec. 31, 2014 € ’000
Present value of pension obligations 1,373,148 1,366,903
Fair value of external plan assets – 293,443 – 268,429
Excess cover / shortfall 1,079,705 1,098,474
Effect of asset ceiling 0 0
Pension provision (net) 1,079,705 1,098,474
of which assets 799 502
of which liabilities 1,080,504 1,098,976
126 Glossary Group Management Report Consolidated Financial Statements Report of the Supervisory Board Notes to the Consolidated Statement of Financial Position

Asset valuation limitation changed as follow in the reporting year:
Pension expenses included in the statement of income consist of the following:
Pension obligations and external plan assets are reconciled as follows:
Dec. 31, 2015 € ’000
Dec. 31, 2014 € ’000
Asset ceiling at the beginning of the year 0 277
Interest on effect of asset ceiling 0 13
Change in asset ceiling 0 – 299
Effects from foreign currency translation 0 9
Asset ceiling at the end of the year 0 0
2015 € ’000
2014 € ’000
Current service costs 54,895 36,414
Plan changes / past service costs – 605 – 2,342
(Profit)/losses from plan settlements / lapsing – 2,153 1
Service costs 52,137 34,073
Interest expense on pension obligations 33,883 39,050
Interest income from external plan assets – 7,271 – 8,645
Interest income from reimbursement claims 0 0
Interest on asset ceiling 0 13
Net interest expense on pension obligations 26,612 30,418
Administrative expenses and taxes 783 721
Pension expense on defined benefit plans 79,532 65,212
of which operating profit 52,920 34,794
of which financial income 26,612 30,418
Pension expense on defined contribution plans 24,202 19,239
Pension expense 103,734 84,451
Dec. 31, 2015 € ’000
Dec. 31, 2014 € ’000
Present value of the obligation at the beginning of the year 1,366,903 1,032,283
Current service costs 54,895 36,414
Plan changes/(past service costs) – 605 – 2,342
Effects of plan settlements / lapsing – 2,153 1
Interest expense on pension obligations 33,883 39,050
Benefits paid excluding administrative costs – 38,234 – 42,486
Settlement payments – 3,291 – 190
Employee contributions 4,408 3,673
Effects of changes in financial assumptions – 83,976 271,362
Effects of changes in demographic assumptions – 1,315 1,189
Effects of experience adjustments 10,065 9,104
Effects of transfers 1,765 2,306
Effects of changes in scope of consolidation 0 – 1
Effects of foreign currency translation 30,803 16,540
Present value of the obligation at end of year 1,373,148 1,366,903
127Glossary Group Management Report Consolidated Financial Statements Report of the Supervisory Board Notes to the Consolidated Statement of Financial Position

The plan assets consist of the following:
The plan assets for which traded market prices exist are as follows:
Plan assets are not invested in the Group’s own financial instruments.
88 percent of the equities and similar securities are attributable to plan assets in the US. A pension committee oversees plan assets in the US and ensures adequate investment diversification.
Dec. 31, 2015 € ’000
Dec. 31, 2014 € ’000
Fair value of plan assets at the beginning of the year 268,429 234,096
Interest income from external plan assets 7,271 8,645
Revaluation of external plan assets – 6,522 12,441
Employer contributions 11,671 13,045
Employee contributions 4,408 3,673
Benefits paid and fund capital payments made (including administrative expenses) – 12,976 – 18,578
Settlement payments – 3,287 0
Effects of changes in scope of consolidation and transfers 1,738 2,259
Effects of foreign currency translation 22,711 12,848
Fair value of plan assets at the end of the year 293,443 268,429
Dec. 31, 2015 in %
Dec. 31, 2014 in %
Equities and similar securities 22 23
Bonds and other fixed-income securities 13 13
Real estate 0 0
Insurance contracts 55 53
Liquid assets 1 2
Derivatives 0 0
Investment funds 9 9
Other assets 0 0
100 100
Dec. 31, 2015 in %
Dec. 31, 2014 in %
Equities and similar securities 22 23
Bonds and other fixed-income securities 13 13
Real estate 0 0
Insurance contracts 0 0
Liquid assets 1 2
Derivatives 0 0
Investment funds 9 9
Other assets 0 0
45 47
128 Glossary Group Management Report Consolidated Financial Statements Report of the Supervisory Board Notes to the Consolidated Statement of Financial Position

In fiscal years 2015 and 2014, the pension provisions changed as follows:
The calculation of pension obligations was based on the following assumptions:
Pension expense was calculated using the following assumptions:
The percentages shown are weighted average assumptions. For the eurozone, a uniform discount rate of 2.8 percent (previous year: 2.4 percent) was applied to determine the pension obligations.
The Heubeck Mortality Tables 2005 G served as the basis for measuring German-defined benefit (pension) obligations, as in the previous year.
The results of the sensitivity analysis were determined using the previous year’s methods, changing one assumption at a time and leaving the other assumptions unchanged. No account was taken of any possible correlations between the individual assumptions.
2015 € ’000
2014* € ’000
Pension provision (net) January 1 1,098,474 798,464
Transfers 27 47
Payments – 37,720 – 37,876
Pension expense 79,532 65,212
Revaluations recognized in equity (OCI) – 68,700 268,927
of which effects from changes to financial assumptions of the pension obligation – 83,976 271,362
of which effects from changes to demographic assumptions of the pension obligation – 1,315 1,189
of which effects from experiential adjustments of the pension obligation 10,065 9,104
of which revaluation of external plan assets 6,522 – 12,441
of which other effects 4 – 287
Effects of changes in the scope of consolidation 0 – 1
Effects of foreign currency translation 8,092 3,701
Pension provision (net) December 31 1,079,705 1,098,474
* Previous year’s figures adjusted due to transition to the new version of IAS 19
Dec. 31, 2015 in %
Dec. 31, 2014 in %
Discount rate 2.7 2.5
Future salary increases 2.8 2.9
Future pension increases 1.5 1.5
2015 in %
2014 in %
Discount rate for calculating interest expense 2.5 3.8
Discount rate for calculating current service costs 2.6 4.1
Future salary increases 2.9 2.9
Future pension increases 1.5 1.7
129Glossary Group Management Report Consolidated Financial Statements Report of the Supervisory Board Notes to the Consolidated Statement of Financial Position

The results of the sensitivity analysis were as follows:
Obligation-reducing sensitivities have a comparable effect.
The weighted duration of the obligation is 18 years (previous year: 21 years).
26 OTHER PROVISIONS
The major provisions categories changed as follows:
Obligation-increasing effect 2015 in %
2014 in %
Discount rate reduced by 25 basis points 4 4
Future salary increases increased by 25 basis points 1 1
Future pension increases increased by 25 basis points 2 2
Life expectancy increased by 1 year 3* 3*
*Effect within Germany
Other non-current provisions Personnelexpenditures
€ ’000
Uncertainliabilities
€ ’000
Other
€ ’000
Total
€ ’000
January 1, 2014 57,293 7,421 9,069 73,783
Foreign currency translation 1,725 – 86 – 19 1,620
Changes in scope of consolidation 113 0 13 126
Accrued interest 0 0 0 0
Transfers 0 0 0 0
Utilization – 3,689 – 2,052 – 943 – 6,684
Reversals – 694 – 355 – 380 – 1,429
Additions 9,749 1,990 503 12,242
December 31, 2014 / January 1, 2015 64,497 6,918 8,243 79,658
Foreign currency translation 2,055 – 842 – 162 1,052
Changes in scope of consolidation 0 0 0 0
Accrued interest 0 0 0 0
Transfers 0 0 0 0
Utilization – 3,199 – 1,529 – 466 – 5,194
Reversals – 385 – 14 0 – 399
Additions 18,770 1,976 2,373 23,118
December 31, 2015 81,738 6,509 9,988 98,235
130 Glossary Group Management Report Consolidated Financial Statements Report of the Supervisory Board Notes to the Consolidated Statement of Financial Position

Non-current provisions for personnel expenditures primarily consist of provisions for partial retirement plans and anniversary payments.
Other provisions mainly consist of provisions for other obligations in the area of personnel and social ser-vices, guarantees, possible losses from contracts, legal and consulting fees, and a number of identifiable individual risks. The additional other provisions refer predominantly to outstanding invoices, bonuses, actuarial provisions, and provisions for not yet settled insurance claims of REVIUM Rückversicherung AG, Melsungen.
The release of provisions affecting net income is primarily attributable to the release of provisions for potential losses in Malaysia (€ 3,749,000) and for warranties in the US (€ 1,028,000).
The majority of non-current provisions will result in payments due within five years.
Other current provisions Personnelexpenditures
€ ’000
Warranties
€ ’000
Uncertainliabilities
€ ’000
Other
€ ’000
Total
€ ’000
January 1, 2014 2,180 8,113 6,967 19,941 37,201
Foreign currency translation 79 417 195 1,229 1,920
Transfers 0 0 0 0 0
Translation scope of consolidation 571 10 56 292 929
Utilization – 1,880 – 7,637 – 1,889 – 8,794 – 20,200
Reversals – 636 – 91 – 1,087 – 4,880 – 6,694
Additions 1,651 7,920 3,218 13,685 26,474
December 31, 2014 / January 1, 2015 1,965 8,732 7,460 21,473 39,630
Foreign currency translation 86 240 382 – 190 518
Transfers 0 0 0 0 0
Translation scope of consolidation 842 0 0 2,893 3,735
Utilization – 1,603 – 6,126 – 1,656 – 10,812 – 20,198
Reversals – 568 – 1,378 – 464 – 5,387 – 7,797
Additions 2,411 8,310 6,895 16,128 33,744
December 31, 2015 3,133 9,778 12,617 24,105 49,632
131Glossary Group Management Report Consolidated Financial Statements Report of the Supervisory Board Notes to the Consolidated Statement of Financial Position

27 FINANCIAL LIABILITIES
Other financial liabilities include € 13,427,000 in advance payments received for orders (previous year: € 11,790,000).
Term structure of financial liabilities:
Under the B. Braun Incentive Plan, B. Braun Melsungen AG offers a series of profit participation rights, which may be acquired by eligible managers on a voluntary basis. With the issuance of profit participa-tion rights, the company grants employees profit-sharing rights in the form of participation in the profit and losses of B. Braun Melsungen AG in return for their investment of capital.
Each profit participation right has a ten-year term. Interest on the rights is linked to the dividends paid to shareholders in B. Braun Melsungen AG, and the repayment amount is linked to the Group’s equity.
Dec. 31, 2015 € ’000
Dec. 31, 2014 € ’000
Non-current liabilities
Profit participation rights 90,897 82,169
Liabilities to banks 977,593 1,106,879
Liabilities under finance leases 29,990 32,793
Liabilities under finance leases with affiliated companies 24,003 27,065
Liabilities under borrowings from non-banks 32,508 35,529
Other financial liabilities 0 0
1,154,991 1,284,435
Current liabilities
Profit participation rights 11,238 9,641
Liabilities to banks 604,385 434,786
Liabilities under finance leases 5,457 5,469
Liabilities under finance leases with affiliated companies 3,062 2,958
Liabilities under borrowings from non-banks 103,920 95,427
Liabilities under bills of exchange 20,375 19,581
Other financial liabilities 19,937 17,856
768,374 585,718
Total financial liabilities 1,923,365 1,870,153
Dec. 31, 2015 € ’000
Dec. 31, 2014 € ’000
Due within one year 768,374 585,718
Due in one to five years 693,201 885,615
Due in over five years 461,790 398,820
1,923,365 1,870,153
132 Glossary Group Management Report Consolidated Financial Statements Report of the Supervisory Board Notes to the Consolidated Statement of Financial Position

As an incentive for the investment made by employees, the company offers an entitlement bonus of 25 percent in the form of additionally assigned participation rights. The entitlement bonus is paid to employees two years after their in-vestment. The additional profit participation rights are recognized as expenses in the corresponding periods.
As of December 31, 2015, a total of 690,351 rights had been issued. The years of issue are as follows:
The B. Braun Melsungen AG, together with several subsidiaries and twelve banks, concluded a new syn-dicated loan agreement for € 400 million in March 2012. The loan may be used by the borrowers as revolving credit in EUR, or alternatively in partial sums in USD and GBP, and bears a variable interest rate based on Euribor and Libor for the currency in question. In addition, the agreement allows for an adjustment to the interest margin depending on the B. Braun Group’s net financial debt (leverage ratio). In May 2014, the parties agreed to extend the term of the original credit agreement that was supposed to end on March 23, 2017 to May 21, 2019. In addition, B. Braun has been granted the right to extend the contract by one year on two separate occasions upon consent of the banks. The first extension (to May 2020), with a volume of € 367.5 million, was agreed upon with the banks in May 2015. Under the terms of the syndicated loan agreement, B. Braun is required to comply with certain financial ratios, including in particular a minimum equity ratio, which is calculated by taking the entity’s total assets and dividing them by its total equity, and maximum leverage ratio, in other words the net financial debt to EBITDA ratio. Both of these ratios will be calculated on the basis of consolidated figures for the B. Braun Group, subject to adjustments as agreed under the syndicated loan. Under the agreement, the equity ratio must not fall below 25 percent and the leverage ratio must not exceed 3.25. During the fiscal year and as of the reporting date, both ratios were fully complied with.
In a measure designed to manage the maturities of its debt, B. Braun Melsungen AG in 2015 voluntarily redeemed € 90.5 million in existing variable-interest promissory notes early and issued € 100 million in new promissory notes. The notes mature after 5.25 years (€ 13 million), 7.25 years (€ 53.5 million) and 9.25 years (€ 33.5 million). The promissory notes were predominantly underwritten by German banks, whose existing notes were redeemed early.
At December 31, 2015, the Group has unutilized credit lines in different currencies totaling € 1,011.7 mil-lion (previous year: € 1,164.6 million).
Interest rates on EUR loans were up to 5.40 percent per annum for non-current loans, depending on the length of the interest-rate lock-in period.
Year of issue Number
2006 61,186
2007 66,107
2008 93,927
2009 69,123
2010 80,217
2011 69,202
2012 54,071
2013 69,276
2014 62,481
2015 64,761
690,351
133Glossary Group Management Report Consolidated Financial Statements Report of the Supervisory Board Notes to the Consolidated Statement of Financial Position
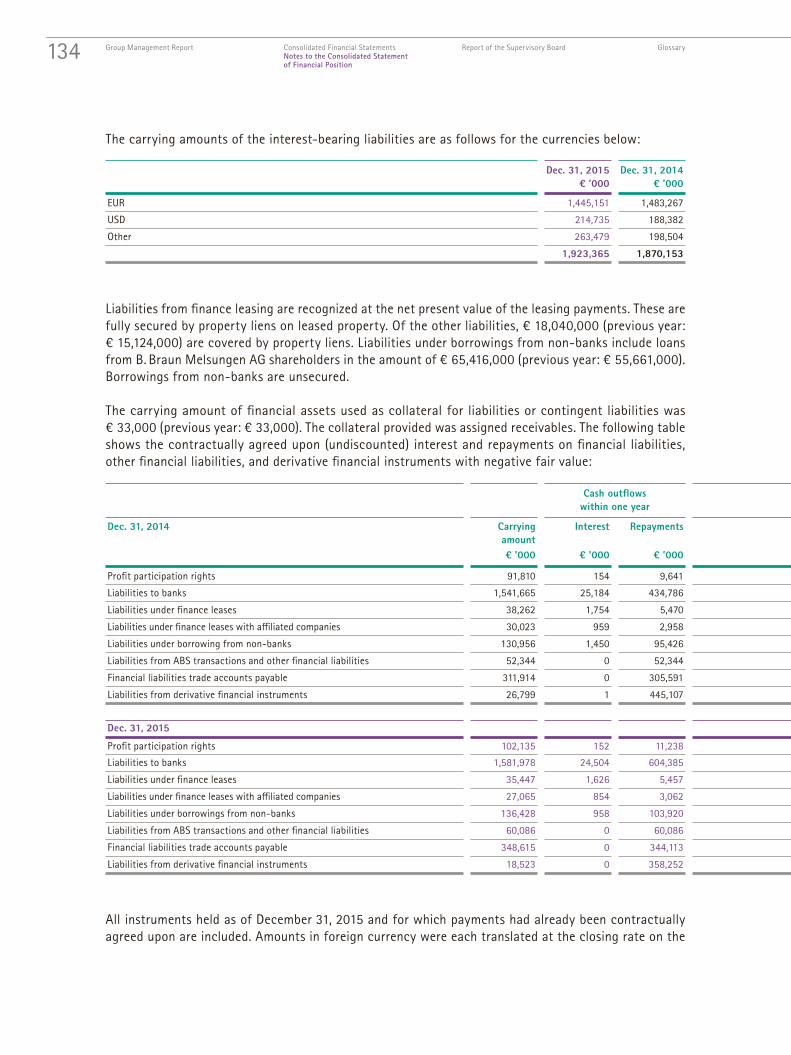
The carrying amounts of the interest-bearing liabilities are as follows for the currencies below:
Liabilities from finance leasing are recognized at the net present value of the leasing payments. These are fully secured by property liens on leased property. Of the other liabilities, € 18,040,000 (previous year: € 15,124,000) are covered by property liens. Liabilities under borrowings from non-banks include loans from B. Braun Melsungen AG shareholders in the amount of € 65,416,000 (previous year: € 55,661,000). Borrowings from non-banks are unsecured.
The carrying amount of financial assets used as collateral for liabilities or contingent liabilities was € 33,000 (previous year: € 33,000). The collateral provided was assigned receivables. The following table shows the contractually agreed upon (undiscounted) interest and repayments on financial liabilities, other financial liabilities, and derivative financial instruments with negative fair value:
All instruments held as of December 31, 2015 and for which payments had already been contractually agreed upon are included. Amounts in foreign currency were each translated at the closing rate on the
Dec. 31, 2015 € ’000
Dec. 31, 2014 € ’000
EUR 1,445,151 1,483,267
USD 214,735 188,382
Other 263,479 198,504
1,923,365 1,870,153
Cash outflows within one year
Cash outflowswithin one to two years
Cash outflowswithin two to five years
Cash outflowswithin five to ten years
Cash outflowsafter ten years
Dec. 31, 2014 Carrying amount€ ’000
Interest
€ ’000
Repayments
€ ’000
Interest
€ ’000
Repayments
€ ’000
Interest
€ ’000
Repayments
€ ’000
Interest
€ ’000
Repayments
€ ’000
Interest
€ ’000
Repayments
€ ’000
Profit participation rights 91,810 154 9,641 138 9,977 305 32,427 187 39,765 0 0
Liabilities to banks 1,541,665 25,184 434,786 23,999 188,510 45,578 609,806 17,780 308,563 0 0
Liabilities under finance leases 38,262 1,754 5,470 1,546 4,508 3,221 9,338 2,216 18,216 82 730
Liabilities under finance leases with affiliated companies 30,023 959 2,958 854 3,062 1,899 9,850 1,020 14,153 0 0
Liabilities under borrowing from non-banks 130,956 1,450 95,426 824 6,284 765 24,765 0 4,166 0 315
Liabilities from ABS transactions and other financial liabilities 52,344 0 52,344 0 0 0 0 0 0 0 0
Financial liabilities trade accounts payable 311,914 0 305,591 0 1,898 0 3,397 0 1,028 0 0
Liabilities from derivative financial instruments 26,799 1 445,107 3 12,489 10 13,312 0 0 0 – 444,109
Dec. 31, 2015
Profit participation rights 102,135 152 11,238 135 12,173 293 35,514 185 43,210 0 0
Liabilities to banks 1,581,978 24,504 604,385 21,504 182,344 34,918 416,896 14,535 378,353 0 0
Liabilities under finance leases 35,447 1,626 5,457 1,338 7,014 2,821 9,241 1,489 13,176 42 559
Liabilities under finance leases with affiliated companies 27,065 854 3,062 746 3,170 1,560 9,802 613 11,031 0 0
Liabilities under borrowings from non-banks 136,428 958 103,920 770 18,304 494 11,715 0 2,420 0 69
Liabilities from ABS transactions and other financial liabilities 60,086 0 60,086 0 0 0 0 0 0 0 0
Financial liabilities trade accounts payable 348,615 0 344,113 0 81 0 2,350 0 2,071 0 0
Liabilities from derivative financial instruments 18,523 0 358,252 – 1 1,597 1 685 0 0 0 – 342,011
134 Glossary Group Management Report Consolidated Financial Statements Report of the Supervisory Board Notes to the Consolidated Statement of Financial Position

The carrying amounts of the interest-bearing liabilities are as follows for the currencies below:
Liabilities from finance leasing are recognized at the net present value of the leasing payments. These are fully secured by property liens on leased property. Of the other liabilities, € 18,040,000 (previous year: € 15,124,000) are covered by property liens. Liabilities under borrowings from non-banks include loans from B. Braun Melsungen AG shareholders in the amount of € 65,416,000 (previous year: € 55,661,000). Borrowings from non-banks are unsecured.
The carrying amount of financial assets used as collateral for liabilities or contingent liabilities was € 33,000 (previous year: € 33,000). The collateral provided was assigned receivables. The following table shows the contractually agreed upon (undiscounted) interest and repayments on financial liabilities, other financial liabilities, and derivative financial instruments with negative fair value:
All instruments held as of December 31, 2015 and for which payments had already been contractually agreed upon are included. Amounts in foreign currency were each translated at the closing rate on the
Dec. 31, 2015 € ’000
Dec. 31, 2014 € ’000
EUR 1,445,151 1,483,267
USD 214,735 188,382
Other 263,479 198,504
1,923,365 1,870,153
Cash outflows within one year
Cash outflowswithin one to two years
Cash outflowswithin two to five years
Cash outflowswithin five to ten years
Cash outflowsafter ten years
Dec. 31, 2014 Carrying amount€ ’000
Interest
€ ’000
Repayments
€ ’000
Interest
€ ’000
Repayments
€ ’000
Interest
€ ’000
Repayments
€ ’000
Interest
€ ’000
Repayments
€ ’000
Interest
€ ’000
Repayments
€ ’000
Profit participation rights 91,810 154 9,641 138 9,977 305 32,427 187 39,765 0 0
Liabilities to banks 1,541,665 25,184 434,786 23,999 188,510 45,578 609,806 17,780 308,563 0 0
Liabilities under finance leases 38,262 1,754 5,470 1,546 4,508 3,221 9,338 2,216 18,216 82 730
Liabilities under finance leases with affiliated companies 30,023 959 2,958 854 3,062 1,899 9,850 1,020 14,153 0 0
Liabilities under borrowing from non-banks 130,956 1,450 95,426 824 6,284 765 24,765 0 4,166 0 315
Liabilities from ABS transactions and other financial liabilities 52,344 0 52,344 0 0 0 0 0 0 0 0
Financial liabilities trade accounts payable 311,914 0 305,591 0 1,898 0 3,397 0 1,028 0 0
Liabilities from derivative financial instruments 26,799 1 445,107 3 12,489 10 13,312 0 0 0 – 444,109
Dec. 31, 2015
Profit participation rights 102,135 152 11,238 135 12,173 293 35,514 185 43,210 0 0
Liabilities to banks 1,581,978 24,504 604,385 21,504 182,344 34,918 416,896 14,535 378,353 0 0
Liabilities under finance leases 35,447 1,626 5,457 1,338 7,014 2,821 9,241 1,489 13,176 42 559
Liabilities under finance leases with affiliated companies 27,065 854 3,062 746 3,170 1,560 9,802 613 11,031 0 0
Liabilities under borrowings from non-banks 136,428 958 103,920 770 18,304 494 11,715 0 2,420 0 69
Liabilities from ABS transactions and other financial liabilities 60,086 0 60,086 0 0 0 0 0 0 0 0
Financial liabilities trade accounts payable 348,615 0 344,113 0 81 0 2,350 0 2,071 0 0
Liabilities from derivative financial instruments 18,523 0 358,252 – 1 1,597 1 685 0 0 0 – 342,011
135Glossary Group Management Report Consolidated Financial Statements Report of the Supervisory Board Notes to the Consolidated Statement of Financial Position

reporting date. The variable interest payments arising from the financial instruments were calculated using the last interest rates fixed before December 31, 2015. Financial liabilities that can be repaid at any time are always assigned to the earliest possible period.
28 ADDITIONAL DISCLOSURES ON FINANCIAL INSTRUMENTS
Carrying amount and fair value by measurement category
Assessmentcategory
under IAS 39
Carrying amount
Dec. 31, 2015
€ ’000
Fair valueDec. 31, 2015
€ ’000
Carrying amount
Dec. 31, 2014
€ ’000
Fair valueDec. 31, 2014
€ ’000
Assets
Trade receivables LaR 1,034,701 – 993,689 –
Other receivables LaR 116,316 – 114,503 –
Available-for-sale financial assets AfS 14,641 14,641 8,516 8,516
Other holdings AfS 30,468 –* 18,377 –*
Financial assets held for trading FAHfT 16,976 16,976 15,748 15,748
Derivatives not in a hedge FAHfT 20,283 20,283 16,412 16,412
Derivatives in a hedge n.a. 7,250 7,250 13,062 13,062
Cash and cash equivalents LaR 62,958 – 84,332 –
Liabilities
Profit participation rights FLAC 102,135 –** 91,810 –**
Liabilities to banks FLAC 1,581,978 1,609,099 1,541,665 1,576,843
Liabilities under finance leases n.a. 62,512 63,695 68,285 69,849
Liabilities under borrowings from non-banks FLAC 136,428 137,521 130,956 132,954
Other financial liabilities FLAC 33,802 – 31,371 –
Trade accounts payable FLAC 348,615 – 311,914 –
Other liabilities FLAC 258,600 – 213,817 –
Purchase price liabilities from business combinations FLHfT 28,614 28,614 34,746 34,746
Derivatives not in a hedge FLHfT 6,794 6,794 10,120 10,120
Derivatives in a hedge n.a. 11,729 11,729 16,679 16,679
Summary by IAS 39 measurement category:
Loans and receivables LaR 1,213,975 1,214,918 1,192,524 1,192,540
Available-for-sale financial assets AfS 45,109 45,109 26,893 26,893
Financial assets held for trading FAHfT 37,259 37,259 32,160 32,160
Financial liabilities measured at amortized cost FLAC 2,461,558 2,489,772 2,321,533 2,362,762
Financial liabilities measured at fair value FLHfT 35,408 35,408 44,866 44,866
LaR Loans and Receivables | HtM Held-to-Maturity Financial Assets | AfS Available-for-Sale Financial Assets | FAHfT Financial Assets Held-for-Trading FLAC Financial Liabilities measured at Amortized Cost | FLHfT Financial Liabilities Held-for-Trading
* The remaining holdings consist of shares in partnerships and corporations for which no active market exists. Since future cash flow cannot be reliably determined, the fair value of these instruments also cannot be reliably measured.
** Interest on the rights is linked to the dividends paid to shareholders in B. Braun Melsungen AG, and the repayment amount is linked to the Group’s equity. A fair value for this instrument cannot be reliably measured.
136 Glossary Group Management Report Consolidated Financial Statements Report of the Supervisory Board Notes to the Consolidated Statement of Financial Position

Net gains or losses by measurement category are as follows:
The available-for-sale financial assets comprise:
These are reported under other financial investments and other financial assets. No available-for-sale financial assets were impaired in 2015 or 2014. A sale of these assets is not planned.
Other assets include other receivables and other financial assets in the amount of € 190,142,000 and other loans in the amount of € 10,331,000 (previous year: € 11,219,000).
The maximum credit risk for each measurement category of financial assets corresponds to its carrying amount. Trade receivables are partly secured with reservation of title, which reduces the maximum default risk in this assessment category by € 36,946,000 (previous year: € 34,744,000).
Cash and cash equivalents, trade receivables, and other receivables have predominantly short residual terms, thus their carrying amounts are close to fair value as of the reporting date.
Trade accounts payable and other financial liabilities and debt regularly have short residual terms; the values reported on the statement of financial position are close to fair value.
The fair values of liabilities to banks and other lenders, promissory notes, finance leases and other finan-cial liabilities are calculated as the net present value of the payments associated with the liabilities, based on the relevant yield curve in each case. In determining the fair value, the credit risk has been taken into account.
To date, the Group has not exercised the option of designating financial assets and liabilities upon initial recognition as financial liabilities measured at fair value through profit and loss.
Net gains or losses from 2015€ ’000
2014€ ’000
– held-to-maturity financial assets 0 – 700
– available-for-sale financial assets – 18 – 186
– financial assets and liabilities held for trading – 7,882 8,665
– 7,900 7,779
Equities and similar securities Dec. 31, 2015 € ’000
Dec. 31, 2014 € ’000
Listed securities 14,641 8,516
of which non-current 5,185 723
137Glossary Group Management Report Consolidated Financial Statements Report of the Supervisory Board Notes to the Consolidated Statement of Financial Position

The table below shows financial instruments where subsequent measurement and accounting is at fair value. These are categorized into levels 1 to 3, depending on the extent to which fair value can be measured:
– Level 1 – Measurement at fair value based on (unadjusted) quoted prices on active markets for iden-tical financial assets or liabilities.
– Level 2 – Measurement at fair value based on parameters, which are not quoted prices for assets or liabilities as in level 1, but which are either directly derived from them (i. e., as prices) or indirectly derived from them (i. e., derived from prices).
– Level 3 – Measurement at fair value using models that include parameters not based on observable market data to value assets and liabilities.
Level 1€ ’000
Level 2€ ’000
Level 3€ ’000
Total € ’000
December 31, 2014
Financial assets of category“At fair value through profit and loss”Derivative financial assets not in a hedge 0 16,412 0 16,412
Derivative financial assets in a hedge 0 13,062 0 13,062
Financial assets held for trading 15,748 0 0 15,748
Financial assets of category “Available for sale” Financial assets 8,516 0 0 8,516
Financial liabilities of category “At fair value through profit and loss”Purchase price liabilities from business combinations 0 0 – 34,746 – 34,746
Derivative financial liabilities not in a hedge 0 – 10,120 0 – 10,120
Derivative financial liabilities in a hedge 0 – 16,679 0 – 16,679
24,264 2,675 – 34,746 – 7,807
December 31, 2015
Financial assets of category“At fair value through profit and loss”Derivative financial assets not in a hedge 0 20,283 0 20,283
Derivative financial assets in a hedge 0 7,250 0 7,250
Financial assets held for trading 16,976 0 0 16,976
Financial assets of category “Available for sale” Financial assets 14,641 0 0 14,641
Financial liabilities of category “At fair value through profit and loss”Purchase price liabilities from business combinations 0 0 – 28,614 – 28,614
Derivative financial liabilities not in a hedge 0 – 6,794 0 – 6,794
Derivative financial liabilities in a hedge 0 – 11,729 0 – 11,729
31,617 9,010 – 28,614 12,013
138 Glossary Group Management Report Consolidated Financial Statements Report of the Supervisory Board Notes to the Consolidated Statement of Financial Position

Purchase price liabilities from business combinations categorized as level 3 are conditional purchase price liabilities recorded at net present value, the final amount of which is partially performance depen-dent based on various factors. The amount stated represents the fair value that was calculated for the actual purchase price liability on the basis of the agreed adjustment parameters. A partial amount of € 8,743,000 is performance dependent based on the sales of acquired companies in the years following the acquisition. If sales turn out to be 10 percent higher (lower) than was assumed when the liability was determined, then the liability would increase (decrease) by € 874,000. Another partial amount of € 1,653,000 is performance dependent on the basis of the EBIT and EBITDA figures for the acquired companies in the years following the acquisition. If these earnings amounts turn out to be 10 percent higher (lower) than expected, then the liability would increase by € 793,000 (decrease). Another partial amount of € 2,387,000 is performance dependent based on the number of patients treated, the refund amount, and the rate of inflation. If these parameters develop 10 percent more favorably (unfavorably) than expected, then the liability would increase by € 1,175,000 (decrease by€ 1,366,000). Another partial amount of € 15,831 is dependent on the exercise date of the agreed-upon put option. Since this time is very likely fixed, it cannot be assumed that the liability is likely to increase or decrease.
The € 6,131,000 increase in liabilities over the previous year is attributable to the repayment of purchase price liabilities (€ – 3,308,000), the revaluation of measurement parameters (€ – 4,457,000), the creation of new liabilities following business combinations in the reporting year (€ 1,566,000) and discounting effects (€ 68,000).
The table below shows financial instruments that are subsequently measured at fair value, but recog-nized at amortized cost.
Level 1€ ’000
Level 2€ ’000
Level 3€ ’000
Total € ’000
December 31, 2014
Financial liabilities of category “Measured at amortized cost”Liabilities to banks 0 1,576,843 0 1,576,843
Liabilities under finance leases 0 69,849 0 69,849
Liabilities under borrowings from non-banks 0 132,954 0 132,954
0 1,779,646 0 1,779,646
December 31, 2015
Financial liabilities of category “Measured at amortized cost”Liabilities to banks 0 1,609,099 0 1,609,099
Liabilities under finance leases 0 63,695 0 63,695
Liabilities under borrowings from non-banks 0 137,521 0 137,521
0 1,810,315 0 1,810,315
139Glossary Group Management Report Consolidated Financial Statements Report of the Supervisory Board Notes to the Consolidated Statement of Financial Position

The following financial assets and liabilities are subject to offsetting arrangements:
Offsetting of amounts that were not offset is permitted in the event of bankruptcy or default of one of the contractual parties.
Corresponding amounts that were not offset
Gross carrying amount
€ ’000
Offset amount
€ ’000
Net carrying amount
€ ’000
Financial instruments
€ ’000
Financial collateral
held
€ ’000
Net amount
€ ’000
December 31, 2014
Loans and receivables (LaR) 1,192,524 0 1,192,524 – 7,705 0 1,184,819
Financial assets held for trading (FAHfT) 32,160 0 32,160 – 25,302 0 6,858
Financial liabilities measured at amortized cost (FLAC) 2,321,533 0 2,321,533 – 21,560 0 2,299,973
Financial liabilities held for trading (FLHfT) 44,866 0 44,866 – 11,448 0 33,418
December 31, 2015
Loans and receivables (LaR) 1,213,975 0 1,213,975 – 7,323 0 1,206,652
Financial assets held for trading (FAHfT) 37,259 0 37,259 – 22,303 0 14,956
Financial liabilities measured at amortized cost (FLAC) 2,461,558 0 2,461,558 – 20,593 16 2,440,981
Financial liabilities held for trading (FLHfT) 35,408 0 35,408 – 9,033 0 26,375
140 Glossary Group Management Report Consolidated Financial Statements Report of the Supervisory Board Notes to the Consolidated Statement of Financial Position

29 TRADE ACCOUNTS PAYABLE AND OTHER LIABILITIES
The Group has designated several payer interest rate swaps (“static pay – variable receipts”) as cash flow hedges in order to hedge the variable interest payments on a nominal credit volume of € 125,000,000 (previous year: € 125,000,000). Changes in the cash flows of the underlying transaction resulting from changes in the reference interest rate are compensated for by the changes in the cash flows of the
Dec. 31, 2015 € ’000
Dec. 31, 2014 € ’000
Non-current liabilities
Trade accounts payable 4,502 6,323
Liabilities to social security providers 1,839 1,686
Liabilities to employees, management, and shareholders 18,750 18,544
Accruals and deferrals 0 0
20,589 20,230
Other liabilities 19,253 21,707
Subtotal other liabilities 39,842 41,937
of which other financial liabilities 19,251 21,475
Current liabilities
Trade accounts payable 344,113 305,591
Liabilities to social security providers 32,235 30,448
Liabilities to employees, management, and shareholders 268,904 259,757
Accruals and deferrals 16,109 12,317
Other tax liabilities 72,284 75,177
389,532 377,699
Liabilities from derivative financial instruments 18,523 26,799
Other liabilities 273,128 235,524
291,651 262,323
Subtotal other liabilities 681,183 640,022
of which other financial liabilities 286,486 253,887
Total liabilities 1,069,640 993,873
141Glossary Group Management Report Consolidated Financial Statements Report of the Supervisory Board Notes to the Consolidated Statement of Financial Position

interest rate swap. The hedging measures are designed to hedge the cash flow from bank liabilities against an increase in the reference interest rate. Credit risks are not covered through the hedge. The related cash flows are likely to occur through fiscal year 2019. The effectiveness of hedges was mea-sured prospectively and retrospectively using the dollar offset method. The hedges were effective. The effective portion of changes in the fair value of the designated interest rate swap is recognized in equity and amounts to a total of € – 847,000 (previous year: € 1,585,000). The ineffective portion of changes in value is recognized directly in the statement of income under net financial income and is € 0 (pre-vious year: € 0). Amounts accrued under equity are transferred to the statement of income as income or expense in the period in which the hedged underlying transaction is recognized in the statement of income.
From hedges that were terminated or became ineffective in the fiscal year, losses that were recognized in the capital equity on an accumulative basis remained in the capital equity at the time of terminating this hedge, and they are recognized on entry of the originally hedged transaction through profit and loss in the statement of income. In 2015, this resulted in an expense of € 555,000 (previous year: € 555,000), which was transferred from equity to the statement of income.
Other liabilities mainly include remaining payments related to company acquisitions, liabilities from ABS transactions, bonus obligations, and liabilities related to outstanding invoices.
30 CONTINGENT LIABILITIES
Liabilities result exclusively from obligations to third parties and consist of:
All cases relate to potential future obligations, which may arise upon the occurrence of corresponding events and are entirely uncertain as of the reporting date.
31 OTHER FINANCIAL LIABILITIES
The Group leases numerous office buildings and warehouses under non-terminable operating lease agree-ments. These agreements have varying terms and conditions, escalation clauses, and renewal options.
Future minimum lease payments expected in connection with non-terminable sub-leases on the report-ing date amount to € 12,080,000 (previous year: € 10,004,000).
Dec. 31, 2015 € ’000
Dec. 31, 2014 € ’000
Uncertain liabilities 39,364 33,032
Guarantees 21,225 24,077
Warranties 1,973 2,490
Contractual performance guarantees 46,496 43,941
109,058 103,540
142 Glossary Group Management Report Consolidated Financial Statements Report of the Supervisory Board Notes to the Consolidated Statement of Financial Position

The Group also leases manufacturing facilities and machinery under terminable operating lease agreements.
The minimum payments of non-discounted future lease payments under operating lease and rental agreements are due as follows:
Some Group companies enter into sale and leaseback agreements with B. Braun Holding GmbH & Co. KG as part of their operating activities. These agreements are intended for sales financing, not to realize profits earlier.
The portion of total obligations under rental and lease agreements accounted for by obligations under sale and lease- back agreements is provided in the table below:
During the normal course of business, B. Braun is subject to potential obligations stemming from law-suits and enforced claims. Estimates of possible future liabilities of this kind are uncertain. No material negative consequences for the economic or financial situation of the B. Braun Group are anticipated.
32 FINANCIAL RISK MANAGEMENT
Financial risk factorsThe Group’s activities expose it to a variety of financial risks. These include currency, interest rate, credit, and liquidity risks. The B. Braun Group’s policy strives to minimize these risks via systematic risk management, which involves the use of derivative financial instruments.
Dec. 31, 2015 € ’000
Dec. 31, 2014 € ’000
Obligations under rental and leasing agreements
Due within one year 68,125 59,515
Due within one to five years 110,531 83,401
Due in over five years 63,778 38,785
242,434 181,701
Obligations from the acquisition of intangible assets 18 20
Obligations from the acquisition of Property, plant, and equipment 171,172 274,777
Total 413,624 456,498
Dec. 31, 2015 € ’000
Dec. 31, 2014 € ’000
Obligations under sale and leaseback agreements
Due within one year 8,325 4,114
Due within one to five years 13,586 6,123
Due in over five years 0 0
21,911 10,237
143Glossary Group Management Report Consolidated Financial Statements Report of the Supervisory Board Notes to the Consolidated Statement of Financial Position

Risk management is performed centrally by Group Treasury in accordance with policies approved by the Management Board. Group Treasury identifies, measures, and hedges financial risks in close cooperation with the Group’s operating units. The Management Board provides written principles for Group-wide risk management together with written policies covering specific areas such as foreign exchange, interest rate, and credit risk and the use of derivative and non-derivative financial instruments.
a) Market riskForeign exchange riskThe Group operates internationally and is therefore exposed to currency risk arising from fluctuations in the exchange rates between various foreign currencies, primarily the US dollar. Risks arise when future transactions or assets or liabilities recognized in the statement of financial position are denominated in a currency that is not the functional currency of the company. To hedge such risks, the Group uses forward foreign exchange contracts.
The Group’s risk management policy is to hedge the assets or liabilities recognized in the statement of financial position and to hedge up to 60 percent of the net cash flow expected over the next fiscal year on a continuous basis in key currencies. The Group therefore performs a scenario analysis to ascertain the impact of changes in exchange rate on the Group’s earnings and shareholders’ equity (before taxes in each case). This analysis takes into account balance sheet items (particularly accounts receivable and payable from operations, as well as loans and borrowings) as well as foreign exchange transactions executed in order to hedge balance sheet items and future cash flow denominated in foreign currencies (cash flow hedges).
If the exchange rate of USD compared to other currencies on December 31, 2015, had been 10 percent stronger (weaker), profit before taxes – with all other variables remaining constant – would have been € 4.8 million (previous year: € 34.4 million) lower (higher). The remaining components of equity would have been approximately € 12.3 million (previous year: € 13.3 million) lower (higher). If the Euro rises in value by 10 percent against all other currencies (Euro 10 percent weaker), the changes in the value of the cash flow hedges would have the effect of increasing (decreasing) shareholders’ equity by about € 19.3 million (previous year: € 13.4 million).
Interest rate riskAs the Group has no significant interest-bearing assets, changes in market interest rates affect its income and operating cash flow primarily via their impact on its interest-bearing liabilities. The liabili-ties with variable interest rates expose the Group to cash flow interest rate risk. Fair value interest rate risk arises from fixed-interest liabilities. Group policy is to maintain approximately 50 percent of its borrowings in fixed-rate instruments.
The Group also hedges its cash flow interest rate risk using interest rate swaps. Under these interest rate swaps, the Group agrees with other parties to exchange a fixed interest rate for a floating reference rate at specified intervals based on the agreed nominal volume in each case. Interest rate swaps of this nature have the economic effect of converting variable-rate into fixed-rate loans.
If market interest rates had been 100 basis points higher as of December 31, 2015, profit before taxes – with all other variables remaining constant – would have been approximately € 5.2 million lower for
144 Glossary Group Management Report Consolidated Financial Statements Report of the Supervisory Board Notes to the Consolidated Statement of Financial Position

the full year (previous year: € 7.0 million). If market interest rates had been 100 basis points lower as of December 31, 2015, profit before taxes – with all other variables remaining constant – would have been approximately € 2.6 million higher for the full year (previous year: € 7.0 million). This would have been mainly attributable to higher or lower interest expense for variable- rate interest-bearing financial liabilities. The other components of equity would have changed only slightly.
b) Credit riskThe Group has no significant concentrations of credit risk related to trade receivables. It has organi-zational guidelines that ensure that products are sold only to customers with a good payment history. Contracts on derivative financial instruments and financial transactions are solely concluded with financial institutions with a good credit rating and contain, as a rule, a provision that allows mutually offsetting positive and negative fair market values in the event of the insolvency of a party.
c) Liquidity riskPrudent liquidity risk management includes maintaining sufficient reserves of cash, as well as ensur-ing the availability of funding through an adequate amount of committed credit facilities. Due to the dynamic nature of the environment in which the Group operates, Group Treasury aims to maintain the necessary flexibility in funding by ensuring sufficient unutilized credit lines are available.
Capital risk managementThe Group’s capital management seeks to ensure continuation as a thriving, independent, family-run company, in order to guarantee that shareholders continue to receive dividends and other interested parties receive the amounts owed them, as well as maintaining an optimal equity structure to reduce the cost of capital.
The goal of significantly exceeding an equity ratio of at least 25 percent, that was agreed upon under the terms of the syndicated loan, was achieved in fiscal year 2015 as well.
Derivative financial instrumentsThe fair value of derivative financial instruments is calculated using directly observable market input factors. The fair value of interest rate swaps is calculated from the net present value of estimated future cash flows using the relevant yield curve on the reporting date. The fair value of forward foreign exchange contracts is calculated based on forward exchange rates on the reporting date. The company’s own credit risk or counterparty credit risk is not included in this calculation due to a lack of materiality.
Changes in the fair value of derivative financial instruments that represent economically effective hedges under the Group strategy are recognized through profit and loss, unless they are used in hedge account-ing. When applying hedge accounting for cash flow hedges, the fair market value changes from the effective portion are recognized in equity. The fair value changes in hedging instruments more or less match the fair value changes in the hedged underlying transactions.
The fair values of forward foreign exchange contracts are based on prevailing exchange rates, adjusted for forward premiums or discounts. Market values of interest rate hedging instruments are calculated using discounted forecast future cash flows. Market rates are applied for the remaining term of the derivatives in question.
145Glossary Group Management Report Consolidated Financial Statements Report of the Supervisory Board Notes to the Consolidated Statement of Financial Position
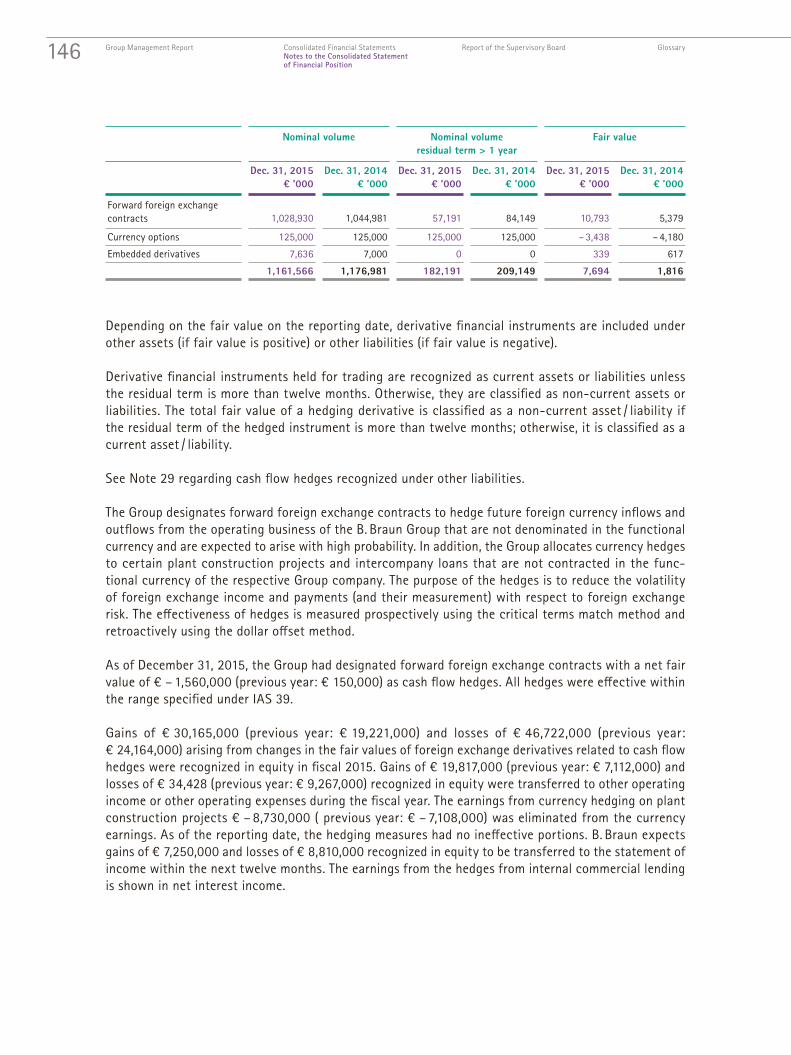
Depending on the fair value on the reporting date, derivative financial instruments are included under other assets (if fair value is positive) or other liabilities (if fair value is negative).
Derivative financial instruments held for trading are recognized as current assets or liabilities unless the residual term is more than twelve months. Otherwise, they are classified as non-current assets or liabilities. The total fair value of a hedging derivative is classified as a non-current asset / liability if the residual term of the hedged instrument is more than twelve months; otherwise, it is classified as a current asset / liability.
See Note 29 regarding cash flow hedges recognized under other liabilities.
The Group designates forward foreign exchange contracts to hedge future foreign currency inflows and outflows from the operating business of the B. Braun Group that are not denominated in the functional currency and are expected to arise with high probability. In addition, the Group allocates currency hedges to certain plant construction projects and intercompany loans that are not contracted in the func-tional currency of the respective Group company. The purpose of the hedges is to reduce the volatility of foreign exchange income and payments (and their measurement) with respect to foreign exchange risk. The effectiveness of hedges is measured prospectively using the critical terms match method and retroactively using the dollar offset method.
As of December 31, 2015, the Group had designated forward foreign exchange contracts with a net fair value of € – 1,560,000 (previous year: € 150,000) as cash flow hedges. All hedges were effective within the range specified under IAS 39.
Gains of € 30,165,000 (previous year: € 19,221,000) and losses of € 46,722,000 (previous year: € 24,164,000) arising from changes in the fair values of foreign exchange derivatives related to cash flow hedges were recognized in equity in fiscal 2015. Gains of € 19,817,000 (previous year: € 7,112,000) and losses of € 34,428 (previous year: € 9,267,000) recognized in equity were transferred to other operating income or other operating expenses during the fiscal year. The earnings from currency hedging on plant construction projects € – 8,730,000 ( previous year: € – 7,108,000) was eliminated from the currency earnings. As of the reporting date, the hedging measures had no ineffective portions. B. Braun expects gains of € 7,250,000 and losses of € 8,810,000 recognized in equity to be transferred to the statement of income within the next twelve months. The earnings from the hedges from internal commercial lending is shown in net interest income.
Nominal volume Nominal volumeresidual term > 1 year
Fair value
Dec. 31, 2015 € ’000
Dec. 31, 2014 € ’000
Dec. 31, 2015 € ’000
Dec. 31, 2014 € ’000
Dec. 31, 2015 € ’000
Dec. 31, 2014 € ’000
Forward foreign exchange contracts 1,028,930 1,044,981 57,191 84,149 10,793 5,379
Currency options 125,000 125,000 125,000 125,000 – 3,438 – 4,180
Embedded derivatives 7,636 7,000 0 0 339 617
1,161,566 1,176,981 182,191 209,149 7,694 1,816
146 Glossary Group Management Report Consolidated Financial Statements Report of the Supervisory Board Notes to the Consolidated Statement of Financial Position

33 RELATED PARTY TRANSACTIONS
Related party transactions are presented for persons or entities not already included as consolidated companies in the consolidated financial statements. A person or a close member of that person’s fam-ily is related to a reporting entity if that person has control or joint control over the reporting entity, has significant influence over the reporting entity, or is a member of key management personnel of the reporting entity. An entity is related to a reporting entity if the entity and the reporting entity are members of the same group or one entity is an associate or joint venture of the other entity.
The B. Braun Group purchases materials, supplies, and services from numerous suppliers around the world in the ordinary course of its business. These suppliers include a small number of companies in which the Group holds a controlling interest and companies that have ties to members of B. Braun Melsungen AG’s Supervisory Board. Business transactions with such companies are conducted on normal market terms. From the perspective of the B. Braun Group, these are not materially significant. The B. Braun Group did not participate in any transactions significant for it or for related entities that were in any way irregular, and does not intend to do so in the future.
The following transactions were completed with related persons and entities:
2015 € ’000
2014 € ’000
Sale of goods and services
Related entities 15,771 14,801
of which B. Braun Holding GmbH & Co. KG (13,732) (9,416)
of which holdings (2,039) (5,385)
15,771 14,801
Goods and services purchased
Related entities 86,356 71,190
of which B. Braun Holding GmbH & Co. KG (22,178) (22,157)
of which joint ventures (21,488) (19,584)
of which holdings (42,690) (29,449)
86,356 71,190
147Glossary Group Management Report Consolidated Financial Statements Report of the Supervisory Board Notes to the Consolidated Statement of Financial Position

Outstanding items from the acquisition / sale of goods and services and from loans at the end of the fiscal year:
Key management personnel are members of the Management Board and members of the Supervisory Board of B. Braun Melsungen AG. In addition to B. Braun Holding GmbH & Co. KG, the affiliated Group includes joint ventures and companies controlled by key management personnel or their close family members. The names of associated companies and joint ventures are listed under Major Shareholdings.
The following items in the statement of financial position contain outstanding balances with related persons and entities:
– Other assets – Financial debt – Other liabilities
The loans granted by related individuals are short-term. Their interest rates are based on covered bond (Pfandbrief) yields.
Please see Note 27 for details of leasing liabilities to related entities.
Remuneration for members of the Management Board consists of a fixed and a variable, performance-re-lated component. They also receive pension commitments and benefits in kind. Benefits in kind consist mainly of the value assigned for the use of company cars under German tax laws.
Dec. 31, 2015 € ’000
Dec. 31, 2014 € ’000
Outstanding items from the sale of goods and services
Related entities 4,120 9,606
of which B. Braun Holding GmbH & Co. KG (3,577) (7,378)
of which joint ventures (408) (1,672)
of which holdings (135) (556)
4,120 9,606
Procurement obligations 216 216
Outstanding items from goods and services purchased and from loans
Related entities 32,639 42,908
of which B. Braun Holding GmbH & Co. KG (27,064) (30,088)
of which joint ventures (1,740) (3,067)
of which holdings (3,835) (9,753)
Key management personnel 66,099 56,296
98,738 99,204
Procurement obligations 1,951 2,052
148 Glossary Group Management Report Consolidated Financial Statements Report of the Supervisory Board Notes to the Consolidated Statement of Financial Position

In addition to the duties and performance of Management Board members, the criteria for remuneration include the Group’s financial position, results, and future projections.
The total remuneration of Management Board members consists of the following:
Of the total, € 636,000 was attributable to the Chairman of the Management Board as fixed remuner-ation and € 796,000 as variable remuneration from profit-sharing.
Pension obligations totaling € 19,696,000 exist to active members of the Management Board. Prof-it-sharing bonus obligations to Management Board members reported under Liabilities to employees, management, and shareholders total € 4,588,000. A total of € 27,730,000 has been allocated for pension obligations to former Management Board members and their surviving dependents; current pension payments total € 2,084,000. Supervisory Board remuneration totaled € 703,000.
The remuneration of Supervisory Board members is governed by the articles of incorporation and is approved at the annual Shareholders’ Meeting. The remunerations made to employee representatives on the Supervisory Board for work outside their supervisory activities are in line with the market standards.
The Group has not made any loans to current or former members of the Management Board or Super-visory Board. Liabilities stemming from profit participation rights for Management Board members were € 13,409,000 (previous year: € 11,979,000). See Note 27 for detailed information about bonuses.
The members of the Supervisory board and the Management Board are listed on pages 4 and 159 respectively.
2015 € ’000
2014 € ’000
Fixed remuneration 3,956 3,476
Variable renumeration 5,079 4,210
Pension expense 1,030 1,030
Bonuses 273 164
Other 438 597
10,776 9,477
149Glossary Group Management Report Consolidated Financial Statements Report of the Supervisory Board Notes to the Consolidated Statement of Financial Position

NOTES TO THE CONSOLIDATED STATEMENT OF CASH FLOWS
The consolidated statement of cash flows details changes in the B. Braun Group’s cash and cash equiva-lents during the course of the fiscal year. In accordance with IAS 7, cash flows are categorized as those from operating, investing, and financing activities. Cash flow from operating activities is calculated using the indirect method.
34 GROSS CASH FLOW FROM OPERATING ACTIVITIES
The gross cash flow of € 767,700,000 is the cash surplus from operating activities before any changes in working capital, an increase of € 201,800,000 over the previous year. The change is due primarily to higher operating profit of € 482,900,000 and the change in non-current provisions and other non-cash income and expenses.
Cash flow from operating activities of € 687,500,000 represents changes in current assets, current provisions, and liabilities (excluding financial liabilities).
The increase in inventories, receivables and other assets less the increase in liabilities and current provisions have led to a cash outflow of € 80.2 million. Net cash from operating activities is therefore € 166.8 million above the previous year’s level.
35 CASH FLOW FROM INVESTING ACTIVITIES
For the purchase of property, plant, and equipment, intangible assets, financial assets, and companies, a total of € 757.4 million was spent in 2015. This was offset by proceeds from the sale of property, plant, and equipment and the disposal of holdings (€ 15.2 million), as well as dividends and similar revenues received (€ 29.4 million), resulting in a net cash outflow from investing activities of € 712.9 million. Compared to the previous year, this resulted in a € 197.3 million increase in cash outflow.
Investments made during the year were fully covered by cash flow from operating activities. The remaining free cash flow was € – 25.4 million (previous year: € 5.1 million).
Additions to property, plant, and equipment and intangible assets under finance leasing do not result in cash outflows and are therefore not included under investing activities. In the reporting year, these addi-tions totaled € 0.5 million (previous year: € 0.4 million).
150 Glossary Group Management Report Consolidated Financial Statements Report of the Supervisory Board Notes to the Consolidated Statement of Cash Flows

36 CASH FLOW FROM FINANCING ACTIVITIES
In 2015, cash flow from financing activities amounted to € – 6.3 million (previous year: € 32.0 million). The net balance of proceeds from and repayments of loans was € 36.7 million (previous year: € 74.8 mil-lion). Dividend payments and capital contributions by non-controlling interests resulted in a total cash outflow of € 41.8 million (previous year: € 42.1 million). The € 38.3 million change in cash inflows as compared with the previous year is primarily due to lower borrowing.
37 CASH AND CASH EQUIVALENTS
Cash and cash equivalents include cash on hand, demand deposits, and other short-term highly liquid financial assets with residual maturities of three months or less that are subject to no more than insig-nificant fluctuations in value.
As of December 31, 2015, restrictions on cash availability totaled € 1,386 million (previous year: € 711 million). These restrictions are primarily related to security deposits and collateral for tender business.
151Glossary Group Management Report Consolidated Financial Statements Report of the Supervisory Board Notes to the Consolidated Statement of Cash Flows

SUBSEQUENT EVENTS
No facts came to light after completion of the financial year through to the date of preparation of the consolidated financial statements that have a material effect on the earnings, assets, and financial position for fiscal year 2015.
152 Glossary Group Management Report Consolidated Financial Statements Report of the Supervisory Board Subsequent Events

INDEPENDENT AUDITORS’ REPORT
The complete annual financial statements and management report for publication in the online edition of the German Federal Gazette (Bundesanzeiger) have been supplemented with the following confirmation note:
We have audited the consolidated financial statements prepared by B. Braun Melsungen AG, Melsungen, Germany, comprising the statement of financial position, statement of income (loss), statement of comprehensive income, statement of changes in equity, statement of cash flows, and notes to the consolidated financial statements, together with the Group management report for the fiscal year from January 1 to December 31, 2015. The preparation of the consolidated financial statements and the Group management report in accordance with IFRS as adopted by the EU, and the additional requirements of German commercial law pursuant to Section 315 a (1) of the German Commercial Code (HGB), is the responsibility of the Management Board of the Company. Our responsibility is to express an opinion on the consolidated financial statements and on the Group management report based on our audit.
We conducted our audit of the consolidated financial statements in accordance with Section 317 HGB and the German generally accepted standards for the audit of financial statements promulgated by the Institut der Wirtschaftsprüfer (IDW). These standards require that we plan and perform the audit such that misstatements materially affecting the presentation of the net assets, financial position, and results of operations in the consolidated financial statements in accordance with the applicable financial report-ing framework and in the Group management report are detected with reasonable assurance. Knowledge of the business activities and the economic and legal environment of the Group and expectations as to possible misstatements are taken into account in the determination of audit procedures. The effective-ness of the accounting-related internal control system and the evidence supporting the disclosures in the consolidated financial statements and the Group management report are examined primarily on a test basis within the framework of the audit. The audit includes assessing the annual financial statements of those entities included in consolidation, determining the scope of consolidation, the accounting and consolidation principles used, and significant estimates made by the Management Board, as well as evaluating the overall presentation of the consolidated financial statements and the Group management report. We believe that our audit provides a reasonable basis for our opinion.
Our audit has not led to any reservations.
In our opinion, based on the findings of our audit, the consolidated financial statements comply with IFRS as adopted by the EU and the additional requirements of German commercial law pursuant to Section 315 a (1) HGB and provide a true and fair view of the net assets, financial position, and results of operations of the Group in accordance with these requirements. The Group management report is consistent with the consolidated financial statements and, as a whole, provides an appropriate view of the Group’s position and appropriately presents the opportunities and risks of future development.
Kassel, Germany, March 2, 2016
PricewaterhouseCoopersAktiengesellschaftWirtschaftsprüfungsgesellschaft
Dr. Peter Bartels Dr. Bernd RoeseGerman Public Auditor German Public Auditor
153Glossary Group Management Report Consolidated Financial Statements Report of the Supervisory Board Independent auditors’ report

MAJOR SHAREHOLDINGS
As of December 31, 2015
Company name and location Holdingin % 1
Equity € ’000
Sales € ’000
Employees
Germany
AESCULAP AG, Tuttlingen 2) 100.0 102,412 758,324 3,500
AESCULAP INTERNATIONAL GMBH, Tuttlingen 2) 100.0 205,777 0 0
AESCULAP SUHL GMBH, Suhl 100.0 3,750 14,392 121
ALMO-Erzeugnisse E. Busch GmbH, Bad Arolsen 60.0 23,219 66,763 356
B. Braun Avitum AG, Melsungen 2) 94.0 96,604 364,634 835
B. Braun Avitum Saxonia GmbH, Radeberg 2) 94.0 12,709 89,355 699
B. Braun Facility Services GmbH & Co. KG, Melsungen 100.0 – 2,011 18,881 87
B. Braun Nordamerika Verwaltungsgesellschaft mbH, Melsungen 2) 100.0 149,309 0 0
B. Braun Surgical GmbH, Melsungen 2) 100.0 154,449 0 0
B. Braun TravaCare GmbH, Hallbergmoos 2) 100.0 49 45,821 65
B. Braun Vet Care GmbH, Tuttlingen 2) 100.0 155 15,326 20
DTZ Dialyse Trainings-Zentren GmbH, Nuremberg 94.0 42,682 5,146 64
Nutrichem Diät + Pharma GmbH, Roth 2) 100.0 29,739 13,981 303
Inko Internationale Handelskontor GmbH, Roth 2) 100.0 4,548 47,306 28
TransCare Service GmbH, Neuwied 55.0 3,102 12,493 104
Europe
AESCULAP CHIFA SP.ZO.O., Nowy Tomysl / Poland 98.9 100,941 166,269 2,031
AESCULAP S.A.S., Chaumont / France 100.0 10,576 13,609 120
Avitum S.R.L., Timisoara / Romania 94.0 – 1,085 22,380 417
B. Braun Adria d.o.o., Zagreb / Croatia 36.0 7,302 11,264 35
B. Braun Austria Ges. m.b.H., Maria Enzersdorf / Austria 60.0 49,464 57,869 135
B. Braun Avitum France S.A.S., Gradignan / France 94.0 14,767 15,371 22
B. Braun Avitum Hungary Zrt., Budapest / Hungary 94.0 18,393 29,317 698
B. Braun Avitum Italy S.p.A., Mirandola / Italy 94.0 29,381 61,242 235
B. Braun Avitum Poland Sp.zo.o., Nowy Tomysl / Poland 95.1 7,151 33,006 418
B. Braun Avitum Russland Clinics OOO, St. Petersburg / Russia 94.0 4,232 12,232 426
B. Braun Avitum Russland OOO, St. Petersburg / Russia 94.0 40,139 37,242 52
B. Braun Avitum s.r.o., Bratislava / Slovak Republic 93.7 – 1,425 13,841 217
1 Effective share2 Companies with profit and loss transfer agreement
154 Glossary Group Management Report Consolidated Financial Statements Report of the Supervisory Board Major Shareholdings

As of December 31, 2015
Company name and location Holdingin % 1
Equity € ’000
Sales € ’000
Employees
B. Braun Avitum s.r.o., Prague / Czech Republic 93.7 6,465 25,487 335
B. Braun Avitum Servicios Renales S.A., Rubí (Barcelona) / Spain 96.4 7,732 14,397 189
B. Braun Avitum Turkey Sanayi Ticaret Anonim Sirketi, Ankara / Turkey
94.0
– 1,993
8,831
15
B. Braun Avitum UK Ltd., Sheffield / United Kingdom 94.0 3,544 30,306 227
B. Braun Hospicare Ltd., Collooney Co Sligo / Republic of Ireland 100.0 7,231 17,807 115
B. Braun Medical AB, Danderyd / Sweden 100.0 3,160 45,422 49
B. Braun Medical AG, Sempach / Switzerland 51.0 237,571 298,191 935
B. Braun Medical A / S, Frederiksberg / Denmark 100.0 2,136 18,749 33
B. Braun Medical A / S, Vestskogen / Norway 100.0 1,157 22,222 33
B. Braun Medical B.V., Oss / Netherlands 100.0 5,443 58,845 159
B. Braun Medical EOOD, Sofia / Bulgaria 60.0 4,377 12,054 52
B. Braun Medical International S.L., Rubí / Spain 100.0 162,084 5,161 18
B. Braun Medical Kft., Budapest / Hungary 60.0 35,575 73,842 1,033
B. Braun Medical Lda., Barcarena / Portugal 100.0 47,446 52,599 140
B. Braun Medical LLC, St. Petersburg / Russia 100.0 26,077 110,082 433
B. Braun Medical Ltd., Dublin / Republic of Ireland 100.0 4,163 24,217 46
B. Braun Medical Ltd., Sheffield / United Kingdom 100.0 64,051 175,398 502
B. Braun Medical N.V./S.A., Diegem / Belgium 100.0 3,023 33,100 73
B. Braun Medical Oy, Helsinki / Finland 100.0 4,754 41,113 48
B. Braun Medical S.A., Rubí / Spain 100.0 219,412 247,112 1,242
B. Braun Medical S.A.S., Boulogne / France 100.0 82,745 296,264 1,296
B. Braun Medical S.R.L., Timisoara / Romania 61.9 4,560 20,873 96
B. Braun Medical s.r.o., Bratislava / Slovak Republic 70.0 7,278 28,566 26
B. Braun Medical s.r.o., Prague / Czech Republic 70.0 26,059 66,888 181
B. Braun Medikal Dis Ticaret A.S., Istanbul / Turkey 100.0 7,561 15,783 80
B. Braun Milan S.p.A., Milan / Italy 100.0 34,005 118,067 221
B. Braun Sterilog (Birmingham) Ltd., Sheffield / United Kingdom 100.0 – 5,651 15,918 241
B. Braun Sterilog (Yorkshire) Ltd., Sheffield / United Kingdom 100.0 – 4,675 10,960 168
B. Braun Surgical S.A., Rubí / Spain 100.0 119,504 168,136 846
B. Braun VetCare SA, Rubí / Spain 100.0 6,303 11,850 25
Gematek OOO, St. Petersburg / Russia 100.0 11,812 11,423 249
MCP-Medicare LLC, St. Petersburg / Russia 94.0 3,326 9,856 263
Suturex & Renodex S.A.S., Sarlat / France 100.0 13,573 16,701 168
1 Effective share
155Glossary Group Management Report Consolidated Financial Statements Report of the Supervisory Board Major Shareholdings

As of December 31, 2015
Company name and location Holdingin % 1
Equity € ’000
Sales € ’000
Employees
North America
AESCULAP INC., Center Valley / USA 95.5 92,727 195,437 464
Aesculap Implant Systems LLC, Center Valley / USA 95.5 – 22,012 50,069 108
B. Braun Interventional Systems Inc., Bethlehem / USA 95.5 35,051 31,460 43
B. Braun Medical Inc., Bethlehem / USA 95.5 371,947 990,544 4,733
B. Braun of America Inc., Bethlehem / USA 95.5 119,472 0 0
B. Braun of Canada Ltd., Mississauga / Canada 95.5 1,963 25,900 17
CAPS Inc., Santa Fe Springs / USA 95.5 95,017 187,602 544
Asia-Pacific
Ahlcon Parenterals (India) Limited., New Delhi / India 95.8 14,926 16,900 766
B. BRAUN AESCULAP JAPAN CO. LTD., Tokyo / Japan 100.0 49,342 110,963 610
B. Braun Australia Pty. Ltd., Bella Vista / Australia 100.0 17,063 56,421 127
B. Braun Avitum Philippines Inc., Manila / Philippines 100.0 7,245 28,505 162
B. Braun Avitum (Shanghai) Trading Co. Ltd., Shanghai / China 94.0 37,942 114,086 211
B. Braun Korea Co. Ltd., Seoul / Republic of Korea 100.0 17,562 70,256 131
B. Braun Medical (H.K.) Ltd., Hong Kong / China 100.0 69,295 176,354 30
B. Braun Medical (India) Pvt. Ltd., Mumbai / India 100.0 19,694 58,803 926
B. Braun Medical Industries Sdn. Bhd., Petaling Jaya / Malaysia 100.0 393,715 452,573 7,178
B. Braun Medical (Shanghai) International Trading Co. Ltd., Shanghai / China
100.0
19,452
185,070
901
B. Braun Medical Supplies Inc., Manila / Philippines 100.0 9,156 26,426 171
B. Braun Medical Supplies Sdn. Bhd., Petaling Jaya / Malaysia 100.0 26,796 55,499 173
B. Braun Medical (Suzhou) Company Limited, Suzhou / China 100.0 15,416 54,845 398
B. Braun Pakistan (Private) Ltd., Karachi / Pakistan 100.0 587 17,940 120
B. Braun Singapore Pte. Ltd., Singapore 100.0 59,144 25,057 45
B. Braun Taiwan Co. Ltd., Taipei / Taiwan 100.0 5,143 20,616 48
B. Braun (Thailand) Ltd., Bangkok / Thailand 100.0 9,098 29,092 132
B. Braun Vietnam Co. Ltd., Hanoi / Vietnam 100.0 50,645 67,891 1,073
PT. B. Braun Medical Indonesia, Jakarta / Indonesia 100.0 35,595 67,942 551
Latin America
B. Braun Aesculap de México S.A. de C.V., México D. F. / Mexico 100.0 10,602 27,855 214
B. Braun Medical de México S.A.P.I. de C.V., México D. F. / Mexico 51.0 2,932 10,031 58
B. Braun Medical Peru S.A., Lima / Peru 100.0 17,635 25,393 458
B. Braun Medical S.A., Bogota / Colombia 100.0 5,624 30,078 277
B. Braun Medical S.A., Buenos Aires / Argentina 100.0 14,140 52,480 371
B. Braun Medical S.A., Quito / Ecuador 100.0 15,772 27,117 117
B. Braun Medical SpA, Santiago de Chile / Chile 86.1 5,233 36,497 184
Laboratorios B. Braun S.A., São Gonçalo / Brazil 100.0 104,715 145,319 1,776
1 Effective share
156 Glossary Group Management Report Consolidated Financial Statements Report of the Supervisory Board Major Shareholdings

As of December 31, 2015
Company name and location Holdingin % 1
Equity € ’000
Sales € ’000
Employees
Africa and the Middle East
B. Braun Avitum (Pty) Ltd., Johannesburg / South Africa 100.0 1,097 10,239 293
B. Braun Medical (Pty) Ltd., Johannesburg / South Africa 100.0 5,421 32,955 174
E. Owen and Partners, Fourways / South Africa 100.0 135 16,464 12
Other holdings
Babolat VS, Lyon / France 3) 28.0 66,903 122,707 244
Medical Service und Logistik GmbH, Recklinghausen 3) 50.0 907 39,897 7
Rhön Klinikum AG, Bad Neustadt an der Saale 3)4) 19.8 1,060,204 1,080,000 15,588
Schölly Fiberoptic GmbH, Denzlingen 3) 28.0 42,293 103,856 328
1 Effective share2 Companies with profit and loss transfer agreement3 Using the equity method4 Values from the published Q3 interim report
These values correspond to the financial statements prepared in accordance with IAS / IFRS. The conver-sion of the amounts of the foreign companies is conducted for equity with the average rate on December 31 and for sales with the average rate of the reporting year.
157Glossary Group Management Report Consolidated Financial Statements Report of the Supervisory Board Major Shareholdings