consolidated financial results for ... - mitsui & co., ltd
TRANSCRIPT

Consolidated Financial Results for the Year Ended March 31, 2020 [IFRS]
Tokyo, May 1, 2020 - Mitsui & Co., Ltd. announced its consolidated financial results for the year ended March 31, 2020, based on International Financial Reporting Standards (“IFRS”).
Mitsui & Co., Ltd. and subsidiaries(Web Site : https://www.mitsui.com/jp/en/)
President and Chief Executive Officer : Tatsuo YasunagaInvestor Relations Contacts : Masaya Inamuro, Investor Relations Division TEL 81-3-3285-1111
1. Consolidated financial results(1) Consolidated operating results information for the year ended March 31, 2020
(from April 1, 2019 to March 31, 2020)
Years ended March 31,
2020 2019 % %
Revenue Millions of yen 6,885,033 △1.0 6,957,524 42.2
Profit before income taxes Millions of yen 534,320 △8.6 584,338 7.3
Profit for the year Millions of yen 411,312 △4.7 431,763 △2.2
Profit for the year attributable to owners of the parent Millions of yen 391,513 △5.5 414,215 △1.0
Comprehensive income for the year Millions of yen △261,856 - 444,674 2.3
Earnings per share attributable to owners of the parent, basic Yen 226.13 238.33
Earnings per share attributable to owners of the parent, diluted Yen 225.98 238.15
Profit ratio to equity attributable to owners of the parent % 9.7 10.1
Profit before income taxes to total assets % 4.5 5.0
Note:1. Percentage figures for Revenue, Profit before income taxes, Profit for the year, Profit for the year attributable to owners of theparent, and Comprehensive income for the year represent changes from the previous year.2. Share of profit (loss) of investments accounted for using the equity method for the years ended March 31, 2020 and 2019 were¥269,232 million and ¥255,367 million, respectively.
(2) Consolidated financial position information
March 31, 2020 March 31, 2019
Total assets Millions of yen 11,806,292 11,945,779
Total equity Millions of yen 4,060,932 4,530,308
Total equity attributable to owners of the parent Millions of yen 3,817,677 4,263,166
Equity attributable to owners of the parent ratio % 32.3 35.7
Equity per share attributable to owners of the parent Yen 2,235.83 2,452.81

(3) Consolidated cash flow information
Years ended March 31,
2020 2019
Operating activites Millions of yen 526,376 410,670
Investing activities Millions of yen (185,230) (719,036)
Financing activities Millions of yen (204,561) 127,376
Cash and cash equivalents at the end of the year Millions of yen 1,058,733 956,107
2. Dividend information
Years ended March 31, Year ending March
31, 2021 (Forecast) 2020 2019
Interim dividend per share Yen 40 40 40
Year-end dividend per share Yen 40 40 40
Annual dividend per share Yen 80 80 80
Annual dividend (total) Millions of yen 137,848 139,046
Consolidated dividend payout ratio % 35.4 33.6 75.9
Consolidated dividend on equity attributable to owners of the parent % 3.4 3.4
3. Forecast of consolidated operating results for the year ending March 31, 2021 (from April 1, 2020 to March 31, 2021)
Year ending March 31, 2021
Profit attributable to owners of the parent Millions of yen 180,000
Earnings per share attributable to owners of the parent, basic Yen 105.42
4. Others (1) Increase/decrease of important subsidiaries during the period : None (2) Changes in accounting policies and accounting estimate :
(ⅰ) Changes in accounting policies required by IFRS Yes(ⅱ) Other changes None(ⅲ) Changes in accounting estimates Yes
Note : For further details please refer to p.27 “5. Consolidated Financial Statements (7) Changes in Accounting Policies and Changes in Accounting Estimates”. (3) Number of shares :
March 31, 2020 March 31, 2019
Number of shares of common stock issued, including treasury stock 1,742,684,906 1,742,345,627
Number of shares of treasury stock 35,184,567 4,271,539
Year endedMarch 31, 2020
Year endedMarch 31, 2019
Average number of shares of common stock outstanding 1,731,383,943 1,737,981,669
This earnings report is not subject to audit.

A Cautionary Note on Forward-Looking Statements: This report contains forward-looking statements including those concerning future performance of Mitsui & Co., Ltd. (“Mitsui”), and those statements are based on Mitsui’s current assumptions, expectations and beliefs in light of the information currently possessed by it. Various factors may cause Mitsui’s actual results to be materially different from any future performance expressed or implied by these forward-looking statements.Therefore, these statements do not constitute a guarantee by Mitsui that such future performance will be realized.For key assumptions on which the statements concerning future performance are based, please refer to (2)“Forecasts for the Year Ending March 31, 2021” on p.15. For cautionary notes with respect to forward-looking statements, please refer to the “Notice” section on p.18. Supplementary materials and IR meetings on financial results: Supplementary materials on financial results can be found on our web site.We will hold an IR meeting on financial results for analysts and institutional investors on May 1, 2020.Contents of the meeting (English and Japanese) will be posted on our web site immediately after the meeting.

Table of Contents
1. Qualitative Information
(1) Operating Environment……………………………………………………………………………………… 2
(2) Results of Operations………………………………………………………………………………………... 2
(3) Financial Condition and Cash Flows………………………………………………………………………... 10
2. Management Policies
(1) New Medium-term Management Plan……………………………………………………………………… 15
(2) Forecasts for the Year Ending March 31, 2021……………………………………………………………... 15
(3) Profit Distribution Policy…………………………………………………………………………….……… 18
3. Basic Approach on Adoption of Accounting Standards……………………………………………………… 18
4. Other Information…………………………………………………………………………………………….. 18
5. Consolidated Financial Statements
(1) Consolidated Statements of Financial Position……………………………………………………………… 20
(2) Consolidated Statements of Income and Comprehensive Income…………………………………………... 22
(3) Consolidated Statements of Changes in Equity……………………………………………………………... 24
(4) Consolidated Statements of Cash Flows…………………………………………………………………….. 25
(5) Assumption for Going Concern……………………………………………………………………………... 26
(6) Basis of Consolidated Financial Statements………………………………………………………………… 26
(7) Changes in Accounting Policies and Change in Accounting Estimates…………………………………….. 27
(8) Notes to Consolidated Financial Statements………………………………………………………………… 29
- 1 -

1. Qualitative Information
As of the date of disclosure of this earnings report, the audit procedures for consolidated financial statements have not been completed.
(1) Operating Environment
In the year ended March 31, 2020, while the global economy was continuing to exhibit sluggishness during the final months of the calendar year 2019, particularly in the manufacturing sector, due to trade friction between the U.S. and China and other factors, it sharply deteriorated due to the effect of the novel coronavirus (COVID-19), whose infections have been spreading globally since the beginning of 2020. In the U.S., the lockdowns and sharp rise in unemployment are expected to greatly suppress consumer spending, which has been a growth driver up until now. In Europe as well, there has been a great decrease in consumer spending, which had been underpinning the economy, and a large drop in exports is expected to accompany the slump in external demand. In Japan, where a weakening economic trend had already begun on account of the hike in consumption tax, further drops in consumer spending and exports are expected to greatly suppress the economy. Looking at the emerging economies, China, which was first to feel the effect of COVID-19, appears to have made it out of its worst period for economic activity and be moving toward recovery, but it will be unable to avoid an extensive slowdown in economic growth. Brazil and Russia are also experiencing broad deterioration in the economy due to the effect of COVID-19 and falling oil prices. The global economy is expected to begin recovering in the second half of 2020. Although it is necessary to be cautious of an adverse effect on the economy overall if the spread of COVID-19 persists, provided that COVID-19 gets under control, the large-scale budgetary expansion and monetary easing of the various countries are expected to boost recovery. (2) Results of Operations
1) Analysis of Consolidated Income Statements
(Billions of Yen) Current Year Previous Year Change
Revenue 6,885.0 6,957.5 (72.5)
Gross Profit 839.4 838.5 +0.9
Selling, general and administrative expenses (584.9) (566.3) (18.6)
Other Income (Expenses)
Gain (Loss) on Securities and Other Investments—Net
25.1 4.4 +20.7
Impairment Reversal (Loss) of Fixed Assets—Net
(110.8) (27.0) (83.8)
Gain (Loss) on Disposal or Sales of Fixed Assets—Net
9.5 17.9 (8.4)
Other Income (Expense)—Net 38.5 (18.8) +57.3
Reversal of provision related to Multigrain business
- 11.1 (11.1)
Finance Income (Costs)
Interest Income 41.4 43.4 (2.0)
Dividend Income 96.5 105.9 (9.4)
Interest Expense (89.6) (80.1) (9.5)
Share of Profit (Loss) of Investments Accounted for Using the Equity Method
269.2 255.4 +13.8
Income Taxes (123.0) (152.6) +29.6
Profit for the Year 411.3 431.8 (20.5)
Profit for the Year Attributable to Owners of the Parent 391.5 414.2 (22.7)
* May not match with the total of items due to rounding off. The same shall apply hereafter.
- 2 -

Revenue
Revenue for the year ended March 31, 2020 (“current year”) was ¥6,885.0 billion, a decrease of ¥72.5 billion from the year ended March 31, 2019 (“previous year”).
Gross Profit
Mainly the Mineral & Metal Resources Segment, the Energy Segment and the Machinery & Infrastructure Segment recorded an increase, while the Chemical Segment, the Innovation & Corporate Development Segment and the Lifestyle Segment recorded a decline.
Selling, general and administrative expenses
Mainly the Machinery & Infrastructure Segment and the Mineral & Metal Resources Segment recorded an increase.
Other Income (Expenses)
Gain (Loss) on Securities and Other Investments—Net For the current year, a gain on securities was recorded in the Machinery & Infrastructure Segment, the Lifestyle Segment and the Innovation & Corporate Development Segment. For the previous year, a gain on securities was recorded in the Lifestyle Segment.
Impairment Reversal (Loss) of Fixed Assets—Net For the current year, an impairment loss on fixed assets was recorded in the Energy Segment, the Lifestyle Segment and the Machinery & Infrastructure Segment. For the previous year, an impairment loss on fixed assets was recorded in the Energy Segment and the Chemical Segment.
Gain (Loss) on Disposal or Sales of Fixed Assets—Net For the previous year, gains on disposal of fixed assets were recorded in the Mineral & Metal Resources Segment, the Iron & Steel Products Segment and the Innovation & Corporate Development Segment, while a loss was recorded in the Chemical Segment.
Other Income (Expense)—Net For the current year, the Chemical Segment recorded insurance proceeds in the business in North America, the Innovation & Corporate Development Segment recorded a valuation profit on a derivative in relation to a put option of an investment, and the Mineral & Metal Resources Segment recorded insurance proceeds in Mitsui Bussan Aerospace Co., Ltd. Furthermore, a gain on the sales of property management business in Mitsui & Co. Foresight Ltd. was recorded in the Lifestyle Segment. For the previous year, the Chemical Segment recorded a loss on the fire accident.
Reversal of Provision Related to Multigrain Business
For the previous year, the Lifestyle Segment recorded a gain on the reversal of the provision for the withdrawal from business.
Finance Income (Costs)
Dividend Income
Mainly the Energy Segment recorded a decline, while the Mineral & Metal Resources Segment recorded an increase.
- 3 -

Share of Profit (Loss) of Investments Accounted for Using the Equity Method
Mainly the Lifestyle Segment, the Energy Segment and the Machinery & Infrastructure Segment recorded an increase, while the Mineral & Metal Resources Segment recorded a decline.
Income Taxes
Income taxes for the current year were ¥123.0 billion, a decrease of ¥29.6 billion from ¥152.6 billion for the previous year. The effective tax rate for the current period was 23.0%, a decrease of 3.1 points from 26.1% for the previous year mainly due to a decrease of a valuation allowance to deferred tax asset.
Profit for the Year Attributable to Owners of the Parent Impacts caused by a drop in commodity prices such as crude oil price and impacts to a part of trading businesses due to the spread of COVID-19 were included. As a result, profit for the year attributable to owners of the parent was ¥391.5 billion, a decline of ¥22.7 billion from the previous year.
2) Operating Results by Operating Segment Real estate business and materials business, which were part of the Lifestyle Segment, were transferred to the Innovation & Corporate Development Segment and Chemicals Segment, respectively, effective April 1, 2019. In accordance with the aforementioned changes, the operating segment information for the previous year has been restated to conform to the current year's presentation. The description order of reporting segments has been changed in the segment information for the current year , and this change also applies to the previous year.
Iron & Steel Products Segment (Billions of Yen) Current Year Previous Year Change
Profit for the year attributable to owners of the parent 4.7 9.9 (5.2)
Gross profit 24.6 27.2 (2.6)
Profit (loss) of equity method investments 13.1 16.2 (3.1)
Dividend income 1.9 1.7 0.2
Selling, general and administrative expenses (27.2) (27.8) 0.6
Others (7.7) (7.4) (0.3)
・ Others include the following factor: - For the previous year, a one-time gain of ¥5.9 billion was recorded due to the sale of land of an affiliated
company.
- 4 -

Mineral & Metal Resources Segment (Billions of Yen) Current Year Previous Year Change
Profit for the year attributable to owners of the parent 183.3 167.2 16.1
Gross profit 226.0 175.6 50.4
Profit (loss) of equity method investments 59.2 59.3 (0.1)
Dividend income 25.2 20.9 4.3
Selling, general and administrative expenses (41.6) (32.3) (9.3)
Others (85.5) (56.3) (29.2)
・ Gross profit increased mainly due to the following factors: - Iron ore mining operations in Australia reported an increase of ¥68.5 billion mainly due to higher iron ore sales prices.
- Coal mining operations in Australia reported a decrease of ¥17.0 billion mainly due to lower coal sales prices. ・ Profit (loss) of equity method investments declined mainly due to the following factors:
- An impairment loss of ¥5.1 billion was recorded for Nacala Corridor rail & port infrastructure business in Mozambique, reflecting the revisions to our various assumptions for the current period.
- Coal mining operations in Australia reported a decrease of profit mainly due to lower coal sales prices. - Iron ore mining operations in Australia reported an increase of ¥14.2 billion mainly due to higher iron ore sales prices.
・ Dividend income increased mainly due to higher dividends from iron ore mining operations in Australia. ・ Selling, general and administrative expenses increased mainly due to the following factor:
- For the current year, an impairment loss of ¥9.8 billion for doubtful debt was posted, reflecting the revisions to our various assumptions regarding the Moatize mine business in Mozambique.
・ In addition to the above, the following factors also affected results: - For the current year, iron ore mining operations in Australia reported a decrease of profit amounting to ¥26.8 billion mainly due to the increase of income tax caused by gross profit increase.
- For the previous year, coal mining operations in Australia reported a gain on the sales of fixed assets of Bengalla Joint Venture.
Energy Segment (Billions of Yen) Current Year Previous Year Change
Profit for the year attributable to owners of the parent 59.7 95.7 (36.0)
Gross profit 141.5 134.0 7.5
Profit (loss) of equity method investments 45.9 40.3 5.6
Dividend income 52.7 65.2 (12.5)
Selling, general and administrative expenses (43.4) (45.1) 1.7
Others (137.0) (98.7) (38.3)
・ Gross profit increased mainly due to the following factors: - Business division at the Headquarters reported an increase due to good performance in the LNG trading business.
- Mitsui & Co. Energy Trading Singapore Pte. Ltd. reported an increase of ¥5.9 billion mainly due to good performance in the oil trading business.
- MEP Texas Holdings LLC reported a decrease of ¥4.5 billion mainly due to lower oil and gas prices. - Mitsui E&P Middle East B.V. reported a decrease of ¥3.7 billion mainly due to higher costs.
- 5 -

- Mitsui E&P USA LLC reported a decrease of ¥3.1 billion mainly due to lower gas prices. ・ Profit of equity method investment increased mainly due to the following factors:
- Mitsui E&P Mozambique Area 1 Limited reported an increase of ¥11.2 billion mainly due to the recognition of deferred tax assets in accordance with the Final Investment Decision for the project.
- Japan Arctic LNG B.V. recorded an increase of ¥4.1 billion mainly due to evaluation gains on changes in oil price, FX and others.
- Japan Australia LNG (MIMI) Pty. Ltd. reported a decrease due to lower oil and gas prices. ・ Dividends from six LNG projects (Sakhalin II, Qatargas 1, Abu Dhabi, Oman, Qatargas 3 and Equatorial Guinea)
were ¥50.3 billion in total, a decrease of ¥13.1 billion from the previous year. ・ In addition to the above, the following factors also affected results:
- For the current year, mainly due to the fall in oil price, Mitsui E&P Australia Pty Limited recorded an impairment loss of ¥31.2 billion for its Greater Enfield project located in offshore Western Australia, MEP Texas Holdings LLC recorded an impairment loss of ¥23.4 billion for its Eagle Ford shale oil and gas business, Mitsui E&P Italia A S.r.l recorded an impairment loss of ¥13.9 billion for its Tempa Rossa project, a subsidiary of Mitsui Oil Exploration Co., Ltd. recorded an impairment loss of ¥4.3 billion for its offshore project in the Gulf of Mexico.
- For the current year, exploration expenses of ¥7.2 billion in total were recorded, including those recorded by Mitsui Oil Exploration Co., Ltd. For the previous year, exploration expenses of ¥6.3 billion in total were recorded, including those recorded by Mitsui Oil Exploration Co., Ltd.
- For the previous year, mainly due to changes in the development plan, MEP Texas Holdings LLC recorded an impairment loss of ¥11.6 billion for its Eagle Ford shale oil and gas business.
Machinery & Infrastructure Segment (Billions of Yen) Current Year Previous Year Change
Profit for the year attributable to owners of the parent 87.5 78.4 9.1
Gross profit 134.2 130.7 3.5
Profit (loss) of equity method investments 87.7 87.5 0.2
Dividend income 5.1 5.8 (0.7)
Selling, general and administrative expenses (134.4) (123.4) (11.0)
Others (5.1) (22.2) 17.1
・ Gross Profit increased mainly due to the following factors: - For the current year, Bussan Auto Finance recorded an increase of ¥4.6 billion due to good sales in motorcycle and car financing business.
- For the current year, gross profit were recorded in newly consolidated subsidiary related to overseas rail business.
・Profit of equity method investments increased mainly due to the following factors: - For the previous year, a loss was recorded at an equity accounted investee due to its overseas rail project. - For the current year, a gain was recorded at investments of the IPP project in Indonesia mainly due to the review of the calculation of the deferred tax liability.
- For the current year, investments in gas distribution companies in Brazil recorded an increase reflecting the refund of service tax payments through arbitrations.
- For the current year, a gain was recorded at an automobile company in Canada due to good sales results. - For the current year, FPSO/FSO leasing companies recorded a decrease of ¥5.4 billion reflecting refinancing and other costs.
- 6 -

- For the current year, a loss was recorded at investments in offshore supporting vessels mainly due to impairment of assets.
- For the current year, a loss of ¥3.7 billion was recorded at VLI S.A., an integrated freight transportation company in Brazil mainly due to change of the accounting principle.
- For the previous year, deferred tax assets were recorded at an equity accounted investee due to the change of the investment structure in the IPP(Independent Power Plant) business.
・Selling, general and administrative expenses increased due to the following factors: - For the current year, Bussan Auto Finance recorded an increase of ¥6.3 billion due to an increase of depreciation expenses in motorcycle and car financing business.
- For the current year, selling, general and administrative expenses were recorded in newly consolidated subsidiary related to overseas rail business.
・In addition to the above, the following factor also affected the results: - For the current year, a gain on sale of IPP business in North America was recorded. - For the current year, Mitsui Bussan Aerospace Co., Ltd. reported an other income and expense of ¥4.0 billion mainly due to insurance proceeds.
- For the current year, an impairment loss on fixed assets was recorded in overseas rail project. - For the previous year, deferred tax assets were recorded at a holding company due to the change of the investment structure in the IPP business.
Chemicals Segment (Billions of Yen) Current Year Previous Year Change
Profit for the year attributable to owners of the parent 22.3 5.2 17.1
Gross profit 116.8 148.0 (31.2)
Profit (loss) of equity method investments 11.5 14.3 (2.8)
Dividend income 2.7 2.8 (0.1)
Selling, general and administrative expenses (101.9) (105.0) 3.1
Others (6.8) (54.9) 48.1
・ Gross profit decreased mainly due to the following factors: - A decline of ¥7.6 billion was recorded mainly due to price drop of methanol in MMTX Inc. - A decline of ¥6.8 billion was recorded mainly due to price drop of main products in Novus International, Inc. - Decline was recorded in Intercontinental Terminals Company LLC mainly due to the accidental incident.
・ Others include the following factors: - For the previous year, Intercontinental Terminals Company LLC recorded other expenses of ¥20.6 billion due to the fire. - For the previous year, Novus International, Inc. reported a loss of ¥14.0 billion as a result of reassessing projects to increase production capacity of methionine due to the increase of the project cost.
- For the current year, insurance proceeds were recorded in the business in North America.
- 7 -

Lifestyle Segment (Billions of Yen) Current Year Previous Year Change
Profit for the year attributable to owners of the parent 32.0 36.3 (4.3)
Gross profit 134.9 141.8 (6.9)
Profit (loss) of equity method investments 35.0 26.4 8.6
Dividend income 4.2 5.1 (0.9)
Selling, general and administrative expenses (139.3) (136.7) (2.6)
Others (2.8) (0.3) (2.5)
・ Gross profit decreased mainly due to the following factor: - For the current year, a ¥2.4 billion loss was recorded in the valuation of fair value mainly due to suspension of drug development in the drug development fund invested through MBK Pharma Partnering Inc.
・ Profit (loss) of equity method investments increased mainly due to the following factors: - For the current year, International Columbia U.S. LLC divested Columbia Asia Healthcare Pte. Ltd and capital gain of ¥13.0 billion from this transaction was recorded.
- For the current year, a profit under the equity method from IHH Healthcare Berhad increased by ¥3.0 billion due to the additional share acquisition.
・ In addition to the above, the following factors also affected results: - For the current year, an impairment loss on fixed assets of ¥14.0 billion was recorded due to a decline of the fair value of its farmland and others, mainly caused by a depreciation of the Brazilian real against the U.S. dollar in XINGU AGRI AG conducting a production business of agricultural products in Brazil.
- For the current year, an impairment loss of fixed assets of ¥6.8 billion was recorded mainly due to a partially poor business performance in Accountable Healthcare Holdings Corporation, which conducts healthcare staffing in the U.S.
- For the current year, there was a ¥12.5 billion decline in tax burden in relation to income taxes recognized as other comprehensive income corresponding to sales of financial assets measured at FVTOCI, including the share of Recruit Holdings Co., Ltd.
- For the current year, a capital gain from the sales of Sogo Medical Holdings Co., Ltd. and the reversal of deferred tax liability for the retained earnings, totally ¥8.7 billion were recorded.
- For the current year, Mitsui & Co. Foresight recorded a gain on the sales of property management business. - For the current year, a gain from the partial sale and deconsolidation of RareJob, Inc. was recorded. - For the previous year, Multigrain Trading AG recorded a gain of ¥11.6 billion on reversal of the provision for the withdrawal from business.
- For the previous year, a ¥7.5 billion profit was recorded due to the change in the profit share in IHH Healthcare Berhad following the increase in the number of outstanding shares.
Innovation & Corporate Development Segment (Billions of Yen) Current Year Previous Year Change
Profit for the year attributable to owners of the parent 14.6 22.0 (7.4)
Gross profit 60.1 78.6 (18.5)
Profit (loss) of equity method investments 17.0 13.1 3.9
Dividend income 3.3 3.1 0.2
Selling, general and administrative expenses (64.5) (64.5) -
Others (1.3) (8.3) 7.0
- 8 -

・ Gross profit declined mainly due to the following factors: - For the previous year, a ¥3.0 billion gain was recorded due to the valuation of fair value on shares in Hutchison China MediTech Ltd., while a ¥6.5 billion loss was recorded due to the valuation of fair value on shares for the current year.
- A decline of ¥5.2 billion was recorded mainly due to the gain on the valuation and sales of the shares in Mercari, Inc., for the previous year.
- A decline of ¥3.7 billion was recorded mainly due to the gain on the valuation of fair value on an IoT related company recorded for the previous year as well as the loss recorded for the current year.
・ Others includes the following factors: - For the current year, a gain on the sales of equity stake in real estate business in Singapore was recorded. - For the current year, a valuation profit on the derivative of ¥4.4 billion was recorded in related to a put option of an investment.
- For the previous year, a gain on the sales of real estate in Japan was recorded.
- 9 -

(3) Financial Condition and Cash Flows
1) Financial Condition
(Billions of yen) March 31, 2020 March 31, 2019 Change
Total Assets 11,806.3 11,945.8 (139.5)
Current Assets 4,124.4 3,996.3 +128.1
Non-current Assets 7,681.9 7,949.5 (267.6)
Current Liabilities 2,701.1 2,740.3 (39.2)
Non-current Liabilities 5,044.3 4,675.2 +369.1
Net Interest-bearing Debt(*) 3,486.7 3,592.0 (105.3)
Total Equity Attributable to Owners of the Parent
3,817.7 4,263.2 (445.5)
Net Debt-to-Equity Ratio (times) 0.91 0.84 +0.07
(*) Since current period, Interest-bearing debt is calculated by excluding lease liability from short-term debt and long-term debt. As a result of this change, the Net Interest-bearing Debt at March 31, 2019 has been restated.
Assets
Current Assets: ・ Cash and cash equivalents increased by ¥102.6 billion. ・ Trade and other receivables declined by ¥181.7 billion, mainly due to declines in trading volume in the
Chemical Segment, the Mineral & Metal Resources Segment, and the Lifestyle Segment. ・ Other financial assets increased by ¥308.4 billion, mainly due to increases in trading volume of derivative
trading in the Energy Segment and the Innovation & Corporate Development Segment. ・ Inventories declined by ¥53.8 billion, mainly due to declines in trading volume in the Chemical Segment, the
Energy Segment, and the Machinery & Infrastructure Segment. ・ Advance payments to suppliers declined by ¥52.5 billion, mainly due to declines in trading volume in the
Machinery & Infrastructure Segment.
Non-current Assets: ・ Investments accounted for using the equity method declined by ¥94.7 billion, mainly due to the following
factors: - A decline of ¥166.7 billion resulting from foreign currency exchange fluctuations; - A decline of ¥20.9 billion due to a sale of partial operation in International Columbia U.S. LLC, the holding
company for Asia’s largest hospital group for middle-income patients; - A decline of ¥13.9 billion due to a sale of logistics facilities development business in China; - A decline of ¥12.3 billion due to a sale of shares in Sogo Medical Holdings Co., Ltd.; - A decline due to a fair value valuation of shares in Arctic LNG 2 Project in Russia through Japan Arctic
LNG; - An increase of ¥36.5 billion due to correction of Mitsui E&P Mozambique Area 1 Limited’s company
category to investments accounted for using the equity method; - An increase due to an acquisition of shares in Arctic LNG 2 Project in Russia through Japan Arctic LNG
B.V.; - An increase of ¥16.9 billion due to an investment in Minh Phu Seafood Joint Stock Company, a shrimp
producer and processor in Vietnam; - An increase of ¥15.8 billion due to an investment in Mitsui E&P Mozambique Area 1 Limited, which
participates in the Mozambique LNG Project; and
- 10 -

- An increase of ¥269.2 billion corresponding to the profit of equity method investments for the current period, despite a decline of ¥208.2 billion due to dividends received from equity accounted investees.
・ Other investments declined by ¥463.2 billion, mainly due to the following factors: - Mainly due to lower share prices, fair value on financial assets measured at FVTOCI and FVTPL declined
by ¥375.1 billion and ¥12.7 billion, respectively; - A decline of ¥44.8 billion mainly due to a partial sale of investment in Recruit Holdings Co., Ltd.; and
- A decline of ¥10.3 billion resulting from foreign currency exchange fluctuations. ・ Property, plant and equipment increased by ¥176.0 billion, mainly due to the following factors:
- An increase of ¥257.6 billion corresponding to adoption of IFRS 16 “Leases”; - An increase of ¥57.1 billion corresponding to time charter parties of LNG ships for Cameron LNG Export
Project in the U.S.; - An increase of ¥54.4 billion for the integrated development project in the 2, Otemachi 1-Chome District; - An increase of ¥19.7 billion (including foreign exchange translation loss of ¥0.3 billion) at the distributed
power project in the U.S.; - An increase of ¥12.3 billion (including foreign exchange translation loss of ¥3.2 billion) at railroad rolling
stock related leasing business in Europe; - An increase of ¥10.2 billion (including foreign exchange translation loss of ¥1.6 billion) at sugar
manufacturing business in Thailand; - A decline of ¥46.4 billion mainly due to a deterioration of fixed assets at Mitsui E&P Australia Pty Limited
(including foreign exchange translation loss of ¥15.2 billion) at the oil and gas projects other than the U.S. shale gas and oil projects;
- A decline of ¥38.5 billion due to correction of Mitsui E&P Mozambique Area 1 Limited’s company category to investments accounted for using the equity method;
- A decline of ¥36.5 billion (including foreign exchange translation loss of ¥50.8 billion) at iron ore mining operations in Australia; and
- A decline of ¥33.2 billion mainly due to a deterioration of fixed assets at MEP Texas Holdings LLC (including foreign exchange translation loss of ¥2.5 billion) at the U.S. shale gas and oil projects.
・ Investment property increased by ¥48.7 billion, mainly due to an increase of ¥38.8 billion for the integrated development project in the 2, Otemachi 1-Chome District.
・ Intangible assets increased by ¥21.2 billion, mainly due to the following factors: - An increase of ¥44.5 billion for the Brazilian rail business restructuring; and
- A decline of ¥14.3 billion mainly due to a deterioration of goodwill at Mitsui E&P Italia A S.r.l.
Liabilities
Current Liabilities: ・ Short-term debt declined by ¥39.5 billion. Furthermore, the current portion of long-term debt declined by ¥79.5
billion, mainly due to repayment of debt, despite reclassification to current maturities. ・ Trade and other payables declined by ¥185.8 billion, corresponding to the declines in trade and other
receivables. ・ Other financial liabilities increased by ¥348.5 billion, corresponding to the increases in other financial assets
and mainly due to an increase of account payable-other with the completion of construction at the integrated development project in the 2, Otemachi 1-Chome District.
・ Advances from customers declined by ¥68.2 billion, corresponding to the declines in advance payments to suppliers.
- 11 -

Non-current Liabilities: ・ Long-term debt, less the current portion, increased by ¥420.1 billion, mainly due to adoption of IFRS 16
“Leases”. ・ Deferred tax liabilities declined by ¥86.8 billion, mainly due to the declines in financial assets measured at
FVTOCI.
Total Equity Attributable to Owners of the Parent ・ Retained earnings increased by ¥283.6 billion. ・ Other components of equity declined by ¥687.2 billion, mainly due to the following factors:
- Financial assets measured at FVTOCI declined by ¥349.0 billion, mainly due to lower share prices; and
- Foreign currency translation adjustments declined by ¥301.6 billion, mainly reflecting the appreciation of the Japanese yen against the Australian dollar and the Brazilian real .
・ Treasury stock, which is a subtraction item in shareholders’ equity, increased by ¥57.5 billion, mainly due to share buy-back.
2) Cash Flows
(Billions of yen) Current Year Previous Year Change
Cash flows from operating activities 526.4 410.7 +115.7
Cash flows from investing activities (185.2) (719.0) +533.8
Free cash flow 341.2 (308.3) +649.5
Cash flows from financing activities (204.6) 127.4 (332.0)
Effect of exchange rate changes on cash and cash equivalents etc.
(34.0) 5.6 (39.6)
Change in cash and cash equivalents 102.6 (175.3) +277.9
Cash Flows from Operating Activities
(Billions of Yen) Current Year Previous Year Change
Cash flows from operating activities a 526.4 410.7 +115.7
Cash flows from change in working capital b (95.5) (159.8) +64.3
Core operating cash flow a-b 621.9 570.5 +51.4
・ Net cash from an increase or a decrease in working capital, or changes in operating assets and liabilities for the current year was ¥95.5 billion of net cash outflow. Core operating cash flow, cash flows from operating activities without the net cash flow from an increase or a decrease in working capital, for the current year amounted to ¥621.9 billion. - Net cash inflow from dividend income, including dividends received from equity accounted investees, for
the current year totaled ¥299.2 billion, a decline of ¥19.5 billion from ¥318.7 billion for the previous year. - Depreciation and amortization for the current year was ¥256.1 billion, an increase of ¥69.8 billion from
¥186.3 billion for the previous year.
- 12 -

The following table shows core operating cash flow by operating segment. (Billions of Yen) Current Year Previous Year Change
Iron & Steel Products 2.6 5.9 (3.3)
Mineral & Metal Resources 244.8 181.5 +63.3
Energy 221.0 219.1 +1.9
Machinery & Infrastructure 95.2 74.0 +21.2
Chemicals 38.3 31.0 +7.3
Lifestyle 37.3 24.7 +12.6
Innovation & Corporate Development 8.6 19.8 (11.2)
All Other and Adjustments and Eliminations (25.9) 14.5 (40.4)
Consolidated Total 621.9 570.5 +51.4
Cash Flows from Investing Activities
・ Net cash inflows that corresponded to investments in equity accounted investees (net of sales of investments inequity accounted investees) were ¥9.1 billion, mainly due to the following factors:- A sale of partial operation in International Columbia U.S. LLC, the holding company for Asia’s largest
hospital group for middle-income patients, for ¥23.8 billion;- A sale of shares in Sogo Medical Holdings Co., Ltd., for ¥19.5 billion;- A sale of logistics facilities development business in China, for ¥18.3 billion;- A sale of investment in C2C LP, power wind & solar power generation portfolio in Canada, for ¥16.8
billion;- An acquisition of shares in Arctic LNG 2 Project in Russia through Japan Arctic LNG B.V.;- An investment in Minh Phu Seafood Joint Stock Company, a shrimp producer and processor in Vietnam, for
¥16.9 billion; and- An investment in Mitsui E&P Mozambique Area 1 Limited, which participates in the Mozambique LNG
Project, for ¥15.8 billion.・ Net cash inflows that corresponded to other investments (net of sales and maturities of other investments) were
¥70.7 billion, mainly due to a partial sale of investment in Recruit Holdings Co., Ltd., for ¥44.8 billion.・ Net cash inflows that corresponded to increase in loan receivables (net of collections of loan receivables) were
¥0.7 billion, mainly due to the execution of loans to the IPP project in Middle East for ¥17.8 billion.・ Net cash outflows that corresponded to purchases of property, plant, and equipment (net of sales of those
assets) were ¥253.1 billion, mainly due to the following factors:- An expenditure for the oil and gas projects other than the U.S. shale gas and oil projects for a total of ¥62.9
billion- An expenditure for iron ore mining operations in Australia for ¥34.0 billion;- An expenditure for the integrated development project in the 2, Otemachi 1-Chome District for ¥25.3
billion;- An expenditure for coal mining operations in Australia for ¥18.4 billion;- An expenditure for the distributed power project in the U.S. for ¥17.7 billion;- An expenditure for railroad rolling stock related leasing business in Europe for ¥16.9 billion;- An expenditure for sugar manufacturing business in Thailand for ¥13.0 billion; and- An expenditure for tank operation in the U.S. for ¥12.4 billion.
- 13 -

Cash Flows from Financing Activities
・ Net cash outflows from net change in short-term debt were ¥27.2 billion and net cash inflows from net changein long-term debt were ¥27.5 billion.
・ The cash outflow from the purchases of treasury stock was ¥58.1 billion.・ The cash outflow from payments of cash dividends was ¥139.1 billion.
- 14 -

2. Management Policies(1) New Medium-Term Management PlanPlease refer to the new Medium-term Management Plan "Medium-term Management Plan 2023 - Transform andGrow - " announced today.
(2) Forecasts for the Year Ending March 31, 20211) Forecasts for the year ending March 31, 2021
[Assumption] Forecast Result
Exchange rate (JPY/USD) 108.00 108.95
Crude oil (JCC) $33/bbl $67/bbl
Consolidated oil price $39/bbl $68/bbl
(Billions of yen) March 31,
2021 Forecast
March 31, 2020
Result Change Description
Gross profit 680.0 839.4 (159.4) COVID-19 Lower crude oil and gas prices Lower iron ore prices
Selling, general and administrative expenses
(610.0) (584.9) (25.1) Miscellaneous
Gain (loss) on investments, fixed assets and other
30.0 (37.7) +67.7Absence of impairment loss in Energy segment
Interest expenses (50.0) (48.2) (1.8)
Dividend income 60.0 96.5 (36.5)Decrease in dividends from six LNG projects
Profit (loss) of equity method investments
170.0 269.2 (99.2) COVID-19 Lower crude oil and gas prices
Profit before income taxes 280.0 534.3 (254.3)
Income taxes (85.0) (123.0) +38.0
Non-controlling interests (15.0) (19.8) +4.8
Profit for the year attributable to owners of the parent
180.0 391.5 (211.5)
Depreciation and amortization 300.0 256.1 +43.9
Core operating cash flow 400.0 561.0 (161.0)
・ Forecast for the fiscal year ending March 2021 is calculated on the assumption that the impact of the spread of COVID-19 will recover from the latter half of the fiscal year ending March 2021.
・ We assume foreign exchange rates for the year ending March 31, 2021 will be ¥108/US$, ¥75/AU$ and¥26/BRL, while average foreign exchange rates for the year ended March 31, 2020 were ¥108.95/US$,¥73.81/AU$ and ¥26.29/BRL. Also, we assume the annual average crude oil price applicable to our financial results for the year ending March 31, 2021 will be US$39/barrel, down US$29 from the previous year, based on the assumption that the crude oil price (JCC) will average US$33/barrel throughout the year ending March 31, 2021.
・ From April 1, 2020, in order to reflect a regular cash generation output from operating activities more appropriately, a payment amount for repayment of lease obligation (absolute value) has been deducted from
- 15 -

Core operating cash flow. In conformity with this change, Core operating cash flow for the year ended March, 2020 has been restated.
The forecast for profit for the year attributable to owners of the parent by operating segment compared to the original forecast is as follows: Effective April 1, 2020, in order to accelerate our multifaceted, flexible initiatives that combine various kinds of knowledge from different business domains, the business of the infrastructure of next-generation electric power was transferred from the Machinery & Infrastructure segment to the Energy segment, in conjunction with the creation of the Energy Solutions Business Unit in Energy segment. In accordance with the aforementioned changes, the operating segment information for the year ended March 31, 2020 has been restated to conform to the operating segments as of April 2020.
(Billions of yen) Year ending March 31, 2021
Year ended March 31, 2020 Change Description
Iron & Steel Products 5.0 4.7 +0.3 Mineral & Metal Resources
120.0 183.3 (63.3) Lower iron ore prices
Energy 0.0 57.8 (57.8) Lower crude oil and gas prices Machinery & Infrastructure
35.0 89.4 (54.4) COVID-19
Chemicals 20.0 22.3 (2.3)
Lifestyle 5.0 32.0 (27.0) COVID-19 Innovation & Corporate Development
15.0 14.6 +0.4
All Other and Adjustments and Eliminations
(20.0) (12.6) (7.4)
Consolidated Total 180.0 391.5 (211.5)
The forecast for core operating cash flow by operating segment compared to the original forecast is as follows:
(Billions of yen) Year ending March 31, 2021
Year ended March 31, 2020 Change Description
Iron & Steel Products 0.0 2.2 (2.2) Mineral & Metal Resources
160.0 243.7 (83.7) Lower iron ore prices
Energy 90.0 206.5 (116.5) Lower crude oil and gas prices Machinery & Infrastructure
60.0 86.9 (26.9) COVID-19
Chemicals 45.0 35.8 +9.2
Lifestyle 15.0 20.8 (5.8) Innovation & Corporate Development
15.0 3.9 +11.1
All Other and Adjustments and Eliminations
15.0 (38.8) +53.8 Absence of contribution to corporate pension
Consolidated Total 400.0 561.0 (161.0)
- 16 -

2) Key commodity prices and other parameters for the year ending March 31, 2021
The table below shows assumptions for key commodity prices and foreign exchange rates for the forecast for the year ending March 31, 2021. The effects of movements on each commodity price and foreign exchange rates on profit for the year attributable to owners of the parent are included in the table.
Impact on profit for the year attributable to owners of the parent for the Year ending March 31, 2021
March 2021 Assumption
March 2020 Result
Commodity
Crude Oil/JCC - 33 67
Consolidated Oil Price (*1) ¥3.2 bn (US$1/bbl) 39 68
U.S. Natural Gas (*2) ¥0.9 bn (US$0.1/mmBtu) 2.15 (*3) 2.53 (*4) Iron Ore(*5) ¥2.2 bn (US$1/ton) (*6)
←
95 (*7)
Coal Coking ¥0.4 bn (US$1/ton) (*6) 169 (*8) Thermal ¥0.1 bn (US$1/ton) (*6) 95 (*8)
Copper (*9) ¥0.7 bn (US$100/ton) 5,600 6,005 (*10)
Forex (*11)
USD ¥1.3 bn (¥1/USD) 108 108.95
AUD ¥1.6 bn (¥1/AUD) 75 73.81
BRL ¥0.3 bn (¥1/BRL) 26 26.29
(*1) As the crude oil price affects our consolidated results with a 0-6 month time lag, the effect of crude oil prices on consolidated results is estimated as the Consolidated Oil Price, which reflects this lag. For the year ending Mar/2021 we have assumed that there is a 4-6 month lag for approx. 30%, a 1-3 month lag for approx. 50%, and no lag for approx. 20%. The above sensitivities show annual impact of changes in consolidated oil price.
(*2) As Mitsui has very limited exposure to U.S. natural gas sold at Henry Hub (HH), the above sensitivities show annual impact of changes in the weighted average sale price.
(*3) HH price of US$2.15/mmBtu is assumed for sales prices linked to the HH price. (*4) U.S. gas figures FY Mar/2020 are the Henry Hub Natural Gas Futures average daily prompt month closing
prices traded on NYMEX during January to December 2019. (*5) The effect of dividends received from Vale has not been included. (*6) Iron ore and coal price assumptions are not disclosed. (*7) Iron ore results figures for FY Mar/2020 are the daily average (reference price) spot indicated price (Fe 62%
CFR North China) recorded in several industry trade magazines from April 2019 to March 2020. (*8) Coal results figures for FY Mar/2020 are the quarterly average prices of representative coal brands (US$/MT)
(*9) As the copper price affects our consolidated results with a 3 month time lag, the above sensitivities show the annual impact of US$100/ton change in averages of the LME monthly average cash settlement prices for the period March to December 2020.
(*10) Copper results figures for FY Mar/2020 are the averages of the LME monthly average cash settlement prices for the period January to December 2019.
(*11) Impact of currency fluctuations on reported profit for the year of overseas subsidiaries and equity accounted investees denominated in functional currencies. Depreciation of the yen has the effect of increasing profit for the year through the conversion of profit for the year of overseas subsidiaries and associated companies (denominated in functional currencies) into yen. In the Metal Resources and Energy business where the sales contract is in US$ the impact of currency fluctuations between the US$ and the functional currencies (Australian dollar and Brazilian real) and the impact of currency hedging are not included.
- 17 -

(3) Profit Distribution Policy
Our profit distribution policy is as follows: ・ In order to increase corporate value and maximize shareholder value, we seek to maintain an optimal balance
between (a) meeting investment demand in our core and growth areas through re-investments of our retained earnings, and (b) directly providing returns to shareholders by paying out cash dividends.
・ In addition to the above, in relation to share buyback toward improving capital efficiency, it should be decided in a prompt and flexible manner as needed concerning its timing and amount by taking into consideration of the business environment such as, future investment activity trends, free cash flow and interest-bearing debt levels, and return on equity.
For the year ended March 31, 2020, we conducted ¥57.9 billion repurchase of its own shares. For the year ended March 31, 2020, we currently envisage an annual dividend of ¥80 per share (including the interim dividend of ¥40 per share), the same amount as the year ended March 31, 2019, taking into consideration of core operating cash flow and profit for the year attributable to owners of the parent as well as stability and continuity of the amount of dividend.
For the period of the new Medium-term Management Plan, emphasizing stability and continuity regarding dividends, we have established a minimum annual dividend amount of ¥80 per share, based on our assessment of achievable stable core operating cash flow. In addition, we aim to steadily increase dividends through improvements in corporate performance. Based on corporate performance during the period of the new Medium-term Management Plan, a part of our cash-out amount will flexibly and promptly be allocated to an investment for growth as well as shareholders return such as an additional dividend and share buyback. For the year ending March 31, 2021, we currently envisage an annual dividend of ¥80 per share (the same as the year ended March 31, 2020), taking into consideration of core operating cash flow and profit for the year attributable to owners of the parent as well as stability and continuity of the amount of dividend.
3. Basic Approach on Adoption of Accounting Standards
International Financial Reporting Standards was adopted on our annual securities report under the Financial Instruments and Exchange Act for the year ended March 31, 2014 for the purpose of improving international comparability of financial information as well as enhancement and efficiency of our financial reporting.
4. Other Information
Notice: This flash report contains forward-looking statements about Mitsui and its consolidated subsidiaries. These forward-looking statements are based on Mitsui’s current assumptions, expectations and beliefs in light of the information currently possessed by it and involve known and unknown risks, uncertainties and other factors. Such risks, uncertainties and other factors may cause Mitsui’s actual consolidated financial position, consolidated operating results or consolidated cash flows to be materially different from any future consolidated financial position, consolidated operating results or consolidated cash flows expressed or implied by these forward-looking statements. These risks, uncertainties and other factors include, among others, the effect of global spread of COVID-19 infections and (1)risks of changes in global macroeconomic factors, (2)market risks of 1)commodity market risk, 2)foreign currency risk, 3)interest rate risk, 4)stock price risk, 5)risks regarding pension cost and defined benefit obligations, (3)credit risks, (4)risks regarding impairment loss on fixed assets, (5)risks regarding fund procurement, (6)risks regarding deferred tax assets, (7)concentrated risk exposures, (8)business investment risk, (9)
- 18 -

risks regarding exploration, development and production of mineral resources and oil and gas, (10)risks due to competition, (11)risks regarding limitation of resources on business, (12)environmental risks, (13)risks associated with laws and regulations, (14)risks regarding employee's compliance with laws, regulations, and internal policies, (15)risks regarding internal control, (16)risks regarding climate changes and natural disasters, (17)risks regarding information systems and information securities, (18)risks relating to terrorists and violent groups. For further information on the above, please refer to Mitsui’s Annual Securities Report. Forward-looking statements may be included in Mitsui’s Annual Securities Report and Quarterly Securities Reports or in its other disclosure documents, press releases or website disclosures. Mitsui undertakes no obligation to publicly update or revise any forward-looking statements.
- 19 -
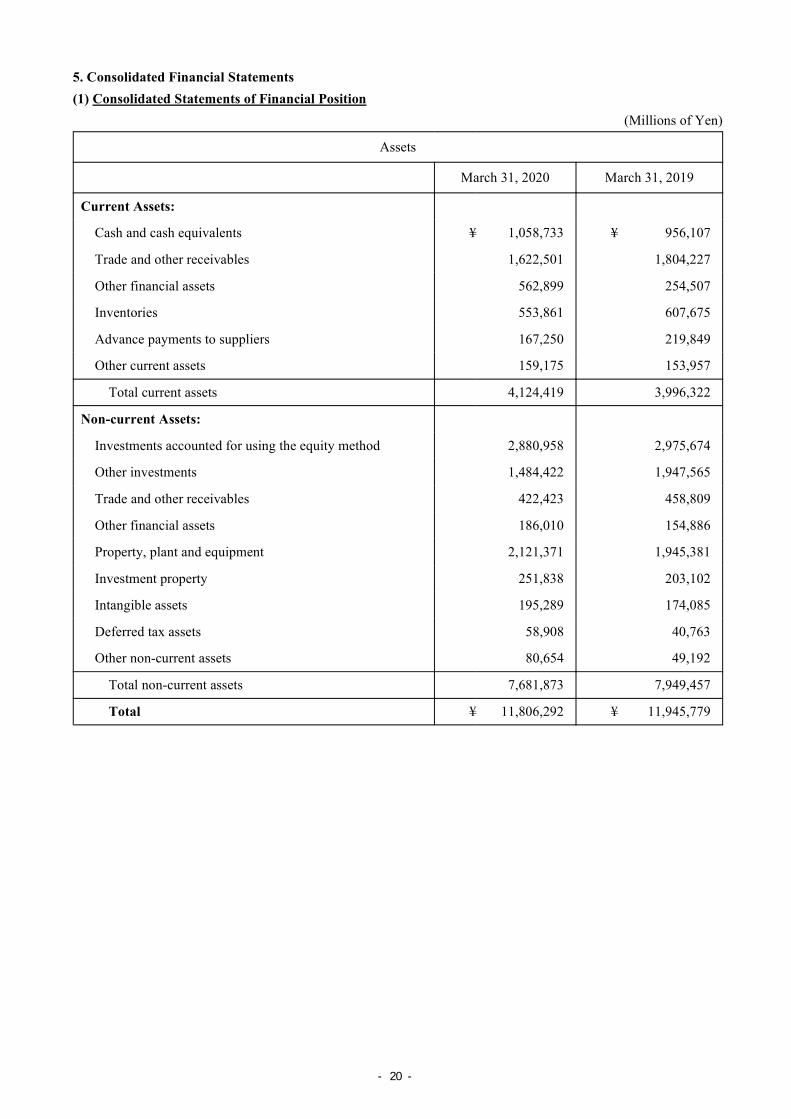
5. Consolidated Financial Statements
(1) Consolidated Statements of Financial Position
(Millions of Yen)
Assets
March 31, 2020 March 31, 2019
Current Assets:
Cash and cash equivalents ¥ 1,058,733 ¥ 956,107
Trade and other receivables 1,622,501 1,804,227
Other financial assets 562,899 254,507
Inventories 553,861 607,675
Advance payments to suppliers 167,250 219,849
Other current assets 159,175 153,957
Total current assets 4,124,419 3,996,322
Non-current Assets:
Investments accounted for using the equity method 2,880,958 2,975,674
Other investments 1,484,422 1,947,565
Trade and other receivables 422,423 458,809
Other financial assets 186,010 154,886
Property, plant and equipment 2,121,371 1,945,381
Investment property 251,838 203,102
Intangible assets 195,289 174,085
Deferred tax assets 58,908 40,763
Other non-current assets 80,654 49,192
Total non-current assets 7,681,873 7,949,457
Total ¥ 11,806,292 ¥ 11,945,779
- 20 -

(Millions of Yen)
Liabilities and Equity
March 31, 2020 March 31, 2019
Current Liabilities:
Short-term debt ¥ 297,458 ¥ 337,028
Current portion of long-term debt 399,904 479,390
Trade and other payables 1,136,504 1,322,274
Other financial liabilities 626,963 278,472
Income tax payables 46,206 47,197
Advances from customers 133,247 201,444
Provisions 25,844 34,458
Other current liabilities 34,984 40,012
Total current liabilities 2,701,110 2,740,275
Non-current Liabilities:
Long-term debt, less current portion 4,229,218 3,809,057
Other financial liabilities 105,279 72,095
Retirement benefit liabilities 39,956 57,203
Provisions 228,173 212,396
Deferred tax liabilities 412,971 499,756
Other non-current liabilities 28,653 24,689
Total non-current liabilities 5,044,250 4,675,196
Total liabilities 7,745,360 7,415,471
Equity:
Common stock 341,776 341,482
Capital surplus 402,652 387,335
Retained earnings 3,362,297 3,078,655
Other components of equity (223,910) 463,270
Treasury stock (65,138) (7,576)
Total equity attributable to owners of the parent 3,817,677 4,263,166
Non-controlling interests 243,255 267,142
Total equity 4,060,932 4,530,308
Total ¥ 11,806,292 ¥ 11,945,779
- 21 -

(2) Consolidated Statements of Income and Comprehensive Income
Consolidated Statements of Income (Millions of Yen)
Year ended March 31, 2020
Year ended March 31, 2019
Revenue: ¥ 6,885,033 ¥ 6,957,524
Cost: (6,045,610) (6,119,057)
Gross Profit 839,423 838,467
Other Income (Expenses):
Selling, general and administrative expenses (584,885) (566,291)
Gain (loss) on securities and other investments-net 25,060 4,409
Impairment reversal (loss) of fixed assets-net (110,809) (27,033)
Gain (loss) on disposal or sales of fixed assets-net 9,510 17,940
Reversal of provision related to Multigrain business - 11,083
Other income (expense)-net 38,528 (18,786)
Total other income (expenses) (622,596) (578,678)
Finance Income (Costs):
Interest income 41,373 43,376
Dividend income 96,526 105,922
Interest expense (89,638) (80,116)
Total finance income (costs) 48,261 69,182
Share of Profit (Loss) of Investments Accounted for Using the Equity Method 269,232 255,367
Profit before Income Taxes 534,320 584,338
Income Taxes (123,008) (152,575)
Profit for the Year ¥ 411,312 ¥ 431,763
Profit for the Year Attributable to:
Owners of the parent ¥ 391,513 ¥ 414,215
Non-controlling interests 19,799 17,548
- 22 -

Consolidated Statements of Comprehensive Income (Millions of Yen)
Year ended March 31, 2020
Year ended March 31, 2019
Profit for the Year ¥ 411,312 ¥ 431,763
Other Comprehensive Income:
Items that will not be reclassified to profit or loss:
Financial assets measured at FVTOCI (376,024) 95,161
Remeasurements of defined benefit pension plans (7,007) (11,075)
Share of other comprehensive income of investments accounted for using the equity method
(11,239) (5,859)
Income tax relating to items not reclassified 79,856 (30,397)
Items that may be reclassified subsequently to profit or loss:
Foreign currency translation adjustments (152,404) (43,489)
Cash flow hedges (10,070) (6,192)
Share of other comprehensive income of investments accounted for using the equity method
(205,343) 10,540
Income tax relating to items that may be reclassified 9,063 4,222
Total other comprehensive income (673,168) 12,911
Comprehensive Income for the Year ¥ (261,856) ¥ 444,674
Comprehensive Income for the Year Attributable to:
Owners of the parent ¥ (259,448) ¥ 429,917
Non-controlling interests (2,408) 14,757
- 23 -

(3) Consolidated Statements of Changes in Equity (Millions of Yen)
Attributable to owners of the parent Non-
controlling Interests
Total Equity Common Stock
Capital Surplus
Retained Earnings
Other Components
of Equity Treasury
Stock Total
Balance as at April 1, 2018 ¥ 341,482 ¥ 386,165 ¥ 2,903,432 ¥ 448,035 ¥ (104,399) ¥ 3,974,715 ¥ 243,408 ¥ 4,218,123
Cumulative effect of changes in accounting policies (3,535) (3,535) (3,535)
Balance as at April 1, 2018 after changes in accounting policies 341,482 386,165 2,899,897 448,035 (104,399) 3,971,180 243,408 4,214,588
Profit for the year 414,215 414,215 17,548 431,763
Other comprehensive income for the year 15,702 15,702 (2,791) 12,911
Comprehensive income for the year 414,215 15,702 429,917 14,757 444,674
Transaction with owners:
Dividends paid to the owners of the parent (139,038) (139,038) (139,038)
Dividends paid to non-controlling interest shareholders (18,504) (18,504)
Acquisition of treasury stock (17) (17) (17)
Sales of treasury stock (151) (207) 373 15 15
Cancellation of treasury stock (96,467) 96,467 - -
Compensation costs related to stock options 231 231 231 Equity transactions with non-controlling interest shareholders 1,090 (212) 878 27,481 28,359
Transfer to retained earnings 255 (255) - -
Balance as at March 31, 2019 ¥ 341,482 ¥ 387,335 ¥ 3,078,655 ¥ 463,270 ¥ (7,576) ¥ 4,263,166 ¥ 267,142 ¥ 4,530,308
Cumulative effect of changes in accounting policies (5,306) (5,306) (5,306)
Balance as at April 1, 2019 after changes in accounting policies 341,482 387,335 3,073,349 463,270 (7,576) 4,257,860 267,142 4,525,002
Profit for the year 391,513 391,513 19,799 411,312
Other comprehensive income for the year (650,961) (650,961) (22,207) (673,168)
Comprehensive income for the year 391,513 (650,961) (259,448) (2,408) (261,856)
Transaction with owners:
Dividends paid to the owners of the parent (139,071) (139,071) (139,071)
Dividends paid to non-controlling interest shareholders (14,130) (14,130)
Acquisition of treasury stock (58,092) (58,092) (58,092)
Sales of treasury stock (167) (363) 530 0 0
Compensation costs related to stock options 23 23 23 Compensation costs related to share performance-linked restricted stock 294 294 588 588
Equity transactions with non-controlling interest shareholders 15,167 650 15,817 (7,349) 8,468
Transfer to retained earnings 36,869 (36,869) - -
Balance as at March 31, 2020 ¥ 341,776 ¥ 402,652 ¥ 3,362,297 ¥ (223,910) ¥ (65,138) ¥ 3,817,677 ¥ 243,255 ¥ 4,060,932
- 24 -
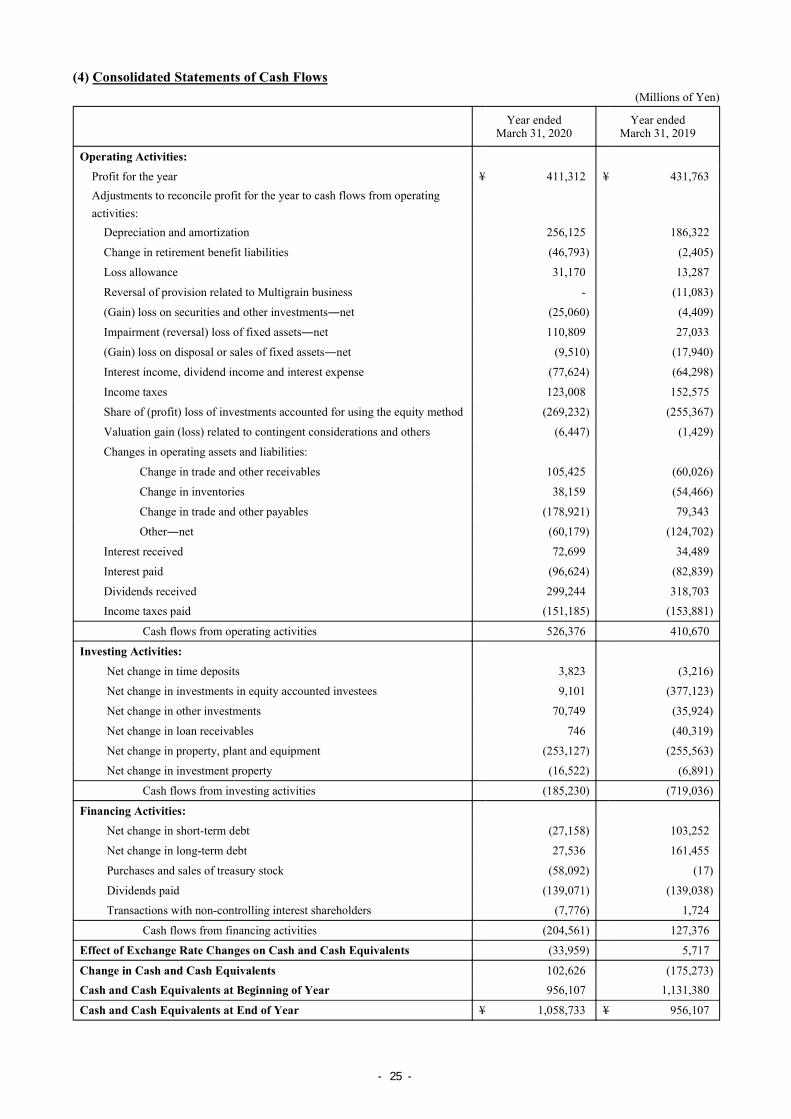
(4) Consolidated Statements of Cash Flows (Millions of Yen)
Year ended March 31, 2020
Year ended March 31, 2019
Operating Activities:
Profit for the year ¥ 411,312 ¥ 431,763 Adjustments to reconcile profit for the year to cash flows from operating activities:
Depreciation and amortization 256,125 186,322
Change in retirement benefit liabilities (46,793) (2,405)
Loss allowance 31,170 13,287
Reversal of provision related to Multigrain business - (11,083)
(Gain) loss on securities and other investments―net (25,060) (4,409)
Impairment (reversal) loss of fixed assets―net 110,809 27,033
(Gain) loss on disposal or sales of fixed assets―net (9,510) (17,940)
Interest income, dividend income and interest expense (77,624) (64,298)
Income taxes 123,008 152,575
Share of (profit) loss of investments accounted for using the equity method (269,232) (255,367)
Valuation gain (loss) related to contingent considerations and others (6,447) (1,429)
Changes in operating assets and liabilities:
Change in trade and other receivables 105,425 (60,026)
Change in inventories 38,159 (54,466)
Change in trade and other payables (178,921) 79,343
Other―net (60,179) (124,702)
Interest received 72,699 34,489
Interest paid (96,624) (82,839)
Dividends received 299,244 318,703
Income taxes paid (151,185) (153,881)
Cash flows from operating activities 526,376 410,670
Investing Activities:
Net change in time deposits 3,823 (3,216)
Net change in investments in equity accounted investees 9,101 (377,123)
Net change in other investments 70,749 (35,924)
Net change in loan receivables 746 (40,319)
Net change in property, plant and equipment (253,127) (255,563)
Net change in investment property (16,522) (6,891)
Cash flows from investing activities (185,230) (719,036)
Financing Activities:
Net change in short-term debt (27,158) 103,252
Net change in long-term debt 27,536 161,455
Purchases and sales of treasury stock (58,092) (17)
Dividends paid (139,071) (139,038)
Transactions with non-controlling interest shareholders (7,776) 1,724
Cash flows from financing activities (204,561) 127,376
Effect of Exchange Rate Changes on Cash and Cash Equivalents (33,959) 5,717
Change in Cash and Cash Equivalents 102,626 (175,273) Cash and Cash Equivalents at Beginning of Year 956,107 1,131,380
Cash and Cash Equivalents at End of Year ¥ 1,058,733 ¥ 956,107
- 25 -

“Interest income, dividend income and interest expense”, “Interest received”, “Interest paid” and “Dividends received” of Consolidated Statements of Cash Flows include not only interest income, dividend income and interest expense that are included in “Finance Income (Costs)” of Consolidated Statements of Income, but also interest income, dividend income, interest expense that are included in Revenue and Cost respectively and cash flows related with them.
(5) Assumption for Going Concern: None
(6) Basis of Consolidated Financial Statements
Scope of subsidiaries and equity accounted investees
① Subsidiaries
1) Overseas 209
2) Japan 74
② Equity accounted investees (associated companies and joint ventures)
1) Overseas 178
2) Japan 45
A total of 482 subsidiaries and equity accounted investees are excluded from the above. These include companies which are sub-consolidated or accounted for under the equity method by subsidiaries other than trading subsidiaries.
- 26 -

(7) Changes in Accounting Policies and Changes in Accounting Estimates
1) Changes in Accounting Policies
Significant accounting policies applied in the Consolidated Financial Statements for the year ended March 31, 2020 are the same as those applied in the Consolidated Financial Statements of the previous fiscal year except for the following. The companies applied the following new standards to the Consolidated Financial Statements from April 1, 2019.
IFRS Title Summaries
IFRS 16 Leases Fundamental amendment of accounting for lease transactions
In adopting IFRS 16, the companies recognized lease liabilities in relation to leases as a lessee, which had previously been classified as operating leases under the principles of IAS 17 “Leases”. These liabilities are measured at the present value discounted using the group’s incremental borrowing rate as of April 1, 2019, and are presented as “long-term debt” (including current portion). The associated rights-of-use assets are measured either at the carrying amount as if the Standard had been applied since the commencement date or at the amount equal to the lease liability, and are presented as “Property, plant and equipment”. In transitioning to IFRS 16, the practical expedient was chosen, the companies have adopted this standard to contracts that were previously identified as leases under the principles of IAS 17 and IFRIC 4 “Determining whether an Arrangement Contains a Lease” (hereinafter referred to as “IFRIC 4”) without reassessing whether a contract is, or contains, a lease at the date of initial application. The companies have not adopted this standard to contracts that were not previously identified as containing a lease under the principles of IAS 17 and IFRIC 4. After the date of initial application, if a contract is, or contains, a lease, leases are recognized as a lease liability and a corresponding right-of-use asset at the date at which the asset is available for use by the companies. Each lease payment is allocated between the liability and finance cost. The finance cost is charged to interest expense over the lease term at a constant rate of interest on the remaining balance of the liability for each period. The right-of-use asset is depreciated over the shorter of the asset’s useful life and the lease term on a straight-line basis. Lease term includes periods of an option to extend the lease if the lessee is reasonably certain to exercise that option and an option to terminate the lease if the lessee is reasonably certain not to exercise that option. Note that short-term leases and leases for which the underlying asset is of low value apply exemption rules of the standards, and recognize the lease payments associated with those leases as an expense mainly on straight-line basis over the lease term. The cumulative effects due to the application of this standard were recognized on the commencement date of adoption in accordance with the transitional arrangements, the retrospective restatement of prior periods have not been applied. “Long-term debt” (including current portion) and “Property, plant and equipment” newly recognized at the date of initial application in the Condensed Consolidated Statement of financial position were ¥272,321 million and ¥257,624 million, respectively. In applying IFRS 16 for the first time, the companies have used the following practical expedients permitted by the standard:
・ the use of a single discount rate to a portfolio of leases with reasonably similar characteristics ・ the reliance on assessment of whether leases are onerous applying IAS 37 “Provisions, Contingent Liabilities and Contingent Assets” immediately before the date of initial application as an alternative to performing an impairment review ・ the accounting for operating leases with a remaining lease term of less than 12 months as at April 1, 2019 as short-term leases, and ・ the use of hindsight in determining the lease term where the contract contains options to extend or terminate the lease.
- 27 -

2) Changes in Accounting Estimates
The significant changes in accounting estimates in the Consolidated Financial Statements for the year ended
March 31, 2020 are as follows.
(Recoverability of Deferred Tax Assets in the joint venture) The Company, together with its business partners, has made a final investment decision on the Mozambique LNG project through Mitsui E&P Mozambique Area 1 Limited, its joint venture in the Energy Segment which owns an interest in the LNG project. Due to this final investment decision, the joint venture recognized deferred tax assets mainly for the exploration expenses occurred in prior years, and gain of ¥13,158 million have been recognized in “Share of Profit (Loss) of Investments Accounted for Using the Equity Method”. (Impairment losses for the Moatize mine business and Nacala Corridor rail & port infrastructure business in Mozambique) Mitsui & Co. Mozambique Coal Finance Limited and Mitsui & Co. Nacala Infrastructure Investment B.V., which lend to Mozambique coal business or invest in Mozambique rail & port infrastructure business, recognized losses of ¥22,083 million as a loss allowance for doubtful debt and an impairment loss for investments accounted for using the equity method, as a result of the revisions to our various assumptions of long-term production plan due to a decrease in the amount of proven reserves regarding the Moatize mine business. In the Consolidated Statements of Income, a loss allowance is recorded by ¥12,224 million (Mineral & Metal Resources ¥9,779 million, Machinery & Infrastructure ¥2,445 million) in “Selling, general and administrative expenses”, an impairment loss for investments accounted for using the equity method is recorded by ¥6,322 million (Mineral & Metal Resources ¥5,058 million, Machinery & Infrastructure ¥1,264 million) and ¥3,537 million (Mineral & Metal Resources ¥2,830 million, Machinery & Infrastructure ¥707 million) in “Share of Profit (Loss) of Investments Accounted for Using the Equity Method” and “Gain (loss) on securities and other investments-net”, respectively. (Impairment losses for the oil & gas development business) Mitsui E&P Australia Pty Ltd, a subsidiary in the Energy Segment engaged in the oil development of offshore Western Australia, recognized an impairment loss of ¥31,209 million in “Impairment loss of fixed assets” by reducing the carrying amount of the production equipment and others to the recoverable amount of ¥46,575 million. MEP Texas Holdings LLC, a subsidiary in the Energy Segment engaged in the shale oil and gas development in Texas, recognized an impairment loss of ¥23,382 million in “Impairment loss of fixed assets” by reducing the carrying amount of the production equipment and others to the recoverable amount of ¥20,972 million. Mitsui E&P Italia A S.r.l., a subsidiary in the Energy Segment engaged in the onshore oil development in the Basilicata region in Italy, recognized an impairment loss of goodwill of ¥13,939 million in “Impairment loss of fixed assets” by reducing the carrying amount of the goodwill and production equipment and others to the recoverable amount of ¥184,793 million. These impairment losses were mainly related to a decline in the crude oil and natural gas prices. The recoverable amounts above represented the value in use. The discount rate used to calculate the value in use is deemed to reflect the market average profit margin and the risks inherent to the cash-generating unit. (Impairment loss for the agricultural producing business) XING AGRI AG, a subsidiary in the Lifestyle Segment, recognized an impairment loss of ¥14,021 million in “Impairment loss of fixed assets” by reducing the carrying amount of the farmland and others to the recoverable amount of ¥49,974million. The impairment loss was mainly related to a change in the foreign exchange rate. The recoverable amount above represented the fair value less costs of disposal, which is based on a valuation conducted by independent valuation appraisers who have recent experience in the locations and categories of the assets being valued, and the fair value is classified as level 3.
- 28 -

(8) Notes to Consolidated Financial Statements
① Segment Information
Year ended March 31, 2020 (from April 1, 2019 to March 31, 2020) (Millions of Yen)
Iron & Steel Products
Mineral & Metal
Resources Energy Machinery &
Infrastructure Chemicals Lifestyle Innovation &
Corporate Development
Total Others/
Adjustments and
Eliminations
Consolidated Total
Revenue 250,090 1,075,179 893,697 911,766 1,544,220 2,018,062 185,385 6,878,399 6,634 6,885,033
Gross Profit 24,554 225,966 141,537 134,182 116,757 134,924 60,099 838,019 1,404 839,423
Share of Profit (Loss) of Investments
Accounted for Using the Equity Method 13,121 59,152 45,899 87,684 11,540 34,996 16,984 269,376 (144) 269,232
Profit for the Year Attributable to Owners of
the Parent 4,749 183,273 59,735 87,457 22,332 32,034 14,568 404,148 (12,635) 391,513
Core Operating Cash Flow 2,588 244,789 221,018 95,158 38,254 37,256 8,644 647,707 (25,815) 621,892
Total Assets at March 31, 2020 539,599 1,921,883 2,549,163 2,377,070 1,217,737 1,907,621 1,198,286 11,711,359 94,933 11,806,292
Year ended March 31, 2019 (from April 1, 2018 to March 31, 2019) (As restated) (Millions of Yen)
Iron & Steel Products
Mineral & Metal
Resources Energy Machinery &
Infrastructure Chemicals Lifestyle Innovation &
Corporate Development
Total Others/
Adjustments and
Eliminations
Consolidated Total
Revenue 247,383 1,055,801 707,978 904,641 1,788,176 2,038,952 209,540 6,952,471 5,053 6,957,524
Gross Profit 27,237 175,602 134,030 130,743 147,956 141,768 78,649 835,985 2,482 838,467
Share of Profit (Loss) of Investments
Accounted for Using the Equity Method 16,200 59,331 40,329 87,476 14,328 26,384 13,123 257,171 (1,804) 255,367
Profit for the Year Attributable to Owners of
the Parent 9,851 167,209 95,723 78,428 5,157 36,309 21,991 414,668 (453) 414,215
Core Operating Cash Flow 5,879 181,451 219,064 73,970 31,020 24,673 19,836 555,893 14,628 570,521
Total Assets at March 31, 2019 606,557 2,222,894 2,425,363 2,450,551 1,337,737 2,006,139 971,833 12,021,074 (75,295) 11,945,779
Notes:1. “Others / Adjustments and Eliminations” includes the Corporate Staff Unit which provides financing services and operations services to the companies and affiliated companies. Total assets
of “Others / Adjustments and Eliminations” at March 31, 2019 and March 31, 2020 includes cash, cash equivalents and time deposits related to financing activities, and assets of the Corporate
Staff Unit and certain subsidiaries related to the above services amounting to ¥7,044,713 million and ¥7,142,647 million, respectively. 2. Transfers between reportable segments are made at cost plus a markup. 3. Profit for the Year Attributable to Owners of the parent of “Others /Adjustments and Eliminations” includes income and expense items that are not allocated to specific reportable segments, and
eliminations of intersegment transactions. 4. Total assets of “Others / Adjustments and Eliminations” at March 31, 2019 and March 31, 2020 includes elimination of receivables and payables between segments amounting to ¥7,120,008 million and ¥7,047,714 million, respectively. 5. Core Operating Cash Flow is calculated by eliminating the sum of the “Changes in Operating Assets and Liabilities” from “Cash Flows from Operating Activities” as presented in the
Consolidated Statements of Cash Flows. 6. Due to the organizational restructing with the aim of further strengthening of business, materials business and real estate business which were formerly included in "Lifestyle" segment are
included in "Chemicals" segment and "Innovation & Corporate Development" segment respecrively, from the three-month period ended June 30 ,2019. In accordance with these changes, the
segment information for the year ended March 31, 2019 has been restated to conform to the current year presentation . 7. The description order of reporting segments has been changed in the segment information for the year ended March 31, 2020, and this change also applies for the year ended March 31, 2019.
- 29 -

② Earnings per share
The following is a reconciliation of basic earnings per share attributable to owners of the parent to diluted earnings per share attributable to owners of the parent for the years ended March 31, 2020 and 2019:
Year ended March 31, 2020(from April 1, 2019 to March 31, 2020)
Profit (numerator)
Shares (denominator) Per share amount
Millions of Yen In Thousands Yen
Basic Earnings per Share Attributable to Owners of the Parent:
Profit for the Year Attributable to Owners of the Parent 391,513 1,731,384 226.13
Effect of Dilutive Securities:
Adjustments of effect of:
Dilutive securities of associated companies (22) -
Stock options - 1,046
Diluted Earnings per Share Attributable to Owners of the Parent:
Profit for the Year Attributable to Owners of the Parent after effect of dilutive securities
391,491 1,732,430 225.98
Year ended March 31, 2019(from April 1, 2018 to March 31, 2019)
Profit (numerator)
Shares (denominator) Per share amount
Millions of Yen In Thousands Yen
Basic Earnings per Share Attributable to Owners of the Parent:
Profit for the Year Attributable to Owners of the Parent 414,215 1,737,982 238.33
Effect of Dilutive Securities:
Adjustments of effect of:
Dilutive securities of associated companies (37) -
Stock options - 1,202
Diluted Earnings per Share Attributable to Owners of the Parent:
Profit for the Year Attributable to Owners of the Parent after effect of dilutive securities
414,178 1,739,184 238.15
③ Subsequent Events
There are no material subsequent events to be disclosed.
- 30 -

④ The Fire Incident of Intercontinental Terminals Company LLC In the year ended March 31, 2019, a fire began at the Deer Park tank terminal of Intercontinental Terminals Company LLC (“ITC”), a wholly owned U.S. subsidiary of Mitsui & Co., Ltd. The Deer Park tank terminal is located in the outskirts of Houston, Texas. The fire partially damaged tanks owned by ITC. In the year ended March 31, 2020, ITC has resumed operation after discussions with relevant authorities. Harris County Fire Marshal’s Office released its final report with respect to the fire incident on December 6, 2019 (US time) and the report classified the fire as accidental, while not specifying the cause of the fire. The cause of the fire is still under investigation by other relevant authorities. Relating to this incident, ITC has recognized a loss of ¥20,600 million in the year ended March 31, 2019. The costs included those for firefighting and clean-up activities that occurred during the previous fiscal year and reasonably estimated amount based on a certain assumption, deducting the insurance amount that is virtually certain to be paid to ITC. The outstanding balance of provision is ¥14,924 million as of March 31, 2019. Most of the related costs have been paid out in the year ended March 31, 2020, and the outstanding balance of provision as of March 31, 2020 is immaterial. Further, although ITC recognized additional costs related to this incident in the year ended March 31, 2020, together with insurance benefits that were also recognized, the net amount is immaterial. The provision related to this incident is presented in the “Provisions” of the Consolidated Statements of Financial Position, the income and losses are presented in “Other income (expense)” of Consolidated Statements of Income and in “Profit for the Year Attributable to Owners of the Parent” in the Chemicals Segment of the Segment Information section under the Notes to Consolidated Financial Statements. There are multiple lawsuits that have been brought against ITC in relation to this incident. These lawsuits are at the early stages and the ultimate outcome of these lawsuits is not expected to have significant impact on our consolidated financial position, operating results and cash flow.
⑤ Taxation on capital gain in India
Earlyguard Limited (“EG”), a UK subsidiary of Mitsui & Co., Ltd. received a tax payment notice dated January 21, 2020 which requested payment of 24 billion Indian Rupees (¥37 billion) from Indian tax authority.
The taxable income of this notice is the capital gain on sales of Finsider International Company Limited (a UK company that owned 51% of Sesa Goa, an Indian iron ore company) shares held by EG in April 2007. Although EG treated the capital gain properly according to the tax laws at that time, the tax payment notice has been issued.
The company does not expect to have significant impact on our consolidated financial position, operating results and cash flow at this stage.
- 31 -