consolidated annual financial statements 2016 · 2019-06-20 · consolidated annual financial...
TRANSCRIPT

FLEET MANAGEMENT STOLEN VEHICLE RECOVERY INSURANCE TELEMATICS
CONSOLIDATED ANNUAL FINANCIAL STATEMENTS 2016
FOR THE YEAR ENDING 29 FEBRUARY

CONTENTS
12. CARTRACK LIMITED BRANDING GUIDELINES
PHOTOGRAPHY
BRAND IMAGES
Brand images need to clearly illustrate the look and feel of the brand.
The images displayed are to be used only when representing the brand
Cartrack.
High-resolution images are available for branding and marketing
purposes.
To gain access to the these images, please contact
03 Director’s responsibility and approval
04 Audit committee report
05 Independent auditor’s report
07 Directors’ report
10 Consolidated statement of financial position
The reports and statements set out below comprise the consolidated annual financial statements presented to the shareholders:

CartraCk Consolidated annual financial statements 2016 2016 1
With more than 502 000 subscribers worldwide and a presence in 21 countries, Cartrack is well positioned to actively pursue opportunities for further growth
11 Consolidated statement of profit or loss and other comprehensive income
12 Consolidated statement of change in equity
14 Consolidated statement of cash flows
15 Accounting policies
24 Notes to the consolidated annual financial statements
LEVEL OF ASSURANCE
These consolidated financial statements have been audited in compliance with the applicable requirements of the Companies Act, 71 of 2008.
PREPARER
F. Hassim CA (SA)
Group Reporting Accountant
Published
30 May 2016
Certificate by Group Company Secretary in accordance with section 88(2)(e) of the Companies Act, 2008.I, Annamé de Villiers, in my capacity as Group Company Secretary confirm to the best of my knowledge and belief that, for the year ended 29 February 2016, Cartrack Holdings Limited has filed the returns and notices required in terms of the provisions of the Act and that all such returns and notices appear to be true, correct and up to date.
A de VilliersGroup Company Secretary

2 CartraCk Consolidated annual financial statements 2016
Country of incorporation and domicile South Africa
Nature of business and principal activities Cartrack Holdings Limited is an investment holding company operating principally within the telematics industry
Directors IJ Calisto (Executive)
JR Edmeston (Executive)
DJ Brown (Non-executive)
AT Ikalafeng (Non-executive)
K White (Non-executive)
Registered office Cartrack Corner
Corner Jan Smuts and 7th Avenue
Rosebank, Johannesburg
South Africa 2196
Business address Cartrack Corner
Corner Jan Smuts and 7th Avenue
Rosebank, Johannesburg
South Africa 2196
Postal address P.O. Box 4709
Rivonia 2128
Holding company Onecell Holdings (Pty) Limited incorporated in South Africa
Bankers First National Bank – a division of FirstRand Bank Limited, Standard Bank Limited, Nedbank Limited, Mercantile Bank Limited
Auditors Grant Thornton
Chartered Accountants (S.A.) Registered Auditors
A South African member firm of Grant Thornton International
Secretary A. De Villiers
Company registration number 2005/036316/06
GENERAL INFORMATION

CartraCk Consolidated annual financial statements 2016 2016 3
The directors are required in terms of the Companies Act, 71 of 2008 to maintain adequate accounting records and are responsible for the content and integrity of the consolidated annual financial statements and related financial information included in this report. It is their responsibility to ensure that the consolidated annual financial statements fairly present the state of affairs of the Group as at the end of the financial year and the results of its operations and cash flows for the year then ended, in conformity with International Financial Reporting Standards. The external auditors are engaged to express an independent opinion on the consolidated annual financial statements.
The consolidated annual financial statements are prepared in accordance with International Financial Reporting Standards and are based upon appropriate accounting policies consistently applied and supported by reasonable and prudent judgements and estimates.
The directors acknowledge that they are ultimately responsible for the system of internal financial control established by the Group and place considerable importance on maintaining a strong control environment. To enable the directors to meet these responsibilities, the Board sets standards for internal control aimed at reducing the risk of error or loss in a cost effective manner. The standards include the proper delegation of responsibilities within a clearly defined framework, effective accounting procedures and adequate segregation of duties to ensure an acceptable level of risk. These controls are monitored throughout the Group and all employees are required to maintain the highest ethical standards in ensuring the Group’s business is conducted in a manner that in all reasonable circumstances is above reproach. The focus of risk management in the Group is on identifying, assessing, managing and monitoring all known forms of risk across the Group. While operating risk cannot be fully eliminated, the Group endeavours to minimise it by ensuring that appropriate infrastructure, controls, systems and ethical behaviour are applied and managed within predetermined procedures and constraints.
The directors are of the opinion, based on the information and explanations given by management, that the system of internal control provides reasonable assurance that the financial records may be relied on for the preparation of the consolidated annual financial statements. However, any system of internal financial control can provide only reasonable, and not absolute assurance against material misstatement or loss.
The directors have reviewed the Group’s cash flow forecast for the year to 30 May 2017 and, in light of this review and the current financial position, they are satisfied that the Group has or had access to adequate resources to continue in operational existence for the foreseeable future.
The external auditors are responsible for independently auditing and reporting on the Group’s consolidated annual financial statements. The consolidated annual financial statements have been examined by the Group’s external auditors and their report is presented on page 5.
The consolidated annual financial statements set out on pages 10 to 53, which have been prepared on the going concern basis, were approved by the Board on 30 May 2016 and were signed on their behalf by:
I.J. Calisto J.R. EdmestonExecutive Executive
Rosebank
30 May 2016
DIRECTORS’ RESPONSIBILITIES AND APPROVAL
4 CartraCk Consolidated annual financial statements 2016
The Audit and Risk Committee meets at least four times during a financial year. The Chief Executive Officer and Chief Financial Officer are invited to attend meetings, but do not have a vote. The committee meets at least once a year with the external auditors without the presence of management, excluding any ad hoc meetings held to consider special business. The committee’s oversight role requires it to regularly address the relationships between management and the Internal and External Auditors and understand and monitor the reporting relationships and tiers of accountability between them.
The Company’s external auditors have unrestricted access to the Audit and Risk Committee and may, with the approval of the chairperson of the Audit and Risk Committee (which approval may not be unreasonably withheld), attend its meetings.
The Audit and Risk Committee annually reviews the appropriateness of the qualifications and experience of Cartrack’s Global Chief Financial Officer, John Edmeston, and reports on whether or not it is satisfied therewith. In addition, the Audit and Risk Committee reviews and reports on the expertise, resources and experience of the Company’s finance function and reviews the effectiveness of internal control systems in the Group with reference to the findings of external auditors.
This committee has considered and satisfied itself as to the appropriateness of the qualifications and experience of the Global Chief Financial Officer, as well as the expertise, resources and experience of the Company’s finance function. The committee is satisfied with the effectiveness of internal controls in the Group.
Following the review of the consolidated and separate annual financial statements of the Cartrack Group for the year ended 29 February 2016, the Audit and Risk Committee is of the view that, in all material respects, it complies with the relevant provisions of the Companies Act and IFRS and fairly presents the financial position at that date and the results of its operations and cash flows for the year.
Having achieved its objectives for the financial year, the committee recommended the consolidated and separate annual financial statements for the year ended 29 February 2016 for approval to the Board.
K. WhiteChairman Audit Committee
Rosebank30 May 2016
AUDIT COMMITTEE REPORT

CartraCk Consolidated annual financial statements 2016 2016 5
To the shareholders of
CARTRACK HOLDINGS LIMITED
We have audited the consolidated financial statements of Cartrack Holdings Limited set out on pages 10 to 53, which comprise the statements of financial position as at 29 February 2016, and the statements of comprehensive income, statements of changes in equity and statements of cash flows for the year then ended, and the notes, comprising a summary of significant accounting policies and other explanatory information.
DIRECTORS’ RESPONSIBILITY FOR THE FINANCIAL STATEMENTS
The company’s directors are responsible for the preparation and fair presentation of these consolidated financial statements in accordance with International Financial Reporting Standards and the requirements of the Companies Act of South Africa and for such internal control as the directors determine is necessary to enable the preparation of consolidated and separate financial statements that are free from material misstatements, whether due to fraud or error.
AUDITOR’S RESPONSIBILITY
Our responsibility is to express an opinion on these consolidated financial statements based on our audit. We conducted our audit in accordance with International Standards on Auditing. Those standards require that we comply with ethical requirements and plan and perform the audit to obtain reasonable assurance about whether the consolidated financial statements are free from material misstatement.
An audit involves performing procedures to obtain audit evidence about the amounts and disclosures in the financial statements. The procedures selected depend on the auditor’s judgement, including the assessment of the risks of material misstatement of the financial statements, whether due to fraud or error. In making those risk assessments, the auditor considers internal control relevant to the entity’s preparation and fair presentation of the financial statements in order to design audit procedures that are appropriate in the circumstances, but not for the purpose of expressing an opinion on the effectiveness of the entity’s internal control. An audit also includes evaluating the appropriateness of accounting policies used and the reasonableness of accounting estimates made by management, as well as evaluating the overall presentation of the financial statements.
We believe that the audit evidence we have obtained is sufficient and appropriate to provide a basis for our audit opinion.
OPINION
In our opinion, the consolidated financial statements present fairly, in all material respects, the consolidated financial position of Cartrack Holdings Limited as at 29 February 2016, and its consolidated financial performance and consolidated cash flows for the year then ended in accordance with International Financial Reporting Standards, and the requirements of the Companies Act of South Africa.
OTHER REPORTS REqUIRED BY THE COMPANIES ACT
As part of our audit of the consolidated financial statements for the year ended 29 February 2016, we have read the Directors’ Report, Audit committee report and Secretary’s Certification for the purpose of identifying whether there are material inconsistencies between these reports and the audited consolidated financial statements. These reports are the responsibility of the directors. Based on reading these reports we have not identified material inconsistencies between these reports and the audited consolidated financial statements. However, we have not audited these reports and accordingly do not express an opinion thereon.
INDEPENDENT AUDITOR’S REPORT

6 CartraCk Consolidated annual financial statements 2016
REPORT ON OTHER LEGAL AND REGULATORY REqUIREMENTS
In terms of the IRBA Rule published in Government Gazette 39475 dated 04 December 2015, we report that Grant Thornton Johannesburg Partnership has been the auditor of Cartrack Holdings Limited for five years.
GRANT THORNTON JOHANNESBURG PARTNERSHIPRegistered Auditors
MZ SadekPartnerRegistered AuditorChartered Accountant (SA)
30 May 2016
@Grant ThorntonWanderers Office Park52 Corlett DriveIllovo, 2196
INDEPENDENT AUDITOR’S REPORT (continued)
CartraCk Consolidated annual financial statements 2016 2016 7
DIRECTORS’ REPORT
The directors have pleasure in submitting their report on the Cartrack Holdings Limited Company and consolidated annual financial statements for the year ended 29 February 2016. The Company annual financial statements have not been included herein as they do not contain any significant additional information. The Company annual financial statements are available on the Company website: www.cartrack.com.
1. NATURE OF BUSINESS
Cartrack Holdings Limited is a holding company incorporated in South Africa and listed under the short code ‘CTK’ in the Business Support Services sector on the Johannesburg Stock Exchange (JSE).The Group’s activities are focused on the design, development and installation of telematics technology; data collection and analysis and the delivery of fleet and mobile asset management solutions delivered as Software as a Service (‘SaaS’) and the tracking and recovery of vehicles. The Group operates in various countries across a number of continents.
There have been no material changes to the nature of the Group’s business from the prior year.
2. REVIEW OF FINANCIAL RESULTS AND ACTIVITIES
The consolidated annual financial statements have been prepared in accordance with International Financial Reporting Standards and the requirements of the Companies Act, 71 of 2008. The accounting policies have been applied consistently compared to the prior year, except for the Correction of Accounting Error as set out in note 2. Certain comparative figures have been reclassified as detailed in note 35.
Full details of the financial position, results of operations and cash flows of the Group are set out in these consolidated annual financial statements.
3. SHARE CAPITAL
There have been no changes to the authorised or issued share capital during the year under review.
4. DIVIDENDS
The Group’s dividend policy is to consider an interim and a final dividend in respect of each financial year. At its discretion, the Board may consider a special dividend, depending on the need to retain funds for expansion or operating purposes.
Dividends paid to shareholders of the Group during the year under review amount to R150 000 000.
Subsequent to the financial year ended 29 February 2016, a dividend has been declared in the amount of 35 cents per share which is payable by 11 July 2016.
5. ACqUISITIONS AND NEW OPERATIONS
During the year the Group acquired 100% of the shares in Cartrack Manufacturing (Pty) Limited and 100% of the shares in Cartrack Management Services (Pty) Limited. Refer to note 25.
6. DIRECTORATE
The Board of directors of the Group (‘the Board’) comprises:
IJ Calisto (Executive) Global Chief Executive Officer
JR Edmeston (Executive) Global Chief Financial Officer
DJ Brown (Non-executive) Independent Chairperson
AT Ikalafeng (Non-executive) Independent
K White (Non-executive) Independent
There have been no changes to the directorate for the year under review.

8 CartraCk Consolidated annual financial statements 2016
7. DIRECTORS’ INTERESTS IN SHARES
The director’s interests in shares are set out below:
Interests in shares
% Number of shares
Shareholders (Indirect shareholding)
IJ Calisto (Executive) 68 203 980 424
J Marais (Director of associated company) 12 36 019 576
80 240 000 000
There have been no changes to the directors interests in shares for the year under review.
The register of interests of directors and others in shares of the Company is available to the shareholders on request.
8. RELATED PARTY TRANSACTIONS
The details of related party transactions are set out in note 26 of the consolidated annual financial statements.
9. HOLDING COMPANY AND SHAREHOLDING
The Group’s holding company is Onecell Holdings (Pty) Limited which holds 80% (2015: 80% ; 2014: 100%) of the Group’s equity. Onecell Holdings (Pty) Limited is incorporated in South Africa.
Shareholding
The following table lists the shareholders of the Group:
No of shareholders % of shareholders Number of shares % of issued capital
Public shareholders (below5%) 329 99.7 60 000 000 20
Non-public shareholders
Onecell Holdings (Pty) Ltd 1 0.03 240 000 000 80
330 100 300 000 000 100
Share range 1 – 1000 121 36.67 26 915 0.01
1001 – 10 000 93 28.18 332 012 0.11
10 001 – 50 000 56 16.97 1 390 791 0.46
50 001 – 100 000 12 3.64 843 097 0.28
1000 001 – 500 000 20 6.06 4 093 060 1.36
500 001 – 1000 000 11 3.33 7 875 531 2.63
1 000 001 and over 17 5.15 285 438 594 95.15
10. EVENTS AFTER THE REPORTING PERIOD
The directors are not aware of any material events which occurred after the reporting date and up to the date of this report.
11. LITIGATION STATEMENT
As at the date of this report, the directors are not aware of any existing, pending or threatened litigation proceedings which may have a material effect on the financial position of the Group or any subsidiary.
DIRECTORS’ REPORT (continued)
CartraCk Consolidated annual financial statements 2016 2016 9
12. GOING CONCERN
The directors believe that the Group has adequate financial resources to continue in operation for the foreseeable future and accordingly the consolidated annual financial statements have been prepared on a going concern basis. The directors have satisfied themselves that the Group is in a sound financial position and that it has access to sufficient borrowing facilities to meet its foreseeable cash requirements. The directors are not aware of any material changes that may adversely impact the Group. The directors are also not aware of any material non-compliance with statutory or regulatory requirements or of any pending changes to legislation which may affect the Group.
13. AUDITORS
Grant Thornton continued in office as auditors for the Company and its subsidiaries for 2016.
At the AGM, the shareholders will be requested to reappoint Grant Thornton as the independent external auditors of the Company for the 2017 financial year.
14. SECRETARY
The Company Secretary is Miss A. De Villiers.
Business address Cartrack Corner
Corner Jan Smuts and 7th Avenue
Rosebank, Johannesburg
South Africa 2196
15. DATE OF AUTHORISATION FOR ISSUE OF FINANCIAL STATEMENTS
The consolidated annual financial statements have been authorised for issue by the directors on the 30 May 2016. No authority was given to anyone to amend the consolidated annual financial statements after the date of issue.

10 CartraCk Consolidated annual financial statements 2016
Figures in Rand thousand Note(s) 2016 Restated 2015 Restated 2014
ASSETS
Non-current assets
Property, plant and equipment 4 207 534 150 530 104 489
Goodwill 5 156 011 144 269 99 433
Deferred tax 6 34 517 20 410 13 036
398 062 315 209 216 958
Current assets
Inventories 7 88 318 62 532 32 740
Loans to related parties 9 1 624 5 263 35 040
Trade and other receivables 10 128 655 81 705 55 904
Current tax receivable 5 500 449 352
Cash and cash equivalents 11 45 181 110 047 41 657
269 278 259 996 165 693
Total assets 667 340 575 205 382 651
EqUITY AND LIABILITIES
Equity
Share capital 12 42 488 42 488 42 488
Reserves 26 314 32 251 21 051
Retained income 375 306 285 632 145 956
Equity Attributable to Equity Holders of Parent 444 108 360 371 209 495
Non-controlling interest 16 387 13 391 25 666
460 495 373 762 235 161
Liabilities
Non-current liabilities
Finance lease obligation 13 7 789 5 618 4 169
Deferred tax 6 1 040 236 1
8 829 5 854 4 170
Current liabilities
Trade and other payables 14 159 085 149 282 110 234
Loans from related parties 9 1 478 1 235 738
Finance lease obligation 13 6 604 6 218 3 527
Current tax payable 26 652 38 740 28 821
Share based payment liability 15 4 010 – –
Bank overdraft 11 187 114 –
198 016 195 589 143 320
Total liabilities 206 845 201 443 147 490
Total equity and liabilities 667 340 575 205 382 651
CONSOLIDATED STATEMENT OF FINANCIAL POSITIONas at 29 February 2016

CartraCk Consolidated annual financial statements 2016 2016 11
Figures in Rand thousand Note(s) 2016 Restated 2015 Restated 2014
Revenue 16 1 005 481 834 795 632 757
Cost of sales (186 749) (185 536) (130 004)
Gross profit 818 732 649 259 502 753
Other income 12 091 6 852 11 946
Operating expenses (486 017) (366 106) (260 837)
Operating profit 17 344 806 290 005 253 862
Investment revenue 18 6 256 4 533 1 742
Net non-operating foreign exchange gain 19 15 667 – –
Finance costs 20 (4 463) (924) (1 211)
Profit before taxation 362 266 293 614 254 393
Taxation 21 (102 779) (85 646) (72 708)
Profit for the year 259 487 207 968 181 685
OTHER COMPREHENSIVE INCOME:
Items that may be reclassified to profit or loss:
Exchange differences on translating foreign operations 3 399 (7 372) 18 276
Other comprehensive income for the year net of taxation 22 3 399 (7 372) 18 276
Total comprehensive income for the year 262 886 200 596 199 961
Total comprehensive income attributable to:
Owners of the parent 245 842 181 884 180 252
Non-controlling interest 17 044 18 712 19 709
262 886 200 596 199 961
EARNINGS PER SHARE
Basic earnings per share (cents) 29 80 64 59
CONSOLIDATED STATEMENT OF PROFIT OR LOSS AND OTHER COMPREHENSIVE INCOMEfor the year ended 29 February 2016

12 CartraCk Consolidated annual financial statements 2016
Figures in Rand thousandShare
capitalShare
premiumTotal share
capital
Foreigncurrency
translationreserve
Treasuryshares
Totalreserves
Retainedincome
Totalattributable toequity holdersof the Group/
CompanyNon-controlling
interestTotal
equity
Opening balance as previously reported * 42 488 42 488 21 005 – 21 005 157 307 220 800 33 713 254 513
Adjustments
Prior period error (Refer note 2) – – – 46 – 46 (11 351) (11 305) (8 047) (19 352)
Balance at 1 March 2014 as restated – 42 488 42 488 21 051 – 21 051 145 956 209 495 25 666 235 161
Profit for the year – – – – – – 191 811 191 811 16 157 207 968
Other comprehensive income – – – (4 817) – (4 817) – (4 817) (2 555) (7 372)
total comprehensive income for the year – – – (4 817) – (4 817) 191 811 186 994 13 602 200 596
Foreign currency translation movements within equity – – – 16 017 – 16 017 – 16 017 (16 017) –
Acquisition of subsidiary with NCI portion – – – – – – – – 1 838 1 838
Share issue 42 488 (42 488) – – – – – – – –
Buyback and cancellation of shares (510 000) – (510 000) – – – – (510 000) – (510 000)
Issue of new shares 510 000 – 510 000 – – – – 510 000 – 510 000
Dividends – – – – – – (48 000) (48 000) (10 832) (58 832)
Increase in interest of subsidiary – – – – – – (4 135) (4 135) (866) (5 001)
Total contributions by and distributions to owners of Company recognised directly in equity 42 488 (42 488) – 16 017 – 16 017 (52 135) (36 118) (25 877) (61 995)
Balance at 1 March 2015 as restated 42 488 – 42 488 32 251 – 32 251 285 632 360 371 13 391 373 762
Profit for the year – – – – – – 239 674 239 674 19 813 259 487
Other comprehensive income – – – 6 168 – 6 168 – 6 168 (2 769) 3 399
Total comprehensive income for the year – – – 6 168 – 6 168 239 674 245 842 17 044 262 886
Purchase of shares for Share Incentive – – – – (12 105) (12 105) – (12 105) – (12 105)
Scheme (Treasury shares) –
Dividends – – – – – – (150 000) (150 000) (14 048) (164 048)
Total contributions by and distributions to owners of Company recognised directly in equity – – – – (12 105) (12 105) (150 000) (162 105) (14 048) (176 153)
Balance at 29 February 2016 42 488 – 42 488 38 419 (12 105) 26 314 375 306 444 108 16 387 460 495
Note(s) 12 12 12 15
* R142 is not displaying due to rounding.
CONSOLIDATED STATEMENT OF CHANGES IN EqUITyfor the year ended 29 February 2016

CartraCk Consolidated annual financial statements 2016 2016 13
Figures in Rand thousandShare
capitalShare
premiumTotal share
capital
Foreigncurrency
translationreserve
Treasuryshares
Totalreserves
Retainedincome
Totalattributable toequity holdersof the Group/
CompanyNon-controlling
interestTotal
equity
Opening balance as previously reported * 42 488 42 488 21 005 – 21 005 157 307 220 800 33 713 254 513
Adjustments
Prior period error (Refer note 2) – – – 46 – 46 (11 351) (11 305) (8 047) (19 352)
Balance at 1 March 2014 as restated – 42 488 42 488 21 051 – 21 051 145 956 209 495 25 666 235 161
Profit for the year – – – – – – 191 811 191 811 16 157 207 968
Other comprehensive income – – – (4 817) – (4 817) – (4 817) (2 555) (7 372)
total comprehensive income for the year – – – (4 817) – (4 817) 191 811 186 994 13 602 200 596
Foreign currency translation movements within equity – – – 16 017 – 16 017 – 16 017 (16 017) –
Acquisition of subsidiary with NCI portion – – – – – – – – 1 838 1 838
Share issue 42 488 (42 488) – – – – – – – –
Buyback and cancellation of shares (510 000) – (510 000) – – – – (510 000) – (510 000)
Issue of new shares 510 000 – 510 000 – – – – 510 000 – 510 000
Dividends – – – – – – (48 000) (48 000) (10 832) (58 832)
Increase in interest of subsidiary – – – – – – (4 135) (4 135) (866) (5 001)
Total contributions by and distributions to owners of Company recognised directly in equity 42 488 (42 488) – 16 017 – 16 017 (52 135) (36 118) (25 877) (61 995)
Balance at 1 March 2015 as restated 42 488 – 42 488 32 251 – 32 251 285 632 360 371 13 391 373 762
Profit for the year – – – – – – 239 674 239 674 19 813 259 487
Other comprehensive income – – – 6 168 – 6 168 – 6 168 (2 769) 3 399
Total comprehensive income for the year – – – 6 168 – 6 168 239 674 245 842 17 044 262 886
Purchase of shares for Share Incentive – – – – (12 105) (12 105) – (12 105) – (12 105)
Scheme (Treasury shares) –
Dividends – – – – – – (150 000) (150 000) (14 048) (164 048)
Total contributions by and distributions to owners of Company recognised directly in equity – – – – (12 105) (12 105) (150 000) (162 105) (14 048) (176 153)
Balance at 29 February 2016 42 488 – 42 488 38 419 (12 105) 26 314 375 306 444 108 16 387 460 495
Note(s) 12 12 12 15
* R142 is not displaying due to rounding.

14 CartraCk Consolidated annual financial statements 2016
CONSOLIDATED STATEMENT OF CASH FLOWS
for the year ended 29 February 2016
Figures in Rand thousand Note(s) 2016Restated
2015Restated
2014
CASH FLOWS FROM OPERATING ACTIVITIES
Cash generated from operations 23 391 752 343 834 276 326
Interest income 18 6 256 4 533 1 742
Finance costs 20 (3 502) (360) (739)
Tax paid 24 (133 120) (81 491) (62 410)
Net cash from operating activities 261 386 266 516 214 919
CASH FLOWS FROM INVESTING ACTIVITIES
Purchase of property, plant and equipment (158 216) (119 700) (80 470)
Sale of property, plant and equipment 3 923 4 651 3 170
Acquisition of subsidiaries, net of cash acquired 25 (15) (53 428) 2 367
Net cash from investing activities (154 308) (168 477) (74 933)
CASH FLOWS FROM FINANCING ACTIVITIES
Proceeds on share issue* 12 – * –
Increase in loans from related parties 243 497 –
Decrease in loans to related parties 3 639 29 777 95 875
Finance lease (payments)/receipts (1 596) 3 576 212
Purchase of shares for Share Incentive Scheme (Treasury shares) (12 105) – –
Dividends paid (164 048) (58 832) (205 665)
Acquisitions resulting in increase in control of subsidiaries – (5 001) –
Buyback of Company’s own shares – (510 000) –
Proceeds of share issue – 510 000 –
Net cash from financing activities (173 867) (29 983) (109 578)
TOTAL CASH MOVEMENT FOR THE PERIOD (66 789) 68 056 30 408
Cash at the beginning of the period 109 933 41 657 12 826
Effect of exchange rate movement on cash balances 1 850 220 (1 577)
Total cash at end of the period 11 44 994 109 933 41 657* R300 not displaying due to rounding.

CartraCk Consolidated annual financial statements 2016 2016 15
ACCOUNTING POLICIES
1. PRESENTATION OF GROUP AND COMPANY FINANCIAL STATEMENTS REPORTING ENTITY
Reporting entity
Cartrack Holdings Limited is a company domiciled in the Republic of South Africa. These consolidated financial statements for the year ended 29 February 2016 comprise the Company and its subsidiaries (collectively the “Group” and individually “Group companies”). The Group is primarily involved in the design, development and installation of telematics technology, data collection and analysis and the delivery of fleet and mobile asset management solutions delivered as Software-as-a-service (‘SAAS’) and the tracking and recovery of vehicles.
Statement of compliance
The consolidated financial statements are prepared in compliance with JSE Listings Requirements, International Financial Reporting Standards (IFRS) and Interpretations of those standards, as issued by the International Accounting Standards Board (IASB), the financial reporting pronouncements as issued by the FRSC (Financial Reporting Standards Council) that are relevant to its operations and have been effective for the annual reporting period ending 29 February 2016, and the SAICA Financial Reporting Guides as issued by the Accounting Practices Committee and the South African Companies Act, No 71 of 2008, as amended. The annual financial statements were approved for issue by the Board of directors on 30 May 2016 and are subject to approval by the Annual General Meeting of shareholders, on 21 July 2016.
Accounting policies are consistent with the previous period except for the adoption of new standards and interpretations referred to in note 3.
Basis of measurement
The consolidated financial statements have been prepared on the historical cost basis, except for the measurement of certain financial assets and liabilities at fair value.
Functional and presentation currency
These consolidated financial statements are presented in South African Rand (ZAR), which is the Company’s functional currency. All financial information presented has been rounded off to the nearest thousand Rand.
Going concern
The consolidated financial statements are prepared on the going-concern basis as the Directors believe that funds will be available to finance future operations and that the realisation of assets and settlement of liabilities, contingent obligations and commitments will occur in the ordinary course of business.
During the year there has been a correction of an accounting error which is detailed in note 2.
1.1 Consolidation
Basis of consolidation
The consolidated financial statements reflect the financial results of the Group. All financial results are consolidated with similar items on a line-by-line basis.
Inter-company transactions, balances and unrealised gains and losses between entities are eliminated on consolidation. To the extent that a loss on a transaction provides evidence of a reduction in the net realisable value of current assets or an impairment loss of a non-current asset, that loss is charged to the income statement.
Foreign operations
On consolidation, differences arising from the translation of the net investment in a foreign operation are recognised as other comprehensive income and are included in the foreign currency translation reserve. Differences arising from the translation of loans not designated as part of a net investment are recognised as gains/(losses) in the Statement of Comprehensive Income, but do not form part of operating profit; differences arising from the translation of trade receivables and trade payables are recognised as gains/(losses) within operating profit.
On disposal of all or part of the ownership interest in the foreign operation, the proportionate share of the related cumulative gains and losses previously recognised in the foreign currency translation reserve through the statement of comprehensive income are included in determining the profit or loss on disposal of that operation recognised in the income statement as part of the gain or loss on the disposal.

16 CartraCk Consolidated annual financial statements 2016
Accounting Policies (continued)
1.1 Consolidation (continued)
Subsidiaries
Subsidiaries are entities controlled by the Group. The Group controls an entity when it is exposed to, or has rights to, variable returns from its involvement with the entity and has the ability to affect those returns through its power over the entity. The financial results of subsidiaries are consolidated into the Group’s results from acquisition date until loss of control.
Business combinations
The acquisition method is used when a business is acquired. A business may comprise an entity, group of entities or an unincorporated operation including its operating assets and associated liabilities.
On acquisition date, fair values are attributed to the identifiable assets, liabilities and contingent liabilities. A non-controlling interest at acquisition date is measured at fair value or at its proportionate interest in the fair value of the net identifiable assets of the entity acquired on a transaction by transaction basis, including that component of the non-controlling interest which has a present ownership interest.
When there is a change in the interest in a subsidiary after control is obtained that does not result in a loss in control, the difference between the fair value of the consideration transferred and the amount by which the non-controlling interest is adjusted, is recognised directly in the statement of changes in equity.
The consideration transferred is the fair value of the Group’s contribution to the business combination in the form of assets transferred, shares issued, liabilities assumed or contingent consideration at the acquisition date. Any contingent consideration payable is recognised at fair value at the acquisition date. If the contingent consideration is classified as equity, it is not re-measured and settlement is accounted for within equity. Otherwise, subsequent changes to the fair value of the contingent consideration are recognised in the income statement. Transaction costs directly attributable to the acquisition are charged to the income statement.
On acquisition date, goodwill is recognised when the consideration transferred and the recognised amount of non-controlling interests exceeds the fair value of the net identifiable assets of the entity acquired. If the fair value of the net assets acquired is in excess of the aggregate consideration transferred, the Group re-assesses whether it has correctly identified all of the assets acquired and all the liabilities assumed and reviews the procedures used to measure the amounts to be recognised at acquisition date. If the reassessment still results in an excess of fair value of net assets acquired over the aggregate consideration transferred, then the gain is recognised in profit or loss.
Goodwill is tested for impairment at each reporting date.
Foreign currency transactions
Transactions in foreign currencies are translated to the respective functional currency of the Group company at exchange rates at the dates of the transactions.
Non-monetary assets and liabilities denominated in foreign currencies that are measured at fair value are translated to the functional currency at the exchange rate at the date that the fair value was determined. Non-monetary items in a foreign currency that are measured in terms of historical cost are translated using the exchange rate at the date of the transaction. Foreign currency differences are recognised in profit or loss.
Non-controlling interest
Non-controlling interests are measured at their proportionate share of the acquiree’s identifiable net assets at the acquisition date.
1.2 Financial instruments
Classification
The Group classifies financial assets and financial liabilities into the following categories:
• Loans and receivables
• Financial liabilities.

CartraCk Consolidated annual financial statements 2016 2016 17
1.2 Financial instruments (continued)
The classification is dependent on the purpose for which the financial instrument is acquired and the substance of the contractual arrangement. Management determines the classification of its financial assets at the time of the initial recognition and re-evaluates such designation at least at each reporting date.
Financial liabilities consist of trade and other payables and borrowings. These are subsequently measured at amortised cost using the effective interest rate method.
Initial recognition and subsequent measurement
Financial instruments are recognised on the transaction date when the Group becomes a party to the contractual provisions of the instruments and are derecognised when these contractual obligations are discharged, cancelled or expired.
Financial instruments are initially recognised and measured at their fair value.
Loans and receivables comprise of loans, trade receivables, cash and cash equivalents and other receivables and are subsequently stated at amortised cost using the effective interest rate method, less accumulated impairment losses.
Impairment of financial assets
An assessment is performed at each reporting date to determine whether objective evidence exists that a financial asset is impaired. Objective evidence that financial instruments are impaired includes indications of a debtor or group of debtors experiencing significant financial difficulty, default or delinquency of payments, the probability of a debtor entering bankruptcy, or other observable data indicating a measurable decrease in estimated future cash flows, such as economic conditions that correlate with defaults.
An impairment loss in respect of a financial asset measured at amortised cost is calculated as the difference between its carrying amount and the present value of the estimated future cash flows discounted at the asset’s original effective interest rate.
Impairment losses are charged to the income statement and are included in the allowance against trade and other receivables. When a subsequent event causes the impairment loss to decrease, the impairment loss is reversed in the income statement. Loans and receivables, together with the associated allowance, are written off when there is no realistic prospect of future recovery.
1.3 Property, plant and equipment
Property, plant and equipment is initially measured at cost.
Property, plant and equipment is subsequently carried at historical cost less accumulated depreciation and any impairment losses.
Capital rental units are units installed in customers’ vehicles and the associated hardware is provided as part of a fixed term contract. The hardware and customer acquisition cost are capitalised over the duration of the contract which is usually 36 months. The Group depreciates capital rental units on a straight-line basis over the term of the customer contract. The hardware, consumable charges and installation charges are depreciated in cost of sales. The acquisiton costs comprising commission costs, motor vehicle lease costs and technician salaries are depreciated as part of operating expenses. If a contract with a customer is cancelled before the expiry of its contract term, the future unamortised cost is recognised immediately in the statement of other comprehensive income.
Property, plant and equipment are depreciated on the straight-line basis over their expected useful lives to their estimated residual value.

18 CartraCk Consolidated annual financial statements 2016
Accounting Policies (continued)
1.3 Property, plant and equipment (continued)
The useful lives of items of property, plant and equipment have been assessed as follows:
Item Average useful life
Buildings 20-50 years
Plant and equipment 5 years
Furniture and fixtures 5 years
Motor vehicles 4 years
Office equipment 5 years
IT equipment 3 years
Computer software 3 years
Leasehold improvements 3 years
Security equipment 5 years
Capital rental units 3 years
The residual value and useful life of each asset is reviewed at the end of each reporting period. If the expectations differ from previous estimates, the change is accounted for as a change in accounting estimate.
The carrying amount of property, plant and equipment will be derecognised on disposal or when no future economic benefits are expected from its use. Gains and losses on disposal of any items of property, plant and equipment are determined by comparing the proceeds from disposal with the carrying amount and are recognised in the income statement.
1.4 Goodwill
For the measurement of goodwill at initial recognition, refer to accounting policy note 1.1.
Goodwill is measured at cost less any accumulated impairment losses. Impairment losses recognised as an expense in relation to goodwill are not subsequently reversed.
Goodwill is tested annually for impairment. The carrying amount of goodwill is compared to the recoverable amount, which is the higher of value in use and the fair value less costs to sell. Goodwill is allocated to cash-generating units for the purpose of impairment testing. The allocation is made to those cash-generating units or groups of cash-generating units that are expected to benefit from the business combination giving rise to goodwill. Each unit or group of units to which the goodwill is allocated represents the lowest level within the Group at which the goodwill is monitored for internal management purposes.
On disposal of the relevant cash-generating unit or subsidiary, the attributable amount of goodwill is included in the determination of the profit or loss on disposal.
1.5 Impairment of non-financial assets
The Group’s non-financial assets, other than deferred tax assets, are reviewed at each reporting date or whenever events or changes in circumstances indicate that the carrying amount may not be recoverable, to determine whether there is any indication of impairment.
The impairment loss charged to the income statement is the excess of the carrying amount over the recoverable amount.
Recoverable amounts are estimated for individual assets or, where an individual asset cannot generate cash inflows independently, the recoverable amount is determined for the larger cash-generating unit to which the asset belongs.
For the purposes of goodwill impairment testing, cash-generating units to which goodwill has been allocated are aggregated such that the level at which impairment is tested reflects the lowest level at which goodwill is monitored internally.
Impairment losses recognised in respect of cash-generating units are first allocated to reduce the carrying amount of the goodwill allocated to the unit and then to reduce the carrying amounts of the other assets in the unit on a pro rata basis relative to their carrying amounts.

CartraCk Consolidated annual financial statements 2016 2016 19
1.5 Impairment of non-financial assets (continued)
With the exception of goodwill, a previously recognised impairment loss will be reversed insofar as estimates change as a result of an event occurring after the impairment loss was recognised.
An impairment loss is reversed only to the extent that the asset’s carrying amount does not exceed the carrying amount that would have been determined had no impairment loss been recognised.
1.6 Taxation
Tax expenses
Current and deferred taxes are recognised as income or an expense and included in profit or loss for the period, except to the extent that the taxation arises from:
• a transaction or event which is recognised, in the same or a different period, as other comprehensive income, or as equity; or
• a business combination.
In such cases, current and deferred taxes are charged or credited to other comprehensive income.
Dividend withholding tax is currently payable at a rate of 15% on dividends distributed to equity holders of the Group. This tax is not attributable to the Company, but is collected by the Company and paid to the tax authorities on behalf of the shareholder.
On receipt of a dividend by a company from an investment held in a tax jurisdiction outside that of the Company, any dividend withholding tax payable is recognised as part of the current tax.
Income taxation assets and liabilities
Income taxation for current and prior periods is, to the extent unpaid, recognised as a liability. If the amount already paid in respect of current and prior periods exceeds the amount due for those periods, the excess is recognised as an asset.
Income taxation liabilities (assets) for the current and prior periods are measured at the amount expected to be paid to (recovered from) the taxation authorities, using the taxation rates (and taxation laws) that have been enacted or substantively enacted by the end of the reporting period.
Deferred tax assets and liabilities
Deferred tax is provided by using the liability method, on all temporary differences between the carrying amount of assets and liabilities for accounting purposes and the amounts used for tax purposes.
The provision for deferred tax is calculated using enacted or substantively enacted tax rates at the reporting date that are expected to apply when the asset is realised or liability settled. A deferred tax asset is recognised to the extent that it is probable that future taxable profits will be available against which the deferred tax asset can be realised.
The provision of deferred tax assets and liabilities reflects the tax consequences that would follow from the expected recovery or settlement of the carrying amount of its assets and liabilities. Deferred tax assets and liabilities are offset when the related income taxes are levied by the same taxation authority, there is a legally enforceable right to offset and there is an intention to settle the balances on a net basis.
1.7 Leases
Leases where the Group assumes substantially all the benefits and risks of ownership, are classified as finance leases. Finance leases are capitalised as property, plant and equipment at the lower of fair value or the present value of the minimum lease payments at the inception of the lease with an equivalent amount being stated as a finance lease liability as part of debt.
The capitalised amount is depreciated over the asset’s useful life to the expected residual value. Lease payments are allocated between capital repayments and finance expenses using the effective interest rate method.
Leases of assets under which all the risks and benefits of ownership are effectively retained by the lessor are classified as operating leases. Lease payments under an operating lease are charged to the income statement over the lease term on a straight-line basis.

20 CartraCk Consolidated annual financial statements 2016
Accounting Policies (continued)
1.8 Inventories
Inventories are stated at the lower of cost and net realisable value. Net realisable value is the estimated selling price in the ordinary course of business less the estimated costs of completion and the estimated costs necessary to make the sale.
The cost of inventories comprises all costs of purchase, costs of conversion and other costs incurred in bringing the inventories to their present location and condition. Manufacturing costs include an allocated portion of production overheads which are directly attributable to the cost of manufacturing such inventory. The costs attributable to any inefficiencies in the production process are charged to the income statement as incurred.
Cost is determined on a first-in first-out (“FIFO”) or weighted average cost basis, depending on the nature of the Group entity in which it is held. The cost of finished goods includes the cost of manufacturing.
1.9 Share capital and equity
An equity instrument is any contract that evidences a residual interest in the assets of an entity after deducting all of its liabilities. Ordinary shares are classified as equity.
Treasury shares
Own equity instruments that are acquired (treasury shares) are recognised at cost and deducted from equity.
No gain or loss is recognised in profit or loss on the purchase, sale, issue or cancellation of the Group’s own equity instruments. Any difference between the carrying amount and the consideration, if reissued, is recognised in equity.
1.10 Employee benefits
Short-term and long-term employee benefits
Remuneration of employees is charged to the income statement. Short-term employee benefits are those that are expected to be settled completely within 12 months after the end of the reporting period in which the services have been rendered. Short-term employee benefit obligations are measured on an undiscounted basis and are charged to the income statement as the related service is provided. Long-term employee benefits are those benefits that are expected to be settled more than 12 months after the end of the reporting period in which the services have been rendered, and are discounted to their present value. An accrual is recognised for accumulated leave, incentive bonuses and other employee benefits when the Group has a present legal or constructive obligation as a result of past service provided by the employee, and a reliable estimate of the amount can be made.
Defined contribution plans
Such plans are plans under which the Group pays fixed contributions into a separate legal entity and has no legal or constructive obligation to pay further amounts. Contributions to defined contribution provident plans are charged to the income statement as an employee expense in the period in which related services are rendered, by the employee.
Short-term benefits-bonus
The Group recognises a liability and an expense for bonuses based on the achievement of defined key performance criteria. An accrual is recognised where the Group is contractually obliged or where there is a past practice that has created a constructive obligation.
1.11 Provisions and contingencies
Provisions are recognised when the Group has a present legal or constructive obligation as a result of a past event for which it is probable that an outflow of resources will be required to settle the obligation and a reliable estimate can be made of the amount of the obligation.
Provision for estimated liabilities on the warranty provision is based on the recovery rate and claim histories.
Contingent assets and liabilities are not recognised, but are disclosed.

CartraCk Consolidated annual financial statements 2016 2016 21
1.12 Revenue
Revenue is measured at the fair value of consideration received or receivable for the sale of goods and services by the Group in the ordinary course of its business activities. Revenue includes amounts earned from the sale of hardware, subscription revenue for vehicle tracking services provided to customers, subscription revenue for fleet management services provided to customers and revenue from the installation of vehicle tracking and fleet management solutions. Revenue is shown net of discounts, value added taxes (both locally and internationally) and after inter-company sales within the Group have been eliminated.
Hardware and installations
Revenue from the sale of hardware and installation is recognised when:
• the Group has transferred to the buyer the significant risks and rewards of ownership of the goods;
• the amount of revenue can be measured reliably;
• the installation is complete and tested successfully
Subscription revenue
Subscription-based revenue for vehicle tracking and fleet management services and ancillary services is recognised by reference to the stage of completion of the contract at the end of the reporting period.
Interest income
Interest is recognised, in profit or loss, using the effective interest rate method.
Dividend income
Dividends are recognised in the statement of comprehensive income when the Group’s right to receive payment has been established.
1.13 Earnings per share and headline earnings per share
Earnings per share
The Group presents basic, diluted, headline and normalised earnings per share data for its ordinary shares.
Basic earnings per share
Basic earnings per share is calculated by dividing the profit or loss attributable to ordinary shareholders of the Group by the weighted average number of ordinary shares outstanding during the year, adjusted for own shares held.
Diluted earnings per share
Diluted earnings per share is calculated by dividing the profit or loss attributable to ordinary shareholders of the Group by the weighted average number of ordinary shares outstanding during the year, adjusted for possible dilutive effects of potential ordinary shares.
Headline earnings per share
The calculation of headline earnings per share is based on the net profit attributable to equity holders of the parent, after excluding certain remeasurements in terms of SAICA circular 2-2015, divided by the weighted average number of ordinary shares in issue during the year. The presentation of headline earnings is not an IFRS requirement, but is required for JSE-listed companies as defined by the South African Institute of Chatered Accountants. An itemised reconciliation of the adjustments to net profit attributable to equity holders of the parent is provided in note 30.
Normalised earnings per share
The presentation of normalised earnings per share is not an IFRS or JSE requirement. Management presents this measure as a supplementary performance measure. Normalised earnings represents headline earnings plus/(less) any other unusual non-recurring and non-operating items not already taken into account in headline earnings. An itemised reconciliation of the adjustments to headline earnings is provided in note 32.

22 CartraCk Consolidated annual financial statements 2016
Accounting Policies (continued)
1.14 Segment reporting
The Group is organised into geographical business units that engage in business activities from which they earn revenue and incur expenses, including revenues and expenses that relate to transactions with any of the Group’s other components. The Group has four reportable operating segments, each segment providing essentially the same or similar products and services to a homogenous target market, and for which discrete financial information is available. Segment performance is evaluated regularly by the Group’s Global CFO (Deputy CEO) and Global CEO to make decisions about resources to be allocated to the segment and to assess its performance.
Segment assets and liabilities comprise those operating assets and liabilities that are directly attributable to the segment.
1.15 Measurement of fair values
A number of the Group’s accounting policies and disclosures require the measurement of fair values, for both financial and non- financial assets and liabilities.
When measuring the fair value of an asset or liability, the Group uses market observable data as far as possible. Fair values are categorised into different levels in a fair value hierarchy based on the inputs used in the valuation techniques as follows:
• Level 1 – quoted prices (unadjusted) in active markets for identical assets or liabilities.
• Level 2 – inputs other than quoted prices included in Level 1 that are observable for the asset or liability, either directly (ie as prices) or indirectly (ie derived from prices).
• Level 3 – inputs for the asset or liability that are not based on observable market data (unobservable inputs).
If the inputs used to measure the fair value of an asset or liability might be categorised in different levels of the fair value hierarchy, then the fair value measurement is categorised in its entirety in the same level of the fair value hierarchy as the lowest level input that is significant to the entire measurement.
The Group recognises transfers between levels of the fair value hierarchy at the end of the reporting period during which the change has occurred.
1.16 Share based payment
Executive members of management and certain senior employees occupying key positions are incentivised through the Cartrack Executive Share Incentive Scheme managed through a Trust (“the Trust”). The Trust creates notional units as a mechanism to determine the quantum of each beneficiary’s rights, units being under-pinned by an equal in number of shares acquired by the Trust. Units are allocated to qualifying beneficiaries at no cost and subject to specific vesting criteria. Shares acquired by the Trust never vest in the beneficiaries. At the end of the relevant vesting period, and subject to the vesting criteria having being met, the Trustees, at their discretion, dispose of the relevant shares and distribute the proceeds to the beneficiaries in accordance with the provisions of the Trust Deed.
The costs of the Trust are expensed as incurred and the value of the notional units are recognised as an expense pro rata to the vesting period.
1.17 Significant judgements and sources of estimation uncertainty
The Group makes judgements, estimates and assumptions concerning the future when preparing the consolidated annual financial statements. Actual results may differ from these estimates.
Estimates and underlying assumptions are reviewed on an ongoing basis. Revisions to accounting estimates are recognised in the period in which the estimates are revised and in any future periods affected.
Loans and receivables
Appropriate allowances for estimated irrecoverable amounts are recognised in profit or loss when there is objective evidence that the asset is impaired. Significant financial difficulties of the debtor, probability that the debtor will enter bankruptcy or financial reorganisation, and default or delinquency in payments (more than 90 days overdue) are considered indicators that the trade receivable is impaired. The allowance recognised is measured as the difference between the asset’s carrying amount and the present value of estimated future cash flows discounted at the effective interest rate computed at initial recognition.

CartraCk Consolidated annual financial statements 2016 2016 23
1.17 Significant judgements and sources of estimation uncertainty (continued)
For all financial instruments carried at amortised cost where the effects of time value of money are not considered to be material, the instruments are not discounted as their face values approximate their amortised cost. The fair value of loans and receivables is estimated at the present value of future cash flows, discounted at the market interest rate at the reporting date for the purpose of disclosure.
Allowance for slow moving, damaged and obsolete stock
An allowance to write stock down to the lower of cost or net realisable value has been provided. Management has made estimates of the selling prices and direct costs to sell on certain inventory items. The write down is included in the inventories note.
Goodwill
The Group tests goodwill for impairment on an annual basis, in accordance with the accounting policy disclosed in note 1.4
The recoverable amounts of cash-generating units have been determined based on value-in-use calculations. These calculations are performed internally by the Group and require the use of estimates and assumptions.
The input factors most sensitive to change are management estimates of future cash flows based on budgets and forecasts, growth rates and discount rates. Further detail on these assumptions has been disclosed in note 5. The Group has performed a sensitivity analysis by varying these input factors by a reasonable margin and assessing whether the changes in input factors result in any of the goodwill allocated to appropriate cash-generating units being impaired.
Taxation
The Group operates in many countries and is subject to taxes in numerous jurisdictions. Significant judgement is required in determining the provision for taxes as the tax treatment is often by its nature complex. Amounts provided are accrued based on management’s interpretation of country specific tax laws and the likelihood of settlement. Actual liabilities could differ from the amount provided.
Subsidiaries
Subsidiaries are entities controlled by the Group. Control is achieved when the Group is exposed, or has rights, to variable returns from its involvement with the investee and has the ability to affect those returns through its power over the investee.
The Group also considers the following facts and circumstances in assessing whether it has power over an investee:
(a) Contractual arrangements.
(b) Rights arising from contractual arrangements.
(c) Group’s voting rights and potential voting rights.
The Group re-assesses whether or not it controls an investee if facts and circumstances indicate changes to the elements of control.
Residual values and useful lives of property, plant and equipment
The estimation of the useful lives of property, plant and equipment is based on historic performance as well as expectations about future use and therefore requires a significant degree of judgement to be applied by management. The depreciation rates used represent management’s current best estimate of the useful lives of the assets.
Warranty claims
The Group generally offers stolen vehicle warranties of up to R150,000 in the event of non-recovery of a vehicle, subject to various terms and conditions. Management estimates the related provision for future warranty claims based on the average recovery rate, historical claims and the probability of theft.

24 CartraCk Consolidated annual financial statements 2016
2. CORRECTION OF ACCOUNTING ERROR
Group practice is to invoice subscriptions in advance and to defer recognising such subscriptions in revenue to the subsequent accounting period(s) to which they relate. During 2016 it has been identified that the deferral of advance billings has not been applied correctly in all circumstances.
In the ordinary course of business in South Africa and certain other African countries, a proportion of subscriber contracts are entered into on an annual basis and are invoiced, and paid, annually in advance. In the past, revenue has consistently been recognised on these annual contracts in full in the year of invoice. On the other hand, certain subscription billing was being incorrectly deferred to the subsequent month although it was in fact due in respect of the invoicing month.
With effect from the 2016 year this incorrect accounting treatment has been rectified such that the proportion of revenue invoiced in any accounting period is now deferred to the period to which it relates and recorded in the balance sheet as a current liability.
In giving effect to this correction in accounting treatment, the financial statements in respect of the two previous financial years have been restated.
The aggregate effect of the correction of accounting error on the consolidated annual financial statements is as follows:
Figures in Rand thousand 2015 2014
Consolidated Statement of Financial Position
Asset
Deferred tax asset net of liability
Previously stated 8 674 5 047
Adjustment 11 500 7 988
20 174 13 035
Trade and other receivables
Previously stated 68 177 45 081
Adjustment 13 528 10 823
81 705 55 904
Liabilities
Trade and other payables
Previously stated (101 135) (73 750)
Adjustment (48 147) (36 484)
(149 282) (110 234)
Income tax asset net of liability
Previously stated (35 872) (26 790)
Adjustment (2 419) (1 679)
(38 291) (28 469)
Equity
Retained Earnings Closing
Previously stated (300 413) (157 307)
Adjustment 14 781 11 351
(285 632) (145 956)
NOTES TO THE CONSOLIDATED ANNUAL FINANCIAL STATEMENTS
CartraCk Consolidated annual financial statements 2016 2016 25
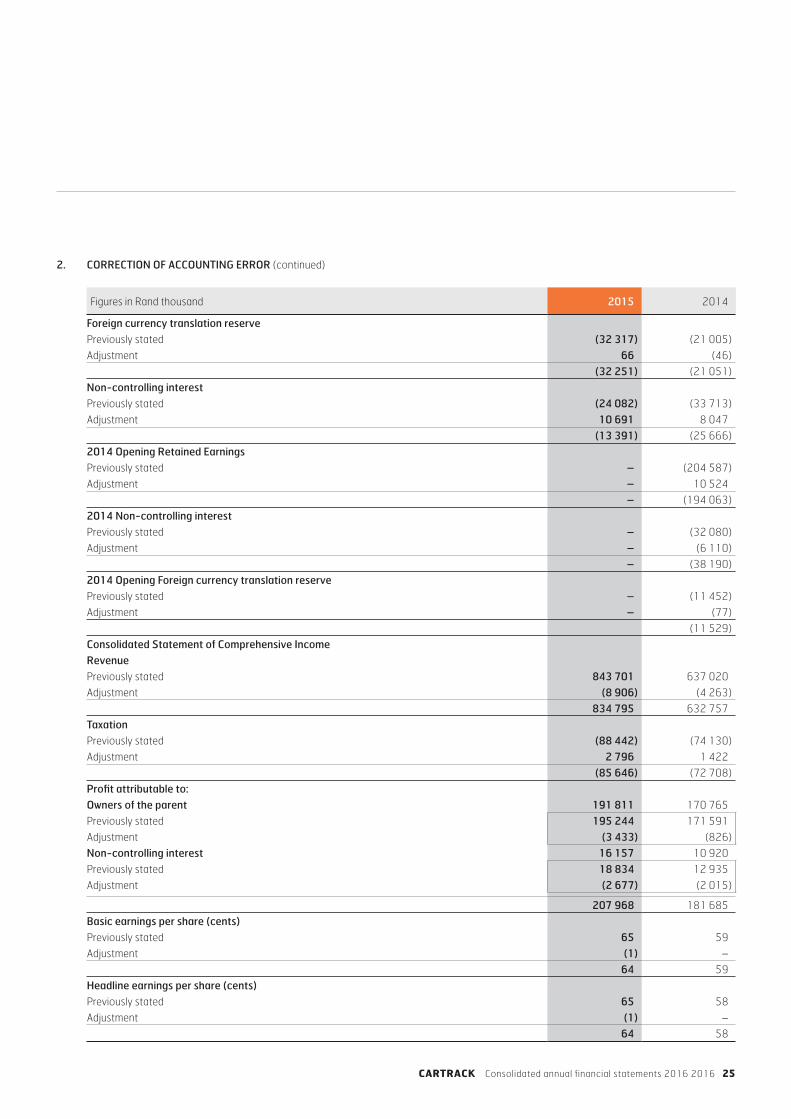
2. CORRECTION OF ACCOUNTING ERROR (continued)
Figures in Rand thousand 2015 2014
Foreign currency translation reservePreviously stated (32 317) (21 005)
Adjustment 66 (46)
(32 251) (21 051)
Non-controlling interestPreviously stated (24 082) (33 713)
Adjustment 10 691 8 047
(13 391) (25 666)
2014 Opening Retained EarningsPreviously stated – (204 587)
Adjustment – 10 524
– (194 063)
2014 Non-controlling interestPreviously stated – (32 080)
Adjustment – (6 110)
– (38 190)
2014 Opening Foreign currency translation reservePreviously stated – (11 452)
Adjustment – (77)
(11 529)
Consolidated Statement of Comprehensive IncomeRevenuePreviously stated 843 701 637 020
Adjustment (8 906) (4 263)
834 795 632 757
TaxationPreviously stated (88 442) (74 130)
Adjustment 2 796 1 422
(85 646) (72 708)
Profit attributable to: Owners of the parent 191 811 170 765
Previously stated 195 244 171 591
Adjustment (3 433) (826)
Non-controlling interest 16 157 10 920
Previously stated 18 834 12 935
Adjustment (2 677) (2 015)
207 968 181 685
Basic earnings per share (cents)Previously stated 65 59
Adjustment (1) –
64 59
Headline earnings per share (cents)Previously stated 65 58
Adjustment (1) –
64 58

26 CartraCk Consolidated annual financial statements 2016
Notes to the CoNsolidated aNNual FiNaNCial statemeNts (continued)
3. NEW STANDARDS AND INTERPRETATIONS
3.1 Standards and interpretations effective and adopted in the current year
In the current year, the Group has adopted the following standards and interpretations that are effective for the current financial year and that are relevant to its operations:
Amendment to IFRS 13: Fair Value Measurement: Annual improvements project
The amendment clarifies that references to financial assets and financial liabilities in paragraphs 48–51 and 53–56 should be read as applying to all contracts within the scope of, and accounted for in accordance with, IAS 39 or IFRS 9, regardless of whether they meet the definitions of financial assets or financial liabilities in IAS 32 Financial Instruments: Presentation.
The effective date of the amendment is for years beginning on or after 1 July 2014.
The Company has adopted the amendment for the first time in the 2016 annual financial statements. The impact of the amendment is not material.
Amendment to IAS 24: Related Party Disclosures: Annual improvements project
The definition of a related party has been amended to include an entity, or any member of a group of which it is a part, which provides key management personnel services to the reporting entity or to the parent of the reporting entity (“management entity”). Disclosure is required of payments made to the management entity for these services, but not of payments made by the management entity to its directors or employees.
The effective date of the amendment is for years beginning on or after 1 July 2014.
The Company has adopted the amendment for the first time in the 2016 annual financial statements. The impact of the amendment is not material.
Amendment to IFRS 7: Financial Instruments: Disclosures: Annual Improvements project
The amendment provides additional guidance regarding transfers with continuing involvement. Specifically, it provides that cash flows exclude cash collected which must be remitted to a transferee. It also provides that when an entity transfers a financial asset but retains the right to service the asset for a fee, that the entity should apply the existing guidance to consider whether it has continuing involvement in the asset.
The effective date of the ammendment is for years beginning on or after 1 January 2016.
The Group will adopt the amendment for the first time in the 2017 consolidated annual financial statements.
It is unlikely that the amendment will have a material impact on the Group’s consolidated annual financial statements.
Amendment to IAS 19: Employee Benefits: Annual Improvements project
The amendment clarifies that when a discount rate is determined for currencies where there is no deep market in high quality corporate bonds, then market yields on government bonds in that currency should be used.
The effective date of the amendment is for years beginning on or after 1 January 2016.
The Group will adopt the amendment for the first time in the 2017 consolidated annual financial statements.
It is unlikely that the amendment will have a material impact on the Group’s consolidated annual financial statements.
Disclosure Initiative: Amendment to IAS 1: Presentation of Financial Statements
The amendment provides new requirements when an entity presents subtotals in addition to those required by IAS 1 in its consolidated annual financial statements. It also provides amended guidance concerning the order of presentation of the notes in the consolidated annual financial statements, as well as guidance for identifying which accounting policies should be included. It further clarifies that an entity’s share of comprehensive income of an associate or joint venture under the equity method shall be presented separately into its share of items that a) will not be reclassified subsequently to profit or loss and b) that will be reclassified subsequently to profit or loss.

CartraCk Consolidated annual financial statements 2016 2016 27
3. NEW STANDARDS AND INTERPRETATIONS (continued)
3.1 Standards and interpretations effective and adopted in the current year (continued)
The effective date of the amendment is for years beginning on or after 01 January 2016.
The Group will adopt the amendment for the first time in the 2017 consolidated annual financial statements.
It is unlikely that the amendment will have a material impact on the Group’s consolidated annual financial statements.
Amendment to IAS 34: Interim Financial Reporting. Annual Improvements project
The amendment allows an entity to present disclosures required by paragraph 16A either in the interim consolidated annual financial statements or by cross reference to another report, for example, a risk report, provided that other report is available to users of the consolidated annual financial statements on the same terms as the interim consolidated annual financial statements and at the same time.
The effective date of the amendment is for years beginning on or after 1 January 2016.
The Group will adopt the amendment for the first time in the 2017 consolidated annual financial statements.
It is unlikely that the amendment will have a material impact on the Group’s consolidated annual financial statements.
IFRS 9 Financial Instruments
IFRS 9 issued in November 2009, introduced new requirements for the classification and measurements of financial assets. IFRS 9 was subsequently amended in October 2010 to include requirements for the classification and measurement of financial liabilities and for derecognition, and in November 2013 to include the new requirements for general hedge accounting. Another revised version of IFRS 9 was issued in July 2014 mainly to include a) impairment requirements for financial assets and b) limited amendments to the classification and measurement requirements by introducing a “fair value through other comprehensive income” (FVTOCI) measurement category for certain simple debt instruments.
Key requirements of IFRS 9:
• All recognised financial assets that are within the scope of IAS 39 Financial Instruments: Recognition and Measurement are required to be subsequently measured at amortised cost or fair value. Specifically, debt investments that are held within a business model whose objective is to collect the contractual cash flows, and that have contractual cash flows that are solely payments of principal and interest on the outstanding principal are generally measured at amortised cost at the end of subsequent reporting periods. Debt instruments that are held within a business model whose objective is achieved by both collecting contractual cash flows and selling financial assets, and that have contractual terms of the financial asset give rise on specified dates to cash flows that are solely payments of principal and interest on outstanding principal, are measured at fair value through other comprehensive income. All other debt and equity investments are measured at fair value at the end of subsequent reporting periods. In addition, under IFRS 9, entities may make an irrevocable election to present subsequent changes in the fair value of an equity investment (that is not held for trading) in other comprehensive income with only dividend income generally recognised in profit or loss.
• With regard to the measurement of financial liabilities designated as at fair value through profit or loss, IFRS 9 requires that the amount of change in the fair value of the financial liability that is attributable to changes in the credit risk of the liability is presented in other comprehensive income, unless the recognition of the effect of the changes of the liability’s credit risk in other comprehensive income would create or enlarge an accounting mismatch in profit or loss. Under IAS 39, the entire amount of the change in fair value of a financial liability designated as at fair value through profit or loss is presented in profit or loss.
• In relation to the impairment of financial assets, IFRS 9 requires an expected credit loss model, as opposed to an incurred credit loss model under IAS 39. The expected credit loss model requires an entity to account for expected credit losses and changes in those expected credit losses at each reporting date to reflect changes in credit risk since initial recognition. It is therefore no longer necessary for a credit event to have occurred before credit losses are recognised.

28 CartraCk Consolidated annual financial statements 2016
Notes to the CoNsolidated aNNual FiNaNCial statemeNts (continued)
3. NEW STANDARDS AND INTERPRETATIONS (continued)
3.1 Standards and interpretations effective and adopted in the current year (continued)
• The new general hedge accounting requirements retain the three types of hedge accounting mechanisms currently available in IAS 39. Under IFRS 9, greater flexibility has been introduced to the types of transactions eligible for hedge accounting, specifically broadening the types of instruments that qualify for hedging instruments and the types of risk components of non-financial items that are eligible for hedge accounting. In addition, the effectiveness test has been replaced with the principal of an “economic relationship”. Retrospective assessment of hedge effectiveness is also no longer required. Enhanced disclosure requirements about an entity’s risk management activities have also been introduced.
The effective date of the standard is for years beginning on or after 1 January 2018.
The Group expects to adopt the standard for the first time in the 2019 consolidated annual financial statements.
It is unlikely that the standard will have a material impact on the Group’s consolidated annual financial statements.
IFRS 15 Revenue from Contracts with Customers
IFRS 15 supersedes IAS 11 Construction contracts; IAS 18 Revenue; IFRIC 13 Customer Loyalty Programmes; IFRIC 15 Agreements for the construction of Real Estate; IFRIC 18 Transfers of Assets from Customers and SIC 31 Revenue – Barter Transactions Involving Advertising Services.
The core principle of IFRS 15 is that an entity recognises revenue to depict the transfer of promised goods or services to customers in an amount that reflects the consideration to which the entity expects to be entitled in exchange for those goods or services. An entity recognises revenue in accordance with that core principle by applying the following steps:
• Identify the contract(s) with a customer
• Identify the performance obligations in the contract
• Determine the transaction price
• Allocate the transaction price to the performance obligations in the contract
• Recognise revenue when (or as) the entity satisfies a performance obligation.
IFRS 15 also includes extensive new disclosure requirements.
The effective date of the standard is for years beginning on or after 1 January 2018.
The Group expects to adopt the standard for the first time in the 2019 consolidated annual financial statements.
It is unlikely that the standard will have a material impact on the Group’s consolidated annual financial statements.

CartraCk Consolidated annual financial statements 2016 2016 29
3. NEW STANDARDS AND INTERPRETATIONS (continued)
3.1 Standards and interpretations effective and adopted in the current year (continued)
IFRS 16 Leases
IFRS 16 Leases introduces a single lessee accounting model which requires a lessee to recognise assets and liabilities for all leases with a term of more than 12 months, unless the underlying asset is of low value. A lessee is required to recognise a right-of-use asset representing its right to use the underlying leased asset and a lease liability representing its obligation to make lease payments. A lessee measures right-of-use assets similarly to other non-financial assets (such as property, plant and equipment) and lease liabilities similarly to other financial liabilities. As a consequence, a lessee recognises depreciation of the right-of-use asset and interest on the lease liability, and also classifies cash repayments of the lease liability into a principal portion and an interest portion and presents them in the statement of cash flows applying IAS 7 Statement of Cash Flows.
IFRS 16 contains expanded disclosure requirements for lessees. Lessees will need to apply judgement in deciding upon the information to disclose to meet the objective of providing a basis for users of financial statements to assess the effect that leases have on the financial position, financial performance and cash flows of the lessee.
IFRS 16 substantially carries forward the lessor accounting requirements in IAS 17. Accordingly, a lessor continues to classify its leases as operating leases or finance leases, and to account for those two types of leases differently.
IFRS 16 also requires enhanced disclosures to be provided by lessors that will improve information disclosed about a lessor’s risk exposure, particularly to residual value risk.
IFRS 16 supersedes the following Standards and Interpretations:
(a) IAS 17 Leases;
(b) IFRIC 4 Determining whether an Arrangement contains a Lease;
(c) SIC-15 Operating Leases–Incentives; and
(d) SIC-27 Evaluating the Substance of Transactions Involving the Legal Form of a Lease.
The effective date of the standard is for years beginning on or after 1 January 2019.
The Group expects to adopt the standard for the first time in the 2019 consolidated annual financial statements.
It is unlikely that the standard will have a material impact on the Group’s consolidated annual financial statements.

30 CartraCk Consolidated annual financial statements 2016
Notes to the CoNsolidated aNNual FiNaNCial statemeNts (continued)
4. PROPERTY, PLANT AND EqUIPMENT
2016 2015 2014
Figures in Rand thousand CostAccumulateddepreciation
Carrying value Cost
Accumulateddepreciation
Carrying value Cost
Accumulateddepreciation
Carrying value
Buildings 5 234 (942) 4 292 4 961 (212) 4 749 5 126 (82) 5 044
Plant and equipment 2 101 (1 211) 890 1 391 (1 004) 387 1 200 (1 044) 156
Furniture and fixtures 6 310 (2 785) 3 525 5 059 (1 751) 3 308 3 631 (1 506) 2 125
Motor vehicles 47 318 (24 652) 22 666 40 866 (20 988) 19 878 32 889 (16 893) 15 996
Office equipment 3 942 (3 227) 715 3 294 (1 907) 1 387 3 296 (1 181) 2 115
IT equipment 22 218 (13 730) 8 488 14 220 (9 206) 5 014 9 200 (6 795) 2 405
Computer software 1 533 (749) 784 814 (406) 408 505 (214) 291
Leasehold improvements 5 331 (5 331) – 722 (666) 56 722 (541) 181
Security equipment 452 (372) 80 459 (283) 176 306 (238) 68
Other fixed assets – – – – – – 5 071 (2 144) 2 927
Capital rental units 310 267 (144 173) 166 094 174 570 (59 403) 115 167 147 135 (73 954) 73 181
Total 404 706 (197 172) 207 534 246 356 (95 826) 150 530 209 081 (104 592) 104 489
Figures in Rand thousandOpeningbalance Additions
Additionsthrough
business combinations Disposals
Transfers andreclassifications
Translationadjustments Depreciation Total
Reconciliation of property, plant and equipment - 2016Buildings 4 749 – – – – (45) (412) 4 292Plant and equipment 387 817 75 – (297) 99 (191) 890
Furniture and fixtures 3 308 836 153 – – 174 (946) 3 525Motor vehicles 19 878 8 791 – (1 317) – 990 (5 676) 22 666Office equipment 1 387 763 – – – (1 111) (324) 715IT equipment 5 014 5 576 11 (22) – 1 195 (3 286) 8 488Computer software 408 610 30 – – 8 (272) 784Leasehold improvements 56 – – – – – (56) –Capital rental units 115 167 140 554 – (1 566) 297 3 043 (91 401) 166 094Security equipment 176 – – – – – (96) 80
150 530 157 947 269 (2 905) – 4 353 (102 660) 207 534Reconciliation of property, plant and equipment - 2015Buildings 5 044 – – – – (105) (190) 4 749
Plant and equipment 156 64 8 – 125 87 (53) 387
Furniture and fixtures 2 125 1 820 518 (223) – (175) (757) 3 308
Motor vehicles 15 996 9 676 425 (2 310) – 1 823 (5 732) 19 878
Office equipment 2 115 1 766 47 (1 251) – (593) (697) 1 387
IT equipment 2 405 2 857 1 665 (130) – 844 (2 627) 5 014
Computer software 291 145 201 – – (28) (201) 408
Leasehold improvements 181 – – – (125) – – 56
Capital rental units 73 181 100 354 – – 2 926 – (61 294) 115 167
Security equipment 68 154 – – – – (46) 176
Other fixed assets 2 927 – – – (2 926) (1) – –
104 489 116 836 2 864 (3 914) – 1 852 (71 597) 150 530

CartraCk Consolidated annual financial statements 2016 2016 31
4. PROPERTY, PLANT AND EqUIPMENT
2016 2015 2014
Figures in Rand thousand CostAccumulateddepreciation
Carrying value Cost
Accumulateddepreciation
Carrying value Cost
Accumulateddepreciation
Carrying value
Buildings 5 234 (942) 4 292 4 961 (212) 4 749 5 126 (82) 5 044
Plant and equipment 2 101 (1 211) 890 1 391 (1 004) 387 1 200 (1 044) 156
Furniture and fixtures 6 310 (2 785) 3 525 5 059 (1 751) 3 308 3 631 (1 506) 2 125
Motor vehicles 47 318 (24 652) 22 666 40 866 (20 988) 19 878 32 889 (16 893) 15 996
Office equipment 3 942 (3 227) 715 3 294 (1 907) 1 387 3 296 (1 181) 2 115
IT equipment 22 218 (13 730) 8 488 14 220 (9 206) 5 014 9 200 (6 795) 2 405
Computer software 1 533 (749) 784 814 (406) 408 505 (214) 291
Leasehold improvements 5 331 (5 331) – 722 (666) 56 722 (541) 181
Security equipment 452 (372) 80 459 (283) 176 306 (238) 68
Other fixed assets – – – – – – 5 071 (2 144) 2 927
Capital rental units 310 267 (144 173) 166 094 174 570 (59 403) 115 167 147 135 (73 954) 73 181
Total 404 706 (197 172) 207 534 246 356 (95 826) 150 530 209 081 (104 592) 104 489
Figures in Rand thousandOpeningbalance Additions
Additionsthrough
business combinations Disposals
Transfers andreclassifications
Translationadjustments Depreciation Total
Reconciliation of property, plant and equipment - 2016Buildings 4 749 – – – – (45) (412) 4 292Plant and equipment 387 817 75 – (297) 99 (191) 890
Furniture and fixtures 3 308 836 153 – – 174 (946) 3 525Motor vehicles 19 878 8 791 – (1 317) – 990 (5 676) 22 666Office equipment 1 387 763 – – – (1 111) (324) 715IT equipment 5 014 5 576 11 (22) – 1 195 (3 286) 8 488Computer software 408 610 30 – – 8 (272) 784Leasehold improvements 56 – – – – – (56) –Capital rental units 115 167 140 554 – (1 566) 297 3 043 (91 401) 166 094Security equipment 176 – – – – – (96) 80
150 530 157 947 269 (2 905) – 4 353 (102 660) 207 534Reconciliation of property, plant and equipment - 2015Buildings 5 044 – – – – (105) (190) 4 749
Plant and equipment 156 64 8 – 125 87 (53) 387
Furniture and fixtures 2 125 1 820 518 (223) – (175) (757) 3 308
Motor vehicles 15 996 9 676 425 (2 310) – 1 823 (5 732) 19 878
Office equipment 2 115 1 766 47 (1 251) – (593) (697) 1 387
IT equipment 2 405 2 857 1 665 (130) – 844 (2 627) 5 014
Computer software 291 145 201 – – (28) (201) 408
Leasehold improvements 181 – – – (125) – – 56
Capital rental units 73 181 100 354 – – 2 926 – (61 294) 115 167
Security equipment 68 154 – – – – (46) 176
Other fixed assets 2 927 – – – (2 926) (1) – –
104 489 116 836 2 864 (3 914) – 1 852 (71 597) 150 530

32 CartraCk Consolidated annual financial statements 2016
Notes to the CoNsolidated aNNual FiNaNCial statemeNts (continued)
4. PROPERTY, PLANT AND EqUIPMENT (continued)
Figures in Rand thousandOpeningbalance
Additions
Additionsthrough
business combinations Disposals
Translationadjustments Depreciation Total
Reconciliation of property, plant and equipment - 2014
Buildings 2 512 2 112 – – 444 (24) 5 044
Plant and equipment 53 166 – – (3) (60) 156
Furniture and fixtures 267 1 035 1 275 (25) (3) (424) 2 125
Motor vehicles 15 551 5 841 – (833) 92 (4 655) 15 996
Office equipment 1 359 965 – – 228 (437) 2 115
IT equipment 1 344 – 2 661 – (23) (1 577) 2 405
Computer software – 310 – – – (19) 291
Leasehold improvements 354 – – – – (173) 181
Security equipment 66 47 – – – (45) 68
Other fixed assets – – 4 294 – (142) (1 225) 2 927
Capital rental units 46 389 61 764 - (1 480) – (33 492) 73 181
67 895 72 240 8 230 (2 338) 593 (42 131) 104 489
Figures in Rand thousand 2016 2015 2014
Assets subject to finance lease (net carrying amount)
The carrying value of assets subject to finance lease agreements (refer note13) is as follows:
Motor vehicles 16 741 11 968 8 138
A register containing the information required by Regulation 25(3) of the Companies Regulations, 2011 is available for inspection at the registered office of the Company.
5. GOODWILL
Goodwill is allocated to cash generating units (CGUs) within the reportable segments.
South Africa
Africa – Other Europe
Asia &Middle
East Total
Balance 1 March 2013 1 499 80 756 – – 82 255
Additions – 1 763 – 899 2 662
Translation adjustments – 14 400 – 116 14 516
28 February 2014 1 499 96 919 – 1 015 99 433
Additions – 382 45 041 471 45 894
Translation adjustments – 1 955 (3 390) 377 (1 058)
28 February 2015 1 499 99 256 41 651 1 863 144 269
Additions 157 – – – 157
Translation adjustments – (3 074) 14 031 628 11 585
29 February 2016 1 656 96 182 55 682 2 491 156 011

CartraCk Consolidated annual financial statements 2016 2016 33
5. GOODWILL (continued)
Impairment testing
The Group performs goodwill impairment testing on an annual basis.
The recoverable amount of the cash generating units is determined using a discounted cash flow technique, which requires the use of assumptions. The cash flow projections are based on financial budgets and forecasts covering a five year period. The cash flow projections include specific estimates for five years and a terminal growth rate thereafter.
The key assumptions used for the projection of cash flows are:
Assumption Approach used in determing values
Compound annual growthrate (CAG%) of subscriber base
This is the average annual compound growth rate in the subscriber base that is derived from the forecast acquisition of new subscribers less cancellations (“churn”) from year 1 (the budget period) through to year 5. Thereafter a terminal value has been calculated assuming a 3% per annum growth rate in net cash flow after year 5. The growth rate applied for the acquisition of new subscribers is considered to be the main driver of revenue, profitability and hence free cash flow. CGUs are at different maturity levels in their business cycles and hence will reflect considerably different growth rates; the various geographical markets the CGUs operate within also have differences in their economics which have been taken into consideration. The growth rate determined by management is based on historical data from both external and internal sources and is consistent with reported global telematics growth forecasts for the medium to long term and with the assumptions that a market participant would make.
Discount rates The rate reflects the specific risks relating to the country and industry in which the entity operates.
Other cashflow assumptions
Revenue forecasts are based on 2016 selling price structures without any inflationary impact. Operating costs assume appropriate increases for both inflationary and infrastructural increases. Capital expenditure and working capital requirements to support the forecast growth have been taken into account. Exchange rates ruling at 29 February 2016 have been applied throughout the five-year forecast period.
The following CAG and discount rates have been applied to the CGUs within each operating segment:
29 February 2016
South Africa %
Africa %
Europe %
Asia %
Compound annual growth rate in subscribers 12 19 25 38
Discount rate 20 34 19 10
28 February 2015
South Africa %
Africa %
Europe %
Asia %
Compound annual growth rate in subscribers 10 8 10 10
Discount rate 20 20 20 20
Management has reassessed the risks applicable to each operating segment and the projections for growth of each CGU within the segments. This has resulted in a greater variability in both projected growth rates and discount (risk) rates being applied in the 2016 goodwill impairment testing process compared to 2015 and is considered more comprehensive and appropriate.
Based on the above assumptions and calculations it was determined that there was sufficient headroom above goodwill, therefore no impairment was necessary.

34 CartraCk Consolidated annual financial statements 2016
Notes to the CoNsolidated aNNual FiNaNCial statemeNts (continued)
5. GOODWILL (continued)
Sensitivity analysis
To test the sensitivity of the two key assumptions, being the future compound subscriber growth rate and the discount rate (i.e risk profile), the following changes have been made to these factors:
• Compound annual subscriber growth rate: the projected growth rates per segment have been adjusted downwards in South Africa by 2%, Africa by 4%, Europe by 2% and Asia by 2%.
• Discount rate: the projected discount rates per segment have been increased by 5%.
The adjusted growth and discount rates on which the sensitivity has been based are shown in the table below:
Key assumptions – sensitivity analysis
29 February 2016
South Africa %
Africa %
Europe %
Asia %
Compound annual growth rate in subscribers 10 15 23 36Discount rate 25 39 24 15
Based on these independently downward adjusted growth rate assumptions and increased risk assumptions, there remains sufficient headroom above goodwill so as not to require any impairment.
6. DEFERRED TAx
Figures in Rand thousand 2016 2015 2014
Deferred tax 33 477 20 174 13 035
The deferred tax asset and deferred tax liability have not been set off: The reconciliation is shown below:
Deferred tax liability (1 040) (236) (1)
Deferred tax asset 34 517 20 410 13 036
Total net deferred tax asset (liability) 33 477 20 174 13 035
Reconciliation of deferred tax asset/(liability)At beginning of year 20 174 13 035 4 867
Increases in income received in advance 3 840 3 976 8 493
Increase in tangible fixed assets 5 996 365 (217)
Increase in allowances for doubtful debts 1 182 108 60
Increase/(decrease) in accruals (518) 1 265 (168)
Unutilised assessed loss 768 1 425 –
Assets held under finance leases 2 035 – –
33 477 20 174 13 035
7. INVENTORIES
Finished goods 86 122 60 984 31 562
Consumables 3 012 1 942 1 178
89 134 62 926 32 740
Inventories (write-downs) (816) (394) –
88 318 62 532 32 740
The Group has identified certain inventory which requires impairment and this has been written off to cost of sales.

CartraCk Consolidated annual financial statements 2016 2016 35
8. Interests in subsidiaries
The following table lists the entities which are controlled by the Group.
Name of company Held byCountry of incorporation
% voting power and
holding2016
% voting power and
holding 2015
% voting power and
holding 2014
Cartrack (Pty) Ltd Cartrack Holdings Ltd South Africa 100.00 100.00 100.00
Cartrack Tanzania Ltd Cartrack Holdings Ltd Tanzania 60.00 60.00 60.00
Retriever Ltd Cartrack Holdings Ltd Kenya 85.00 85.00 85.00
Retriever Rwanda Ltd Cartrack Holdings Ltd Rwanda 60.00 60.00 –
Cartrack Engineering Technologies Ltd Cartrack Holdings Ltd Nigeria 99.99 99.99 –
Cartrack Namibia (Pty) Ltd Cartrack Holdings Ltd Namibia 100.00 100.00 100.00
Cartrack Technologies (Pty) Ltd Cartrack Holdings Ltd South Africa 100.00 100.00 –
Cartrack Technologies Asia Pte. Ltd Cartrack Holdings Ltd Singapore 100.00 100.00 100.00
Cartrack Manufacturing (Pty) Ltd Cartrack Holdings Ltd South Africa 100.00 – –
Cartrack Management Services (Pty) Ltd Cartrack Holdings Ltd South Africa 100.00 – –
PT. Cartrack Technologies Indonesia Cartrack Technologies Asia Pte. Ltd Indonesia 65.00 65.00 –
Cartrack Investments UK Ltd Cartrack Technologies Asia Pte. Ltd UK 100.00 100.00 –
Cartrack Technologies (China) Ltd Cartrack Technologies Asia Pte. Ltd China 90.00 90.00 –
Cartrack Malaysia SDN.BHD Cartrack Technologies Asia Pte. Ltd Malaysia 100.00 100.00 –
Cartrack Technologies LLC Cartrack Technologies Asia Pte. Ltd UAE 100.00 100.00 –
Cartrack Technologies PHL.INC Cartrack Technologies Asia Pte. Ltd Philippines 51.00 51.00 –
Cartrack Technologies South East Asia Pte. Ltd Cartrack Technologies Asia Pte. Ltd Singapore 100.00 100.00 100.00
Cartrack Technologies (Thailand) Company Ltd Cartrack Technologies Asia Pte. Ltd Thailand 100.00 100.00 –
Cartrack Limitada Cartrack (Pty) Ltd Mozambique 50.00 50.00 50.00
Cartrack Polska.SP.ZO.O Cartrack (Pty) Ltd Poland 90.91 90.91 100.00
Cartrack Fleet Management (Pty) Ltd Cartrack (Pty) Ltd South Africa 74.00 74.00 74.00
Cartrack North East (Pty) Ltd Cartrack (Pty) Ltd South Africa 75.50 75.50 50.50
Combined Telematic Services (Pty) Ltd Cartrack (Pty) Ltd South Africa 49.00 49.00 100.00
Plexique (Pty) Ltd Cartrack (Pty) Ltd South Africa 100.00 100.00 100.00
Zonke Bonke Telecoms (Pty) Ltd Cartrack (Pty) Ltd South Africa 100.00 100.00 100.00
Cartrack Europe SGPS, S.A. Cartrack Investments UK Ltd Portugal 100.00 100.00 –
Cartrack Capital SGPS, S.A. Cartrack Investments UK Ltd Portugal 100.00 100.00 –
Cartrack – Sistema de Controlo e Identificacoa de Veiculos, S.A Cartrack Europe SGPS, S.A. Portugal 100.00 100.00 –
Cartrack Espana, S.L Cartrack Europe SGPS, S..A Spain 100.00 100.00 –

36 CartraCk Consolidated annual financial statements 2016
Notes to the CoNsolidated aNNual FiNaNCial statemeNts (continued)
9. LOANS TO RELATED PARTIES
Figures in Rand thousand 2016 2015 2014
Holding companyOnecell Holdings (Pty) Ltd
This loan is unsecured, bears no interest and has no fixed terms of repayment. – (29) –
– (29) –
SubsidiariesCartrack Technologies Asia Pte. Ltd – – (730)
This loan is unsecured, bears no interest and has no fixed terms of repayment.
Cartrack Polska SP. ZO.O – – 5 656
This loan is unsecured, bears no interest and has no fixed terms of repayment.
Cartrack Engineering Technologies Ltd – – 943
This loan is unsecured, bears no interest and has no fixed terms of repayment.
Retriever Rwanda Limited – – 183
This loan is unsecured, bears no interest and has no fixed terms of repayment.
– – 6 052
Related partiesA.H. Nyimbo (1 478) (960) –
This loan is unsecured, bears no interest and has no fixed terms of repayment.
P. Lim – (245) –
This loan is unsecured, bears no interest and has no fixed terms of repayment. – – 3 811
S.M. Machel Jr
This loan is unsecured, bears no interest and has no fixed terms of repayment.
Pro-Fit Fitment Centre (Pty) Ltd 1 624 1 623 5
This loan is unsecured, bears no interest and has no fixed terms of repayment.
Garoca Management Services (Pty) Ltd – – 20 300
This loan is unsecured, bears no interest and has no fixed terms of repayment.
Cartrack Education Fund (Non Profit Company) – 1 573 2 075
This loan is unsecured, bears no interest and has no fixed terms of repayment.
Onecell Community Services (Pty) Ltd – 2 066 2 066
This loan is unsecured, bears no interest and has no fixed terms of repayment.
Onecell Community Phones (Pty) Ltd – – (7)
This loan is unsecured, bears no interest and has no fixed terms of repayment.
146 4 057 28 250
Current assets 1 624 5 263 35 040
Current liabilities (1 478) (1 235) (738)
146 4 028 34 302
10. TRADE AND OTHER RECEIVABLES
Trade receivables 126 272 73 285 41 373
Impairment of trade receivables (19 509) (6 649) (4 552)
106 763 66 636 36 821
Prepayments 12 031 7 836 14 083
Deposits 4 616 827 621
Sundry Debtors 3 512 5 681 4 367
Vat Receivable 1 733 725 12
128 655 81 705 55 904

CartraCk Consolidated annual financial statements 2016 2016 37
10. TRADE AND OTHER RECEIVABLES (continued)
Credit quality of trade and other receivables
The credit quality of trade and other receivables can be assessed by reference to historical information. Significant financial difficulties of the debtor, probability that the debtor will enter bankruptcy, legal handover, financial reorganisation and default or delinquency in payments (more than 30 days overdue) are considered indicators that the trade receivable is impaired.
Figures in Rand thousand 2016 2015 2014
Trade receivables not impaired
The ageing of amounts not impaired is as follows:
Not past due 58 991 49 039 29 609
1 month past due 15 719 6 540 1 242
2 months past due 11 412 3 976 970
3 months past due 20 641 7 081 5 000
106 763 66 636 36 821
Reconciliation of allowance for impairment of trade and other receivables
Opening balance (6 649) (4 552) (4 219)
Allowance for impairment (13 180) (2 097) (333)
Amounts utilised 320 – –
(19 509) (6 649) (4 552)
The Rand equivalent carrying amounts of trade and other receivables are denominated in the following currencies:
Rand 45 586 34 627 37 417
Singapore dollar 6 994 3 380 2 233
Mozambique Metical 28 586 18 156 2 372
Euro 13 155 8 792 –
Nigerian Naira 5 295 1 056 –
Kenyan Shillings 8 963 6 419 4 876
Tanzanian Shillings 8 868 6 499 5 953
Polish Zloty 6 428 937 2 663
Other 4 780 1 839 390
Total 128 655 81 705 55 904
The creation and release of allowances for impaired receivables have been included in operating expenses.
11. CASH AND CASH EqUIVALENTS
Cash and cash equivalents consist of:
Cash on hand 326 92 312
Bank balances 41 943 46 698 23 388
Short-term deposits 2 912 63 257 17 957
Bank overdraft (187) (114) –
44 994 109 933 41 657
Current assets 45 181 110 047 41 657
Current liabilities (187) (114) –
44 994 109 933 41 657
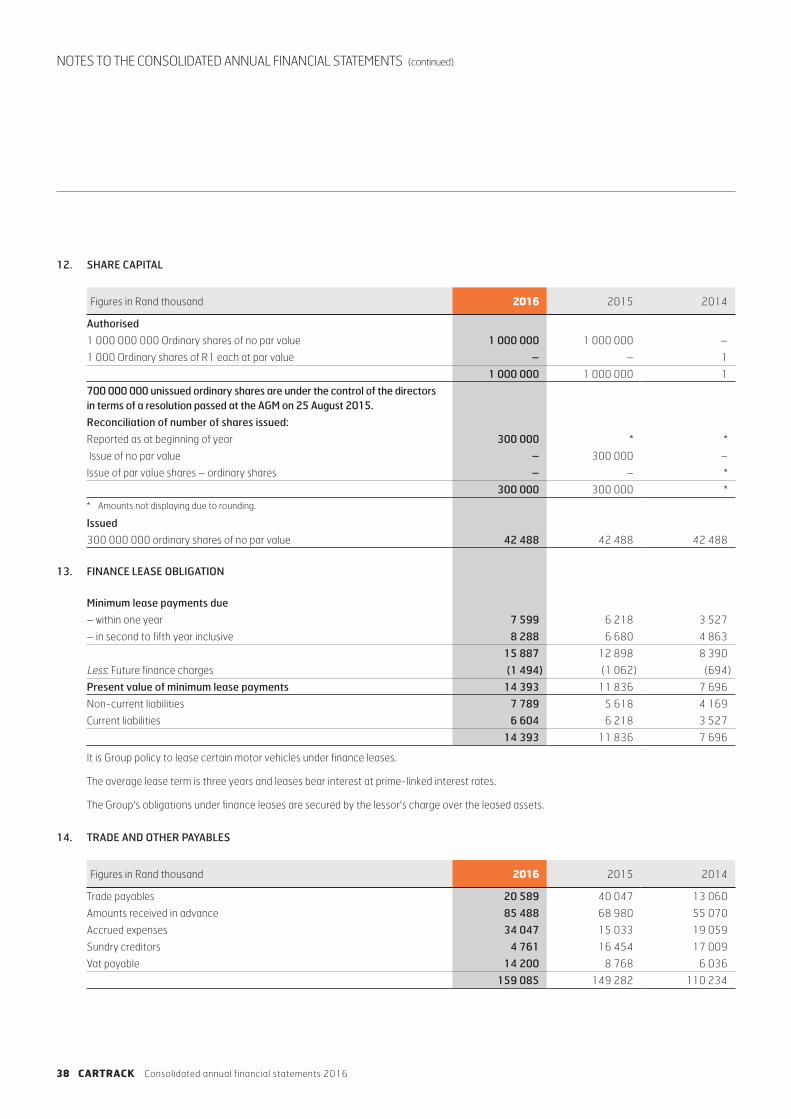
38 CartraCk Consolidated annual financial statements 2016
Notes to the CoNsolidated aNNual FiNaNCial statemeNts (continued)
12. SHARE CAPITAL
Figures in Rand thousand 2016 2015 2014
Authorised
1 000 000 000 Ordinary shares of no par value 1 000 000 1 000 000 –
1 000 Ordinary shares of R1 each at par value – – 1
1 000 000 1 000 000 1
700 000 000 unissued ordinary shares are under the control of the directors in terms of a resolution passed at the AGM on 25 August 2015.
Reconciliation of number of shares issued:
Reported as at beginning of year 300 000 * *
Issue of no par value – 300 000 –
Issue of par value shares – ordinary shares – – *
300 000 300 000 ** Amounts not displaying due to rounding.
Issued
300 000 000 ordinary shares of no par value 42 488 42 488 42 488
13. FINANCE LEASE OBLIGATION
Minimum lease payments due
– within one year 7 599 6 218 3 527
– in second to fifth year inclusive 8 288 6 680 4 863
15 887 12 898 8 390
Less: Future finance charges (1 494) (1 062) (694)
Present value of minimum lease payments 14 393 11 836 7 696
Non-current liabilities 7 789 5 618 4 169
Current liabilities 6 604 6 218 3 527
14 393 11 836 7 696
It is Group policy to lease certain motor vehicles under finance leases.
The average lease term is three years and leases bear interest at prime-linked interest rates.
The Group's obligations under finance leases are secured by the lessor's charge over the leased assets.
14. TRADE AND OTHER PAYABLES
Figures in Rand thousand 2016 2015 2014
Trade payables 20 589 40 047 13 060
Amounts received in advance 85 488 68 980 55 070
Accrued expenses 34 047 15 033 19 059
Sundry creditors 4 761 16 454 17 009
Vat payable 14 200 8 768 6 036
159 085 149 282 110 234

CartraCk Consolidated annual financial statements 2016 2016 39
15. SHARE BASED PAYMENTS
Number of shares
Weighted average
purchase price(Rands)
Total value R’000
Treasury shares acquired (equivalent notional units available for allocation to beneficiaries of the Executive Share Incentive Scheme)
1 234 000 9.81 12 105
Notional units allocated 869 000 – –
Balance of units available for allocation 365 000 – –
– Refer to note 1.16 for additional information on the share incentive scheme.
The share based payment liability is R 4 010 499 (2015: R Nil).
16. REVENUE
Figures in Rand thousand 2016 2015 2014
Sale of hardware 147 360 130 685 160 542
Subscription revenue 842 095 702 267 467 394
Rental income – – 10
Sundry sales 16 026 1 843 4 811
1 005 481 834 795 632 757
17. OPERATING PROFIT
Operating profit for the year is stated after accounting for the following:
Operating lease chargesPremises• Lease charges 23 068 15 007 8 610
Motor vehicles• Lease charges 5 844 2 913 2 686
Equipment• Lease charges – 14 2
28 912 17 934 11 298
Profit on sale of property, plant and equipment 1 019 738 833
Net operating foreign exchange gain 11 332 433 –
Depreciation on property, plant and equipment 102 660 71 597 42 131
Employee costs 255 557 209 119 148 348
18. INVESTMENT REVENUE
Interest income
Bank 6 256 4 533 1 742
19. NET NON-OPERATING FOREIGN ExCHANGE GAIN
Net gain 15 667 – –
Net foreign exchange gain comprises: R20 649 015 gain on settlement of intercompany loan to Cartrack Asia Pte. Limited due to the depreciation of the Rand against the Singapore Dollar and exchange losses on other intercompany loans totalling R4 982 370.

40 CartraCk Consolidated annual financial statements 2016
Notes to the CoNsolidated aNNual FiNaNCial statemeNts (continued)
20. FINANCE COSTS
Figures in Rand thousand 2016 2015 2014
Finance leases 961 564 472
Bank 3 502 360 739
4 463 924 1 211
21. TAxATION
Major components of the tax expense
Current
Local income tax – current period 114 547 91 313 72 734
Local income tax – prior period 1 434 – –
115 981 91 313 72 734
Deferred
Deferred tax (10 060) (5 667) (26)
Deferred tax – prior period (3 142) – –
(13 202) (5 667) (26)
102 779 85 646 72 708
Reconciliation of the tax expense
Reconciliation between accounting profit and tax expense
Accounting profit 362 266 293 614 254 393
Tax at the applicable tax rate of 28% (2015: 28%; 2014: 28%) 101 434 82 212 71 230
Tax effect of adjustments on taxable income
Utilisation of previously unrecognised tax losses (1 311) 3 160 –
Foreign tax differential (2 452) 2 249 1 302
Non-taxable income (4 064) (3 223) (298)
Non-deductible expenses 8 756 1 248 474
Current year losses for which no deferred tax asset is recognised 2 124 – –
Prior year deferred tax adjustment (3 142) – –
Prior year income tax adjustment 1 434 – –
102 779 85 646 72 708
The income tax rate for the subsidiaries in South Africa is 28% and the foreign owned subsidiaries are taxed at the tax rate applicable in their countries.
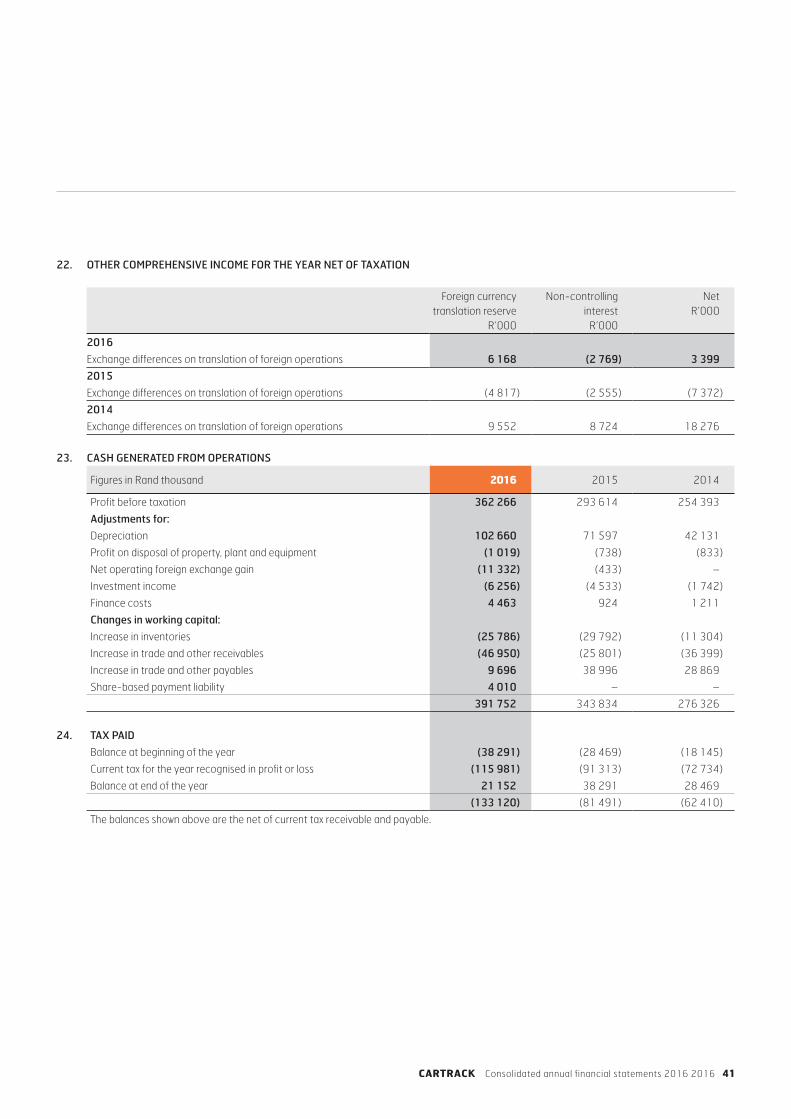
CartraCk Consolidated annual financial statements 2016 2016 41
22. OTHER COMPREHENSIVE INCOME FOR THE YEAR NET OF TAxATION
Foreign currencytranslation reserve
R’000
Non-controllinginterest
R’000
NetR’000
2016
Exchange differences on translation of foreign operations 6 168 (2 769) 3 399
2015
Exchange differences on translation of foreign operations (4 817) (2 555) (7 372)
2014
Exchange differences on translation of foreign operations 9 552 8 724 18 276
23. CASH GENERATED FROM OPERATIONS
Figures in Rand thousand 2016 2015 2014
Profit before taxation 362 266 293 614 254 393
Adjustments for:
Depreciation 102 660 71 597 42 131
Profit on disposal of property, plant and equipment (1 019) (738) (833)
Net operating foreign exchange gain (11 332) (433) –
Investment income (6 256) (4 533) (1 742)
Finance costs 4 463 924 1 211
Changes in working capital:
Increase in inventories (25 786) (29 792) (11 304)
Increase in trade and other receivables (46 950) (25 801) (36 399)
Increase in trade and other payables 9 696 38 996 28 869
Share-based payment liability 4 010 – –
391 752 343 834 276 326
24. TAx PAID
Balance at beginning of the year (38 291) (28 469) (18 145)
Current tax for the year recognised in profit or loss (115 981) (91 313) (72 734)
Balance at end of the year 21 152 38 291 28 469
(133 120) (81 491) (62 410)
The balances shown above are the net of current tax receivable and payable.

42 CartraCk Consolidated annual financial statements 2016
Notes to the CoNsolidated aNNual FiNaNCial statemeNts (continued)
25. BUSINESS COMBINATIONS
Business combinations occurring during the current year
Immaterial Business Combinations occurring during the February 2016 year-end
On 1 March 2015, the Group acquired 100% of the shares in Cartrack Manufacturing (Pty) Limited (previously Onecell Manufacturing (Pty) Limited) from Onecell Holdings (Pty) Limited for a cash consideration. The Group acquired this company in order to manage and control the procurement and manufacture of its products.
On 1 March 2015, the Group acquired 100% of the shares in Cartrack Management Services (Pty) Limited (previously Bonito Recruitment Services (Pty) Limited) from Onecell Holdings (Pty) Limited for a cash consideration. The Group acquired this dormant company in order to account separately for Group management services and related costs from within the Group.
The acquisitions detailed above are immatrerial in aggregate.
Immaterial Business Combinations ocurring during the February 2015 year-end
In May 2014, the Group acquired 60% of the shares in Retriever Rwanda Limited from AH Nyimbo for a cash consideration, to increase its footprint in Africa.
In August 2014, the Group acquired 100% of the shares in Cartrack Technologies (Pty) Limited (previously Onecell Technologies (Pty) Limited) from Onecell Holdings (Pty) Limited for a cash consideration. The Group acquired this entity for the development of technologies in the industry.
Material Business Combinations ocurring during the February 2015 year-end
In March 2014, the Group acquired 100% of the shares in Cartrack – Sistema de Controlo e ldentificacoa de Veiculos S.A, Cartrack Espana S.L, Cartrack Europe SGPS, Cartrack Capital SGPS, and Cartrack Investments UK Limited from JMV Matias for a consideration of R46 223 160. The Group acquired these entities to obtain a global footprint in Europe. The acquisition has been accounted for using the acquisition method. The goodwill recognised is primarily attributed to the expected synergies from combining the assets and activities of the European acquisitions with those of the Group and to the economies of scale to be achieved through future growth.
Figures in Rand thousand 2016 2015 2014
Fair value of assets acquired and liabilities assumedProperty, plant and equipment – 1 645 8 229
Loan receivable – 59 636 267
Investments in subsidiaries – 12 635 –
Inventories – 3 016 –
Trade and other receivables – 20 625 1 120
Borrowings – (78 682) –
Trade and other payables – (16 260) –
Tax liabilities – (1 072) (415)
Prepayments – – 182
Borrowings – – (5 808)
Cash – 736 4 076
Deferred income – – (2 167)
Discount on bargain purchase – – (3 353)
Outside shareholders – (1 097) (3 083)
Goodwill – 45 041 2 662
Cash consideration paid – 46 223 1 710
Net cash outflow on acquistionCash consideration paid – (46 223) (1 710)
Cash acquired – 736 4 077
– (45 487) 2 367
Immaterial business combinations (15) (7 941) –
(15) (53 428) 2 367

CartraCk Consolidated annual financial statements 2016 2016 43
26. RELATED PARTIES
Relationships
Ultimate holding company Madeira Calisto Family Holdings (Pty) Ltd
Holding company Onecell Holdings (Pty) Ltd
Related Parties Onecell Community Phones (Pty) Ltd
Onecell Community Services (Pty) Ltd
Onecell Data Solutions (Pty) Ltd
Onecell Namibia (Pty) Ltd
Purple Rain Properties No. 444 (Pty) Ltd
Onecell (Pty) Ltd
Cartrack Education Fund (NPO)
AH Nyimbo (shareholder)
J Marais (shareholder)
P Lim (shareholder)
SM Machel Jr. (shareholder)
Subsidiary companies Cartrack (Pty) Ltd
Retriever Limited
Cartrack Tanzania Ltd
Retriever Rwanda Ltd
Cartrack Engineering Technologies Ltd
Cartrack Namibia (Pty) Ltd
Cartrack Technologies (Pty) Ltd
Cartrack Technologies Asia Pte. Ltd
Cartrack Management Services (Pty) Ltd
Cartrack Manufacturing (Pty) Ltd
Cartrack North East (Pty) Ltd
Cartrack Limitada
Cartrack Polska.SP.ZO.O
Cartrack Fleet Management (Pty) Ltd
Zonke Bonke Telecoms (Pty) Ltd
Plexique (Pty) Ltd
Combined Telematics Services (Pty) Ltd
Cartrack Investments UK Ltd
Cartrack Malaysia SDN.BHD
Cartrack Technologies PHL.INC
Cartrack Technologies South East Asia Pte. Ltd
Cartrack Technologies (China) Ltd
Cartrack Europe SGPS, S.A.
Cartrack Capital SGPS, S.A.
Cartrack Espana, S.L.
Cartrack – Sistema de Controlo e Identificacao de Veiculos, S.A.
PT. Cartrack Technologies Indonesia
Cartrack Technologies (Thailand) Company Ltd
Cartrack Technologies LLC

44 CartraCk Consolidated annual financial statements 2016
Notes to the CoNsolidated aNNual FiNaNCial statemeNts (continued)
26. RELATED PARTIES (continued)
Relationships (continued)
Related by virtue of control Pro-Fit Fitment Centre (Pty) Ltd
Members of key management IJ Calisto
JR Edmeston
J Marais
C Sanderson
R Schubert
DJ Brown
AT Ikalafeng
K White
Figures in Rand thousand 2016 2015 2014
Related party balances
Loan accounts – owing (to) by related parties
AH Nyimbo (1 478) (960) –
Cartrack Education Fund (Non Profit Company) – 1 573 2 075
Cartrack Engineering Technologies Ltd – – 943
Cartrack Polska.SP.ZO.O – – 5 656
Cartrack Technologies Asia Pte. Ltd – – (730)
Garoca Management Services (Pty) Ltd – – 20 300
Onecell Community Phones (Pty) Ltd – – (7)
Onecell Community Services (Pty) Ltd – 2 066 2 066
Onecell Holdings (Pty) Ltd – (29) –
P Lim – (245) –
Pro-Fit Fitment Centre (Pty) Ltd 1 624 1 623 5
SM Machel Jr. – – 3 811
Retriever Rwanda Limited – – 183
146 4 028 34 302
Current asets 1 624 5 263 35 040
Current liabilities (1 478) (1 235) (738)
146 4 028 34 302

CartraCk Consolidated annual financial statements 2016 2016 45
26. RELATED PARTIES (continued)
Figures in Rand thousand 2016 2015 2014
Amounts included in Trade receivable (Trade Payable) regarding related parties
Cartrack Technologies (Pty) Ltd – – 1
Onecell (Pty) Ltd 3 729 852 28
Onecell Manufacturing (Pty) Ltd* – 1 692 8
Onecell Data Solutions (Pty) Ltd – 386 –
Pro-Fit Fitment Centre (Pty) Ltd 2 486 – –
Onecell Holdings (Pty) Ltd (115) (4 731) (70)
Cartrack Technologies (Pty) Ltd – – (1 121)
Pro-Fit Fitment Centre (Pty) Ltd (79) – –
Onecell (Pty) Ltd (31) (35) (30)
Onecell Manufacturing (Pty) Ltd* – (14 179) (409)
Onecell Community Phones (Pty) Ltd – (389) (200)
Onecell Data Solutions (Pty) Ltd – (263) (629)
Bonito Recruitment Services (Pty) Ltd** – (3) (35)
Onecell Community Services (Pty) Ltd (275) – –
Purple Rain Properties No. 444 (Pty) Ltd (137) – –
5 578 (16 670) (2 457)
Related party transactions
Sales to related parties
Onecell Holdings (Pty) Ltd (17) (350) (25)
Cartrack Technologies (Pty) Ltd – (4 373) (17)
Onecell (Pty) Ltd (18 066) (10 081) (186)
Onecell Manufacturing (Pty) Ltd* – (7 325) (48)
Onecell Community Phones (Pty) Ltd – – (186)
Bonito Recruitment Services (Pty) Ltd – – (5)
Onecell Data Solutions (Pty) Ltd – (461) (40)
Pro-Fit Fitment Centre (Pty) Ltd (2 546) – (151)
Purchases from related parties
Onecell Holdings (Pty) Ltd 1 318 6 702 5 960
Cartrack Technologies (Pty) Ltd – 4 373 11 708
Onecell (Pty) Ltd 311 467 401
Onecell Manufacturing (Pty) Ltd* – 109 219 88 240
Bonito Recruitment Services (Pty) Ltd** – 26 624
Onecell Data Solutions (Pty) Ltd – 231 3 914
Onecell Community Services (Pty) Ltd 1 759 1 372 1 685
Pro-Fit Fitment Centre (Pty) Ltd 2 998 1 617 5
Rent paid to (received from) related parties
Purple Rain Properties No. 444 (Pty) Ltd 4 236 3 819 2 220
Administration fees paid to (received from) related parties
Onecell Holdings (Pty) Ltd – 1 890 4 446* Cartrack Manufacturing (Pty) Ltd (previously Onecell Manufacturing (Pty) Ltd) was acquired by the Group on 1 March 2015 Refer to note 25.
** Cartrack Management Services (Pty) Ltd (previously Bonito Recruitment Services (Pty) Ltd) was acquired by the Group on 1 March 2015. Refer to note 25.

46 CartraCk Consolidated annual financial statements 2016
Notes to the CoNsolidated aNNual FiNaNCial statemeNts (continued)
27. RISK MANAGEMENT
Capital risk management
The Group’s objectives when managing capital are to safeguard the Group’s ability to continue as a going concern in order to provide returns for shareholders and benefits for other stakeholders and to maintain an optimal capital structure to reduce the cost of capital.
The capital structure of the Group consists of debt, which includes the borrowings (excluding derivative financial liabilities) disclosed in notes 9 and 13, cash and cash equivalents disclosed in note 11, and equity as disclosed in the consolidated statement of financial position.
In order to maintain or adjust the capital structure, the Group may adjust the amount of dividends paid to shareholders, return capital to shareholders, issue new shares or sell assets to reduce debt.
There are no externally imposed capital requirements.
Financial risk management
The Group’s activities expose it to a variety of financial risks: market risk (including currency risk, fair value interest rate risk, cash flow interest rate risk and price risk), credit risk and liquidity risk.
Liquidity risk
Prudent liquidity risk management implies maintaining sufficient cash and marketable securities, the availability of funding through an adequate amount of committed credit facilities and the ability to close out market positions. Due to the dynamic nature of the underlying businesses, Group treasury maintains flexibility in funding by maintaining availability under committed credit lines.
The Group’s liquidity risk is a result of the funds available to cover future commitments. The Group manages liquidity risk through an ongoing review of future commitments and credit facilities.
Cash flow forecasts are prepared and adequate utilised borrowing facilities are monitored.
The table below analyses the Group’s financial liabilities and relevant maturity groupings based on the remaining period at the consolidated statement of financial position to the contractual maturity date. The amounts disclosed in the table are the contractual undiscounted cash flows. Balances due within 12 months equal their carrying balances.
Figures in Rand thousandLess than
1yearBetween 1
and 5 years
At 29 February 2016
Finance lease obligation 6 604 7 789
Trade and other payables 144 885 –
Loans from Group companies 1 478 –
Bank overdraft 187 –
At 28 February 2015
Finance lease obligation 6 218 5 618
Trade and other payables 140 514 –
Loans from Group companies 1 235 –
Bank overdraft 114 –
At 28 February 2014
Finance lease obligation 3 527 4 169
Trade and other payables 104 198 –
Loans from Group companies 738 –

CartraCk Consolidated annual financial statements 2016 2016 47
27. Risk management (continued)
Interest rate risk
As the Group has no significant interest-bearing assets, the Group’s income and operating cash flows are substantially independent of changes in market interest rates.
Credit risk
Credit risk is managed on a Group basis.
Credit risk consists mainly of cash deposits, cash equivalents and trade debtors. The Group only deposits cash with major banks with high-quality credit standing and limits exposure to any one counter-party.
Trade receivables comprise a widespread customer base. Management evaluates credit risk relating to customers on an ongoing basis. If customers are independently rated, these ratings are used. Otherwise, if there is no independent rating, risk control assesses the credit quality of the customer, taking into account its financial position, past experience and other factors. Individual risk limits are set based on internal or external ratings in accordance with limits set by management. The utilisation of credit limits is regularly monitored. Sales to retail customers are settled in cash or using major credit cards.
Foreign exchange risk
The Group operates internationally and is exposed to foreign exchange risk arising from various currency exposures, primarily with respect to the US Dollar, Euro, Mozambican Metical and the Singapore Dollar. Foreign exchange risk arises from future commercial transactions, recognised assets and liabilities and net investments in foreign operations.
The Group does not hedge foreign exchange fluctuations.
At 29 February 2016, the Rand has weakened against the Singapore Dollar (14%), US Dollar (16%), Euro (14%) and has strengthened against the Mozambican Metical (3%) as compared to the previous year.
Since year-end the Mozambican Metical has further depreciated by 14% against the Rand and remains highly volatile.
The foreign currency exposure within trade payables is listed below. Foreign currency exposure within trade receivables is set out in note 10.
Major foreign currency exposure at the end of the reporting period
Figures in Rand thousand 2016 2015 2014
Liabilities
Trade payables EUR (962) (486) –
Trade payables SGD (336) (144) (245)
Trade payables MZN (5 582) (8 413) (9 803)
Sensitivity analysis
A reasonably possible strengthening/weakening of the Rand against the Euro, Singapore Dollar and Mozambican Metical at the 29 February 2016 would have affected the measurement of financial instruments denominated in a foreign currency and affected equity and profit or loss by the amounts shown below. The analysis assumes that all other variables remain constant and ignores any impact on sales and purchases.
Profit or (loss) after tax
Figures in Rand thousandExchange
rate movementStrengthening
of ZARWeakening
of ZAR
EUR 10 % (557) 557
SGD 10 % (2 122) 2 122
MZN 10 % (3 347) 3 347
(6 026) 6 026

48 CartraCk Consolidated annual financial statements 2016
Notes to the CoNsolidated aNNual FiNaNCial statemeNts (continued)
28. DIRECTORS' AND KEY MANAGEMENT EMOLUMENTS
Emoluments BonusesOther
benefitsProvident
fundDirectors'
fees Total
29 February 2016
Directors
IJ Calisto (Executive) 2 852 160 – – – 3 012
JR Edmeston (Executive) 1 872 1 370 102 – – 3 344
DJ Brown (Non-executive) – – – – 957 957
AT Ikalafeng (Non-executive) – – – – 540 540
K White (Non-executive) – – – – 531 531
Key management
Paid by subsidiary companies 3 956 689 120 120 – 4 885
8 680 2 219 222 120 2 028 13 269
28 February 2015
Directors
IJ Calisto (Executive) 1 712 160 – – – 1 872
JR Edmeston (Executive) 1 758 1 387 96 – – 3 241
J Marais (Executive) 1 452 131 120 – – 1 703
C Sanderson (Executive) 1 017 211 – 53 – 1 281
DJ Brown (Non-executive) – – – – 319 319
AT Ikalafeng (Non-executive) – – – – 189 189
K White (Non-executive) – – – – 168 168
5 939 1 889 216 53 676 8 773
28 February 2014
Directors
JR Edmeston (Executive) 1 654 1 115 96 – – 2 865
J Marais (Executive) 1 363 114 120 – – 1 597
C Sanderson (Executive) 720 47 – – – 767
3 737 1 276 216 – – 5 229
Directors and Key Management emoluments are paid for through subsidiary companies of the Group.

CartraCk Consolidated annual financial statements 2016 2016 49
29. BASIC EARNINGS PER SHARE
Figures in Rand thousand 2016 2015 2014
Basic earnings per share (cents) 80 64 59
The calculation of basic earnings per share has been based on the following profit attributable to ordinary shareholders and the weighted average number of ordinary shares in issue.
Weighted average number of ordinary shares (‘000) at the beginning of the year 300 000 300 000 –
Issued ordinary shares at 1 March 2013 – – 211 268
Effect of shares issued in April 2013 – – 78 279
Effect of treasury shares (51) – –
299 949 300 000 289 547
Basic earnings 239 674 191 811 170 764
In 2014 and 2015 the 300 000 000 shares in issue, weighted accordingly, were treated as a share split for earnings per share purposes. This provides the user with more comparable and relevant information.
30. HEADLINE EARNINGS PER SHARE
Headline earnings per share (cents) 81 64 58
The calculation of headline earnings per share has been based on the following profit attributable to ordinary shareholders computed in terms of note 1.13 and the weighted average number of ordinary shares in issue as determined above in note 29.
Reconciliation between basic earnings and headline earnings
Basic earnings 239 674 191 811 170 764
Adjusted for:
Reversal of bargain purchase 3 279 – –
Bargain purchase – – (3 353)
Gain on disposal of assets net of tax (1 019) (738) (833)
241 934 191 073 166 578
31. DILUTED EARNINGS PER SHARE
There are no dilutive instruments and therefore diluted earnings per share is the same as basic earnings per share.
32. NORMALISED EARNINGS PER SHARE
Normalised earnings per share (cents) 75 64 58
The calculation of normalised earnings per share has been based on the profit computed in terms of note 1.13 attributable to ordinary shareholders and the weighted average number of ordinary shares in issue as determined above in note 29 .
Reconciliation between headline earnings and normalised earnings
Headline earnings 241 934 191 073 166 578
Net foreign exchange gain on intercompany financing arrangements (15 667) – –
226 267 191 073 166 578

50 CartraCk Consolidated annual financial statements 2016
Notes to the CoNsolidated aNNual FiNaNCial statemeNts (continued)
33. COMMITMENTS
Figures in Rand thousand 2016 2015 2014
Operating leases – as lessee (expense)
Minimum lease payments due
– within one year 8 404 11 838 8 177
– in second to fifth year inclusive 17 721 17 994 7 351
26 125 29 832 15 528
Operating lease payments represent rentals payable by the Group for certain of its office premises. Leases are negotiated for an average term of three to five years. No contingent rent is payable.
Mercantile Bank Limited has provided a facility of R40 million (2015: R NIL) to Cartrack Manufacturing (Pty) Limited. Cartrack (Pty) Limited has provided limited suretyship in favour of Mercantile Bank Limited for this facility. At the end of the year, the amount utilised was R NIL (2015: R NIL).
Nedbank Limited has provided a facility of R5 million to Plexique (Pty) Limited. Cartrack (Pty) Limited has provided a limited guarantee for the facility in favour of Nedbank Limited. At the end of the year, the amount utilised was R1 124 398.
The Private Security Industry Regulatory Authority (“PSIRA”) requires the directors of Cartrack North East (Pty) Limited (“the directors”) to provide a suretyship for due payment of any amounts due to the PSIRA pursuant to registration with PSIRA in terms of the Private Security Industry Regulation Act, No 56 of 2001. Cartrack (Pty) Limited has provided an indemnity to the directors, limited to an amount of R20 000 (2015: R NIL), which indemnity will be reviewed on an annual basis.
Cartrack Investments UK Limited has provided Cartrack Espana, S.L with a loan in the amount of Euro 1 392 486 (2015: Euro 1 392 486) (“the Loan”). Cartrack Technologies Asia Pte.Limited has provided Cartrack Investments UK Limited with a guarantee for repayment of the Loan.
Cartrack Manufacturing (Pty) Limited has a forward exchange contract in the amount of R5 740 000 (2015: R NIL) which expires on 25 September 2016.
Cartrack North East (Pty) Limited has provided guarantees to:
Figures in Rands R
Accelerate Property Fund Ltd 76 500
FPG Holdings (Pty) Ltd 250 000
Janco Property Investments CC 32 729
SA Post Office Ltd 30 000
Vodacom Service Provider Company 450 000

CartraCk Consolidated annual financial statements 2016 2016 51
34. SEGMENT REPORTING
The Group is organised into geographical business units and has four reportable segments. The Group monitors the operating results of its business units separately for the purpose of making decisions about resource allocation and performance assessment. Segment information is evaluated based on revenue and profit or loss and is measured consistently with consolidated financial statements.
South AfricaAfrica –
Other EuropeAsia & Middle
East Total
Segment Report – 29 February 2016
Revenue 748 600 139 198 90 036 27 647 1 005 481
Intersegment elimination of revenue* 195 551 271 841 1 899 198 562
Revenue before segment elimination 944 151 139 469 90 877 29 546 1 204 043
Profit before taxation includes the following items: 274 711 60 110 23 477 3 968 362 266
Investment revenue 2 987 3 268 – 1 6 256
Finance costs 4 360 10 78 15 4 463
Net foreign exchange gain** 2 830 3 891 498 19 780 26 999
Depreciation 79 692 2 317 18 657 1 994 102 660
Total tangible assets 188 102 79 049 83 273 160 905 511 329
Total liabilities (84 377) (54 544) (53 355) (14 569) (206 845)
Goodwill 156 011
Equity 460 495
Segment Report – 28 February 2015
Revenue 628 547 114 002 80 422 11 824 834 795
Intersegment elimination of revenue 34 974 – – – 34 974
Revenue before segment elimination 663 521 114 002 80 422 11 824 869 769
Profit before taxation includes the following items: 238 358 46 499 15 835 (7 078) 293 614
Investment revenue 1 617 2 916 – – 4 533
Finance costs 693 210 8 13 924
Net foreign exchange gain** 35 307 8 83 433
Depreciation 58 816 1 917 10 389 475 71 597
Total tangible assets 291 359 88 837 36 605 14 135 430 936
Total liabilities (134 009) (49 060) (13 097) (5 277) (201 443)
Goodwill 144 269
Equity 373 762* The amount of R195 551 in the South African segment includes Cartrack Manufacturing (Pty) Ltd which was acquired on 1 March 2015.
** This amount includes both operating and non-operating net foreign exchange gains (Refer note 17 and 19).

52 CartraCk Consolidated annual financial statements 2016
Notes to the CoNsolidated aNNual FiNaNCial statemeNts (continued)
35. COMPARATIVE FIGURES
Certain comparative figures have been reclassified from operating expenses to cost of sales to provide an appropriate allocation of expenses that directly relate to cost of sales.
The effect of the reclassifications is as follows:
Figures in Rand thousand 2015 2014
Profit or loss
Cost of sales 10 544 6 579
Operating expenses (10 544) (6 579)
– –
Certain comparative figures have been reclassified from other income to foreign exchange gains.
The effect of the reclassifications is as follows:
Profit and loss
Other income (433) –
Foreign exchange gains 433 –
– –

CartraCk Consolidated annual financial statements 2016 2016 53
36. FINANCIAL INSTRUMENTS – FAIR VALUES AND RISK MANAGEMENT
The following table shows the carrying amounts and fair value of financial assets and financial liabilities, including their levels in the fair value hierarchy.
Carrying amount Fair value
R ‘000 NotesLoans and
receivables
Non-financial
instruments Total Level 1 Level 2 Level 3 Total
29 February 2016
Financial assets
Loans to related parties 9 1 624 – 1 624 – – 1 624 1 624
Trade and other receivables 10 114 891 13 764 128 655 – – 128 655 128 655
Cash and cash equivalents 11 45 181 – 45 181 45 181 – – 45 181
161 696 13 764 175 460 45 181 – 130 297 175 460
Financial liabilities
Loans from related parties 9 1 478 – 1 478 – – 1 478 1 478
Finance lease obligation 13 14 393 – 14 393 – 14 393 – 14 393
Trade and other payables 14 144 885 14 200 159 085 – – 159 085 159 085
Bank overdraft 11 187 – 187 187 – – 187
160 943 14 200 175 143 187 14 393 160 563 175 143
28 February 2015
Financial assets
Loans to related parties 9 5 263 – 5 263 – – 5 263 5 263
Trade and other receivables 10 73 144 8 561 81 705 – – 81 705 81 705
Cash and cash equivalents 11 110 047 – 110 047 110 047 – – 110 047
188 454 8 561 197 015 110 047 – 86 968 197 015
Financial liabilities
Loans from related parties 9 1 235 – 1 235 – – 1 253 1 235
Finance lease obligation 13 11 836 – 11 836 – 11 836 – 11 836
Trade and other payables 14 140 514 8 768 149 282 – – 149 282 149 282
Bank overdraft 11 114 – 114 114 – – 114
153 699 8 768 162 467 114 11 836 150 517 162 467
28 February 2014
Financial assets
Loans to related parties 9 35 040 – 35 040 – – 35 040 35 040
Trade and other receivables 10 41 809 14 095 55 904 – – 55 904 55 904
Cash and cash equivalents 11 41 657 – 41 657 41 657 – – 41 657
118 506 14 095 132 601 41 657 – 90 944 132 601
Financial liabilities
Loans from related parties 9 738 – 738 – – 738 738
Finance lease obligation 13 7 696 – 7 696 – – 7 696 7 696
Trade and other payables 14 104 198 6 036 110 234 – 110 234 110 234
112 632 6 036 118 668 – – 118 668 118 668

54 CartraCk Consolidated annual financial statements 2016
CORPORATE INFORMATION
Legal AdvisorEdward Nathan Sonnenbergs Incorporated 150 West Street Sandton 2196
(PO Box 783347, Sandton, 2146)
Communications AdvisorAprio Strategic Communications 32a Jellicoe Avenue Oxford Corner Rosebank 2196
(PO Box 2436, Northcliff, 2115)
Registered Office of CartrackCartrack Holdings Limited 11 Keyes Avenue Rosebank 2196
(PO Box 4709, Rivonia, 2128)
AuditorsGrant Thornton Chartered Accountants (SA) (Practice number 903485) 137 Daisy Street Sandown 2196
(Private Bag X28, Benmore, 2010)
DirectorsIndependent Non-executive Directors
David Brown (Independent Chairman) Thebe Ikalafeng Kim White
Executive Directors
Isaias Jose Calisto (Global Chief Executive Officer) John Richard Edmeston (Global Chief Financial Officer)
Company SecretaryAnnamè de Villiers Cartrack Corner 11 Keyes Avenue Rosebank Johannesburg 2196
(PO Box 4709, Rivonia, 2128)
SponsorInvestec 2nd Floor 100 Grayston Drive Sandown Sandton 2196
(PO Box 785700, Sandton, 2146)
Transfer SecretaryComputershare Investor Services Proprietary Limited Rosebank Towers 15 Bierman Avenue Rosebank 2196
(PO Box 61051, Marshalltown, 2107)
Company’s bankersFirst National Bank
a division of FirstRand Bank Limited (Registration number 1929/001225/06) 1 First Place Corner Simmonds and Pritchard Streets Johannesburg 2001
(PO Box 1153, Johannesburg 2000)
The Standard Bank of South Africa Limited
(Registration number 1962/000738/06) 9th Floor Standard Bank Centre 5 Simmonds Street Johannesburg Gauteng 2001 South Africa
Nedbank Limited
(Registration number 1951/000009/06) 135 Rivonia Road Sandown Sandton, 2196
(PO Box 1144, Johannesburg, 2000)
Mercantile Bank Limited
(Registration number 1965/006706/06) 142 West Street Sandown Johannesburg 2196
(PO Box 782699, Sandton, 2146)

CartraCk Consolidated annual financial statements 2016 2016 55
NOTES

56 CartraCk Consolidated annual financial statements 2016
NOTES


www.cartrack.co.za