conservation of natural enemies in cotton: role of insect · conservation of natural enemies in...
TRANSCRIPT

Biological Control 30 (2004) 52–72
www.elsevier.com/locate/ybcon
Conservation of natural enemies in cotton: role of insectgrowth regulators in management of Bemisia tabaciq
Steven E. Naranjo,a,* Peter C. Ellsworth,b and James R. Haglera
a USDA-ARS, Western Cotton Research Laboratory, 4135 East Broadway Road, Phoenix, AZ 85040, USAb Department of Entomology, University of Arizona, Maricopa Agricultural Center, 37860 W. Smith-Enke Road, Maricopa, AZ 85239, USA
Received 21 January 2003; accepted 17 September 2003
Abstract
Field studies were conducted from 1997 to 1999 to contrast the effects of two insect growth regulators (IGRs) and conventional
insecticides on natural enemy conservation in cotton within the context of alternative management strategies for Bemisia tabaci
(Gennadius). Compared with an untreated control, insecticide regimes based on the initial use of the IGR buprofezin or pyripr-
oxyfen reduced densities of eight predator taxa out of 20 examined in at least one year, including common species such as Geocoris
punctipes (Say), Nabis alternatus Parshley, Chrysoperla carnea s.l., and the empidid fly Drapetis nr. divergens. Patterns of predator
and pest population change relative to IGR application dates suggest that factors other than direct toxic effects, such as reduction in
prey availability, were likely involved. In comparison, the use of conventional insecticides reduced populations of nearly all the
predatory taxa examined in most years, including those affected by IGRs, with the impact being greater and more immediate in all
cases. Predator:prey ratios were significantly increased by the use of IGRs compared with both the untreated control and a con-
ventional insecticide regime in most instances. The application of conventional insecticides for suppression of Lygus hesperus
Knight, another key pest in the system, in a split-plot design reduced densities of most predator taxa and diminished the selective
advantage of the IGRs. Rates of parasitism by aphelinid parasitoids (Eretmocerus eremicus Rose and Zolnerowich and Encarsia
spp.) were generally low and did not vary consistently due to B. tabaci or L. hesperus insecticide regimes over the three years. Our 3-
year study demonstrates the more selective action of buprofezin and pyriproxyfen in an effective integrated control system for B.
tabaci. The use of these IGRs could further facilitate biologically based management in cotton production systems.
Published by Elsevier Inc.
Keywords: Bemisia tabaci; Bemisia argentifolii; Arthropod predators; Aphelinid parasitoids; IPM; Selective insecticides; Conservation biological
control; Principal response curves
1. Introduction
The potential of biological control to contribute to
pest suppression is limited in many agricultural systems
by the use of insecticides with broad toxicity to both thepest and their natural enemies (Croft, 1990). The inte-
grated control concept formalized by Stern et al. (1959)
recognizes the important contribution of both chemical
and biological control to pest management in agricul-
qThis article presents the results of research only. Mention of a
proprietary product does not constitute endorsement or recommen-
dation for its use by USDA.*Corresponding author. Fax: +602-437-1274.
E-mail address: [email protected] (S.E. Naranjo).
1049-9644/$ - see front matter. Published by Elsevier Inc.
doi:10.1016/j.biocontrol.2003.09.010
tural systems. The fundamental components of this
concept involve the application of insecticides on the
basis of economic thresholds and the use of selective
materials, rates, and/or selective application methods
that minimize impacts on natural enemy populations(Newsom et al., 1976; Stern et al., 1959).
Bemisia tabaci (Gennadius) Biotype B (¼B. argenti-
folii Bellows and Perring) is a cosmopolitan pest of field
and horticultural crops (Oliveira et al., 2001). Since the
early 1990s, B. tabaci has been a key pest of cotton and
vegetable crops in the southern US. In Arizona and
southern California, large populations of B. tabaci de-
velop during summer months in cotton leading to theextensive use of insecticides for whitefly suppression
(Ellsworth and Jones, 2001; Ellsworth and Martinez-
Carrillo, 2001).

S.E. Naranjo et al. / Biological Control 30 (2004) 52–72 53
Although insecticides remain the primary tactic formanaging B. tabaci in cotton and other affected crops
(Palumbo et al., 2001), considerable research has fo-
cused on the development of alternative control tactics,
including the use of biological control (Gerling and
Mayer, 1996; Naranjo and Ellsworth, 2001). Recent
reviews have cataloged 114 species of predatory ar-
thropods, nearly 50 species of parasitoids, and 11 species
of naturally occurring fungi known to be associated withB. tabaci worldwide (Faria and Wraight, 2001; Gerling
et al., 2001). In Arizona alone, over 20 species of ar-
thropod predators prey on B. tabaci on cotton in the
field (Hagler and Naranjo, 1994a,b, unpublished; Ha-
gler, 2002). Several native species of Eretmocerus and
Encarsia parasitize B. tabaci in Arizona and southern
California (Gerling and Naranjo, 1998; Hoelmer, 1996;
Naranjo et al., 2003), and many exotic aphelinid par-asitoids have been introduced into the southwestern US
over the past decade (Hoelmer and Kirk, 1999; Kirk and
Lacey, 1996; Kirk et al., 2001). Life table studies in
unsprayed cotton suggest that natural enemies, espe-
cially predators, can exert high levels of mortality on
immature stages of B. tabaci (Naranjo, 2001; Naranjo
and Ellsworth, unpublished). The effect of these natural
enemies on populations of B. tabaci is not completelyunderstood; however, several studies have documented
resurgence of B. tabaci in cotton with use of broad-
spectrum insecticides (Abdelrahman and Munir, 1989;
Devine et al., 1998).
Management strategies for B. tabaci on cotton in the
western US are based on pest monitoring and use of
action thresholds to determine the need for insecticides
(Ellsworth et al., 1995, 1996b; Naranjo et al., 1998). Thisapproach helped growers maintain profitability in the
face of severe pest outbreaks in the early 1990s (Ells-
worth and Jones, 2001; Ellsworth and Martinez-Car-
rillo, 2001). However, the broad-spectrum materials in
use severely disrupted natural enemy populations
(Naranjo et al., 2002), and over-reliance on these ma-
terials led to reduced susceptibility to pyrethroids in B.
tabaci populations (Dennehy and Williams, 1997; Pal-umbo et al., 2001). As a result, a US-EPA Section 18
emergency exemption was granted in 1996 for two insect
growth regulators (IGRs), buprofezin and pyriproxyfen.
Both of these insecticides have been successfully used in
Israel for suppression of B. tabaci in cotton and green-
house production for many years (Ishaaya and Horo-
witz, 1992; Ishaaya et al., 1988) and both materials have
low vertebrate toxicity and other qualities that makethem relatively safe for the environment (Dhadialla et
al., 1998; Pener, 2002).
Extant research on these IGRs indicate that their
selectivity varies among arthropod natural enemies. The
chitin inhibitor buprofezin has a relatively narrow
spectrum of activity against homopterous insects, while
pyriproxyfen, a juvenile hormone analog, has a broader
spectrum of activity (Dhadialla et al., 1998; Ishaayaet al., 1988). Laboratory bioassay studies have found
both compounds to be either benign (Balasubramani
and Regupathy, 1994; Castane et al., 1996; Delbeke et
al., 1997; Hoddle et al., 2001; Jones et al., 1995; Liu and
Stansly, 1997; Peleg, 1988) or toxic (Chen and Liu, 2002;
Declercq et al., 1995; Gerling and Sinai, 1994; Hattingh
and Tate, 1995; Hoddle et al., 2001; Jones et al., 1998;
Liu and Chen, 2000; Magagula and Samways, 2000;Mendel et al., 1994; Smith et al., 1999) to various pre-
dators and parasitoids. Few studies have examined the
selectivity of these materials in the field (e.g., Naranjo
et al., 2003).
Controlled field studies were conducted from 1997 to
1999 to contrast and demonstrate alternative manage-
ment strategies for B. tabaci in Arizona. Based on pest
monitoring and action thresholds, a rotation of con-ventional insecticides was compared with the IGRs bu-
profezin and pyriproxyfen. The overall project had
multiple goals, including evaluation of the efficacy and
economics of alternative management regimes (i.e.,
IGRs) for suppression of B. tabaci, refining action
thresholds for re-application of the IGRs, evaluation of
potential insecticide resistance, and measuring the effects
of these alternative management regimes on naturalenemy conservation. In this paper we compare the
abundance of arthropod predators and aphelinid par-
asitoids among three different management strategies.
2. Materials and methods
2.1. Study site and experimental design
All studies were conducted at the University of Ari-
zona, Maricopa Agricultural Center, Maricopa, AZ.
Cotton, Gossypium hirsutum L. (cv. Deltapine NuCOTN
33B), was planted in early to mid-April each year, and
grown according to standard agronomic practices for
the area.
Similar experimental designs were used in all yearsand consisted of a randomized complete block, split-plot
replicated four times. Whole plots consisted of one of
three B. tabaci control regimes and an untreated control.
In 1997, whole plots were 24–27 rows wide (1m row-
spacing) by 45.7m long (0.11–0.12 ha). In 1998 and 1999
whole plots measured 36 rows by 36.6m long (0.13 ha).
Each whole plot was split for two Lygus hesperusKnight
control regimes; untreated or treated with insecticides.Split plots were 12 rows by 45.7m (0.055 ha) in 1997 and
18 rows by 36.6m (0.065 ha) in 1998 and 1999. The
whole plot whitefly control regimes are denoted by the
initial materials used in each regime, and all applications
were made on the basis of regular insect sampling and
action thresholds (Table 1). In the buprofezin-first re-
gime, the IGR buprofezin was applied at a threshold of

Table 1
Insecticide application history, Maricopa Agricultural Center, Maricopa, AZ, 1997–1999
Date Main plot treatment
Buprofezin 1st Pyriproxyfen 1st Conventional Control
1997
25 July oxamyla (1121 g/ha) oxamyla (1121 g/ha) oxamyla (1121 g/ha) oxamyla (1121 g/ha)
29 July buprofezin (392 g/ha) pyriproxyfen (60 g/ha) endosulfan (841 g/ha)
+ amitraz (280 g/ha)
5 August oxamyl (561 g/ha)
+ profenophos (841 g/ha)
13 August pyriproxyfen (60 g/ha)
20 August buprofezin (392 g/ha) fenpropathrin (224 g/ha)
+ acephate (561 g/ha)
4 September endosulfan (841 g/ha)
+ amitraz (280 g/ha)
endosulfan (841 g/ha)
+ amitraz (280 g/ha)
endosulfan (841 g/ha)
+ amitraz (280 g/ha)
12 September oxamyl (561 g/ha)
+ profenophos (841 g/ha)
oxamyl (561 g/ha)
+ profenophos (841 g/ha)
fenpropathrin (224 g/ha)
+ oxamyl (561 g/ha)
1998
17 July oxamyla (1121 g/ha) oxamyla (1121 g/ha) oxamyla (1121 g/ha) oxamyla (1121 g/ha)
31 July acephatea (1121 g/ha) acephatea (1121 g/ha) acephatea (1121 g/ha) acephatea (1121 g/ha)
6 August buprofezin (392 g/ha) pyriproxyfen (60 g/ha) endosulfan (841 g/ha)
+ amitraz (280 g/ha)
17 August oxamyla (1121 g/ha) oxamyla (1121 g/ha) oxamyla (1121 g/ha) oxamyla (1121 g/ha)
1999
20 July oxamyla (1121 g/ha) oxamyla (1121 g/ha) oxamyla (1121 g/ha) oxamyla (1121 g/ha)
29 July acephatea (1121 g/ha) acephatea (1121 g/ha) acephatea (1121 g/ha) acephatea (1121 g/ha)
8 August buprofezin (392 g/ha) pyriproxyfen (60 g/ha) endosulfan (841 /ha)
+ amitraz (280 g/ha)
13 August oxamyla (1121 g/ha) oxamyla (1121 g/ha) oxamyla (1121 g/ha) oxamyla (1121 g/ha)
27 August oxamyl (561 g/ha)
+ profenophos (841 g/ha)
10 September fenpropathrin (224 g/ha)
+ acephate (561 g/ha)
All rates given in grams of active ingredient per hectare.a Insecticides used for control of L. hesperus; applied to only one-half of the main treatment plots in a split-plot design.
54 S.E. Naranjo et al. / Biological Control 30 (2004) 52–72
one large nymphal whitefly (third or fourth instar) per
leaf disk plus 3–5 adult whiteflies per leaf (see PestSampling below) (Ellsworth et al., 1996b). This was
followed by the use of the IGR pyriproxyfen based on
the same threshold, but no sooner than 2 weeks
following the application of buprofezin. The pyripr-
oxyfen-first regime consisted of the use of pyriproxyfen
according to the same thresholds above with a follow-up
application of buprofezin as needed, but no sooner than
3 weeks following pyriproxyfen. The waiting periodbetween IGR uses was mandated by the US-EPA Sec-
tion 18 labels in force at the time. This label also per-
mitted only a single use of each IGR per season. If
additional suppression was needed in either of these
IGR regimes, a rotation of conventional insecticides was
used based on a threshold of five adult whiteflies per leaf
(Ellsworth et al., 1995). The conventional control regime
consisted of mixtures of conventional materials rotatedeach time according to local resistance management
guidelines and based on a threshold of five adult
whiteflies per leaf (Ellsworth et al., 1995, 1996a). A final
regime was left untreated for B. tabaci to serve as the
control. In the split-plots, insecticide applications for L.
hesperus were made on the basis of a threshold of 15insects (adults + nymphs) per 100 sweeps. Sprays rotated
between oxamyl and acephate as needed. These insecti-
cides alone have no practical efficacy against B. tabaci.
In 1997 only, the split-plot design was incomplete in that
the ‘‘conventional’’ control regime was not split for L.
hesperus control. Instead the entire whole plot was
sprayed for L. hesperus as needed. All applications were
made by tractor-mounted ground sprayers. Seasonalusage of insecticides is summarized in Table 1.
2.2. Pest sampling
Densities of B. tabaci eggs, nymphs, and adults were
estimated each week from early July through late Sep-
tember or early October each year. Nymphal and egg
densities were estimated by counting individuals (at 10�on a dissecting microscope) on a 3.88 cm2 disk taken
from the fifth mainstem leaf below the terminal (Nar-
anjo and Flint, 1994). Nymphs were categorized as ei-
ther small (first or second instar) or large (third or

S.E. Naranjo et al. / Biological Control 30 (2004) 52–72 55
fourth instar) for the purpose of threshold implemen-tation (see above). Adult density was estimated by
counting individuals, in situ, on the underside of leaves
from the fifth mainstem node below the terminal (Nar-
anjo and Flint, 1995). Ten sample units were randomly
collected per plot for immature and adult stages on each
sample date. Decisions to apply insecticides were based
on the average densities in four replicate plots. Densities
of L. hesperus were monitored weekly from early Julyonward using a standard 38-cm diameter sweep net. A
total of 50 sweeps were taken per plot and decisions to
spray were made on the basis of counts from all treated
split-plots.
2.3. Natural enemy sampling
Arthropod predators were sampled each week with astandard 38-cm diameter sweep net from early June
through mid to late September each year. Two sets of 25
sweeps (50 total) were collected in each plot using a
random starting point. Samples were frozen and later
sorted in the laboratory with the aid of a dissecting
microscope. Densities of 20 taxa of arthropod predators
were estimated. Immature and adult stages of most taxa
were pooled for analyses. L. hesperus, Pseudatomoscelis
seriatus (Reuter), Spanogonicus albofasciatus (Reuter),
and Rhinacloa forticornis Reuter were included because
these species may exhibit omnivorous feeding habits
(Agnew et al., 1982; Butler, 1965; Hagler and Naranjo,
1994a, unpublished). Only larval stages of the green
lacewing were counted, and following Tauber et al.
(2000) we used the designation of Chrysoperla carnea
sensu lato for this species. Voucher specimens reside inthe Department of Entomology, University of Arizona,
Tucson, research collection.
Predator:prey ratios were calculated as the quotient
of all predators combined (per 50 sweeps) to the number
of B. tabaci eggs, nymphs, adults, or all life stages per
leaf combined. Egg and nymphal densities per leaf were
estimated from regression models relating disk to whole
leaf counts (Naranjo and Flint, 1994). Predator:preyratios calculated for contrasts involving L. hesperus
control excluded L. hesperus and P. seriatus, because
these insects were the primary targets of control.
Densities of immature aphelinid parasitoids (Eretm-
ocerus spp. and Encarsia spp.) were estimated by taking
leaf samples (20–30 per plot) from the seventh mainstem
node below the terminal. Samples were collected weekly
from early July through mid to late September eachyear. In the laboratory all larval and pupal parasitoids
of each genus (when possible) and all unparasitized
fourth instar whitefly nymphs on the entire leaf were
counted. The presence of visible larvae or meconia
within the host mummy was used to discriminate En-
carsia spp. from Eretmocerus spp. after parasitoids
reached later larval or pupal stages. Displacement of the
host�s mycetomes was used to determine the presence ofyoung parasitoid larvae, but in these cases the genus
of the parasitoid could not be discerned. An index of
parasitism was calculated based on the proportion of
fourth instar nymphs parasitized by both genera com-
bined. A subsample of leaves from each plot was held to
determine the species composition from emerged adults.
2.4. Statistical analyses
Mixed-model, repeated measures analysis of variance
(Littell et al., 1996) was used to test for treatment dif-
ferences over the season each year. The block variable
and associated interaction terms were entered as random
effects, and Satterthwaite�s formula was used to estimate
corrected degrees of freedom for F tests. The first order
heterogeneous autoregressive option (ARH1 in SASProc Mixed) was used to estimate the repeated measures
covariance structure, as it consistently maximized Ak-
aike�s Information and Schwarz� Bayesian Criteria
(Littell et al., 1996). Pre-planned orthogonal contrasts
were used to compare both IGR regimes with the con-
trol and the conventional regime, to compare the con-
ventional regime and the control, and to contrast the
two IGR regimes. Treatment effects on proportionalparasitism were analyzed with the SAS macro, GLIM-
MIX (Littell et al., 1996), which performs mixed-model
ANOVA using a binomial error structure. Because the
split-plot (L. hesperus control regime) design was in-
complete in 1997, two sets of analyses were performed.
A split-plot ANOVA was conducted after excluding the
conventional regime, which was not split for L. hesperus
control. A randomized complete block ANOVA wasthen conducted for all four whitefly control regimes that
were treated with insecticides for control of L. hesperus.
Arthropod counts and predator:prey ratios were trans-
formed by ðxþ 0:5Þ0:5 or lnðxþ 1Þ throughout as nec-
essary to achieve normality and homoscedasticity before
analyses; untransformed means are presented. Analyses
were limited to sample dates following the first appli-
cation of insecticides for B. tabaci.A meta-analysis was performed to summarize treat-
ment effects over all three years. Indices were calculated
as the mean of the product pisi over all years, where p is
the proportional reduction in density of each predator
taxa, parasitism, or predator–prey ratio in a given in-
secticide regime relative to the untreated control in year
i, and s is a dummy variable indicating the statistical
significance (s ¼ 1) or non-significance (s ¼ 0) of thereduction based on ANOVA. Additionally, mean pro-
portional reductions (relative to the control) in predator
densities, parasitism, and predator:prey ratios were
calculated.
To further examine seasonal treatment effects on ar-
thropod predator populations, a time-dependent, mul-
tivariate analysis called principal response curves (PRC)

56 S.E. Naranjo et al. / Biological Control 30 (2004) 52–72
(van den Brink and Ter Braak, 1998, 1999) was con-ducted. PRC is based on an ordination method known
as partial redundancy analysis, a type of principal
component analysis in which information is extracted
only from the variance explained by treatment effects.
PRC provide a simple means of visualizing and testing
the overall response of a biological community to en-
vironmental stress by determining treatment effects rel-
ative to an untreated control. The program CANOCO 4(Ter Braak and Smilauer, 1998) was used to perform the
partial redundancy analyses, construct the PRC, and
test for treatment differences in community composition
using a distribution-free F type test based on sample
permutation. In CANOCO, the analyses can be struc-
tured to account for blocking and split-plot effects and
to allow statistical inference for individual dates or the
entire season. Treatment contrasts similar to those forANOVA above were performed. For analyses of L.
hesperus control effects, we excluded L. hesperus and P.
seriatus. Arthropod count data were transformed by
lnðxþ 1Þ prior to analysis.
3. Results
In all three years, the first insecticide applications
were made for control of L. hesperus in mid to late July
(Table 1). A single application was made for this pest in
1997, but three applications were necessary in 1998 and
1999. The first insecticide applications for B. tabaci
varied from late July to early August. In 1997, both IGR
regimes required sprays of buprofezin and pyriproxyfen
plus the application of two conventional insecticides latein the season. The conventional regime was sprayed five
times over the course of the season. In 1998 and 1999
only a single application of either buprofezin or py-
riproxyfen was needed in either IGR regime. In the
conventional regime, one and three applications were
necessary in 1998 and 1999, respectively.
3.1. Pest populations
Detailed analyses of treatment effects on densities of
B. tabaci, yields, and overall economics are presented
elsewhere (Ellsworth and Naranjo, 1999; Ellsworth
et al., 1998; Ellsworth and Naranjo, unpublished data);
only general results will be briefly discussed here. Pop-
ulation densities of B. tabaci varied over the years of the
study, but were generally highest in 1997 and lowest in1998. Densities of all B. tabaci stages were reduced in all
whitefly control regimes compared with the untreated
control in all years. Densities of eggs and adults were
consistently lowest in the conventional regime and
generally significantly higher (P < 0:05) in the two IGR
regimes. All whitefly control regimes were equally
effective in reducing densities of nymphs in all years.
The effect of L. hesperus control on densities of B. tabaciwere minor; however, significant seasonal reductions
(P < 0:05) were measured in eggs (1999) and nymphs
(1998 and 1999), with variable impact on adults in 1997
and 1998.
3.2. Predator populations and predator:prey ratios
Many predator taxa occurred at relatively low den-sities over the three years of the study, especially beetles,
most spiders, and several heteropterans. The most
abundant spider was the crab spider, Misumenops celer
(Hentz), while Orius tristicolor (White) and Geocoris
punctipes (Say) were consistently the most common
predaceous heteropterans. The plant pest and facultative
predator L. hesperus consistently occurred at high den-
sities, and P. seriatus was relatively abundant in 1997and 1998. Larval C. carnea s.l. were relatively abundant,
and adults of the empidid fly, Drapetis nr. divergens,
were the most abundant predator species observed over
the entire study.
There were no significant (P > 0:05) interactions be-tween B. tabaci and L. hesperus control regimes for any
taxa; thus, only main effects are presented. Sufficient
numbers of immature G. punctipes, O. tristicolor, L.
hesperus, and P. seriatus were available for separate
analyses. However, in all cases results for immature and
adult stages were similar, and so only results for adults
and immatures combined are reported.
3.2.1. 1997
Based on split-plot analyses of predator densities
excluding the conventional insecticide regime, seasonalaverage densities of five out of 19 taxa were significantly
reduced (P < 0:05) in the IGR regimes compared with
the control, including G. punctipes, Nabis alternatus
Parshley, L. hesperus, C. carnea s.l., and D. nr. divergens
(Table 2). No significant differences (P > 0:05) were
detected for any taxa between the two IGR regimes. The
use of insecticides for L. hesperus control significantly
reduced (P < 0:05) the densities of seven predator taxaincluding most of those negatively affected by the IGRs
(Table 2). The seasonal average density of the target, L.
hesperus, was reduced by over 38%. Predator:prey ratios
were significantly higher (P < 0:05) in the IGR regimes
compared with the control. Predator:prey ratios did not
differ between the two IGR regimes, but the addition of
insecticides for L. hesperus suppression significantly re-
duced (P < 0:05) these ratios. Predator:prey ratios var-ied over the season, but were consistently higher in plots
not receiving additional insecticides for L. hesperus
control (Fig. 1B).
Results from analyses based only on split-plots re-
ceiving L. hesperus control in 1997 were similar to those
for the IGR regimes above. The exceptions were that
seasonal average densities of D. nr. divergens in the IGR
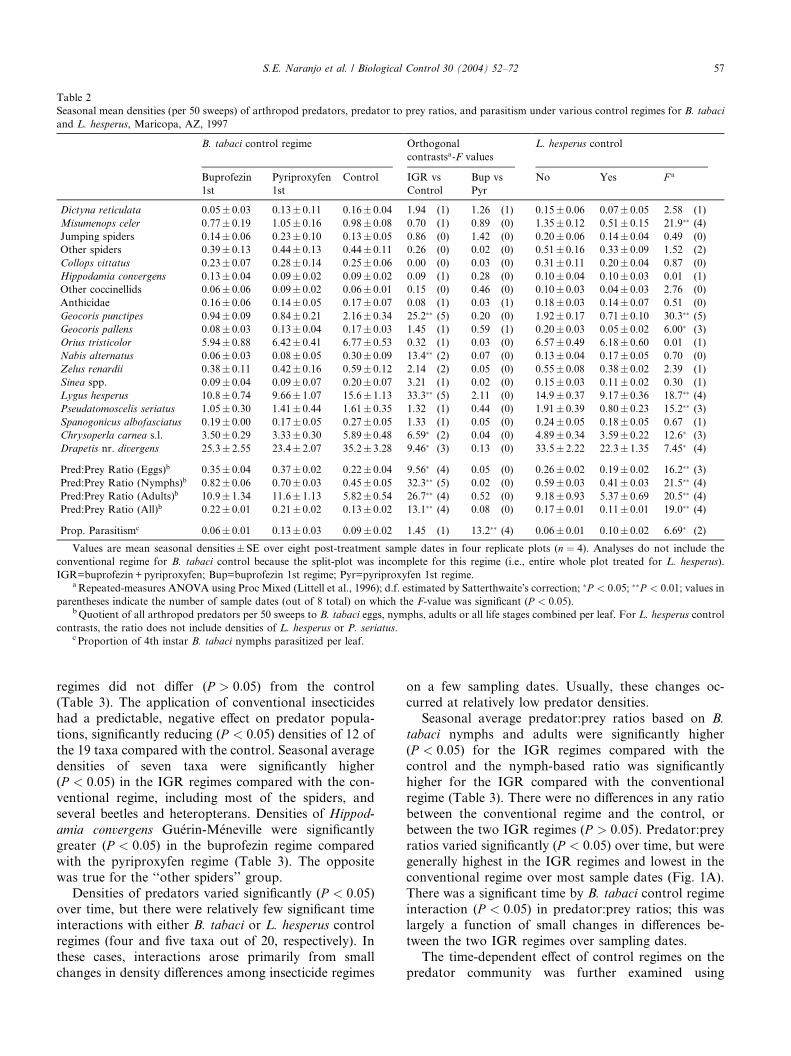
Table 2
Seasonal mean densities (per 50 sweeps) of arthropod predators, predator to prey ratios, and parasitism under various control regimes for B. tabaci
and L. hesperus, Maricopa, AZ, 1997
B. tabaci control regime Orthogonal
contrastsa-F values
L. hesperus control
Buprofezin
1st
Pyriproxyfen
1st
Control IGR vs
Control
Bup vs
Pyr
No Yes F a
Dictyna reticulata 0.05� 0.03 0.13� 0.11 0.16� 0.04 1.94 (1) 1.26 (1) 0.15� 0.06 0.07� 0.05 2.58 (1)
Misumenops celer 0.77� 0.19 1.05� 0.16 0.98� 0.08 0.70 (1) 0.89 (0) 1.35� 0.12 0.51� 0.15 21.9�� (4)
Jumping spiders 0.14� 0.06 0.23� 0.10 0.13� 0.05 0.86 (0) 1.42 (0) 0.20� 0.06 0.14� 0.04 0.49 (0)
Other spiders 0.39� 0.13 0.44� 0.13 0.44� 0.11 0.26 (0) 0.02 (0) 0.51� 0.16 0.33� 0.09 1.52 (2)
Collops vittatus 0.23� 0.07 0.28� 0.14 0.25� 0.06 0.00 (0) 0.03 (0) 0.31� 0.11 0.20� 0.04 0.87 (0)
Hippodamia convergens 0.13� 0.04 0.09� 0.02 0.09� 0.02 0.09 (1) 0.28 (0) 0.10� 0.04 0.10� 0.03 0.01 (1)
Other coccinellids 0.06� 0.06 0.09� 0.02 0.06� 0.01 0.15 (0) 0.46 (0) 0.10� 0.03 0.04� 0.03 2.76 (0)
Anthicidae 0.16� 0.06 0.14� 0.05 0.17� 0.07 0.08 (1) 0.03 (1) 0.18� 0.03 0.14� 0.07 0.51 (0)
Geocoris punctipes 0.94� 0.09 0.84� 0.21 2.16� 0.34 25.2�� (5) 0.20 (0) 1.92� 0.17 0.71� 0.10 30.3�� (5)
Geocoris pallens 0.08� 0.03 0.13� 0.04 0.17� 0.03 1.45 (1) 0.59 (1) 0.20� 0.03 0.05� 0.02 6.00� (3)
Orius tristicolor 5.94� 0.88 6.42� 0.41 6.77� 0.53 0.32 (1) 0.03 (0) 6.57� 0.49 6.18� 0.60 0.01 (1)
Nabis alternatus 0.06� 0.03 0.08� 0.05 0.30� 0.09 13.4�� (2) 0.07 (0) 0.13� 0.04 0.17� 0.05 0.70 (0)
Zelus renardii 0.38� 0.11 0.42� 0.16 0.59� 0.12 2.14 (2) 0.05 (0) 0.55� 0.08 0.38� 0.02 2.39 (1)
Sinea spp. 0.09� 0.04 0.09� 0.07 0.20� 0.07 3.21 (1) 0.02 (0) 0.15� 0.03 0.11� 0.02 0.30 (1)
Lygus hesperus 10.8� 0.74 9.66� 1.07 15.6� 1.13 33.3�� (5) 2.11 (0) 14.9� 0.37 9.17� 0.36 18.7�� (4)
Pseudatomoscelis seriatus 1.05� 0.30 1.41� 0.44 1.61� 0.35 1.32 (1) 0.44 (0) 1.91� 0.39 0.80� 0.23 15.2�� (3)
Spanogonicus albofasciatus 0.19� 0.00 0.17� 0.05 0.27� 0.05 1.33 (1) 0.05 (0) 0.24� 0.05 0.18� 0.05 0.67 (1)
Chrysoperla carnea s.l. 3.50� 0.29 3.33� 0.30 5.89� 0.48 6.59� (2) 0.04 (0) 4.89� 0.34 3.59� 0.22 12.6� (3)
Drapetis nr. divergens 25.3� 2.55 23.4� 2.07 35.2� 3.28 9.46� (3) 0.13 (0) 33.5� 2.22 22.3� 1.35 7.45� (4)
Pred:Prey Ratio (Eggs)b 0.35� 0.04 0.37� 0.02 0.22� 0.04 9.56� (4) 0.05 (0) 0.26� 0.02 0.19� 0.02 16.2�� (3)
Pred:Prey Ratio (Nymphs)b 0.82� 0.06 0.70� 0.03 0.45� 0.05 32.3�� (5) 0.02 (0) 0.59� 0.03 0.41� 0.03 21.5�� (4)
Pred:Prey Ratio (Adults)b 10.9� 1.34 11.6� 1.13 5.82� 0.54 26.7�� (4) 0.52 (0) 9.18� 0.93 5.37� 0.69 20.5�� (4)
Pred:Prey Ratio (All)b 0.22� 0.01 0.21� 0.02 0.13� 0.02 13.1�� (4) 0.08 (0) 0.17� 0.01 0.11� 0.01 19.0�� (4)
Prop. Parasitismc 0.06� 0.01 0.13� 0.03 0.09� 0.02 1.45 (1) 13.2�� (4) 0.06� 0.01 0.10� 0.02 6.69� (2)
Values are mean seasonal densities� SE over eight post-treatment sample dates in four replicate plots (n ¼ 4). Analyses do not include the
conventional regime for B. tabaci control because the split-plot was incomplete for this regime (i.e., entire whole plot treated for L. hesperus).
IGR=buprofezin +pyriproxyfen; Bup=buprofezin 1st regime; Pyr=pyriproxyfen 1st regime.aRepeated-measures ANOVA using Proc Mixed (Littell et al., 1996); d.f. estimated by Satterthwaite�s correction; �P < 0:05; ��P < 0:01; values in
parentheses indicate the number of sample dates (out of 8 total) on which the F-value was significant (P < 0:05).bQuotient of all arthropod predators per 50 sweeps to B. tabaci eggs, nymphs, adults or all life stages combined per leaf. For L. hesperus control
contrasts, the ratio does not include densities of L. hesperus or P. seriatus.c Proportion of 4th instar B. tabaci nymphs parasitized per leaf.
S.E. Naranjo et al. / Biological Control 30 (2004) 52–72 57
regimes did not differ (P > 0:05) from the control
(Table 3). The application of conventional insecticides
had a predictable, negative effect on predator popula-
tions, significantly reducing (P < 0:05) densities of 12 of
the 19 taxa compared with the control. Seasonal average
densities of seven taxa were significantly higher(P < 0:05) in the IGR regimes compared with the con-
ventional regime, including most of the spiders, and
several beetles and heteropterans. Densities of Hippod-
amia convergens Gu�erin-M�eneville were significantly
greater (P < 0:05) in the buprofezin regime compared
with the pyriproxyfen regime (Table 3). The opposite
was true for the ‘‘other spiders’’ group.
Densities of predators varied significantly (P < 0:05)over time, but there were relatively few significant time
interactions with either B. tabaci or L. hesperus control
regimes (four and five taxa out of 20, respectively). In
these cases, interactions arose primarily from small
changes in density differences among insecticide regimes
on a few sampling dates. Usually, these changes oc-
curred at relatively low predator densities.
Seasonal average predator:prey ratios based on B.
tabaci nymphs and adults were significantly higher
(P < 0:05) for the IGR regimes compared with the
control and the nymph-based ratio was significantlyhigher for the IGR compared with the conventional
regime (Table 3). There were no differences in any ratio
between the conventional regime and the control, or
between the two IGR regimes (P > 0:05). Predator:preyratios varied significantly (P < 0:05) over time, but were
generally highest in the IGR regimes and lowest in the
conventional regime over most sample dates (Fig. 1A).
There was a significant time by B. tabaci control regimeinteraction (P < 0:05) in predator:prey ratios; this was
largely a function of small changes in differences be-
tween the two IGR regimes over sampling dates.
The time-dependent effect of control regimes on the
predator community was further examined using

Fig. 1. The main effects of B. tabaci (A, C, E) and L. hesperus (B, D, F) control regimes on total predator to prey ratios during the growing season,
1997–1999, Maricopa, AZ. Only post-application dates for whitefly insecticides are shown. The predator–prey ratio is estimated as the quotient of all
arthropod predators (per 50 sweeps) to all B. tabaci life stages per leaf. Asterisks along the bottom of each graph denote dates on which significant
(P < 0:05) treatment differences were observed; letters along the top of each graph denote the timing of applications of buprofezin (B), pyriproxyfen
(P) or conventional (C) insecticides. Results in A are based solely on data from split-plots receiving L. hesperus control, because the split-plot design
was incomplete in 1997.
58 S.E. Naranjo et al. / Biological Control 30 (2004) 52–72
principal response curves (PRC). Results of analyses
based on the split-plots receiving L. hesperus control are
presented in Fig. 2A. The PRC based on the first axis of
the redundancy analysis were highly significant(P < 0:01) and explained 51% of the variation due to
control regime. The second axis explained an additional
12% of the variance, but was not significant (P ¼ 0:85).Negative canonical coefficients indicate that populations
of predators were generally lower in the insecticide
regimes compared with the untreated control. Contrasts
based on permutation tests over all sample dates
combined indicated IGR and conventional regimes sig-
nificantly reduced (P < 0:05) the density of the predator
community compared with the untreated control.
However, as with the univariate analyses, predatordensities were significantly (P < 0:05) lower in the con-
ventional compared with the IGR regimes. There was no
difference (P > 0:05) between the two IGR regimes.
Date by date contrasts indicate that neither IGR regime
differed from the control until the last two sampling
dates following the two applications of conventional
insecticides (Fig. 2A). In contrast, the repeated

Table 3
Seasonal mean densities (per 50 sweeps) of arthropod predators, predator to prey ratios, and parasitism under different control regimes for B. tabaci,
Maricopa, AZ, 1997
B. tabaci control regime Orthogonal contrastsa—F values
Buprofezin
1st
Pyriproxyfen
1st
Conventional Control IGR vs
Control
IGR vs
Conven
Conven vs
Control
Bup vs
Pyr
Dictyna reticulata 0.01� 0.00 0.16� 0.12 0.01� 0.00 0.06� 0.04 0.01 (0) 1.24 (0) 0.82 (0) 3.71 (2)
Misumenops celer 0.41� 0.09 0.53� 0.16 0.09� 0.06 0.59� 0.22 0.97 (1) 6.42� (3) 9.27�� (4) 0.38 (1)
Jumping spiders 0.16� 0.06 0.19� 0.11 0.01� 0.00 0.06� 0.04 1.99 (1) 5.07� (3) 0.53 (0) 0.06 (0)
Other spiders 0.16� 0.09 0.47� 0.19 0.03� 0.03 0.38� 0.05 0.60 (0) 5.18� (2) 6.98�� (4) 4.26� (1)
Collops vittatus 0.19� 0.06 0.19� 0.04 0.06� 0.04 0.22� 0.03 0.14 (0) 12.3�� (4) 11.0�� (4) 0.01 (0)
Hippodamia convergens 0.16� 0.03 0.03� 0.03 0.03� 0.03 0.13� 0.05 0.42 (0) 1.68 (0) 2.84 (0) 5.05� (1)
Other coccinellids 0.06� 0.06 0.03� 0.03 0.03� 0.03 0.03� 0.03 0.10 (0) 0.10 (0) 0.00 (0) 0.29 (0)
Anthicidae 0.16� 0.08 0.16� 0.09 0.06� 0.06 0.09� 0.06 1.14 (0) 5.67� (3) 0.08 (0) 0.01 (0)
Geocoris punctipes 0.31� 0.06 0.56� 0.26 0.22� 0.08 1.25� 0.21 14.7�� (3) 1.09 (0) 17.8�� (4) 0.58 (0)
Geocoris pallens 0.01� 0.00 0.06� 0.04 0.09� 0.03 0.09� 0.03 2.03 (1) 2.03 (1) 0.01 (1) 1.52 (0)
Orius tristicolor 5.91� 1.21 6.03� 0.69 2.63� 0.58 6.59� 1.02 0.06 (1) 16.2�� (5) 13.7�� (4) 0.01 (0)
Nabis alternatus 0.09� 0.03 0.09� 0.06 0.06� 0.06 0.31� 0.11 6.40� (2) 0.31 (0) 7.15� (3) 0.01 (0)
Zelus renardii 0.25� 0.11 0.31� 0.23 0.06� 0.06 0.56� 0.13 2.71 (0) 1.40 (1) 6.00� (3) 0.09 (0)
Sinea spp. 0.03� 0.03 0.13� 0.09 0.01� 0.00 0.19� 0.06 2.33 (0) 1.21 (1) 5.18� (2) 1.02 (0)
Lygus hesperus 8.09� 0.89 6.78� 1.16 4.13� 0.55 12.6� 0.92 26.6�� (2) 15.1�� (4) 61.3�� (6) 0.86 (0)
Pseudatomoscelis seriatus 0.47� 0.34 0.75� 0.42 0.22� 0.08 1.19� 0.36 2.49 (1) 1.49 (2) 5.88� (2) 0.59 (0)
Spanogonicus albofasciatus 0.19� 0.04 0.19� 0.11 0.06� 0.04 0.16� 0.06 0.20 (0) 2.16 (2) 0.79 (0) 0.01 (0)
Chrysoperla carnea s.l. 3.03� 0.48 2.41� 0.24 3.28� 0.59 5.34� 0.79 7.81� (3) 0.01 (2) 5.37� (3) 0.44 (0)
Drapetis nr. divergens 19.6� 3.27 22.1� 2.23 15.8� 3.78 25.1� 3.50 1.45 (0) 1.51 (1) 4.89� (1) 0.43 (0)
Pred:Prey Ratio (Eggs)b 0.29� 0.06 0.29� 0.04 0.22� 0.04 0.18� 0.03 2.43 (2) 0.17 (1) 0.98 (1) 0.06 (0)
Pred:Prey Ratio (Nymphs)b 0.60� 0.10 0.61� 0.03 0.36� 0.05 0.34� 0.02 11.2�� (4) 9.59�� (3) 0.04 (1) 0.30 (0)
Pred:Prey Ratio (Adults)b 7.75� 2.02 8.25� 0.71 7.26� 0.80 4.79� 0.41 5.03� (3) 0.41 (1) 1.89 (2) 0.40 (0)
Pred:Prey Ratio (All)b 0.16� 0.03 0.18� 0.02 0.13� 0.02 0.11� 0.02 3.45 (2) 0.82 (0) 0.67 (2) 0.01 (0)
Prop. Parasitismc 0.05� 0.01 0.11� 0.04 0.04� 0.01 0.06� 0.02 1.70 (1) 1.41 (1) 0.01 (0) 5.46� (2)
Values are mean seasonal densities� SE over eight post-treatment sample dates in four replicate plots (n ¼ 4). Analyses based only on split plots
receiving L. hesperus control. IGR=buprofezin +pyriproxyfen; Bup=buprofezin 1st regime; Pyr=pyriproxyfen 1st regime; Conven=conventional
whitefly control regime.aRepeated-measures ANOVA using Proc Mixed (Littell et al., 1996); d.f. estimated by Satterthwaite�s correction; �P < 0:05; ��P < 0:01; values in
parentheses indicate the number of sample dates (out of 8 total) on which the F-value was significant (P < 0:05).bQuotient of all arthropod predators per 50 sweeps to B. tabaci eggs, nymphs, adults or all life stages combined per leaf.c Proportion of 4th instar B. tabaci nymphs parasitized per leaf.
S.E. Naranjo et al. / Biological Control 30 (2004) 52–72 59
application of insecticides in the conventional regime
depressed predator densities on multiple datesthroughout the growing season and these reductions
followed the pattern of application. A single application
of oxamyl for L. hesperus in late July resulted in a large
initial reduction in predator populations (Fig. 2B).
Populations rebounded in early to mid-August but were
significantly lower compared with the untreated control
in late August and early September. The PRC based on
the first axis of the redundancy analysis was highlysignificant (P < 0:01) and explained 71% of the varia-
tion. The second axis explained an additional 9%, but
was not significant (P ¼ 0:75).The species weights denote the strength of the re-
sponse for each individual taxa (Fig. 2). The higher the
value the more the response of a given taxa resembles
the PRC. Negative weights indicate an opposite pattern
and values between )0.5 and 0.5 indicate a weak re-sponse or a response unrelated to the PRC (van den
Brink and Ter Braak, 1999). Species weights suggest that
the PRC for the both the B. tabaci and L. hesperus
control regimes are most representative of L. hesperus,
O. tristicolor, G. punctipes, C. carnea s.l., P. seriatus, D.nr. divergens, M. celer, Zelus renardii Kolenati, and the
‘‘other spider’’ group.
3.2.2. 1998
Seasonal average densities of onlyD. nr. divergens and
S. albofasciatus were significantly reduced (P < 0:05) inthe IGR regimes compared with the control, while den-
sities of the ‘‘other spider’’ group increased significantly inthe IGRregimes (Table 4). In contrast, densities of 11 taxa
were significantly reduced (P < 0:05) in the conventional
regime compared with the control. For 10 predator taxa,
densities were significantly higher (P < 0:05) in the IGR
compared with the conventional regime (Table 4). There
were no significant differences (P > 0:05) between the twoIGR regimes for any predator taxa. Insecticides for con-
trol of L. hesperus significantly reduced (P < 0:05) sea-sonal average densities of 16 predator taxa (Table 4). The
seasonal average density of the target, L. hesperus, was
reduced by over 52%.

Fig. 2. Principal response curves (PRC) showing the main effects of (A) whitefly control (only post-application dates for whitefly insecticides are
shown), and (B) L. hesperus control (only post-application dates for L. hesperus insecticides are shown) on the predatory arthropod community
during the growing season, 1997, Maricopa, AZ. The PRC show the effect of each treatment regime relative to the untreated control (Co) which is
represented by the y ¼ 0 line. The greater the species weight the more the response for that species resembles the PRC. Negative weights indicate an
opposite pattern, and weights between )0.5 and 0.5 indicate a weak response or a response unrelated to the PRC. The P -value denotes the sig-
nificance of the PRC analysis over all dates based on an F -type permutation test. The plus symbols at the base of each graph denote the significance
(P < 0:05) of the indicated contrast on each date determined by F -type permutation test; letters along the top of each graph denote the timing of
applications of buprofezin (B), pyriproxyfen (P), or conventional insecticides for whitefly (C) or L. hesperus (T). There were no significant differences
between the two IGRs on any date and so contrasts are not shown. Results in A are based solely on data from split-plots receiving L. hesperus
control, because the split-plot design was incomplete in 1997.
60 S.E. Naranjo et al. / Biological Control 30 (2004) 52–72
Most predator densities varied significantly
(P < 0:05) over time and significant time by B. tabaci
control regime interactions were observed for D. nr.
divergens and L. hesperus. These interactions arose from
small differences in insecticide effects on two or three
sampling dates. Significant time by L. hesperus control
interactions were detected for seven taxa and this was
primarily due to small changes in insecticide effects onone or two sampling dates.
Predator:prey ratios based on B. tabaci adults were
significantly higher (P < 0:05) in the IGR and conven-
tional regimes compared with the control and ratios
based on nymphs were significantly higher (P < 0:05)in the IGR compared with the conventional regime
(Table 4). Predator:prey ratios based on all B. tabaci
stages combined varied significantly (P < 0:05) over
time (Fig. 1C). Significant treatment differences were
only observed during the first four sample dates fol-
lowing insecticide application; however, ratios were
numerically lowest in the conventional regime over alarge portion of the season. Predator:prey ratios based
on eggs, nymphs and all stages combined were signifi-
cantly reduced (P < 0:05) with the addition of insecti-
cides for L. hesperus control (Table 4, Fig. 1D). There

Table 4
Seasonal mean densities (per 50 sweeps) of arthropod predators, predator to prey ratios, and parasitism under various control regimes for B. tabaci and L. hesperus, Maricopa, AZ, 1998
B. tabaci control regime Orthogonal contrastsa—F values L. hesperus control
Buprofezin
1stPyriproxyfen
1stConven Control IGR vs
Control
IGR vs
Conven
Conven vs
Control
Bup vs
Pyr
No Yes F a
Dictyna reticulata 0.42� 0.06 0.38� 0.05 0.33� 0.10 0.50� 0.11 0.03 (0) 0.89 (0) 0.92 (0) 0.28 (0) 0.56� 0.02 0.25� 0.07 7.33� (3)
Misumenops celer 8.79� 0.76 8.59� 0.22 6.58� 0.32 7.67� 0.32 2.10 (1) 15.5� (4) 4.63� (3) 0.02 (0) 10.5� 0.54 5.34� 0.24 116�� (7)
Jumping spiders 1.70� 0.23 1.79� 0.14 1.50� 0.26 1.72� 0.14 0.02 (1) 1.20 (0) 0.66 (2) 0.02 (0) 1.98� 0.15 1.37� 0.08 10.4�� (3)
Other spiders 1.95� 0.29 1.77� 0.34 1.70� 0.17 1.20� 0.27 5.35� (1) 1.36 (0) 0.99 (0) 0.66 (0) 2.02� 0.28 1.29� 0.34 11.3�� (3)
Collops vittatus 0.39� 0.08 0.26� 0.04 0.16� 0.05 0.48� 0.06 2.54 (1) 6.22� (2) 13.1�� (3) 2.40 (1) 0.36� 0.06 0.29� 0.05 1.51 (1)
Hippodamia convergens 0.19� 0.03 0.23� 0.09 0.09� 0.06 0.20� 0.09 0.35 (1) 3.80 (0) 1.37 (2) 0.45 (0) 0.27� 0.04 0.09� 0.03 9.8� (3)
Other coccinellids 0.05� 0.04 0.11� 0.05 0.11� 0.09 0.13� 0.05 0.27 (0) 0.05 (0) 0.37 (0) 0.37 (1) 0.19� 0.10 0.01� 0.01 4.58� (2)
Anthicidae 0.41� 0.23 0.66� 0.29 0.11� 0.03 0.47� 0.20 0.09 (1) 5.40� (3) 4.70� (1) 1.41 (1) 0.41� 0.04 0.41� 0.02 0.40 (0)
Geocoris punctipes 1.34� 0.32 1.32� 0.22 0.83� 0.18 1.39� 0.13 0.05 (0) 7.60�� (2) 4.77� (2) 0.00 (0) 1.91� 0.24 0.53� 0.07 59.2�� (6)
Geocoris pallens 0.41� 0.04 0.48� 0.10 0.17� 0.05 0.48� 0.03 0.01 (1) 9.38�� (3) 6.65� (3) 0.43 (1) 0.48� 0.06 0.29� 0.03 4.47� (3)
Orius tristicolor 6.13� 0.39 4.87� 0.21 5.09� 0.47 7.09� 0.49 3.46 (1) 1.10 (0) 6.37� (2) 2.45 (0) 6.25� 0.49 5.35� 0.49 6.25� (4)
Nabis alternatus 0.16� 0.02 0.13� 0.03 0.06� 0.01 0.14� 0.05 0.01 (0) 5.26� (2) 2.27 (1) 0.13 (0) 0.16� 0.02 0.08� 0.01 5.48� (2)
Zelus renardii 3.18� 0.20 2.94� 0.37 2.73� 0.22 3.25� 0.35 0.84 (1) 1.38 (1) 3.27 (1) 0.24 (0) 3.92� 0.15 2.13� 0.17 87.3�� (6)
Sinea spp. 0.23� 0.07 0.23� 0.05 0.28� 0.13 0.14� 0.07 1.42 (0) 0.02 (0) 0.85 (0) 0.00 (0) 0.27� 0.07 0.18� 0.07 0.96 (0)
Lygus hesperus 24.7� 1.09 24.5� 1.38 20.1� 1.17 24.0� 1.47 0.00 (0) 19.9�� (4) 15.2�� (5) 0.18 (0) 31.6� 1.52 15.0� 0.78 128�� (6)
Pseudatomoscelis seriatus 1.41� 0.08 1.28� 0.20 0.73� 0.26 1.56� 0.12 0.10 (0) 9.21�� (3) 8.41�� (3) 0.59 (0) 1.78� 0.05 0.71� 0.12 32.4�� (6)
Spanogonicus albofasciatus 0.16� 0.04 0.11� 0.02 0.09� 0.02 0.36� 0.12 7.12� (1) 0.62 (0) 8.94�� (2) 0.58 (0) 0.18� 0.03 0.18� 0.03 0.00 (0)
Rhinacloa forticornis 0.66� 0.12 0.55� 0.12 0.55� 0.19 0.78� 0.22 1.07 (0) 0.39 (0) 0.42 (0) 0.39 (0) 0.91� 0.18 0.36� 0.13 17.2�� (4)
Chrysoperla carnea s.l. 1.78� 0.12 1.56� 0.11 1.46� 0.17 1.88� 0.27 0.01 (0) 5.33� (2) 4.08� (1) 0.06 (0) 2.16� 0.09 1.17� 0.10 27.1�� (5)
Drapetis nr. divergens 8.00� 1.45 6.21� 1.64 6.27� 0.76 13.2� 5.64 5.58� (1) 5.91� (3) 14.9�� (4) 4.86 (2) 11.3� 3.26 5.57� 1.47 28.1�� (6)
Pred:Prey Ratio (Eggs)b 0.84� 0.07 0.77� 0.07 0.93� 0.04 0.76� 0.07 1.66 (1) 0.69 (2) 3.38 (2) 0.91 (1) 0.61� 0.04 0.45� 0.06 26.7�� (4)
Pred:Prey Ratio (Nymphs)b 1.07� 0.07 1.06� 0.07 0.96� 0.03 0.98� 0.08 2.39 (1) 7.22� (4) 1.09 (3) 0.05 (0) 0.70� 0.06 0.49� 0.05 46.9�� (5)
Pred:Prey Ratio (Adults)b 19.9� 1.24 22.6� 1.24 23.4� 0.63 15.0� 2.85 15.7�� (3) 1.02 (4) 18.3�� (4) 1.82 (1) 12.9� 0.44 11.7� 1.42 1.09 (2)
Pred:Prey Ratio (All)b 0.43� 0.03 0.41� 0.03 0.44� 0.02 0.39� 0.03 1.81 (0) 0.24 (2) 0.55 (2) 0.46 (0) 0.30� 0.02 0.22� 0.03 35.1�� (4)
Prop. parasitismc 0.13� 0.02 0.12� 0.02 0.14� 0.02 0.14� 0.02 0.02 (0) 0.11 (0) 0.16 (1) 2.13 (2) 0.16� 0.02 0.11� 0.01 6.41� (2)
Values are mean seasonal densities� SE over eight post-treatment sample dates in four replicate plots (n ¼ 4). IGR¼buprofezin+pyriproxyfen; Bup¼buprofezin 1st regime; Pyr¼pyriproxyfen
1st regime; Conven¼conventional whitefly control regime.aRepeated-measures ANOVA using Proc Mixed (Littell et al., 1996); d.f. estimated by Satterthwaite�s correction; �P < 0:05; ��P < 0:01; values in parentheses indicate the number of sample dates
(out of 8 total) on which the F-value was significant (P < 0:05).bQuotient of all arthropod predators per 50 sweeps to B. tabaci eggs, nymphs, adults or all life stages combined per leaf. For L. hesperus control contrasts, the ratio does not include densities of
L. hesperus or P. seriatus.c Proportion of 4th instar B. tabaci nymphs parasitized per leaf.
S.E.Naranjo
etal./Biologica
lContro
l30(2004)52–72
61

62 S.E. Naranjo et al. / Biological Control 30 (2004) 52–72
were significant (P < 0:05) time by B. tabaci control re-gime interactions. This was largely due to inconsistent
treatment effects over time, especially among the IGR
regimes and the untreated control (Fig. 1C). The effect of
L. hesperus control on predator:prey ratios was consis-
tent and no interactionwith time was detected (P > 0:05).PRC for B. tabaci control regimes based on the first
axis of the redundancy analysis were significant
(P < 0:01) and explained 38% of the variation due totreatment regime (Fig. 3A). The second axis explained
an additional 13% of the variance, but was not signifi-
cant (P ¼ 0:41). Contrasts based on permutation tests
Fig. 3. Principal response curves (PRC) showing the main effects of (A) wh
shown), and (B) L. hesperus control (only post-application dates for L. hes
during the growing season, 1998, Maricopa, AZ. The PRC show the effect o
represented by the y ¼ 0 line. The greater the species weight the more the resp
opposite pattern and weights between )0.5 and 0.5 indicate a weak response o
of the PRC analysis over all dates based on an F -type permutation test. The p
of the indicated contrast on each date determined by F -type permutation test;
buprofezin (B), pyriproxyfen (P), or conventional insecticides for whitefly (C
two IGRs on any date and so contrasts are not shown.
for all sample dates combined indicated that the con-ventional, but not the IGR regimes, significantly re-
duced (P < 0:05) the overall density of predators
compared with the untreated control. Predator densities
also were significantly lower (P < 0:05) in conventional
compared with the IGR regimes. There was no differ-
ence (P > 0:05) between the two IGR regimes. Date by
date contrasts indicated that the IGR regimes differed
from the control on a singe date in early September wellafter insecticide applications. In contrast, a single
application of conventional insecticides in early August
initially reduced predator densities for two weeks
itefly control (only post-application dates for whitefly insecticides are
perus insecticides are shown) on the predatory arthropod community
f each treatment regime relative to the untreated control (Co) which is
onse for that species resembles the PRC. Negative weights indicate an
r a response unrelated to the PRC. The P -value denotes the significancelus symbols at the base of each graph denote the significance (P < 0:05)
letters along the top of each graph denote the timing of applications of
) or L. hesperus (T). There were no significant differences between the

S.E. Naranjo et al. / Biological Control 30 (2004) 52–72 63
following the spray and led to significant reductions(P < 0:05) from early to mid-September. Species weights
indicate that the PRC were representative of 11 out of 20
taxa with the highest weights associated with D. nr.
divergens, L. hesperus, P. seriatus, O. tristicolor, M.
celer, and G. punctipes (Fig. 3A). Repeated applications
of conventional insecticides for control of L. hesperus
had a strong negative effect on predator populations
throughout the entire season with marked reductionsfollowing each of the three applications in mid to late
July and mid-August (Fig. 3B). The PRC based on the
first axis of the redundancy analysis was highly signifi-
cant (P < 0:01) and explained 68% of the variation due
to insecticide application for L. hesperus. The second
axis explained an additional 13%, but was not significant
(P ¼ 0:18). Species weights indicate that the PRC were
representative of 11 out of 18 taxa with the highestweights associated with M. celer, D. nr. divergens, G.
punctipes, salticid spiders, Z. renardii and O. tristicolor
(Fig. 3B).
3.2.3. 1999
Seasonal average densities of four out of 19 predator
taxa were significantly reduced (P < 0:05) in the IGR
regimes compared with the control including M. celer,other coccinellids, C. carnea s.l. and D. nr. divergens
(Table 5). In contrast, densities of nine predator taxa
were significantly reduced (P < 0:05) in the conventional
regime compared with the control (Table 5). Seasonal
average densities of 10 predator taxa were significantly
higher (P < 0:05) in the IGR compared with the con-
ventional regime (Table 5). There were no significant
(P > 0:05) differences between the two IGR regimes forany predator taxa. L. hesperus control significantly
(P < 0:05) reduced the densities of 12 predator taxa
(Table 5). The seasonal average density of the target, L.
hesperus, was reduced by about 52%.
Predator densities varied significantly (P < 0:05) overthe growing season, and significant time by B. tabaci
control regime interactions were observed for six taxa.
In most cases these interactions resulted from inconsis-tent treatment effects that occurred at relatively low
densities. Significant time by L. hesperus control inter-
actions were detected for O. tristicolor and D. nr. div-
ergens. For the former, the interaction arose due to an
increase in density in the sprayed regime on a single date
in early September. For D. nr. divergens reductions in
density in the sprayed plots were magnified on the last
two sampling dates.All predator:prey ratios were significantly higher
(P < 0:05) in the IGR compared with the control, and
ratios based on nymphs and all stages combined were
significantly higher (P < 0:05) in IGR compared with
the conventional regime (Table 5). The nymphal-based
ratio was higher in the control compared with the con-
ventional regime; all ratios were similar between the
IGR regimes. Predator:prey ratios varied over time, andsignificant treatment differences (P < 0:05) were ob-
served on the final three sampling dates (Fig. 1E.). Ra-
tios were generally higher in IGR and lowest in
conventional regimes over most of the growing season.
Predator:prey ratios based on eggs, nymphs, and on all
stages combined were significantly reduced (P < 0:05)with the addition of insecticides for L. hesperus control,
and this pattern was generally consistent over the season(Table 5, Fig. 1F). There were significant (P < 0:05) time
by B. tabaci control regime interactions resulting pri-
marily from the variable effects between the two IGR
regimes and the inconsistent pattern in the control rel-
ative to the conventional regime (Fig. 1E). There was a
significant (P < 0:05) time by L. hesperus control inter-
action that was due mainly to the response in the un-
treated control on the third sampling date (Fig. 1F).PRC for the B. tabaci control regime based on the first
axis of the redundancy analysis were highly significant
(P < 0:01) and explained 51% of the variation due to
treatment regime. The second axis explained an addi-
tional 12% of the variance, but was not significant
(P ¼ 0:27). Contrasts based on permutation tests for all
sample dates combined indicated that both the IGR and
conventional regimes significantly reduced (P < 0:05) theoverall density of the predator community compared
with the untreated control (Fig. 4A). However, again,
reductions in predator density were significantly greater
(P < 0:05) in the conventional compared with the IGR
regimes. There was no difference (P > 0:05) between the
two IGR regimes. Date by date contrasts showed that
the IGR regimes differed from the control on two sample
dates towards the latter part of the growing season manyweeks following insecticide applications (Fig. 4A). In the
conventional regime significant reductions in predator
densities were associated with each of the three insecti-
cide applications. Species weights indicate that the PRC
were most representative of M. celer, G. punctipes, L.
hesperus, O. tristicolor, D. nr. divergens, C. carnea s.l.,
other coccinellids and spiders, and Collops vittatus Say
(Fig. 4A). Repeated applications of insecticides forcontrol of L. hesperus negatively affected predator pop-
ulations throughout the entire season with marked re-
ductions following each application (Fig. 4B). PRC
based on the first axis of the redundancy analysis was
highly significant (P < 0:01) and explained 76% of the
variation. The second axis explained an additional 14%,
but again, was not significant (P ¼ 0:15). Species weightsindicate that the PRC was most representative of D. nr.divergens, O. tristicolor, G. punctipes, M. celer, C. carnea
s.l., H. convergens, and several spider taxa (Fig. 4B).
3.3. Parasitoid populations and parasitism
Eretmocerus eremicus Rose and Zolnerowich and
Encarsia spp. (mainly E. meritoria Gahan) were found
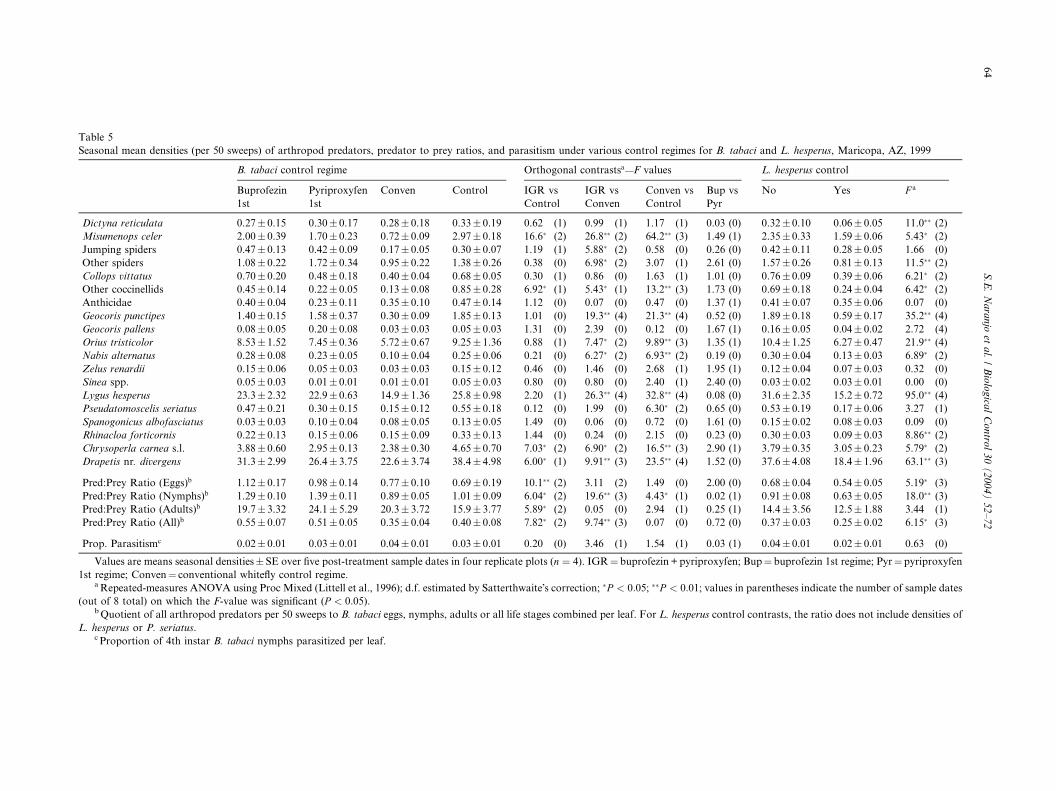
Table 5
Seasonal mean densities (per 50 sweeps) of arthropod predators, predator to prey ratios, and parasitism under various control regimes for B baci and L. hesperus, Maricopa, AZ, 1999
B. tabaci control regime Orthogonal contrastsa—F values L. hesperus control
Buprofezin
1st
Pyriproxyfen
1st
Conven Control IGR vs
Control
IGR vs
Conven
Conven vs
Control
Bup
Pyr
No Yes F a
Dictyna reticulata 0.27� 0.15 0.30� 0.17 0.28� 0.18 0.33� 0.19 0.62 (1) 0.99 (1) 1.17 (1) 0.03 0.32� 0.10 0.06� 0.05 11.0�� (2)
Misumenops celer 2.00� 0.39 1.70� 0.23 0.72� 0.09 2.97� 0.18 16.6� (2) 26.8�� (2) 64.2�� (3) 1.49 2.35� 0.33 1.59� 0.06 5.43� (2)
Jumping spiders 0.47� 0.13 0.42� 0.09 0.17� 0.05 0.30� 0.07 1.19 (1) 5.88� (2) 0.58 (0) 0.26 0.42� 0.11 0.28� 0.05 1.66 (0)
Other spiders 1.08� 0.22 1.72� 0.34 0.95� 0.22 1.38� 0.26 0.38 (0) 6.98� (2) 3.07 (1) 2.61 1.57� 0.26 0.81� 0.13 11.5�� (2)
Collops vittatus 0.70� 0.20 0.48� 0.18 0.40� 0.04 0.68� 0.05 0.30 (1) 0.86 (0) 1.63 (1) 1.01 0.76� 0.09 0.39� 0.06 6.21� (2)
Other coccinellids 0.45� 0.14 0.22� 0.05 0.13� 0.08 0.85� 0.28 6.92� (1) 5.43� (1) 13.2�� (3) 1.73 0.69� 0.18 0.24� 0.04 6.42� (2)
Anthicidae 0.40� 0.04 0.23� 0.11 0.35� 0.10 0.47� 0.14 1.12 (0) 0.07 (0) 0.47 (0) 1.37 0.41� 0.07 0.35� 0.06 0.07 (0)
Geocoris punctipes 1.40� 0.15 1.58� 0.37 0.30� 0.09 1.85� 0.13 1.01 (0) 19.3�� (4) 21.3�� (4) 0.52 1.89� 0.18 0.59� 0.17 35.2�� (4)
Geocoris pallens 0.08� 0.05 0.20� 0.08 0.03� 0.03 0.05� 0.03 1.31 (0) 2.39 (0) 0.12 (0) 1.67 0.16� 0.05 0.04� 0.02 2.72 (4)
Orius tristicolor 8.53� 1.52 7.45� 0.36 5.72� 0.67 9.25� 1.36 0.88 (1) 7.47� (2) 9.89�� (3) 1.35 10.4� 1.25 6.27� 0.47 21.9�� (4)
Nabis alternatus 0.28� 0.08 0.23� 0.05 0.10� 0.04 0.25� 0.06 0.21 (0) 6.27� (2) 6.93�� (2) 0.19 0.30� 0.04 0.13� 0.03 6.89� (2)
Zelus renardii 0.15� 0.06 0.05� 0.03 0.03� 0.03 0.15� 0.12 0.46 (0) 1.46 (0) 2.68 (1) 1.95 0.12� 0.04 0.07� 0.03 0.32 (0)
Sinea spp. 0.05� 0.03 0.01� 0.01 0.01� 0.01 0.05� 0.03 0.80 (0) 0.80 (0) 2.40 (1) 2.40 0.03� 0.02 0.03� 0.01 0.00 (0)
Lygus hesperus 23.3� 2.32 22.9� 0.63 14.9� 1.36 25.8� 0.98 2.20 (1) 26.3�� (4) 32.8�� (4) 0.08 31.6� 2.35 15.2� 0.72 95.0�� (4)
Pseudatomoscelis seriatus 0.47� 0.21 0.30� 0.15 0.15� 0.12 0.55� 0.18 0.12 (0) 1.99 (0) 6.30� (2) 0.65 0.53� 0.19 0.17� 0.06 3.27 (1)
Spanogonicus albofasciatus 0.03� 0.03 0.10� 0.04 0.08� 0.05 0.13� 0.05 1.49 (0) 0.06 (0) 0.72 (0) 1.61 0.15� 0.02 0.08� 0.03 0.09 (0)
Rhinacloa forticornis 0.22� 0.13 0.15� 0.06 0.15� 0.09 0.33� 0.13 1.44 (0) 0.24 (0) 2.15 (0) 0.23 0.30� 0.03 0.09� 0.03 8.86�� (2)
Chrysoperla carnea s.l. 3.88� 0.60 2.95� 0.13 2.38� 0.30 4.65� 0.70 7.03� (2) 6.90� (2) 16.5�� (3) 2.90 3.79� 0.35 3.05� 0.23 5.79� (2)
Drapetis nr. divergens 31.3� 2.99 26.4� 3.75 22.6� 3.74 38.4� 4.98 6.00� (1) 9.91�� (3) 23.5�� (4) 1.52 37.6� 4.08 18.4� 1.96 63.1�� (3)
Pred:Prey Ratio (Eggs)b 1.12� 0.17 0.98� 0.14 0.77� 0.10 0.69� 0.19 10.1�� (2) 3.11 (2) 1.49 (0) 2.00 0.68� 0.04 0.54� 0.05 5.19� (3)
Pred:Prey Ratio (Nymphs)b 1.29� 0.10 1.39� 0.11 0.89� 0.05 1.01� 0.09 6.04� (2) 19.6�� (3) 4.43� (1) 0.02 0.91� 0.08 0.63� 0.05 18.0�� (3)
Pred:Prey Ratio (Adults)b 19.7� 3.32 24.1� 5.29 20.3� 3.72 15.9� 3.77 5.89� (2) 0.05 (0) 2.94 (1) 0.25 14.4� 3.56 12.5� 1.88 3.44 (1)
Pred:Prey Ratio (All)b 0.55� 0.07 0.51� 0.05 0.35� 0.04 0.40� 0.08 7.82� (2) 9.74�� (3) 0.07 (0) 0.72 0.37� 0.03 0.25� 0.02 6.15� (3)
Prop. Parasitismc 0.02� 0.01 0.03� 0.01 0.04� 0.01 0.03� 0.01 0.20 (0) 3.46 (1) 1.54 (1) 0.03 0.04� 0.01 0.02� 0.01 0.63 (0)
Values are means seasonal densities� SE over five post-treatment sample dates in four replicate plots (n ¼ 4). IGR¼ buprofezin+pyriproxy Bup¼ buprofezin 1st regime; Pyr¼pyriproxyfen
1st regime; Conven¼ conventional whitefly control regime.aRepeated-measures ANOVA using Proc Mixed (Littell et al., 1996); d.f. estimated by Satterthwaite�s correction; �P < 0:05; ��P < 0:01; valu parentheses indicate the number of sample dates
(out of 8 total) on which the F-value was significant (P < 0:05).bQuotient of all arthropod predators per 50 sweeps to B. tabaci eggs, nymphs, adults or all life stages combined per leaf. For L. hesperus co l contrasts, the ratio does not include densities of
L. hesperus or P. seriatus.c Proportion of 4th instar B. tabaci nymphs parasitized per leaf.
64
S.E.Naranjo
etal./Biologica
lContro
l30(2004)52–72
. ta
vs
(0)
(1)
(0)
(0)
(0)
(0)
(1)
(0)
(1)
(1)
(0)
(1)
(0)
(0)
(0)
(0)
(0)
(1)
(0)
(0)
(1)
(1)
(0)
(1)
fen;
es in
ntro

Fig. 4. Principal response curves (PRC) showing the main effects of (A) whitefly control (only post-application dates for whitefly insecticides are
shown), and (B) L. hesperus control (only post-application dates for L. hesperus insecticides are shown) on the predatory arthropod community
during the growing season, 1999, Maricopa, AZ. The PRC show the effect of each treatment regime relative to the untreated control (Co) which is
represented by the y ¼ 0 line. The greater the species weight the more the response for that species resembles the PRC. Negative weights indicate an
opposite pattern and weights between )0.5 and 0.5 indicate a weak response or a response unrelated to the PRC. The P -value denotes the significanceof the PRC analysis over all dates based on an F -type permutation test. The plus symbols at the base of each graph denote the significance (P < 0:05)
of the indicated contrast on each date determined by F -type permutation test; letters along the top of each graph denote the timing of applications of
buprofezin (B), pyriproxyfen (P), or conventional insecticides for whitefly (C) or L. hesperus (T). There were no significant differences between the
two IGRs on any date and so contrasts are not shown.
S.E. Naranjo et al. / Biological Control 30 (2004) 52–72 65
attacking B. tabaci at our study site. Eretmocerus spp.
were dominant, comprising over 85, 59, and 55% of all
parasitoids sampled in 1997, 1998, and 1999, respec-
tively. As with predators there were no significant
(P > 0:05) interactions between B. tabaci and L. hes-
perus control regimes in parasitism rates and so only
main effects are presented. The proportion of parasitized
hosts varied widely in 1997 ranging from <0.05 on
several sample dates in all regimes to >0.30 by mid-
August in the pyriproxyfen regime (Fig. 5A). Averaged
over the season, there were few significant differences
among whitefly control regimes with the highest rate of
parasitism being observed in the pyriproxyfen regime
(Tables 2 and 3). In 1998, rates of parasitism increased
steadily over the season in all whitefly control regimes
with rates exceeding 0.25 by mid September (Fig. 5C).
Seasonal average rates of parasitism did not differ sig-
nificantly (P > 0:05) among whitefly control regimes(Table 4), although rates of parasitism differed signifi-
cantly, but not consistently, on several sample dates.
Rates of parasitism were low in 1999, rarely exceeding
0.10 in any regime and there were no significant differ-
ences (P > 0:05) among whitefly control regimes (Table
5, Fig. 5E). The rate of parasitism was significantly
higher with L. hesperus suppression in 1997 (Table 2),
but significantly higher without L. hesperus control in

Fig. 5. The main effects of B. tabaci (A, C, E) and L. hesperus (B, D, F) control regimes on proportional parasitism by aphelinid parasitoids attacking
B. tabaci during the growing season, 1997–1999, Maricopa, AZ. Only post-application dates for whitefly insecticides are shown. Asterisks along the
bottom of each graph denote dates on which significant (P < 0:05) treatment differences were observed; letters along the top of each graph denote the
timing of applications of buprofezin (B), pyriproxyfen (P) or conventional (C) insecticides. Results in A are based solely on data from split-plots
receiving L. hesperus control, because the split-plot design was incomplete in 1997.
66 S.E. Naranjo et al. / Biological Control 30 (2004) 52–72
1998 (Table 4). These patterns resulted largely from
relatively small differences in parasitism on several
sample dates and the differing intervals between samples
and L. hesperus spray applications in the two years(Figs. 5B and D). There was no effect (P > 0:05) of L.hesperus control on rates of parasitism in 1999 (Table 5,
Fig. 5F).
Rates of parasitism varied significantly (P < 0:05)over time, and there were significant whitefly control
regime by date interactions in all years. These interac-
tions were due to the inconsistent effects of the treatment
regimes over the course of each season (Fig. 5). There
were no significant (P > 0:05) interactions between L.
hesperus control regimes and time.
3.4. Overall impact of insecticides
To summarize results from all three years, indices
were calculated based on statistically significant changes
in seasonal densities of each predator taxa, rates of
parasitism, and predator:prey ratios relative to the
untreated control (Table 6). M. celer, other coccinellids,

Table 6
Meta-analysis of the effect of B. tabaci and L. hesperus control on arthropod predators, predator to prey ratios, and parasitism over a three year
period, Maricopa, AZ, 1997–1999
B. tabaci control regime L. hesperus control
IGR 1st Conventional
Dictyna reticulata 0a (0.74) 0 (0.28) )0.46 (0.37)
Misumenops celer )0.13 (0.85) )0.58 (0.42) )0.48 (0.52)
Jumping spiders 0 (1.81) 0 (0.54) )0.10 (0.69)
Other spiders 0.18 (1.13) )0.31 (0.73) )0.28 (0.60)
Collops vittatus 0 (0.80) )0.46 (0.40) )0.16 (0.65)
Hippodamia convergens 0 (0.59) 0 (0.23) )0.22 (0.44)
Other coccinellids )0.20 (0.84) )0.28 (0.67) )0.53 (0.27)
Anthicidae 0 (1.20) )0.26 (0.55) 0 (0.88)
Geocoris punctipes )0.22 (0.70) )0.69 (0.31) )0.68 (0.32)
Geocoris pallens 0 (1.37) )0.22 (0.65) )0.38 (0.37)
Orius tristicolor 0 (0.85) )0.42 (0.58) )0.18 (0.80)
Nabis alternatus )0.24 (0.78) )0.47 (0.34) )0.36 (0.75)
Zelus renardii 0 (0.70) )0.30 (0.38) )0.15 (0.61)
Sinea spp. 0 (0.89) )0.32 (0.75) 0 (0.80)
Lygus hesperus )0.14 (0.84) )0.42 (0.58) )0.48 (0.52)
Pseudatomoscelis seriatus 0 (0.69) )0.69 (0.31) )0.39 (0.38)
Spanogonicus albofasciatus )0.21 (0.69) )0.25 (0.41) 0 (0.76)
Rhinacloa forticornis 0 (0.45) 0 (0.39) )0.43 (0.23)
Chrysoperla carnea s.l. )0.25 (0.71) )0.37 (0.63) )0.31 (0.69)
D. nr. divergens )0.24 (0.71) )0.44 (0.56) )0.45 (0.55)
Pred:Prey Ratio (Eggs) 0.17 (1.40) 0 (1.19) )0.25 (0.75)
Pred:Prey Ratio (Nymphs) 0.37 (1.40) 0.04 (0.97) )0.30 (0.70)
Pred:Prey Ratio (Adults) 0.49 (1.49) 0.19 (1.40) )0.14 (0.79)
Pred:Prey Ratio (All) 0.11 (1.32) 0 (1.06) )0.31 (0.69)
Proportional parasitism 0 (1.02) 0 (1.00) 0.12 (0.95)
a Index is calculated as the mean of pisi over all three years, where p is the proportional change in predator density, parasitism, or the predator–
prey ratio in a given insecticide regime relative to the control in year i and s is a dummy variable indicating the statistical significance (s ¼ 1) or non-
significance (s ¼ 0) of the reduction based on ANOVA results in year i. Values in parentheses indicate the mean (all years) density, ratio or parasitism
rate as a proportion of the control level.
S.E. Naranjo et al. / Biological Control 30 (2004) 52–72 67
G. punctipes, N. alternatus, L. hesperus, S. albofasciatus,
C. carnea s.l., and D. nr. divergens were all significantly
reduced by the use of either IGR regime relative to the
control in at least one year. For the ‘‘other spiders’’
group, densities were significantly higher under the IGRregimes. These same predators plus eight additional taxa
were significantly reduced by the conventional insecti-
cide regime relative to the control. In all instances the
negative impact of conventional insecticides was greater
than that of the IGRs. Mean predator population den-
sities in insecticide regimes viewed as a proportion of the
untreated control (Table 6, values in parentheses) fur-
ther emphasize the selective nature of the IGRs. Averagedensities of some taxa (jumping spiders, other spiders,
anthicid beetle, G. pallens) were higher in the IGR re-
gimes than in the untreated control. Predator:prey ratios
based on each B. tabaci stage separately and all stages
combined increased with the use of IGRs with changes
being largest for ratios based on nymphs and adults.
Predator:prey ratios based on nymphs or adults in-
creased slightly in the conventional regime comparedwith the control and were 1.3 to 1.5 times higher in IGR
regimes than in the control. With the exception of
anthicid beetles, Sinea spp. and S. albofasciatus, the
application of insecticides for control of L. hesperus
significantly reduced densities of all predator taxa and
all predator:prey ratios (Table 6). In many cases these
reductions were relatively large. Parasitism increasedslightly with L. hesperus control, but was unaffected by
any whitefly insecticide regime.
4. Discussion
Enhancing the role of biological control within in-
secticide-dominated management systems will requireinsecticides and application methods that improve
physiological and/or ecological selectivity. We have
shown that simple adjustments in action thresholds
for application of conventional insecticides against
B. tabaci in cotton can reduce disruption of natural
enemy populations (Naranjo et al., 2002). Commercial-
scale field studies have also shown that management
strategies based on the initial use of the IGRsbuprofezin and pyriproxyfen preserves natural enemies
compared with sole reliance on conventional insecticide

68 S.E. Naranjo et al. / Biological Control 30 (2004) 52–72
mixtures (Naranjo et al., 2003). Our results here con-firm and augment these findings, and further quantify
the selectivity of these IGRs relative to an untreated
control.
We observed significant and immediate reductions in
densities of most of the natural enemies examined over
extended portions of the growing season with use of
broad-spectrum, conventional insecticides. Conversely,
the initial use of either buprofezin and pyriproxyfen forpest control conserved natural enemies, particularly ar-
thropod predators. Nonetheless, densities of some
predator taxa were reduced with use of the two IGRs in
comparison with the untreated control. Densities of C.
carnea s.l., D. nr. divergens, several spiders and coccin-
ellids, the heteropteran predators G. punctipes and N.
alternatus, and the omnivores L. hesperus and S. albo-
fasciatus were significantly reduced under IGR regimesin at least one out of three years. In most instances,
reductions in these taxa were much greater with use of
conventional insecticides. Further, PRC analyses sug-
gest that significant reductions in predator densities
started many weeks after IGR applications. In 1997
reductions in the IGR regimes were associated with
sprays of conventional insecticides in these regimes in
early to mid-September (see Fig. 2A). However, onlysingle applications of either buprofezin or pyriproxyfen
were required in the IGR control regimes in 1998 and
1999 and reductions only occurred after 5 and 3 weeks,
respectively (see Figs. 3A and 4A). These patterns sug-
gest that reductions in predator populations may have
been associated with more subtle and latent toxicologi-
cal effects, and/or various indirect effects such as a re-
duction in prey density.Field studies of insecticide effect on natural enemies
integrate many factors, including direct toxicological ef-
fects and indirect effects such as reductions in prey
availability. Direct toxicological effects of both IGRs
have been shown in laboratory bioassays of various
natural enemy species. Buprofezin reduced survival and
prolonged development in first instar C. rufilabris (Bur-
meister) (Liu and Chen, 2000) and pyriproxyfen hadsimilar effects on eggs and larvae (Chen and Liu, 2002).
However, Balasubramani and Regupathy (1994) re-
ported no effect of buprofezin on larval stages of C. car-
nea. Pyriproxyfen suppressed adult emergence of Podisus
maculiventris (Say) (Declercq et al., 1995) and egg hatch
in Elatophilus hebraicus Pericart (Mendel et al., 1994).
Pyriproxyfen exposure in the nymphal stage caused some
deformities in adult G. punctipes, but not O. insidiosus
(Say), and no effects on reproduction were observed for
either species (Naranjo and Prabhaker, unpublished).
Likewise, Delbeke et al. (1997) andNagai (1990) reported
no effects of pyriproxyfen on several Orius spp. Bu-
profezin had no measurable effects on survival, molting
or reproduction of G. punctipes orO. insidiosus (Naranjo
and Prabhaker, unpublished). The most dramatic nega-
tive effects of these IGRs have been demonstrated forcoccinellid beetles inhabiting perennial systems (Hattingh
and Tate, 1995; Magagula and Samways, 2000; Mendel
et al., 1994; Smith et al., 1999). Although coccinellids
were rare at our study site, we observed no consistent
negative effects of either IGR on these taxa.
Although direct toxicological effects of these IGRs
cannot be dismissed, the relatively long interval (3–5
weeks) between application of either buprofezin orpyriproxyfen and reductions in predator populations
suggests that other factors, such as reductions in prey
density, may play a greater role. Many of the predators
we examined are general feeders (van den Bosch and
Hagen, 1966; Whitcomb and Bell, 1964), and B. tabaci
is one of the most abundant arthropods occurring in
our study area. Densities of B. tabaci nymphs were
reduced soon after the application of either IGR, andegg and adult densities dropped within several weeks
following applications. The gradual decline in predator
populations in the IGR regimes relative to the untreated
control over the season (see Figs. 2–4) was coincident
with a similar decline in densities of whitefly prey. In
contrast, immediate reductions in many predator taxa
followed applications of conventional insecticides for
whitefly suppression. The more consistent declines inC. carnea s.l., and D. nr. divergens in the IGR regimes
may be related to the stronger affinity of these predators
with whitefly prey. The empidid fly D. nr. divergens sp.
was first discovered in association with large popula-
tions of B. tabaci in Arizona cotton and preliminary
laboratory studies suggested that they could suppress
adult B. tabaci and subsequent oviposition (Butler
and Henneberry, 1993). Further laboratory feedingstudies suggest that this species prefers to prey on adult
B. tabaci (Hagler, 2002). C. carnea s.l. readily feeds on
B. tabaci (Butler and Henneberry, 1988), and adult
lacewings are known to be attracted to insect honey-
dews and artificial sugar supplements (e.g., Evans and
Swallow, 1993; Hagen, 1986). Reductions in one of the
most abundant prey in the system also may have
increased opportunities for intraguild predation (Eu-banks, 2001; Rosenheim et al., 1993) among predator
species, further contributing to reductions in densities of
some predators.
Rates of parasitism by aphelinid wasps were generally
low, and neither the conventional nor IGR control re-
gimes altered parasitism in a consistent manner. In
contrast, a commercial-scale study showed that rates of
parasitism were higher in fields sprayed with either bu-profezin or pyriproxyfen compared with those sprayed
with conventional insecticides (Naranjo et al., 2003).
Field studies in Israel and southern California showed
that rates of parasitism were unaffected by the use
of broad-spectrum insecticides (Gerling and Naranjo,
1998). Because hosts must be present to measure
parasitism, they suggested that insecticides affected

S.E. Naranjo et al. / Biological Control 30 (2004) 52–72 69
populations of both hosts and parasitoids equally, re-sulting in relatively stable levels of parasitism regardless
of treatment. It is not clear that such a phenomenon was
operating here as direct toxicological effects of the IGRs
on parasitoids in laboratory bioassays is equivocal.
Buprofezin caused mortality in early larval stages of
Encarsia luteola Howard, E. eremicus and E. tejanus
Rose and Zolnerowich (Gerling and Sinai, 1994; Hoddle
et al., 2001; Jones et al., 1998), and pyriproxyfen re-duced survival of young larvae of E. eremicus and E.
luteola (Gerling and Sinai, 1994; Hoddle et al., 2001)
and pupae of E. formosa Gahan (Liu and Stansly, 1997).
However, buprofezin was benign to adults of several
species of Eretmocerus and Encarsia (Hoddle et al.,
2001; Jones et al., 1995) and pyriproxyfen was non-toxic
to several species of Encarsia treated in the larval or
adult stage (Liu and Stansly, 1997). Reductions in hostdensity from insecticides may have influenced densities
and/or searching behaviors of adult parasitoids leading
to inconsistent changes in rates of parasitism. Lack of
treatment differences could also be related to the rela-
tively poor resolution provided by simple leaf samples
for measuring parasitism (Naranjo, 2001). Finally, the
relatively small size of plots in this study compared with
those of Naranjo et al. (2003) may have facilitated inter-plot movement of adult parasitoids.
Although parasitoid to host ratios remained relatively
consistent across treatments, higher ratios of predators
to whitefly prey were generally observed with the use of
IGRs compared with both the untreated control and the
conventional control regime. Thus, even though use of
the IGRs was associated with reductions in some pred-
ator populations, these materials were much more det-rimental to whiteflies leading to predator:prey ratios
more favorable to biological control. The tangible ben-
efits of this conservation were not estimated directly in
this study. However, in companion life table studies
conducted in the same plots, we have shown that rates of
natural enemy-induced mortality, primarily predation,
on immature B. tabaci were significantly higher with the
use of IGRs compared with conventional insecticidesand this additional mortality contributed significantly to
season-long suppression of B. tabaci in the IGR regimes
(Naranjo, 2001; Naranjo and Ellsworth, unpublished).
In addition, rates of predation in these life table studies
were positively correlated with predator abundance,
indicating that the level of conservation was directly
related to pest mortality.
Cotton agroecosystems are characterized by multiplekey pests. The use of transgenic cotton expressing Ba-
cillus thuringiensis Berliner toxins in our study elimi-
nated the need for additional insecticides for control of
pink bollworm, Pectinophora gossypiella (Saunders) and
other lepidopteran pests (Ellsworth and Jones, 2001).
Although we evaluated L. hesperus as a non-target insect
in terms of whitefly control, it is clear that this species
remains a continual threat to cotton production in Ar-izona and California and there are currently no selective
technologies for population suppression (Ellsworth,
2000). The addition of conventional insecticides for
control of L. hesperus here dramatically reduced popu-
lations of many natural enemies. Although the lack of
statistical interaction between whitefly and L. hesperus
control regimes indicated that selectivity of the IGRs for
whitefly control is realized even with the use of insecti-cides for L. hesperus, the overall benefits of this selec-
tivity were diminished. In practice, these results
emphasize the need to strictly follow available decision
aids for L. hesperus suppression (Ellsworth, 2000). In
research, our results highlight the importance of exam-
ining insecticide selectivity within the context of realistic
pest management systems.
Buprofezin and pyriproxyfen are currently an integralcomponent of pest management for B. tabaci in the
western US, and their use is being widely adopted in
Australian cotton where outbreaks of B. tabaci have
recently occurred (Kelly et al., 2002). They are highly
efficacious (Ellsworth and Naranjo, 1999; Ellsworth
et al., 1998), their use delays or eliminates the need for
conventional insecticides as part of an insecticide resis-
tance management plan (Dennehy and Williams, 1997;Ellsworth et al., 1996a), and, as we have shown, they are
highly selective. Pyriproxyfen and buprofezin were
granted full registration in 1998 and 2002, respectively,
and both materials are being widely used by producers
in Arizona (Agnew and Baker, 2001; Agnew et al., 2000;
Ellsworth and Martinez-Carrillo, 2001). The additional
use of transgenic cotton further conserves natural enemy
populations (Moar et al., 2002; Naranjo, 2002) therebyproviding for selective control of two key pests. Since
the introduction of these selective pest control methods
in 1996, insecticide use in Arizona cotton declined nearly
85% from 1995 to 1999 (Ellsworth and Jones, 2001). In
turn, this reduction in overall insecticide use in western
cotton production systems is enabling true integrated
control of B. tabaci, and may facilitate the further evo-
lution of biologically based management of many pestsfounded on conservation and other approaches to bio-
logical control.
Acknowledgments
We thank John Ruberson (Univ. Georgia) and
Walker Jones (USDA-ARS, Weslaco, TX) for helpfulcomments on earlier drafts of this manuscript, Bruce
Mackey (USDA-ARS, Albany, CA) for advice on sta-
tistical analyses, Kim Hoelmer (USDA-ARS, Montpel-
lier, France) for identification of parasitoids, and Robert
Nichols (Cotton Incorporated) for consistent and
crucial support of our whitefly management research.
We also thank Daniel Ashton, Virginia Barkley, Kim

70 S.E. Naranjo et al. / Biological Control 30 (2004) 52–72
Beimfohr, Jeff Cantrell, Sunny Carrington, RochelleChristensen, Shana England, Johnny Fearn, Celso Jara,
Stephanie Jones, Dan Langhorst, Scott Machtley, Jea-
nette Martin, Donna Meade, Gregory Owens, and Sally
Wright for expert technical assistance. Partial support
was provided by USDA-CREES, Pest Management
Alternatives Special Projects, NAPIAP (Western Re-
gion), Western Region IPM Special Projects, and Cot-
ton Incorporated.
References
Abdelrahman, A.A., Munir, B., 1989. Sudanese experience in
integrated pest management of cotton. Insect Sci. Appl. 10, 787–
794.
Agnew, C.W., Sterling, W.L., Dean, D.A., 1982. Influence of cotton
nectar on red imported fire ants and other predators. Environ.
Entomol. 11, 629–634.
Agnew, G.K., Baker, P.B., 2001. Pest and pesticide usage patterns in
Arizona cotton production. In: Dugger, P., Richter, D. (Eds.),
Proceedings Beltwide Cotton Conferences. National Cotton Coun-
cil, Memphis, Tennessee, pp. 1046–1054.
Agnew, G.K., Frisvold, G.B., Baker, P.B., 2000. Adoption of insect
growth regulators in Arizona cotton: determinants and economic
implications. In: Dugger, P., Richter, D. (Eds.), Proceedings
Beltwide Cotton Conferences. National Cotton Council, Memphis,
Tennessee, pp. 361–364.
Balasubramani, V., Regupathy, A., 1994. Safety of the insect growth
regulator buprofezin to the egg parasitoid Trichogramma chilonus
and the predator Chrysoperla carnea. In: Goel, S.C. (Ed.), Insect
and Environment V. 5: Biological control of insect pests. Uttar
Pradesh Zoological Society, India, pp. 177–180.
Butler Jr., G.D., 1965. Spanogonicus albofasciatus as an insect and mite
predator. J. Kansas Entomol. Soc. 38, 70–75.
Butler Jr., G.D., Henneberry, T.J., 1988. Laboratory studies on
Chrysopa carnea predation on Bemisia tabaci. Southwest. Entomol.
13, 165–170.
Butler Jr., G.D., Henneberry, T.J., 1993. Sweetpotato whitefly natural
enemies: parasite surveys in urban areas and cotton fields and
identification of a new predator. In: Cotton, A College of
Agriculture Report, Series P-94, University of Arizona, Tucson,
pp. 256–257.
Castane, C., Arino, J., Arno, J., 1996. Toxicity of some insecticides and
acaricides to the predatory bug Dicyphus tamaninii. Entomophaga
41, 211–216.
Chen, T.Y., Liu, T.X., 2002. Susceptibility of immature stages of
Chrysoperla rufilabris (Neurop., Chrysopidae) to pyriproxyfen, a
juvenile hormone analog. J. Appl. Entomol. 126, 125–129.
Croft, B.A., 1990. Arthropod Biological Control Agents and Pesti-
cides. Wiley, New York.
Declercq, P., Decock, A., Tirry, L., Vinuela, E., Degheele, D., 1995.
Toxicity of diflubenzuron and pyriproxyfen to the predatory bug
Podisus maculiventris. Entomol. Exp. Appl. 74, 17–22.
Delbeke, F., Vercruysse, P., Tirry, L., DeClercq, P., Degheele, D.,
1997. Toxicity of diflubenzuron, pyriproxyfen, imidacloprid and
diafenthiuron to the predatory bug Orius laevigatus (Het.: Antho-
coridae). Entomophaga 42, 349–358.
Dennehy, T.J., Williams, L., 1997. Management of resistance in
Bemisia in Arizona cotton. Pest. Sci. 51, 398–406.
Devine, G.J., Ishaaya, I., Horowitz, A.R., Denholm, I., 1998. Effects
of piperonyl butoxide on Bemisia tabaci Genn. (Homoptera :
Aleyrodidae): mortality, development, parasitism and predation in
Israeli cotton fields. Crop Prot. 17, 717–726.
Dhadialla, T.S., Carlson, G.R., Le, D.P., 1998. New insecticides with
ecdysteroidal and juvenile hormone activity. Annu. Rev. Entomol.
43, 545–569.
Ellsworth, P.C., 2000. Lygus control decision aids for Arizona cotton,
in: Cotton, A College of Agriculture Report, Series P-121,
University of Arizona, Tucson, pp. 269–280.
Ellsworth, P.C., Jones, J.S., 2001. Cotton IPM in Arizona: a decade of
research, implementation & education. In: Dugger, P., Richter, D.
(Eds.), Proceedings Beltwide Cotton Conferences. National Cotton
Council, Memphis, Tennessee, pp. 1088–1096.
Ellsworth, P.C., Martinez-Carrillo, J.L., 2001. IPM for Bemisia tabaci:
a case study from North America. Crop Prot. 20, 853–869.
Ellsworth, P.C., Naranjo, S.E., 1999. Whitefly management with insect
growth regulators and the influence of Lygus controls. In: Cotton,
A College of Agriculture Report, Series P-116, University of
Arizona, Tucson, pp. 339–354.
Ellsworth, P.C., Dennehy, T.J., Nichols, R.L., 1996a. Whitefly
management in Arizona cotton 1996, IPM Series No. 3, Publ.
196004, Cooperative Extension, University of Arizona, Tucson.
Ellsworth, P., Diehl, J., Dennehy, T., Naranjo, S., 1995. Sampling
sweetpotato whiteflies in cotton, IPM Series No. 2, Cooperative
Extension, University of Arizona, Tucson (revised).
Ellsworth, P.C., Diehl, J.W., Naranjo, S.E., 1996b. Sampling sweet-
potato whitefly nymphs in cotton, IPM Series No. 6, Cooperative
Extension, University of Arizona, Tucson.
Ellsworth, P.C., Naranjo, S.E., Castle, S.J., Hagler, J., Henneberry,
T.J., 1998. Whitefly management in Arizona: looking at whole
systems. In: Cotton, A College of Agriculture Report, Series P-112,
University of Arizona, Tucson, pp. 311–318.
Eubanks, M.D., 2001. Estimates of the direct and indirect effects of red
imported fire ants on biological control in field crops. Biol. Control
21, 35–43.
Evans, E.W., Swallow, J.G., 1993. Numerical responses of natural
enemies to artificial honeydew in Utah alfalfa. Environ. Entomol.
22, 1392–1401.
Faria, M., Wraight, S.P., 2001. Biological control of Bemisia tabaci
with fungi. Crop Prot. 20, 767–778.
Gerling, D., Mayer, R.T. (Eds.), 1996. Bemisia 1995: Taxonomy,
Biology, Damage, Control and Management. Intercept Limited,
Andover, UK.
Gerling, D., Naranjo, S.E., 1998. The effect of insecticide treatments in
cotton fields on the levels of parasitism of Bemisia tabaci
(Gennadius) sl. Biol. Control 12, 33–41.
Gerling, D., Sinai, P., 1994. Buprofezin effects on two parasitoid
species of whitefly (Homoptera, Aleyrodidae). J. Econ. Entomol.
87, 842–846.
Gerling, D., Alomar, O., Arn�o, J., 2001. Biological control of Bemisia
tabaci using predators and parasitoids. Crop Prot. 20, 779–799.
Hagen, K.S., 1986. Ecosystem analysis: plant cultivars (HPR),
entomophagous species and food supplements. In: Boethel, D.J.,
Eikenbary, R.D. (Eds.), Interactions of Plant Resistance and
Parasitoids and Predators of Insects. Ellis Horwood Limited,
Chichester, West Sussex, England, pp. 151–197.
Hagler, J.R., 2002. Foraging behavior, host stage selection and gut
content analysis of field collected Drapetis nr. divergens: a
predatory fly of Bemisia argentifolii. Southwest. Entomol. 27,
241–249.
Hagler, J.R., Naranjo, S.E., 1994a. Determining the frequency of
heteropteran predation on sweetpotato whitefly and pink bollworm
using multiple ELISAs. Entomol. Exp. Appl. 72, 63–70.
Hagler, J.R., Naranjo, S.E., 1994b. Qualitative survey of two
Coleopteran predators of Bemisia tabaci (Homoptera, Aleyrodi-
dae) and Pectinophora gossypiella (Lepidoptera, Gelechiidae) using
a multiple prey gut content ELISA. Environ. Entomol. 23, 193–
197.
Hattingh, V., Tate, B., 1995. Effects of field-weathered residues of
insect growth regulators on some Coccinellidae (Coleoptera) of

S.E. Naranjo et al. / Biological Control 30 (2004) 52–72 71
economic importance as biocontrol agents. Bull. Entomol. Res. 85,
489–493.
Hoddle, M.S., van Driesche, R.G., Lyon, S.M., Sanderson, J.P., 2001.
Compatibility of insect growth regulators with Eretmocerus erem-
icus for whitefly control on poinsettias: I. Laboratory assays. Biol.
Control 20, 122–131.
Hoelmer, K.A., 1996. Whitefly parasitoids: can they control
field populations of Bemisia? In: Gerling, D., Mayer, R.T.
(Eds.), Bemisia 1995: Taxonomy, Biology, Damage, Control
and Management. Intercept Limited, Andover, UK, pp. 451–
476.
Hoelmer, K.A., Kirk, A.A., 1999. An overview of natural enemy
explorations and evaluations for Bemisia in the U.S. Bull. OILB/
SROP (IOBC/WPRS) 22, 109–112.
Ishaaya, I., Horowitz, A.R., 1992. Novel phenoxy juvenile hormone
analog (pyriproxyfen) suppresses embryogenesis and adult emer-
gence of sweetpotato whitefly (Homoptera: Aleyrodidae). J. Econ.
Entomol. 85, 2113–2117.
Ishaaya, I., Mendelson, Z., Melamed-Madjar, V., 1988. Effect of
buprofezin on embryogenesis and progeny formation of sweetpo-
tato whitefly (Homoptera: Aleyrodidae). J. Econ. Entomol. 81,
781–784.
Jones, W.A., Ciomperlik, M.A., Wolfenbarger, D.A., 1998. Lethal and
sublethal effects of insecticides on two parasitoids attacking
Bemisia argentifolii (Homoptera: Aleyrodidae). Biol. Control 11,
70–76.
Jones, W.A., Wolfenbarger, D.A., Kirk, A.A., 1995. Response of adult
parasitoids of Bemisia tabaci to leaf residues of selected cotton
insecticides. Entomophaga 40, 153–162.
Kelly, D., Wilson, L., Parlato, D., 2002. Management of silverleaf
whitefly in Australian cotton. Australian Cotton Cooperative
Research Centre No. 13. Available from (URL: http://www.cot-
ton.crc.org.au/Assets/PDFfiles/Wflymng.pdf).
Kirk, A.A., Lacey, L.A., 1996. A systematic approach to foreign
exploration for natural enemies of Bemisia and some current
results. In: Gerling, D., Mayer, R.T. (Eds.), Bemisia 1995:
Taxonomy, Biology, Damage, Control and Management. Intercept
Limited, Andover, UK, pp. 531–533.
Kirk, A.A., Lacey, L.A., Goolsby, J.A., 2001. Classical biological
control of Bemisia and successful integration of management
strategies in the United States. In: Harris, K.F., Smith, O., Duffus,
J.E. (Eds.), Virus-Insect-Plant Interactions. Academic Press, San
Diego, CA, pp. 309–331.
Littell, R.C., Milliken, G.A., Stroup, W.W., Wolfinger, R.D., 1996.
SAS System for Mixed Models. SAS Institute, Cary, NC.
Liu, T.X., Chen, T.Y., 2000. Effects of the chitin synthesis inhibitor
buprofezin on survival and development of immatures of Chryso-
perla rufilabris (Neuroptera: Chrysopidae). J. Econ. Entomol. 93,
234–239.
Liu, T.X., Stansly, P.A., 1997. Effects of pyriproxyfen on three species
of Encarsia (Hymenoptera: Aphelinidae), endoparasitoids of
Bemisia argentifolii (Homoptera: Aleyrodidae). J. Econ. Entomol.
90, 404–411.
Magagula, C.N., Samways, M.J., 2000. Effects of insect growth
regulators on Chilocorus nigritus (Fabricius) (Coleoptera: Cocci-
nellidae), a non-target natural enemy of citrus red scale, Aonidiella
aurantii (Maskell) (Homoptera: Diaspididae), in southern Africa:
evidence from laboratory and field trials. African Entomol. 8, 47–
56.
Mendel, Z., Blumberg, D., Ishaaya, I., 1994. Effects of some insect
growth regulators on natural enemies of scale insects. Entomoph-
aga 39, 199–209.
Moar, W., Eubanks, M., Freeman, B., Turnipseed, S., Ruberson,
J., Head, G., Effects of Bt cotton on natural enemies in the
Southeast USA. In: Hoddle, M. (Ed.), Proceedings 3rd California
Conference on Biological Control, 15-16 August 2002, Davis, CA,
pp. 31–32.
Nagai, K., 1990. Effects of a juvenile hormone mimic material 4-
phenoxyphenyl (RS)-2(2-pyridyloxy) propyl ether, on Thrips
palmi and its predator Orius spp. Appl. Entomol. Zool. 25,
199–204.
Naranjo, S.E., 2001. Conservation and evaluation of natural
enemies in IPM systems for Bemisia tabaci. Crop Prot. 20, 835–
852.
Naranjo, S.E., 2002. Arthropod communities and transgenic cotton in
the Western US. In: Hoddle, M. (Ed.), Proceedings 3rd California
Conference on Biological Control, 15–16 August 2002, Davis, CA,
pp. 33–38.
Naranjo, S.E., Ellsworth, P.C. (Eds.), 2001. Challenges and opportu-
nities for pest management of Bemisia tabaci in the new century.
Crop Prot. (special issue) 20, 707–869.
Naranjo, S.E., Flint, H.M., 1994. Spatial distribution of preimaginal
Bemisia tabaci (Homoptera: Aleyrodidae) in cotton and develop-
ment of fixed-precision sequential sampling plans. Environ. Ento-
mol. 23, 254–266.
Naranjo, S.E., Flint, H.M., 1995. Spatial distribution of adult Bemisia
tabaci (Homoptera: Aleyrodidae) in cotton and development and
validation of fixed-precision sampling plans for estimating popu-
lation density. Environ. Entomol. 24, 261–270.
Naranjo, S.E., Ellsworth, P.C., Chu, C.C., Henneberry, T.J., 2002.
Conservation of predatory arthropods in cotton: role of action
thresholds for Bemisia tabaci. J. Econ. Entomol. 95, 682–
691.
Naranjo, S.E., Ellsworth, P.C., Chu, C.C., Henneberry, T.J., Riley,
D.G., Watson, T.F., Nichols, R.L., 1998. Action thresholds for the
management of Bemisia tabaci (Homoptera: Aleyrodidae) in
cotton. J. Econ. Entomol. 91, 1415–1426.
Naranjo, S.E., Hagler, J.R., Ellsworth, P.C., 2003. Improved
conservation of natural enemies with selective management
systems for Bemisia tabaci in cotton. Biocontrol Sci. Technol. 13,
571–587.
Newsom, L.D., Smith, R.F., Whitcomb, W.H., 1976. Selective
pesticides and selective use of pesticides. In: Huffaker, C., Messen-
ger, P. (Eds.), Theory and Practice of Biological Control. Academic
Press, New York, pp. 565–591.
Oliveira, M.R.V., Henneberry, T.J., Anderson, P., 2001. History,
current status, and collaborative research projects for Bemisia
tabaci. Crop Prot. 20, 709–723.
Palumbo, J.C., Horowitz, A.R., Prabhaker, N., 2001. Insecticidal
control and resistance management for Bemisia tabaci. Crop Prot.
20, 739–765.
Peleg, B.A., 1988. Effect of a new phenoxy juvenile hormone analog on
California red scale, Florida wax scale and the ectoparasite Aphytis
holoxanthus. J. Econ. Entomol. 81, 88–92.
Pener, M.P., 2002. Insect growth regulators. In: Pimentel, D. (Ed.),
Encyclopedia of Pest Management. Marcel Dekker, New York, pp.
398–401.
Rosenheim, J.A., Wilhoit, L.R., Armer, C.A., 1993. Influence of
intraguild predation among generalist insect predators on the
suppression of an herbivore population. Oecologia 96, 439–449.
Smith, K.M., Smith, D., Lisle, A.T., 1999. Effect of field-weathered
residues of pyriproxyfen on the predatory coccinellids Chilocorus
circumdatus and Cryptolaemus montrouzieri. Aust. J. Exp. Agric.
39, 995–1000.
Stern, V.M., Smith, R.F., van den Bosch, R., Hagen, K.S., 1959. The
integrated control concept. Hilgardia 29, 81–101.
Tauber, M.J., Tauber, C.A., Daane, K.M., Hagen, K.S., 2000.
Commercialization of predators: recent lessons from green
lacewings (Neuroptera: Chrysopidae: Chrysoperla). Am. Entomol.
46, 26–38.
Ter Braak, C.J.F., Smilauer, P., 1998. CANOCO Reference Manual
and User�s Guide to Canoco for Windows: Software for Canonical
Community Ordination (Version 4), Microcomputer Power, Ith-
aca, NY.

72 S.E. Naranjo et al. / Biological Control 30 (2004) 52–72
van den Bosch, R., Hagen, K.S., 1966. Predaceous and parasitic
arthropods in California cotton fields. California Agricultural
Experiment Station 820, 32 pp.
van den Brink, P.J., Ter Braak, C.J.F., 1998. Multivariate analysis of
stress in experimental ecosystems by Principal Response Curves
and similarity analysis. Aqua. Ecol. 32, 163–178.
van den Brink, P.J., Ter Braak, C.J.F., 1999. Principal response curves:
analysis of time-dependent multivariate responses of biological
communities to stress. Environ. Toxicol. Chem. 18, 138–148.
Whitcomb, W.H., Bell, K., 1964. Predaceous insects, spiders and mites
of Arkansas cotton fields. Arkansas Agricultural Experiment
Station Bulletin No. 690, 84 pp.