conomic & emographic assessment · the primary goal for the following assessment is to arrive...
TRANSCRIPT

Economic &
Demographic
Assessment
Prepared for the Las
Vegas Global Economic
Alliance | 2013

PREPARED FOR THE LAS VEGAS GLOBAL ECONOMIC ALLIANCE
Theory Into Practice Page | 1
1. Economic Assessment
METHODOLOGY
The primary goal for the following assessment is to arrive at a common understanding of the Las Vegas region’s unique economic strengths, weaknesses, opportunities
and threats (the region is defined as Clark County). This analysis is expressed in the context of the national economy as a means for understanding the region’s relative
position and highlighting its latent and potential competitive advantages.
For this socioeconomic assessment, TIP included an analysis of the following:
Demographics
Migration and mobility
Income and housing
Workforce
Economy, infrastructure, and tax base
In addition to this data assessment, TIP has also reviewed a number of separate economic development studies performed for the state and region, including:
Unify, Regionalize, Diversify: An Economic Development Agenda for Nevada, Brookings Institution, SRI International, UNLV
Moving Nevada Forward: A Plan for Excellence in Economic Development, 2012 – 2014, Nevada GOED
City of Las Vegas Downtown Centennial Plan (2009 Update), City of Las Vegas
City of Las Vegas Master Plan 2020, City of Las Vegas

PREPARED FOR THE LAS VEGAS GLOBAL ECONOMIC ALLIANCE
Theory Into Practice Page | 2
CLARK COUNTY, NEVADA
In the context of major population centers and shared resources
SOURCE: M apquest
ClarkNV
SoCalCA
BayArea
CA
PhoenixAZ
COLORADO RIVER
national defense
outdoorrecreation
outdoorrecreation

PREPARED FOR THE LAS VEGAS GLOBAL ECONOMIC ALLIANCE
Theory Into Practice Page | 3
WHAT ARE THE POPULATION GROWTH TRENDS IN THE VALLEY? D
emo
gra
ph
ics
■ According to the U.S. Census Bureau,
Clark County's population reached 1.97
million at mid-2011. The county's internal
estimates ran slightly ahead of the Census
Bureau's through most of the decade, but by
mid-2011 both sets of estimates converged
at 1.97 million.
■ Southern Nevada’s suburbs have become
major cities in their own right. Henderson's
population is now the same as Buffalo, New
York. North Las Vegas is now larger than
Birmingham, Alabama
Perspective
Like many metro areas, the population of the
county is growing at a faster rate than the
central city. This argues for close regional
cooperation and a clear understanding of
where development can occur within the city
itself.
For example, it should be noted that large
scale master-planned communities like
Summerlin, Green Valley Ranch, Anthem,
Southern Highlands, and Aliante drive this
growth.
Figure 1: Population changes since 2000
All estimates are US Census Bureau except where indicated below.
Source: US Census Bureau; Clark County Comptroller's Office, Comprehensive Annual Financial Report, FY 2011

PREPARED FOR THE LAS VEGAS GLOBAL ECONOMIC ALLIANCE
Theory Into Practice Page | 4
HOW DOES THE VALLEY SIZE UP NATIONALLY? D
emo
gra
ph
ics
■ Rapid population increases can bring
daunting administrative challenges. Clark
County has become the nation's 13th largest
in population. It now exceeds the population
of Manhattan Island (New York County, NY)
and Silicon Valley (Santa Clara County, CA).
▪▪▪▪
■ If Clark County were a state, it would rank
37th in population size, placing it just ahead
of West Virginia, Nebraska, Idaho, Hawaii,
plus 10 more states and the District of
Columbia.
Perspective
Seeing Las Vegas as a major population hub
offers opportunities in logistics and
distribution. It also calls for the organizational
capacity to handle large economic
development prospects. The RDA can think
of itself as an entity on par with other large
urban areas.
Figure 2: An urban adminstrative challenge
Now the nation's 13th largest county with more people than 14 states and the District of Columbia.
Source: US Census Bureau
Rank County Urban Area 2011 Population1 Los Angeles County, CA LA/Southern California ███████████████████████████████████████████████████████████████████████████████►
2 Cook County, IL Chicago █████████████████████████████████████████
3 Harris County, TX Houston █████████████████████████████████
4 Maricopa County, AZ Phoenix ███████████████████████████████
5 San Diego County, CA San Diego █████████████████████████
6 Orange County, CA LA/Southern California ████████████████████████
7 Miami-Dade County, FL Miami/South Florida ████████████████████
8 Kings County, NY New York City (Brooklyn) ████████████████████
9 Dallas County, TX Dallas-Fort Worth ███████████████████
10 Queens County, NY New York City (Queens) █████████████████
11 Riverside County, CA LA/Southern California █████████████████
12 San Bernardino County, CA LA/Southern California ████████████████
13 Clark County, NV Las Vegas ███████████████
14 King County, WA Seattle ███████████████
15 Tarrant County, TX Dallas-Fort Worth ██████████████
16 Santa Clara County, CA SF/Bay Area ██████████████
17 Wayne County, MI Detroit ██████████████
18 Broward County, FL Miami/South Florida ██████████████
19 Bexar County, TX San Antonio ██████████████
20 New York County, NY New York City (Manhattan) ████████████
Rank State 2011 Population35 Nevada █████████████████████
36 New Mexico ████████████████
— Clark County, NV ███████████████
37 West Virginia ██████████████
38 Nebraska ██████████████
39 Idaho ████████████
40 Hawaii ██████████
41 Maine ██████████
42 New Hampshire ██████████
43 Rhode Island ████████
44 Montana ███████
45 Delaware ███████
46 South Dakota ██████
47 Alaska █████
48 North Dakota █████
49 Vermont █████
50 District of Columbia ████
51 Wyoming ████
2,554,7662,532,645
2,239,6202,065,3771,969,9751,969,7221,849,8151,809,3781,802,0961,780,172
9,889,0565,217,0804,180,8943,880,2443,140,0693,055,745
1,601,948
2,416,0142,247,848
1,756,153
998,199
2,723,3222,082,2241,969,9751,855,3641,842,6411,584,9851,374,8101,328,1881,318,1941,051,302
568,158
907,135824,082722,718683,932626,431617,996

PREPARED FOR THE LAS VEGAS GLOBAL ECONOMIC ALLIANCE
Theory Into Practice Page | 5
HOW HAVE POPULATION GROWTH TRENDS CHANGED OVER THE LAST DECADE? D
emo
gra
ph
ics
■ The years of dramatic population growth
have ended for now. In the early years of the
decade, Clark County was adding 60,000-
70,000 (gross) new residents annually. Since
2009, the annual average had been closer to
20,000.
Perspective
The Southern Nevada economy was fueled
by tourism and housing construction. Slower
growth is, in many ways, a more desirable
state of affairs. It can effectively pave the
way for a restructured workforce and a more
diverse economy.
Figure 3: Net annual population gains
Change between Census mid-year estimates, 2000-2011.
Note: Net gains in 2010 are shown as the mid-point between 2009 & 2011 because mid-year estimates immediately following the decennial Census are
not directly comparable to previous estimates.
Source: US Census Bureau
State of Nevada Clark County
0
10,000
20,000
30,000
40,000
50,000
60,000
70,000
80,000
90,000
100,000
200
12
002
200
32
004
200
52
006
200
72
008
200
92
010
201
1
Clark County
Rest of Nevada
0
10,000
20,000
30,000
40,000
50,000
60,000
70,000
80,000
90,000
100,000
200
12
002
200
32
004
200
52
006
200
72
008
200
92
010
201
1
Rest of Clark County
City of Las Vegas

PREPARED FOR THE LAS VEGAS GLOBAL ECONOMIC ALLIANCE
Theory Into Practice Page | 6
HOW IS THE VALLEY EXPECTED TO GROW IN THE FUTURE? D
emo
gra
ph
ics
■ The most recent population forecast from
the state demographer's office shows
continued growth in Clark County over the
next two decades.
▪▪▪▪
■ The county's population growth sped up
between 1990 the 2007. In the coming post-
recession environment, the forecast shows
population growth falling back into the slower
pace experienced before 1990.
▪▪▪▪
■ According to this forecast, the county
would add nearly a half-million new residents
over the next 20 years, putting the Clark
County population just under 2.5 million by
2030.
Perspective
A certain skepticism is called for when
looking at long term forecasts. More
important than migration patterns is the
question of what kind of workers the
economy will attract.
Figure 4: Historical population and forecast
Source: US Census Bureau and Moody's Analytics (history) and Nevada State Demographer’s Office (projections)

PREPARED FOR THE LAS VEGAS GLOBAL ECONOMIC ALLIANCE
Theory Into Practice Page | 7
WHAT IS THE AGE DISTRIBUTION OF THE VALLEY? D
emo
gra
ph
ics
■ Even though Clark County's current age
structure is in line with the U.S., it is not
static. Demographic changes are underway
nationwide that can also be detected locally.
▪▪▪▪
■ In 1970, there were 8 children in Clark
County for every senior citizen. As baby
boomers retire over the next two decades,
the ratio will be something like 4 seniors for
every 7 children.
▪▪▪▪
■ Clark County's other residents—those of
working age—will hold fairly constant in
percentage terms. This age cohort
represented about 56% of the population in
1970 and it will in 2030 as well. The
differences will be more palpable at the
younger and older ends of the age spectrum.
Perspective
As the nation continues to age, the regions
that offer an abundance of skilled workers
will be more attractive to growing companies.
Figure 5: Comparative population distribution by age
Source: U.S. Census Bureau (2010 American Community Survey, 1-Year Estimates)

PREPARED FOR THE LAS VEGAS GLOBAL ECONOMIC ALLIANCE
Theory Into Practice Page | 8
WHAT IS THE ETHNIC AND RACIAL COMPOSITION OF THE REGION? D
emo
gra
ph
ics
■ Much like the rest of the nation, the ethnic
and racial composition of Clark County is
changing quickly. In 2000, the U.S. Census
Bureau’s decennial count of the population
showed that 22 percent of Clark County was
Hispanic or Latino. By 2010, that share had
increase to 29 percent.
▪▪▪▪
■ In comparison to the remainder of the
state and the US as a whole, Clark County
has a more ethnically and racially diverse
population.
Perspective
The rapid growth of the Hispanic population
in the region puts it well ahead of the nation.
This has implications for education and
workforce that extend well beyond, but
certainly include, economic issues.
Figure 6: The changing demographics of Clark County
Share of Clark County's Hispanic & non-Hispanic populations, 2000 & 2010
Source: U.S. Census Bureau (decennial)
Percent of the Clark County Nevada US
Population by
Race / Ethnicity
2010
22%
78%
2000
Hispanic
29%
71%
2010
48%
29%
10%
8%
4%
Anglo
Hispanic
Black
Asian
Other
54%
27%
8%
7%
4%
Anglo
Hispanic
Black
Asian
Other
64%
16%
12%
5%
2%
Anglo
Hispanic
Black
Asian
Other

PREPARED FOR THE LAS VEGAS GLOBAL ECONOMIC ALLIANCE
Theory Into Practice Page | 9
HOW MANY RESIDENTS ARE STUDENTS? D
emo
gra
ph
ics
■ Enrollment data for Clark County parallels
the U.S. in most educational categories
except higher education. A larger share of
U.S. residents is enrolled in higher education
programs (8%) than in either Nevada or
Clark County (6% each).
▪▪▪▪
■ Public school enrollment in Clark County
expanded briskly during the high population
growth years. Since the recession began,
enrollment in the county's public schools has
leveled off near 310,000 after a slight decline
from 2009 to 2010.
Perspective
The two percentage point gap between Clark
County and the nation in persons who are
enrolled in college should be troubling.
Employers continue to increase their
educational and/or certification requirements
for workers. If there is a perceived shortage
of highly educated workers in the region, it
will be considered at a competitive
disadvantage.
Figure 7: Enrollment overview
Sources: U.S. Census Bureau (2010 American Community Survey, 1-Year Estimates); Clark County Comptroller's Office, Comprehensive Annual
Financial Report, FY 2011
Current enrollment status of the population Public school enrollment counts in Clark County
2%
1%
1%
1%
1%
1%
11%
11%
11%
6%
5%
5%
8%
6%
6%
0% 5% 10% 15% 20% 25% 30%
USA
Nevada
ClarkCounty
Nursery & preschool
Kindergarten
Elementary school (grades 1-8)
High school (grades 9-12)
College or graduate school
240,000
250,000
260,000
270,000
280,000
290,000
300,000
310,000
320,000
200
2
200
3
200
4
200
5
200
6
200
7
200
8
200
9
201
0
201
1

PREPARED FOR THE LAS VEGAS GLOBAL ECONOMIC ALLIANCE
Theory Into Practice Page | 10
HOW EDUCATED IS THE VALLEY? D
emo
gra
ph
ics
■ Educational attainment levels for Nevada's
population echo the same trends seen in the
current enrollment statistics. A smaller share
of state and county residents (22%) has 4-
year degrees as compared to the U.S.
average (28%).
▪▪▪▪
■ On the other hand, a notably higher share
of residents at the state and county levels
(32%-33%) have a lesser level of college
experience, whether a completed vocational
or 2-year degree or progress toward a 4-year
degree. In the U.S. overall, this ratio is 29%
of the population.
Perspective
Higher education has become a critical
component for regions seeking a competitive
advantage in economic development. This is
true both for supplying a sufficient base of
talent as well as for providing opportunities in
research and innovation.
Figure 8: Educational attainment, 2010
Highest level of education achieved by the population age 25 or older.
Source: U.S. Census Bureau (2010 American Community Survey, 1-Year Estimates)
no high school diploma
high school diploma or GED
some college but less than a 4-year degree
bachelor's degree or higher
USA Nevada Clark County
14%
29%
29%
28%
15%
30%
33%
22% 16%
30%
32%
22%

PREPARED FOR THE LAS VEGAS GLOBAL ECONOMIC ALLIANCE
Theory Into Practice Page | 11
HOW DO DIFFERENT VARIABLES AFFECT THE VALLEY’S POPULATION GROWTH? M
igra
tio
n &
Mo
bili
ty
■ Natural increase (the excess of births over
deaths) has proven a stable and steady
contributor to the county's population growth,
but the more volatile component of net in-
migration tends to be the biggest driver of
population growth in most years.
■ Immigration peaked in the 1990s, but the
Census Bureau's annual estimates of net
domestic in-migration didn't begin to fade
until 2008. More recently domestic out-
migrants have outnumbered in-migrants by
modest amounts. For the next several years,
natural increases in the population are likely
to exceed in-migration.
Perspective
Demographic information matters most
directly when defining the current and future
workforce. Education is an imperfect proxy
for skills, but is widely used to evaluate the
competency of the workforce. Similarly, age
reflects wages (also imperfectly) and is a
good indication of where the overall
workforce is trending. In- and out-migration
help nuance this further.
Figure 9: Components of population growth
Sources: US Census Bureau; Moody's Analytics

PREPARED FOR THE LAS VEGAS GLOBAL ECONOMIC ALLIANCE
Theory Into Practice Page | 12
ARE MORE PEOPLE MOVING INTO TO CLARK COUNTY THAN MOVING OUT? M
igra
tio
n &
Mo
bili
ty
■ The US Internal Revenue Service tracks
changes in the number and location of
income tax exemptions. This administrative
data set (a bi-product of filing an annual tax
return) can be used to count the gross
number of people moving into and out of a
county over time.
▪▪▪▪
■ In Clark County, the number of inbound
movers peaked around 2006, and the
outbound count began climbing in 2008. By
2009, the annual counts of inbound and
outbound movers had flipped indicating a
pivotal near-term reversal in one of the
primary drivers of local population growth.
Perspective
Unfortunately, a significant lag exists in the
releasing of this data set, and it remains too
soon to tell if the region made a turnaround
in 2011 or if the decline of inbound migrants
continued. Other data, such as school
enrollment figures and population estimates,
suggest the region may now have reached a
state of equilibrium.
Figure 10: Clark County migration patterns
Annual changes in county-of-residence tabulated to show inbound versus outbound movers.
Sources: US Internal Revenue Service, county-to-county migration flows; Moody's Analytics

PREPARED FOR THE LAS VEGAS GLOBAL ECONOMIC ALLIANCE
Theory Into Practice Page | 13
WHERE IN CALIFORNIA HAVE PEOPLE MOVING TO CLARK COUNTY COME FROM? M
igra
tio
n &
Mo
bili
ty
■ The most dramatic shifts in inward
migration to Clark County can be traced to
Southern California, especially LA County,
where net flows fell by nearly 90% between
2006 and 2010.
▪▪▪▪
■ In both San Diego and Santa Clara
counties, historical patterns of inbound
migration to Clark County have reversed,
with narrow net outflows from Clark to those
California counties in the post-recession
years.
Perspective
An important question for the Las Vegas
region is whether it will be able to recover its
status as a destination for Southern
Californians. If it is unable to do so, the
region will need to increase its focus on
growing a skilled workforce from within.
Figure 11: California counties with historically high migration patterns INTO Clark County
Annual net migration into (out of) Clark County from the selected counties.
Sources: US Internal Revenue Service, county-to-county migration flows since 2005
inbound (net moving into Clark County)
outbound (net leaving Clark County)
+11500 +11500
+11000 +11000
+10500 +10500
+10000 +10000
+9500 +9500
+9000 +9000
+8500 +8500
+8000 +8000
+7500 +7500
+7000 +7000
+6500 +6500
+6000 +6000
+5500 +5500
+5000 +5000
+4500 +4500
+4000 +4000
+3500 +3500
+3000 +3000
+2500 +2500
+2000 +2000
+1500 +1500
+1000 +1000
+500 +500
0 0
-500 -500
CountyCounty CountyCountyCountyCountyCounty
California CaliforniaCaliforniaCaliforniaCaliforniaCalifornia
Los Angeles Orange Santa ClaraAlamedaRiversideSan DiegoSan Bernardino
California
2005 2010 2005 2010 2005 2010 2005 2010 2005 2010 2005 2010 2005 2010

PREPARED FOR THE LAS VEGAS GLOBAL ECONOMIC ALLIANCE
Theory Into Practice Page | 14
WHERE ELSE HAVE PEOPLE MOVING TO CLARK COUNTY COME FROM? M
igra
tio
n &
Mo
bili
ty
■ Even during the high-growth years, there
were still places drawing a net outflow of
Clark County residents. Most of these
locations were somewhere in the inland
southwestern states.
■ These destinations fall into two groups.
First, there are the outlying ex-urban
counties immediately surrounding Clark.
These include Nye (Nevada), Mohave
(Arizona), and Washington (Utah). The
second group consists of fast-growing urban
counties around the southwest, including
Maricopa (Phoenix), Tarrant (Fort Worth),
Travis (Austin), and Harris (Houston). These
destination cities, particularly those in Texas,
recovered more quickly from the recession.
As a result, the migration toward these metro
areas is likely a function of Clark County
residents seeking employment opportunities
elsewhere.
Perspective
While we cannot be certain of this, it is
reasonable to assume that worker movement
between Clark County and other high growth
regions reflects the demands of the
construction trade (notably urban areas in
Texas and in Phoenix – Maricopa Co.).
Figure 12: Counties with historically high migration patterns OUT FROM Clark County
Annual net migration into (out of) Clark County from the selected counties.
Sources: US Internal Revenue Service, county-to-county migration flows since 2005
inbound (net moving into Clark County)
outbound (net leaving Clark County)
+600 +600
+500 +500
+400 +400
+300 +300
+200 +200
+100 +100
0 0
-100 -100
-200 -200
-300 -300
-400 -400
-500 -500
-600 -600
-700 -700
-800 -800
-900 -900
-1000 -1000
-1100 -1100
-1200 -1200
-1300 -1300
-1400 -1400
-1500 -1500
-1600 -1600
Texas Texas Texas
Travis HarrisCounty County County County County County County
TarrantNye Maricopa Washington Mohave
Nevada Arizona Utah Arizona
2005 2010 2005 2010 2005 2010 2005 2010 2005 2010 2005 2010 2005 2010
PREPARED FOR THE LAS VEGAS GLOBAL ECONOMIC ALLIANCE
Theory Into Practice Page | 15
HOW DO HOUSEHOLDS IN THE VALLEY COMPARE TO THEIR NATIONAL PEERS? In
com
e &
Ho
usi
ng
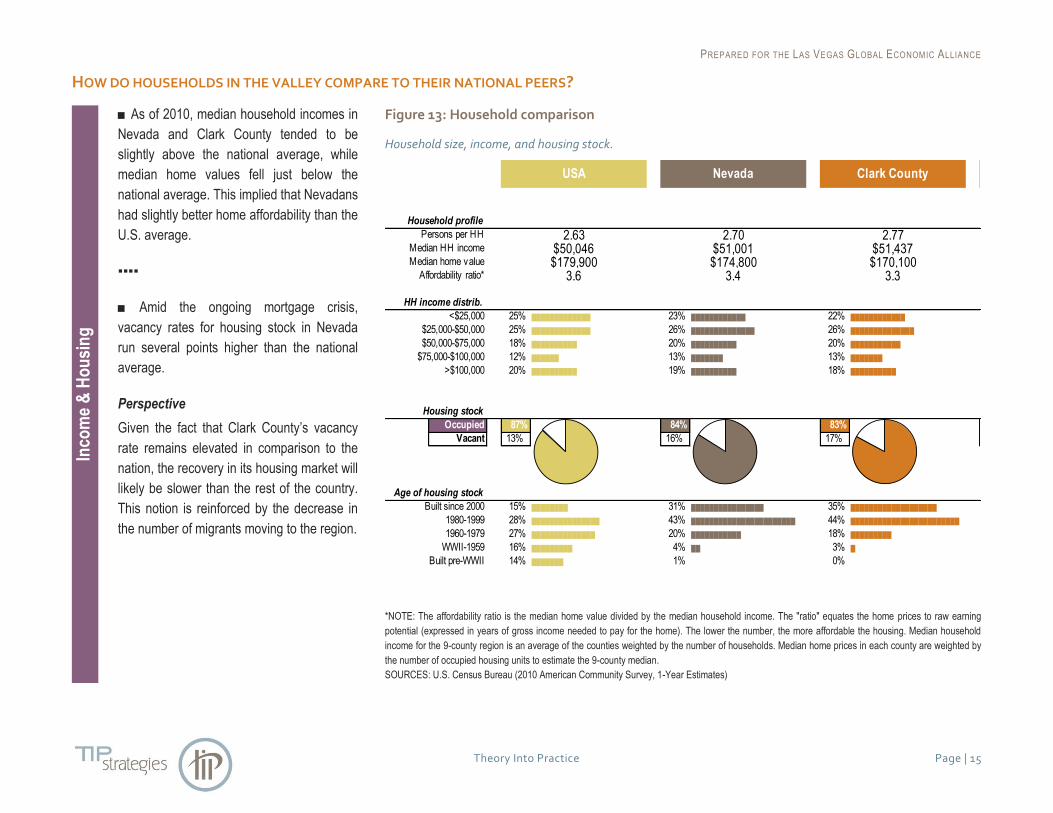
■ As of 2010, median household incomes in
Nevada and Clark County tended to be
slightly above the national average, while
median home values fell just below the
national average. This implied that Nevadans
had slightly better home affordability than the
U.S. average.
▪▪▪▪
■ Amid the ongoing mortgage crisis,
vacancy rates for housing stock in Nevada
run several points higher than the national
average.
Perspective
Given the fact that Clark County’s vacancy
rate remains elevated in comparison to the
nation, the recovery in its housing market will
likely be slower than the rest of the country.
This notion is reinforced by the decrease in
the number of migrants moving to the region.
Figure 13: Household comparison
Household size, income, and housing stock.
*NOTE: The affordability ratio is the median home value divided by the median household income. The "ratio" equates the home prices to raw earning
potential (expressed in years of gross income needed to pay for the home). The lower the number, the more affordable the housing. Median household
income for the 9-county region is an average of the counties weighted by the number of households. Median home prices in each county are weighted by
the number of occupied housing units to estimate the 9-county median.
SOURCES: U.S. Census Bureau (2010 American Community Survey, 1-Year Estimates)
Household profile
Persons per HH
Median HH income
Median home value
Affordability ratio*
HH income distrib.
<$25,000 █████████████ ████████████ ████████████
$25,000-$50,000 █████████████ ██████████████ ██████████████
$50,000-$75,000 ██████████ ██████████ ███████████
$75,000-$100,000 ██████ ███████ ███████
>$100,000 ██████████ ██████████ ██████████
Housing stock
Occupied
Vacant
Age of housing stock
Built since 2000 ████████ ████████████████ ███████████████████
1980-1999 ███████████████ ███████████████████████ ████████████████████████
1960-1979 ██████████████ ███████████ █████████
WWII-1959 █████████ ██ █
Built pre-WWII ███████
USA Nevada Clark County
2.63 2.70 2.77$50,046 $51,001 $51,437$179,900 $174,800 $170,100
3.6 3.4 3.3
25% 23% 22%
25% 26% 26%
18% 20% 20%
12% 13% 13%
20% 19% 18%
87% 84% 83%
13% 16% 17%
15% 31% 35%
28% 43% 44%
27% 20% 18%
16% 4% 3%
14% 1% 0%

PREPARED FOR THE LAS VEGAS GLOBAL ECONOMIC ALLIANCE
Theory Into Practice Page | 16
ARE COSTS OF CONSTRUCTION IN LINE WITH SALES PRICES? In
com
e &
Ho
usi
ng
■ A crude indicator of single family home
market equilibrium is a comparison of
average per-unit construction values (a proxy
for replacement cost) with current median
sales prices for existing homes. In theory,
the two should be close in value, with a
reasonable profit margin expected for
builders. In other words, the median sales
price of existing single family homes should
be expected to run moderately above new
construction costs. Indeed, the Clark County
single family market shows this pattern
existed up until about 2002. After that point,
things diverged widely during the bubble
years. In the recovery period, median resale
values have fallen so far that as of 2011,
they were below the benchmark replacement
costs.
Perspective
While the local bubble in home prices was
part of a larger national frenzy in real estate
speculation, the degree to which Las Vegas
peaked indicates that the region was an
attractive location for migrants (primarily from
Los Angeles) who were willing to pay
exorbitant prices.
Figure 14: Metro area single family home market still seeking perfect equilibrium
Differential between single family construction costs and sales prices since 1990.
* NOTE: The median sales price for 2011 is still preliminary, according to the National Association of Realtors.
SOURCES: US Census Bureau; National Association of Realtors
PREPARED FOR THE LAS VEGAS GLOBAL ECONOMIC ALLIANCE
Theory Into Practice Page | 17
HOW DO CONSTRUCTION COSTS COMPARE BETWEEN SINGLE FAMILY AND MULTI-FAMILY HOUSING? In
com
e &
Ho
usi
ng
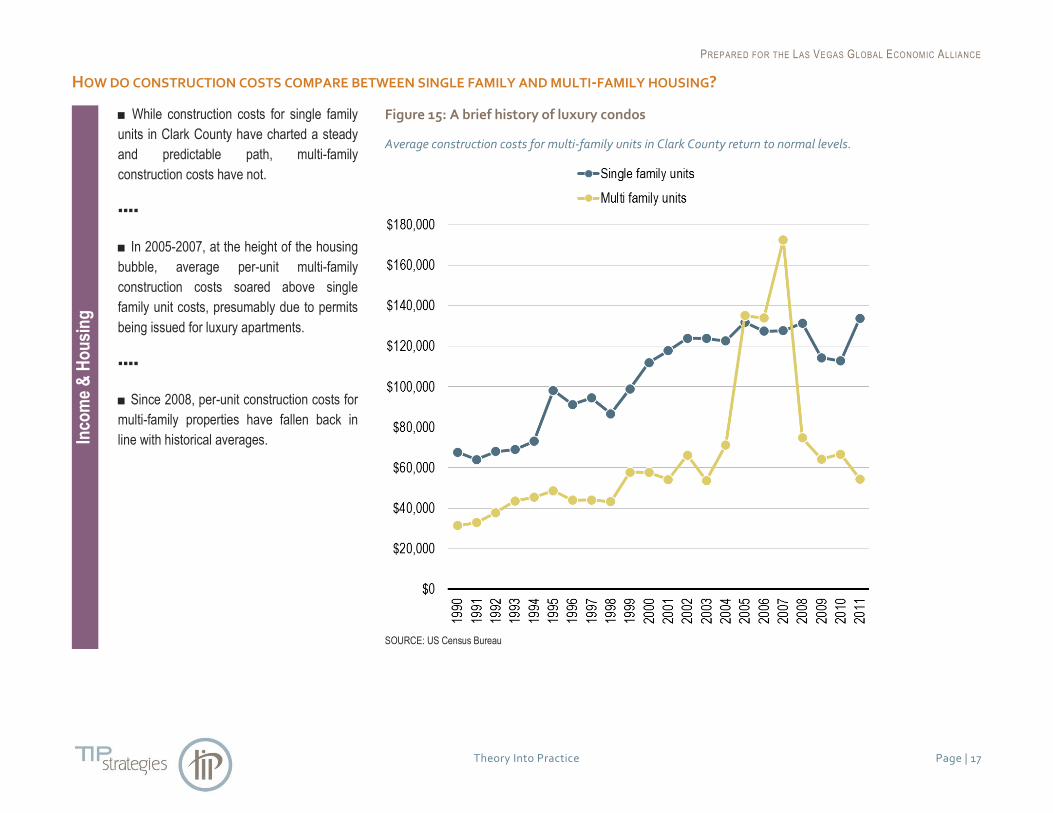
■ While construction costs for single family
units in Clark County have charted a steady
and predictable path, multi-family
construction costs have not.
▪▪▪▪
■ In 2005-2007, at the height of the housing
bubble, average per-unit multi-family
construction costs soared above single
family unit costs, presumably due to permits
being issued for luxury apartments.
▪▪▪▪
■ Since 2008, per-unit construction costs for
multi-family properties have fallen back in
line with historical averages.
Figure 15: A brief history of luxury condos
Average construction costs for multi-family units in Clark County return to normal levels.
SOURCE: US Census Bureau
PREPARED FOR THE LAS VEGAS GLOBAL ECONOMIC ALLIANCE
Theory Into Practice Page | 18
HOW MUCH DOES IT COST TO OWN A HOME IN THE VALLEY? In
com
e &
Ho
usi
ng
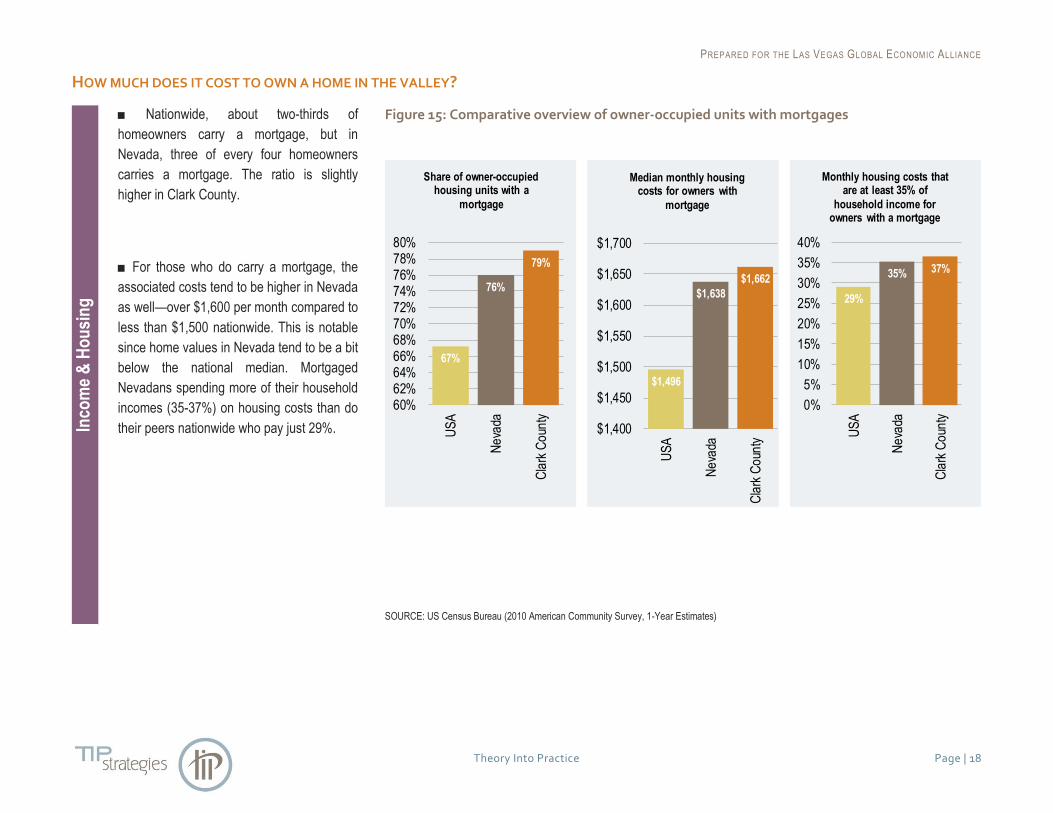
■ Nationwide, about two-thirds of
homeowners carry a mortgage, but in
Nevada, three of every four homeowners
carries a mortgage. The ratio is slightly
higher in Clark County.
■ For those who do carry a mortgage, the
associated costs tend to be higher in Nevada
as well—over $1,600 per month compared to
less than $1,500 nationwide. This is notable
since home values in Nevada tend to be a bit
below the national median. Mortgaged
Nevadans spending more of their household
incomes (35-37%) on housing costs than do
their peers nationwide who pay just 29%.
Figure 15: Comparative overview of owner-occupied units with mortgages
SOURCE: US Census Bureau (2010 American Community Survey, 1-Year Estimates)
67%
76%
79%
60%62%64%66%68%70%72%74%76%78%80%
US
A
Ne
vada
Cla
rk C
oun
ty
Share of owner-occupied housing units with a
mortgage
$1,496
$1,638
$1,662
$1,400
$1,450
$1,500
$1,550
$1,600
$1,650
$1,700
US
A
Ne
vada
Cla
rk C
oun
ty
Median monthly housing costs for owners with
mortgage
29%
35% 37%
0%
5%
10%
15%
20%
25%
30%
35%
40%
US
A
Ne
vada
Cla
rk C
oun
ty
Monthly housing costs that are at least 35% of
household income for owners with a mortgage
PREPARED FOR THE LAS VEGAS GLOBAL ECONOMIC ALLIANCE
Theory Into Practice Page | 19
IS HOME OWNERSHIP AFFORDABLE IN THE VALLEY? In
com
e &
Ho
usi
ng
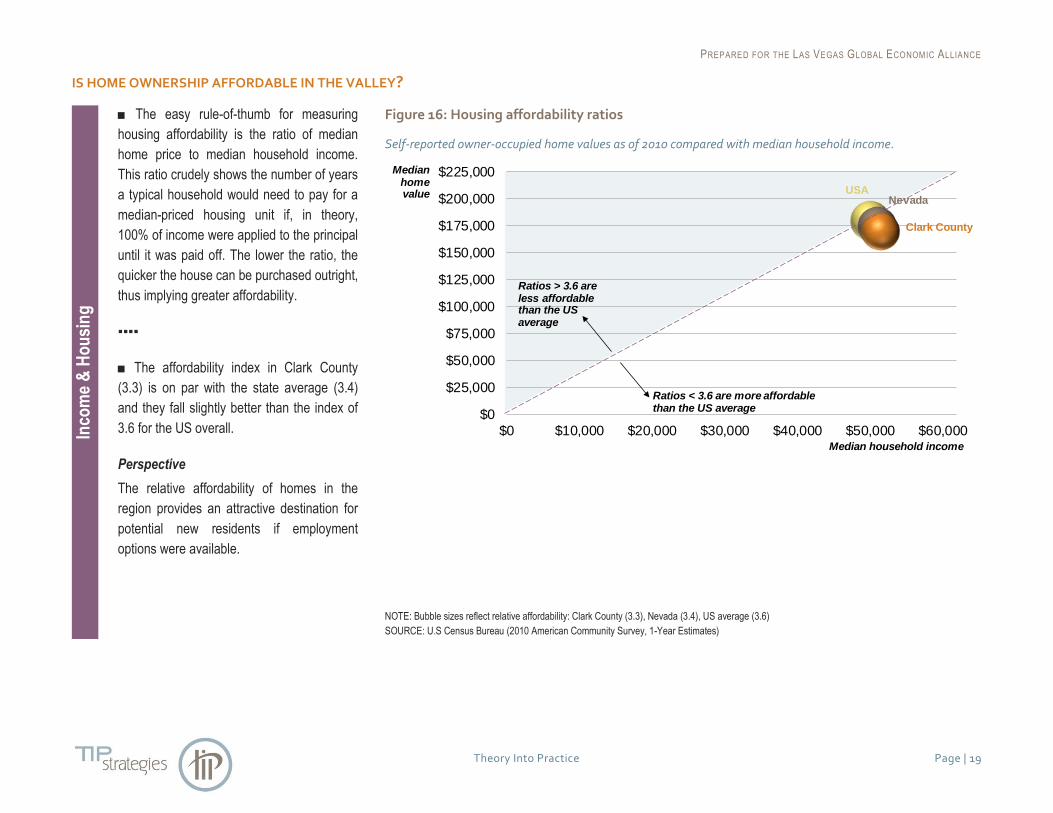
■ The easy rule-of-thumb for measuring
housing affordability is the ratio of median
home price to median household income.
This ratio crudely shows the number of years
a typical household would need to pay for a
median-priced housing unit if, in theory,
100% of income were applied to the principal
until it was paid off. The lower the ratio, the
quicker the house can be purchased outright,
thus implying greater affordability.
▪▪▪▪
■ The affordability index in Clark County
(3.3) is on par with the state average (3.4)
and they fall slightly better than the index of
3.6 for the US overall.
Perspective
The relative affordability of homes in the
region provides an attractive destination for
potential new residents if employment
options were available.
Figure 16: Housing affordability ratios
Self-reported owner-occupied home values as of 2010 compared with median household income.
NOTE: Bubble sizes reflect relative affordability: Clark County (3.3), Nevada (3.4), US average (3.6)
SOURCE: U.S Census Bureau (2010 American Community Survey, 1-Year Estimates)
USANevada
Clark County
$0
$25,000
$50,000
$75,000
$100,000
$125,000
$150,000
$175,000
$200,000
$225,000
$0 $10,000 $20,000 $30,000 $40,000 $50,000 $60,000
Ratios > 3.6 are less affordable than the US average
Ratios < 3.6 are more affordablethan the US average
Median home value
Median household income

PREPARED FOR THE LAS VEGAS GLOBAL ECONOMIC ALLIANCE
Theory Into Practice Page | 20
HOW DOES THE VALLEY’S HOUSEHOLD INCOME DISTRIBUTION COMPARE TO THE NATION? In
com
e &
Ho
usi
ng
■ Nevada's age structure is not the only
socio-economic variable similar to the nation.
Income distribution is also very similar in
Clark County and Nevada to the national
distribution. It is somewhat unusual to see a
county and state all fall so closely in line with
the national pattern. This is somewhat
surprising given the fact that the Las Vegas
region has a lower educational attainment
rate than the U.S. (which is normally closely
tied to income) and the fact that the area
suffered so greatly in the recession.
▪▪▪▪
■ The largest variations between Clark
County and the nation only appear on the
extremes of the income scale, suggesting
the region has a broader middle class than
the nation.
Perspective
Wages for employees working in the gaming
industry, tips included, are a likely factor in
the region’s ability to keep up with the
national median household income.
Figure 17: Distribution of household income, 2010
Share of total households by income level.
SOURCE: US Census Bureau (2010 American Community Survey, 1-Year Estimates)

PREPARED FOR THE LAS VEGAS GLOBAL ECONOMIC ALLIANCE
Theory Into Practice Page | 21
HOW HAS THE ‘GREAT RECESSION’ AFFECTED INCOME LEVELS? In
com
e &
Ho
usi
ng
■ Twice in the past few decades, recessions
have occurred that left lasting impacts on
Nevada. In the late 1970s per capita income
in Nevada and Clark County exceeded the
US average by a wide margin. By the time
the 1982-83 recession was over, Nevada's
lead had diminished, putting the state and
the county much more closely in line with the
nation. The same outcome occurred in the
recent Great Recession, which left local per-
capita income slipping well behind the US.
▪▪▪▪
■ Note: Per capita income is an average
per-person variable. This is different from
median household income, where Nevada's
numbers tend to be more in line with the US.
Perspective
We are inclined to think that per capita
income more accurately reflects the
economic viability of the region, and that the
decline is an indicator of the loss of well-
paying construction jobs and a resultant
increase in unemployment.
Figure 18: Inflation-adjusted per capita personal income
Two US recessions that brought local structural change.
SOURCE: US Bureau of Economic Analysis
$20,000
$25,000
$30,000
$35,000
$40,000
$45,000
197
0
197
2
197
4
197
6
197
8
198
0
198
2
198
4
198
6
198
8
199
0
199
2
199
4
199
6
199
8
200
0
200
2
200
4
200
6
200
8
201
0
USA Nevada Clark County, NV

PREPARED FOR THE LAS VEGAS GLOBAL ECONOMIC ALLIANCE
Theory Into Practice Page | 22
WHAT ARE THE MAJOR OCCUPATIONS IN CLARK COUNTY? W
ork
forc
e
■ Clark County's service-oriented economy
is reflected in its occupational structure. The
three largest occupational groups—sales,
admin support, and food services—each
account for more than 100,000 jobs.
NOTE: The broad sales occupational group
includes a diversity of positions such as retail
sales, real estate brokers and agents,
wholesale and manufacturing sales
representatives, cashiers, and advertising
sales agents.
▪▪▪▪
■ At the other end of the spectrum, the three
occupational groups that include computer
technology, engineering, and the sciences
each account for fewer than 20,000 jobs in
the county.
Figure 19: 2011 job base by occupational group in Clark County
*NOTE: Management occupations include self-employed real estate agents and farmers & ranchers as well as construction managers and general
managers.
SOURCE: EMSI Complete Employment - 2012.2
PREPARED FOR THE LAS VEGAS GLOBAL ECONOMIC ALLIANCE
Theory Into Practice Page | 23
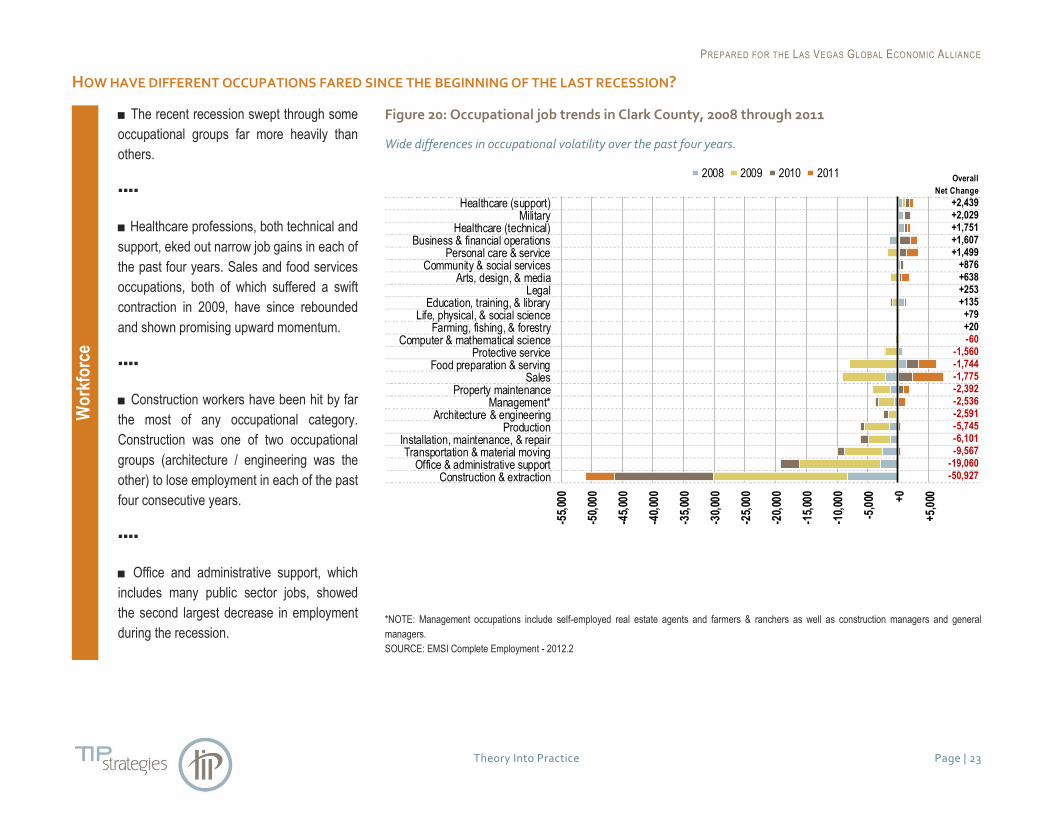
HOW HAVE DIFFERENT OCCUPATIONS FARED SINCE THE BEGINNING OF THE LAST RECESSION? W
ork
forc
e
■ The recent recession swept through some
occupational groups far more heavily than
others.
▪▪▪▪
■ Healthcare professions, both technical and
support, eked out narrow job gains in each of
the past four years. Sales and food services
occupations, both of which suffered a swift
contraction in 2009, have since rebounded
and shown promising upward momentum.
▪▪▪▪
■ Construction workers have been hit by far
the most of any occupational category.
Construction was one of two occupational
groups (architecture / engineering was the
other) to lose employment in each of the past
four consecutive years.
▪▪▪▪
■ Office and administrative support, which
includes many public sector jobs, showed
the second largest decrease in employment
during the recession.
Figure 20: Occupational job trends in Clark County, 2008 through 2011
Wide differences in occupational volatility over the past four years.
*NOTE: Management occupations include self-employed real estate agents and farmers & ranchers as well as construction managers and general
managers.
SOURCE: EMSI Complete Employment - 2012.2
Overall
Net Change
+2,439+2,029+1,751+1,607+1,499
+876+638+253+135
+79+20-60
-1,560-1,744-1,775-2,392-2,536-2,591-5,745-6,101-9,567
-19,060-50,927
-55,
000
-50,
000
-45,
000
-40,
000
-35,
000
-30,
000
-25,
000
-20,
000
-15,
000
-10,
000
-5,0
00 +0
+5,0
00
Construction & extractionOffice & administrative support
Transportation & material movingInstallation, maintenance, & repair
ProductionArchitecture & engineering
Management*Property maintenance
SalesFood preparation & serving
Protective serviceComputer & mathematical science
Farming, fishing, & forestryLife, physical, & social science
Education, training, & libraryLegal
Arts, design, & mediaCommunity & social services
Personal care & serviceBusiness & financial operations
Healthcare (technical)Military
Healthcare (support)
2008 2009 2010 2011

PREPARED FOR THE LAS VEGAS GLOBAL ECONOMIC ALLIANCE
Theory Into Practice Page | 24
WHAT ARE THE PREVAILING WAGES FOR EACH OCCUPATION? W
ork
forc
e
■ In most occupational categories, the
median wage in Clark County falls near the
middle of the national wage range.
▪▪▪▪
■ A glaring exception to the general trend
can be found in sales occupations. The
median wage for sales workers (just under
$14/hour in 2011) falls near the bottom of the
national wage range, which is $10/hour at
the 10th percentile level and $26/hour at the
90th percentile for this occupational group.
▪▪▪▪
■ Another exception to the general trend can
be found in construction occupations.
Despite huge layoffs among these workers,
those still employed make relatively high
wages by national standards in this
occupational group.
Figure 21: Median hourly wage rate by occupational group
Clark County median wage presented in the context of the national wage range.
*NOTE: Management occupations include self-employed real estate agents and farmers & ranchers as well as construction managers and general
managers.
SOURCE: EMSI Complete Employment - 2012.2
Circle represents the county median; line represents the national range between the 10th and 90th percentiles
$0
$5
$10
$15
$20
$25
$30
$35
$40
$45
$50
$55
$60
$65
$70
Pe
rso
nal c
are
& s
ervi
ce
Fo
od p
rep
ara
tion
& s
ervi
ng
Pro
pert
y m
aint
enan
ce
Fa
rmin
g, f
ishi
ng, &
fore
stry
He
alth
care
(su
ppor
t)
Sa
les
Tra
nsp
orta
tion
& m
ate
rial
mov
ing
Pro
duct
ion
Offi
ce &
ad
min
istr
ativ
e su
ppor
t
Mili
tary
Pro
tect
ive
serv
ice
Art
s, d
esi
gn, &
med
ia
Ed
ucat
ion,
tra
inin
g, &
libr
ary
Inst
alla
tion,
ma
inte
nanc
e, &
re
pair
Co
mm
uni
ty &
soc
ial s
erv
ice
s
Co
nstr
uct
ion
& e
xtra
ctio
n
Bu
sine
ss &
fin
anc
ial o
pera
tions
Man
agem
ent
*
Life
, phy
sica
l, &
so
cial
sci
ence
Co
mp
uter
& m
ath
ema
tica
l sci
ence
Arc
hite
ctur
e &
eng
inee
ring
Leg
al
He
alth
care
(te
chn
ical
)

PREPARED FOR THE LAS VEGAS GLOBAL ECONOMIC ALLIANCE
Theory Into Practice Page | 25
HOW IS CLARK COUNTY’S WORKFORCE SPECIALIZED? W
ork
forc
e
■ Occupational groups with high location
quotients exemplify Clark County's tourism-
oriented economy. The local economy has a
higher than average share of workers in food
services, personal services (which includes
many hotel and casino jobs), property
maintenance, and protective services (which
includes security services).
▪▪▪▪
■ Healthcare and education occupations—
these were among the most stable US jobs
through the recent recession—are slightly
underrepresented in the Clark County
workforce. Scientists, engineers, and
computer workers are also among those
underrepresented locally.
Figure 22: Occupational group concentrations in Clark County
Location quotient analysis: US average for each industry = 1.00 (regional strength >1.25; regional weakness <0.75)
*NOTE: Management occupations include self-employed real estate agents and farmers & ranchers as well as construction managers and general
managers.
SOURCE: EMSI Complete Employment - 2012.2

PREPARED FOR THE LAS VEGAS GLOBAL ECONOMIC ALLIANCE
Theory Into Practice Page | 26
WHAT LEVEL OF SKILLS OR EDUCATION IS REQUIRED FOR JOBS IN CLARK COUNTY? W
ork
forc
e
■ A decade ago, only 15% of existing jobs in
Clark County required a 4-year degree as a
minimum prequalification. This inched up
over the course of the decade to 17% of the
existing job base.
▪▪▪▪
■ According to RCG Economics, focused
skills training is currently in more demand
than a college degree (e.g., Microsoft
certification).
▪▪▪▪
■ Looking ahead, the new jobs projected to
be added over the coming 10 years will
require increasingly more preparation. A full
29% of the projected new jobs will require at
least a 4-year degree as an entry-level
condition.
Figure 23: Threshold skills preparation required for Clark County’s job base
Past, present, and the decade ahead
SOURCE: EMSI Complete Employment - 2012.2
On-the-job training or previous experience
Vocational or 2-year degree
4-year degree or higher
Net job change over next 10 years
2011-21
Job base in Job base in
2001 2011
15%
11%
75%
17%
12%
70%
29%
9%62%
PREPARED FOR THE LAS VEGAS GLOBAL ECONOMIC ALLIANCE
Theory Into Practice Page | 27
WHAT IS THE LEVEL OF DEMAND FOR SKILLED WORKERS? W
ork
forc
e
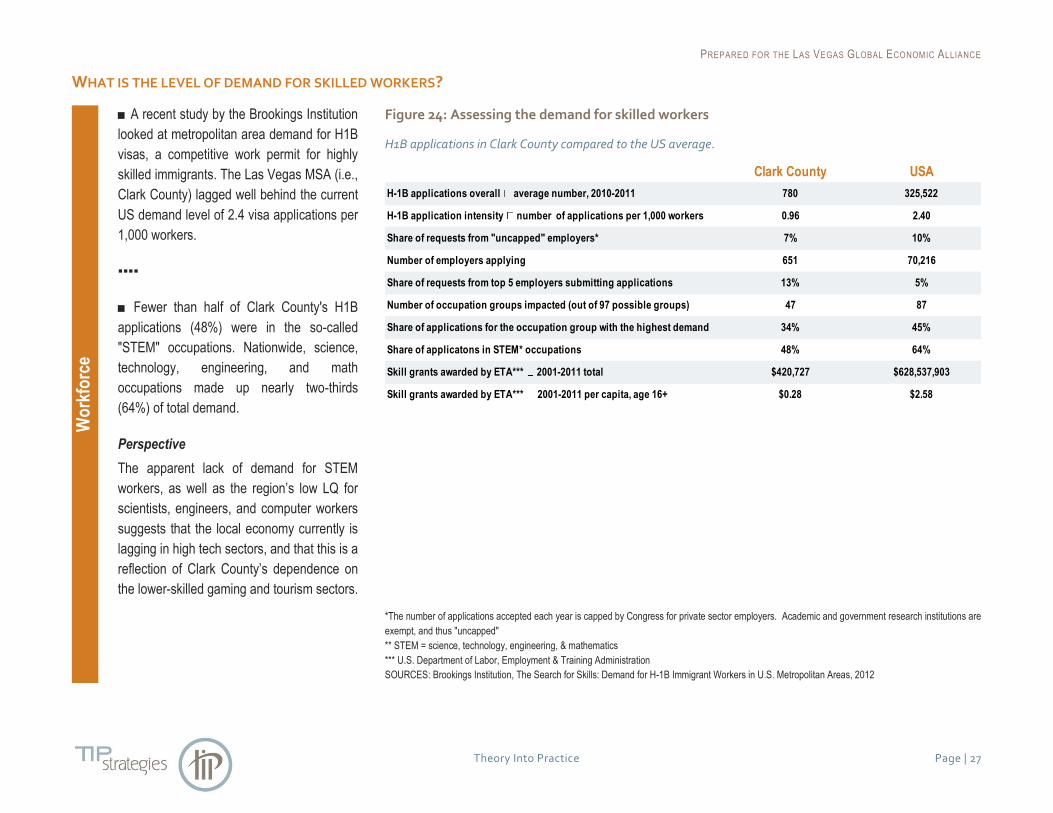
■ A recent study by the Brookings Institution
looked at metropolitan area demand for H1B
visas, a competitive work permit for highly
skilled immigrants. The Las Vegas MSA (i.e.,
Clark County) lagged well behind the current
US demand level of 2.4 visa applications per
1,000 workers.
▪▪▪▪
■ Fewer than half of Clark County's H1B
applications (48%) were in the so-called
"STEM" occupations. Nationwide, science,
technology, engineering, and math
occupations made up nearly two-thirds
(64%) of total demand.
Perspective
The apparent lack of demand for STEM
workers, as well as the region’s low LQ for
scientists, engineers, and computer workers
suggests that the local economy currently is
lagging in high tech sectors, and that this is a
reflection of Clark County’s dependence on
the lower-skilled gaming and tourism sectors.
Figure 24: Assessing the demand for skilled workers
H1B applications in Clark County compared to the US average.
*The number of applications accepted each year is capped by Congress for private sector employers. Academic and government research institutions are
exempt, and thus "uncapped"
** STEM = science, technology, engineering, & mathematics
*** U.S. Department of Labor, Employment & Training Administration
SOURCES: Brookings Institution, The Search for Skills: Demand for H-1B Immigrant Workers in U.S. Metropolitan Areas, 2012
Skill grants awarded by ETA*** 2001-2011 total $420,727 $628,537,903
Share of applicatons in STEM* occupations 48% 64%
Share of applications for the occupation group with the highest demand 34% 45%
Clark County USA
Number of employers applying 651 70,216
Number of occupation groups impacted (out of 97 possible groups) 47 87
H-1B applications overall average number, 2010-2011 780 325,522
Share of requests from "uncapped" employers* 7% 10%
H-1B application intensity number of applications per 1,000 workers 0.96 2.40
Skill grants awarded by ETA*** 2001-2011 per capita, age 16+ $0.28 $2.58
Share of requests from top 5 employers submitting applications 13% 5%

PREPARED FOR THE LAS VEGAS GLOBAL ECONOMIC ALLIANCE
Theory Into Practice Page | 28
HOW DOES THE STATE’S BUSINESS CLIMATE COMPARE? E
con
om
y
Infr
astr
uct
ure
T
ax B
ase
■ State tax structures are notoriously difficult
to compare fairly, but that does not stop
advocacy organizations from trying as best
they can. In the Tax Foundation's most
recent annual look at this topic, Nevada
scored a perfect "10" for its individual income
tax and corporate tax. Nevada is a highly
competitive state in this area. The overall
business climate scored a 7.5, which
exceeds the 90th percentile of scores among
US states.
■ The upside of scoring well in some tax
categories is that there will inevitably be
some compensation for this in other
categories. Indeed, Nevada gets a middling
score for its property tax (5.5) and relatively
low scores for the unemployment insurance
tax and the sales tax. (One might reasonably
argue that a tourism-oriented economy with
relatively high sales taxes is as burdensome
for state residents since visitors pick up
some of this tab.)
■ According to the Tax Policy Center,
Nevada ranked 28th in the nation in tax
collections per capita.
Figure 25: Nevada's business climate in context
2012 scores on various taxes for 50 states and the District of Columbia.
SOURCES: 2012 State Business Tax Climate Index (The Tax Foundation)
Scaled scores w ith 10 = best, and 1 = w orst
l Nevada's score in 2012
90th percentile of states
▲
range of state scores
▼
10th percentile of states
KEY
10.0 10.0
7.5
5.5
4.44.0
1
2
3
4
5
6
7
8
9
10
IndividualIncome
TaxCorporate
Tax
StateBusiness
TaxClimate
PropertyTax
UnemploymentInsurance
TaxSalesTax
score
mo
re f
avo
rab
le
le
ss f
avo
rab
le

PREPARED FOR THE LAS VEGAS GLOBAL ECONOMIC ALLIANCE
Theory Into Practice Page | 29
WHAT ARE THE SOURCES OF REVENUE FOR CLARK COUNTY? E
con
om
y
Infr
astr
uct
ure
T
ax B
ase
■ Clark County's revenues peaked in FY
2008 with the recession and have since
slipped back to 2005-era levels.
▪▪▪▪
■ Taxes collected directly by the county,
which includes property taxes, peaked later
(2009) than overall revenue sources.
▪▪▪▪
■ Charges for services peaked in excess of
a half-billion dollars in 2005, but have since
averaged about $150 million annually.
Figure 26: Major sources of Clark County revenue
Balance at end of fiscal year.
*includes special assessments, interest, fines, et al.
SOURCES: Clark County Comptroller's Office, Comprehensive Annual Financial Report, FY 2011
$0.0
$0.5
$1.0
$1.5
$2.0
$2.5
$3.0
2002 2003 2004 2005 2006 2007 2008 2009 2010 2011
US$ billions
Other*
Charges for services
Licenses & permits
Taxes (collected directly)
Intergovernmental transfers(includes taxes collected indirectly)
PREPARED FOR THE LAS VEGAS GLOBAL ECONOMIC ALLIANCE
Theory Into Practice Page | 30
WHAT ARE THE SOURCES OF TAX REVENUE FOR CLARK COUNTY? E
con
om
y
Infr
astr
uct
ure
T
ax B
ase
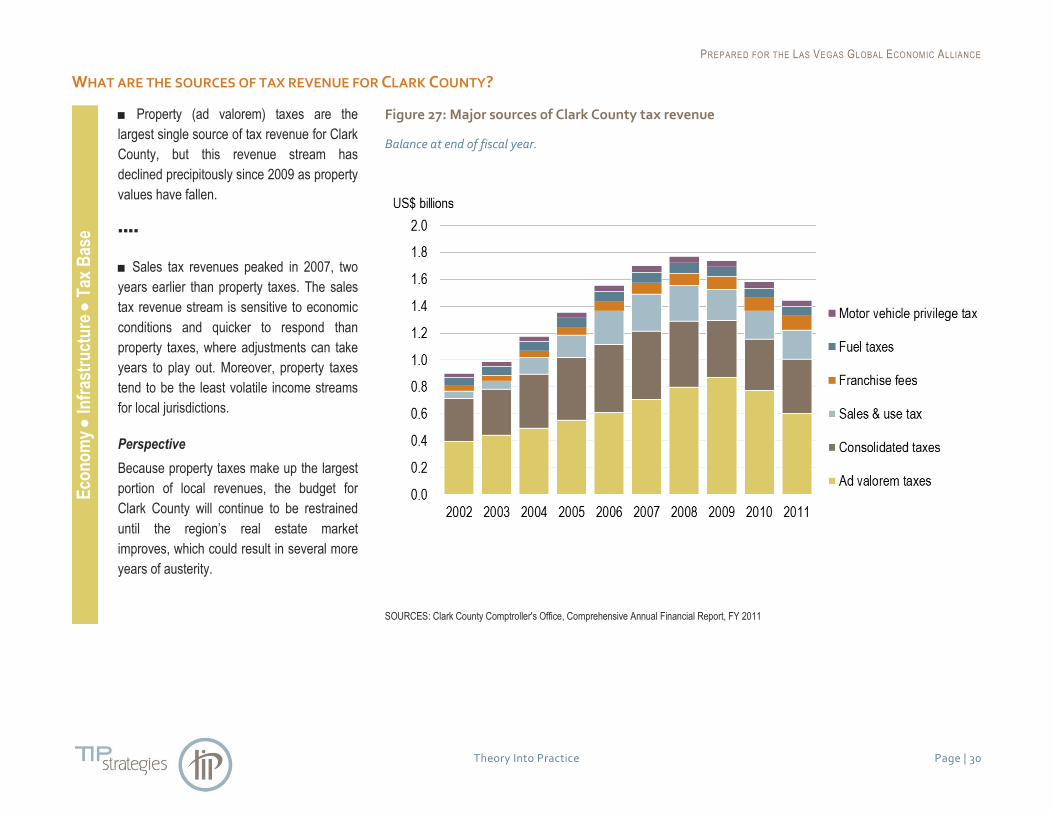
■ Property (ad valorem) taxes are the
largest single source of tax revenue for Clark
County, but this revenue stream has
declined precipitously since 2009 as property
values have fallen.
▪▪▪▪
■ Sales tax revenues peaked in 2007, two
years earlier than property taxes. The sales
tax revenue stream is sensitive to economic
conditions and quicker to respond than
property taxes, where adjustments can take
years to play out. Moreover, property taxes
tend to be the least volatile income streams
for local jurisdictions.
Perspective
Because property taxes make up the largest
portion of local revenues, the budget for
Clark County will continue to be restrained
until the region’s real estate market
improves, which could result in several more
years of austerity.
Figure 27: Major sources of Clark County tax revenue
Balance at end of fiscal year.
SOURCES: Clark County Comptroller's Office, Comprehensive Annual Financial Report, FY 2011

PREPARED FOR THE LAS VEGAS GLOBAL ECONOMIC ALLIANCE
Theory Into Practice Page | 31
HOW ARE PROPERTY TAXES ALLOCATED IN CLARK COUNTY? E
con
om
y
Infr
astr
uct
ure
T
ax B
ase
■ The core components of the property tax
rate—the state, the county, the county
school district, and the City of Las Vegas—
have changed little over the past decade.
Declines in property tax revenue can thus be
attributed largely to changes in appraisal
values rather than in tax rates.
Figure 28: Allocation of the local property tax in recent years
Tax rates of major overlapping governments (excludes rates for special districts).
NOTE: Nevada caps the overlapping tax rate at $3.64 per $100 of assessed valuation.
SOURCES: Clark County Comptroller's Office, Comprehensive Annual Financial Report, FY 2011
Rates applied per $100 of assessed valuation
1.303
1.303
1.303
1.303
1.303
1.303
1.303
1.303
1.303
1.303
0.620
0.620
0.650
0.650
0.643
0.642
0.639
0.639
0.639
0.639
0.165
0.165
0.170
0.185
0.185
0.185
0.185
0.185
0.185
0.185
0.782
0.781
0.780
0.779
0.777
0.778
0.772
0.772
0.772
0.772
$0.00 $0.50 $1.00 $1.50 $2.00 $2.50 $3.00 $3.50
2002
2003
2004
2005
2006
2007
2008
2009
2010
2011
Clark County School District Clark County State of Nevada City of Las Vegas
PREPARED FOR THE LAS VEGAS GLOBAL ECONOMIC ALLIANCE
Theory Into Practice Page | 32
HOW DO PROPERTY TAX RATES COMPARE ACROSS REGIONAL JURISDICTIONS? E
con
om
y
Infr
astr
uct
ure
T
ax B
ase
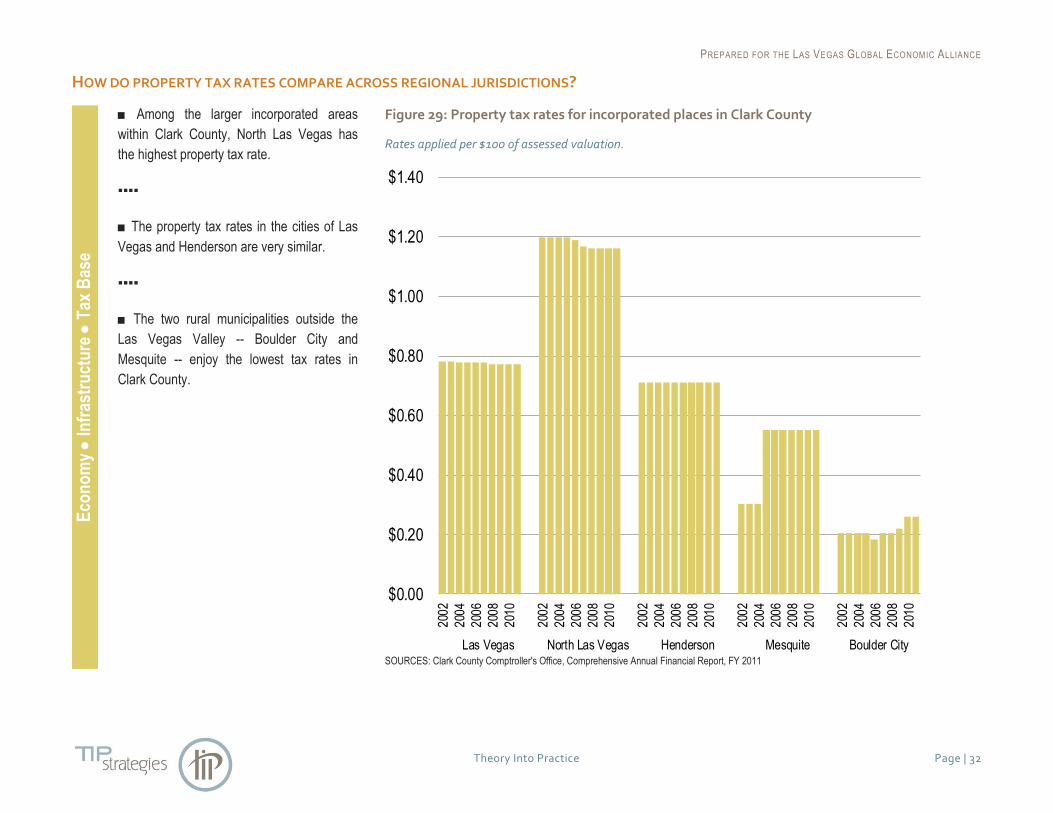
■ Among the larger incorporated areas
within Clark County, North Las Vegas has
the highest property tax rate.
▪▪▪▪
■ The property tax rates in the cities of Las
Vegas and Henderson are very similar.
▪▪▪▪
■ The two rural municipalities outside the
Las Vegas Valley -- Boulder City and
Mesquite -- enjoy the lowest tax rates in
Clark County.
Figure 29: Property tax rates for incorporated places in Clark County
Rates applied per $100 of assessed valuation.
SOURCES: Clark County Comptroller's Office, Comprehensive Annual Financial Report, FY 2011
$0.00
$0.20
$0.40
$0.60
$0.80
$1.00
$1.20
$1.40
2002
2004
2006
2008
2010
2002
2004
2006
2008
2010
2002
2004
2006
2008
2010
2002
2004
2006
2008
2010
2002
2004
2006
2008
2010
Las Vegas North Las Vegas Henderson Mesquite Boulder City

PREPARED FOR THE LAS VEGAS GLOBAL ECONOMIC ALLIANCE
Theory Into Practice Page | 33
WHO ARE CLARK COUNTY’S LARGEST PROPERTY TAX PAYERS? E
con
om
y
Infr
astr
uct
ure
T
ax B
ase
■ Over the last 10 years, Clark County has
become incrementally more reliant on its
largest taxpayers. In 2002, the county's
largest property owner controlled just under
5% of all taxable property value. That same
taxpayer controlled an even larger share (7%
of the base) by 2011.
▪▪▪▪
■ Moreover, the county increased its
reliance on the 10 largest taxpayers, largely
comprised of gaming companies, from
18.4% of the base in 2002 to 19.2% in 2011.
This points to the need for increased
diversification of the region’s economy and
tax-base. Over-reliance on a handful of
employers from the same sector places
Clark County at risk of potential structural
changes in gaming.
Figure 30: Major tax payers in Clark County
SOURCES: Clark County Comptroller's Office, Comprehensive Annual Financial Report, FY 2011
Taxpapyer Taxable value % of base Taxpapyer Taxable value % of base1 MGM Mirage ↔ 1 MGM Mirage2 Nevada Energy ↔ 2 Nevada Energy3 Caesar's Entertainment, Inc.4 Las Vegas Sands Corporation5 Wynn Resorts Ltd.6 Boyd Gaming Corporation7 General Growth Properties8 Station Casinos, Inc. ↔ 3 Station Casinos, Inc.9 Universal Health Services Inc.
10 Nevada Property 1 LLC4 Mandalay Resort Group5 Park Place Entertainment6 F.S. Rouse LLC7 Venetian Casino Resort LLC8 Harrah's Club9 Aladdin Gaming LLC
10 Sierra-Nevada Multifamily Investments
Top 10 taxpapers Top 10 taxpapers
Total assessed value of real property Total assessed value of real property
2011 2002
2.1%687,984,4404.8%1,545,549,220
3.1%
60,420,431,199 32,205,771,521 100.0%
387,458,540 1.2%
951,067,060 3.0%
5,911,675,020 18.4%
305,189,590 0.9%258,769,660 0.8%189,494,730 0.6%
905,636,760 2.8%374,321,520 1.2%
306,203,500 1.0%
100.0%
19.2%
0.3%0.3%
4,256,172,9071,858,918,1941,818,498,366
934,068,855679,025,458614,081,067549,434,198
200,196,877194,862,163
0.9%0.9%
7.0%
3.0%1.5%1.1%1.0%
11,629,911,707
524,653,622
PREPARED FOR THE LAS VEGAS GLOBAL ECONOMIC ALLIANCE
Theory Into Practice Page | 34
WHO ARE CLARK COUNTY’S LARGEST EMPLOYERS? E
con
om
y
Infr
astr
uct
ure
T
ax B
ase
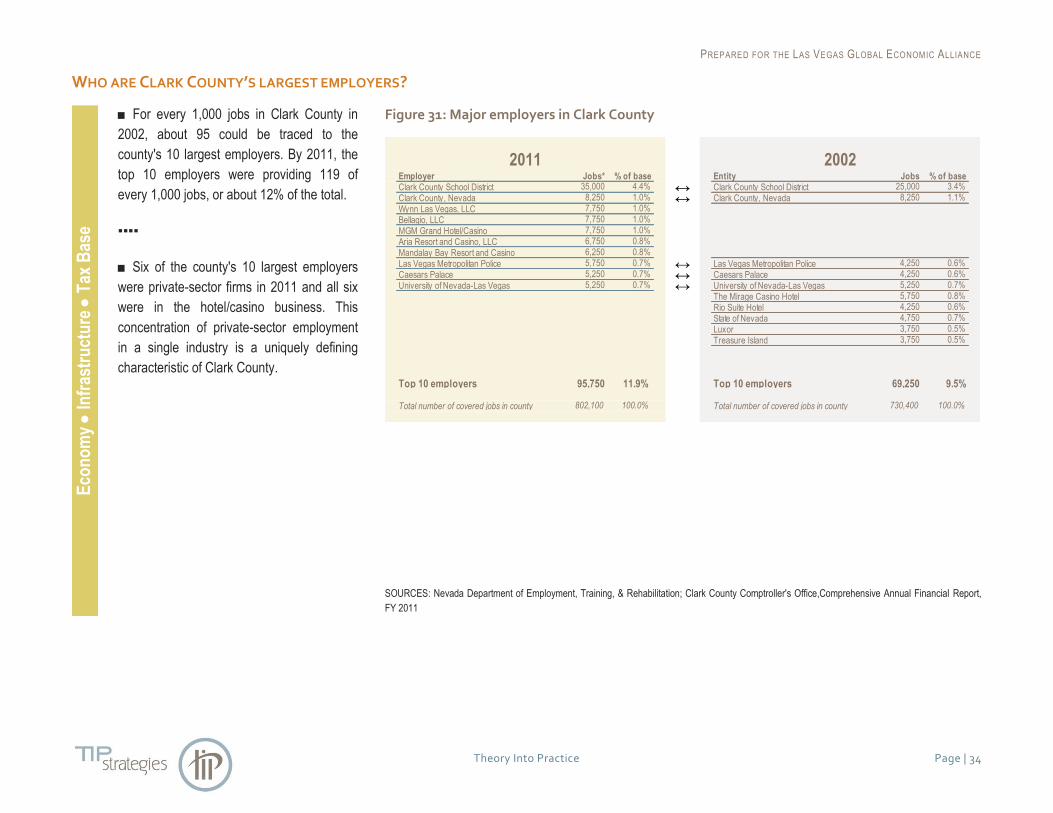
■ For every 1,000 jobs in Clark County in
2002, about 95 could be traced to the
county's 10 largest employers. By 2011, the
top 10 employers were providing 119 of
every 1,000 jobs, or about 12% of the total.
▪▪▪▪
■ Six of the county's 10 largest employers
were private-sector firms in 2011 and all six
were in the hotel/casino business. This
concentration of private-sector employment
in a single industry is a uniquely defining
characteristic of Clark County.
Figure 31: Major employers in Clark County
SOURCES: Nevada Department of Employment, Training, & Rehabilitation; Clark County Comptroller's Office,Comprehensive Annual Financial Report,
FY 2011
Employer Jobs* % of base Entity Jobs % of baseClark County School District ↔ Clark County School District Clark County, Nevada ↔ Clark County, Nevada Wynn Las Vegas, LLC Bellagio, LLC MGM Grand Hotel/Casino Aria Resort and Casino, LLC Mandalay Bay Resort and Casino Las Vegas Metropolitan Police ↔ Las Vegas Metropolitan Police Caesars Palace ↔ Caesars Palace University of Nevada-Las Vegas ↔ University of Nevada-Las Vegas
The Mirage Casino HotelRio Suite HotelState of NevadaLuxorTreasure Island
Top 10 employers Top 10 employers
Total number of covered jobs in county Total number of covered jobs in county
35,000 4.4% 25,000 3.4%8,250 1.0% 8,250 1.1%7,750 1.0%
7,750 1.0%7,750 1.0%
6,750 0.8%6,250 0.8%5,750 0.7% 4,250 0.6%5,250 0.7% 4,250 0.6%5,250 0.7% 5,250 0.7%
5,750 0.8%4,250 0.6%4,750 0.7%3,750 0.5%
2011 2002
95,750 11.9% 69,250 9.5%
3,750 0.5%
802,100 100.0% 730,400 100.0%

PREPARED FOR THE LAS VEGAS GLOBAL ECONOMIC ALLIANCE
Theory Into Practice Page | 35
HOW HAVE PROPERTY VALUES CHANGED AS THE REGION HAS GROWN? E
con
om
y
Infr
astr
uct
ure
T
ax B
ase
■ Real property accounts for the vast
majority of taxable value in Clark County,
with personal property making up a much
smaller share of the base.
▪▪▪▪
■ Average taxable personal property peaked
at $3,172 in 2008. Real property did not peak
until the next fiscal year. In 2009, taxable
real property per resident averaged $53,325,
the highest point ever recorded in the county
in a single fiscal year. And, it has been in
decline since then because of the Great
Recession’s impact on Southern Nevada’s
residential and commercial real estate
markets.
Figure 32: Average net taxable property value per Clark County resident
SOURCES: Clark County Assessor; Clark County Comptroller's Office,Comprehensive Annual Financial Report, FY 2011
$0
$10,000
$20,000
$30,000
$40,000
$50,000
$60,000
2002 2003 2004 2005 2006 2007 2008 2009 2010 2011
Real
Personal

PREPARED FOR THE LAS VEGAS GLOBAL ECONOMIC ALLIANCE
Theory Into Practice Page | 36
HOW HAVE PROPERTY VALUES CHANGED AS THE REGION HAS GROWN? E
con
om
y
Infr
astr
uct
ure
T
ax B
ase
■ Over the past decade, personal property
has been squeezed as a share of the
county's overall property tax base, from
nearly 12% in 2002 to consistently less than
6% since 2008. This is likely due to the
region’s reliance on the real estate market as
a means for growth during the last decade.
▪▪▪▪
■ Real property values rose more
dramatically than personal property over the
course of the decade, but as of the end of
fiscal year 2011, real property values had
fallen back to 2006 levels. Personal property
values were below 2002 levels.
Figure 33: Real vs. personable taxable property
Distribution of total taxable property… …with each component indexed to 2002=100
SOURCES: Clark County Assessor; Clark County Comptroller's Office,Comprehensive Annual Financial Report, FY 2011
0%
10%
20%
30%
40%
50%
60%
70%
80%
90%
100%
2002
2003
2004
2005
2006
2007
2008
2009
2010
2011
Personal
Real
0
50
100
150
200
250
300
350
2002
2003
2004
2005
2006
2007
2008
2009
2010
2011
PREPARED FOR THE LAS VEGAS GLOBAL ECONOMIC ALLIANCE
Theory Into Practice Page | 37
WHAT IS CLARK COUNTY’S TAX BURDEN? E
con
om
y
Infr
astr
uct
ure
T
ax B
ase
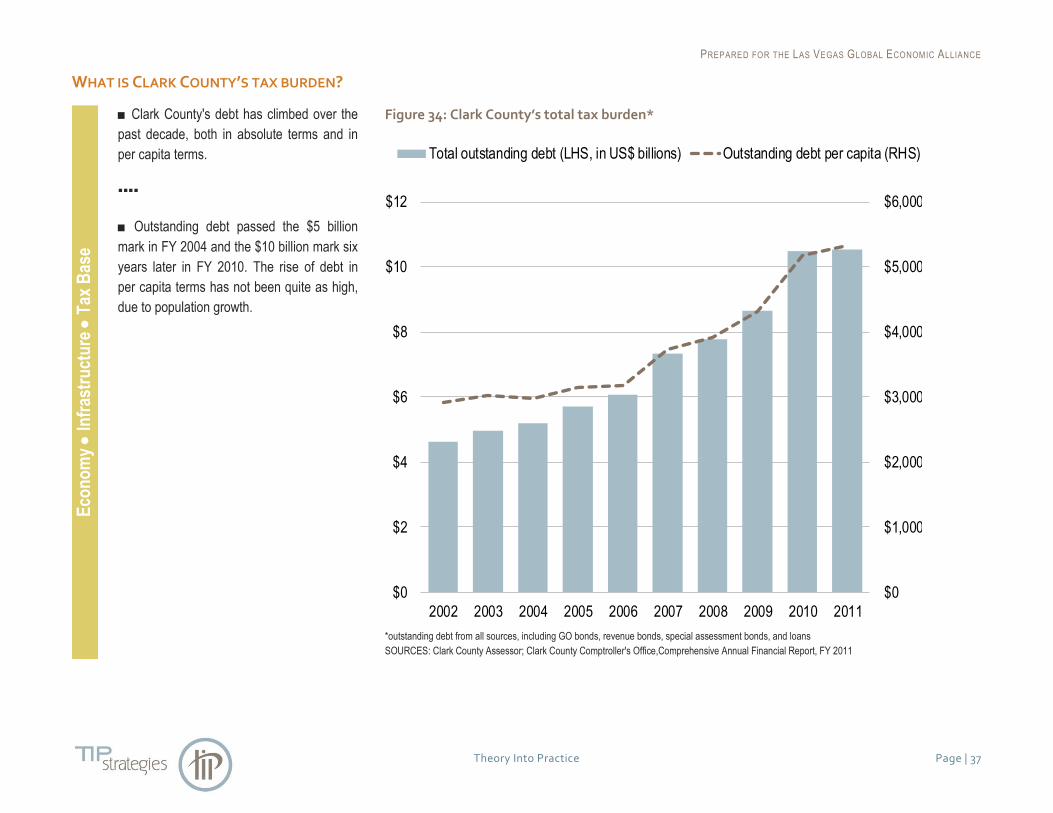
■ Clark County's debt has climbed over the
past decade, both in absolute terms and in
per capita terms.
▪▪▪▪
■ Outstanding debt passed the $5 billion
mark in FY 2004 and the $10 billion mark six
years later in FY 2010. The rise of debt in
per capita terms has not been quite as high,
due to population growth.
Figure 34: Clark County’s total tax burden*
*outstanding debt from all sources, including GO bonds, revenue bonds, special assessment bonds, and loans
SOURCES: Clark County Assessor; Clark County Comptroller's Office,Comprehensive Annual Financial Report, FY 2011
$0
$1,000
$2,000
$3,000
$4,000
$5,000
$6,000
$0
$2
$4
$6
$8
$10
$12
2002 2003 2004 2005 2006 2007 2008 2009 2010 2011
Total outstanding debt (LHS, in US$ billions) Outstanding debt per capita (RHS)

PREPARED FOR THE LAS VEGAS GLOBAL ECONOMIC ALLIANCE
Theory Into Practice Page | 38
HOW IS CLARK COUNTY’S DEBT STRUCTURED? E
con
om
y
Infr
astr
uct
ure
T
ax B
ase
■ Up until 2004, more than half of the
county's debt was in general obligation
bonds.
▪▪▪▪
■ Since 2010, the majority of debt has
shifted to revenue bonds.
Perspective
Revenue bonds are often preferable to
government policymakers, because they
have a dedicated funding stream, often
alleviating the need to tinker with tax rates.
Bond rating agencies, on the other hand, are
sometimes more comfortable with the
security of general obligation bonds for the
exact opposite reason—the payback options
of GO bonds are less narrowly defined.
Figure 35: Clark County’s debt structure
SOURCES: Clark County Assessor; Clark County Comptroller's Office,Comprehensive Annual Financial Report, FY 2011
53%
59%
55%
48%
50%
46%
45%
50%
43%
42%
36%
34%
35%
37%
36%
45%
46%
41%
51%
52%
0% 10% 20% 30% 40% 50% 60% 70% 80% 90% 100%
2002
2003
2004
2005
2006
2007
2008
2009
2010
2011
General obligation bondsRevenue bondsSpecial assessment bondsLoans

PREPARED FOR THE LAS VEGAS GLOBAL ECONOMIC ALLIANCE
Theory Into Practice Page | 39
WHAT IS CLARK COUNTY’S DEBT RELATIVE TO ITS TAX BASE? E
con
om
y
Infr
astr
uct
ure
T
ax B
ase
■ Rising debt levels and shrinking tax-bases
are a common theme of governments at all
levels around the world these days. When
these forces coincide, the ratio of liabilities to
implied collateral suddenly changes,
sometimes dramatically.
▪▪▪▪
■ In 2008, the county owed $7.15 for every
$100 of assessed property value. Three
years later in 2011, that ratio was $16.42 per
$100.
Figure 36: Clark County debt burden relative to the tax base
Total outstanding debt per $100 of net taxable property value.
SOURCES: Clark County Assessor; Clark County Comptroller's Office,Comprehensive Annual Financial Report, FY 2011
$0.00
$2.00
$4.00
$6.00
$8.00
$10.00
$12.00
$14.00
$16.00
$18.00
2002
2003
2004
2005
2006
2007
2008
2009
2010
2011
Total debt per $100 of assessed property
PREPARED FOR THE LAS VEGAS GLOBAL ECONOMIC ALLIANCE
Theory Into Practice Page | 40
WHAT IS THE UNEMPLOYMENT RATE? E
con
om
y
Infr
astr
uct
ure
T
ax B
ase
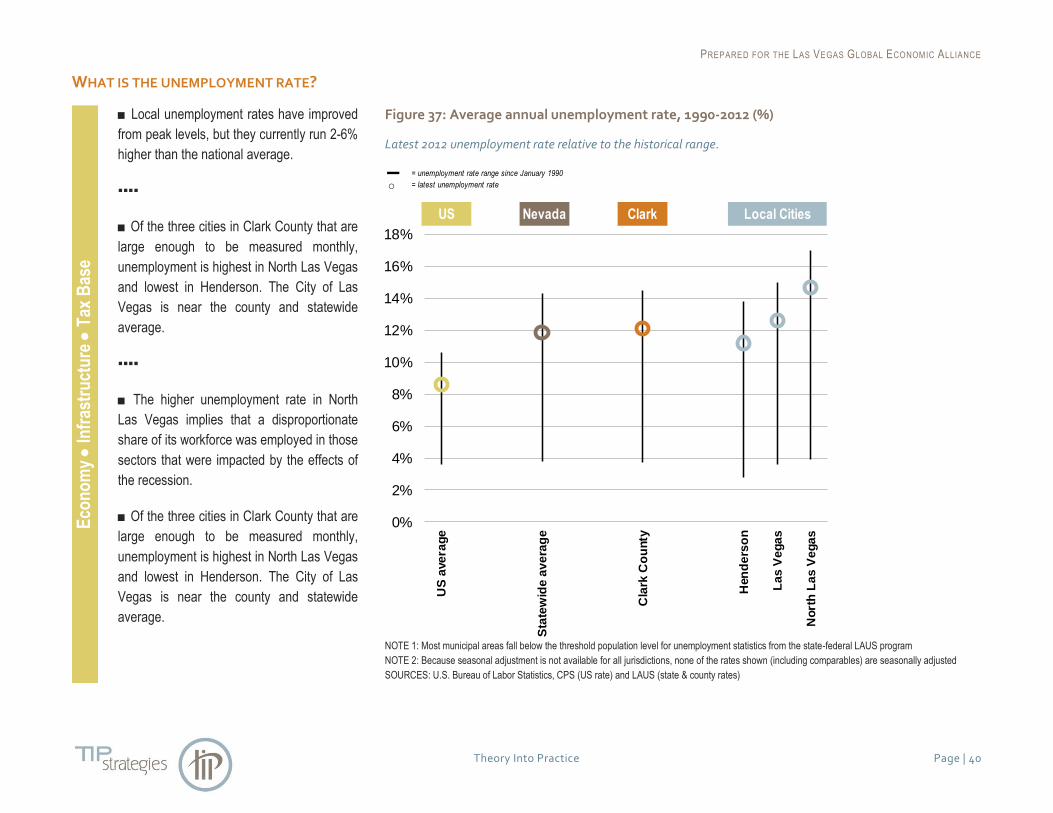
■ Local unemployment rates have improved
from peak levels, but they currently run 2-6%
higher than the national average.
▪▪▪▪
■ Of the three cities in Clark County that are
large enough to be measured monthly,
unemployment is highest in North Las Vegas
and lowest in Henderson. The City of Las
Vegas is near the county and statewide
average.
▪▪▪▪
■ The higher unemployment rate in North
Las Vegas implies that a disproportionate
share of its workforce was employed in those
sectors that were impacted by the effects of
the recession.
■ Of the three cities in Clark County that are
large enough to be measured monthly,
unemployment is highest in North Las Vegas
and lowest in Henderson. The City of Las
Vegas is near the county and statewide
average.
Figure 37: Average annual unemployment rate, 1990-2012 (%)
Latest 2012 unemployment rate relative to the historical range.
NOTE 1: Most municipal areas fall below the threshold population level for unemployment statistics from the state-federal LAUS program
NOTE 2: Because seasonal adjustment is not available for all jurisdictions, none of the rates shown (including comparables) are seasonally adjusted
SOURCES: U.S. Bureau of Labor Statistics, CPS (US rate) and LAUS (state & county rates)
▬ = unemployment rate range since January 1990
○ = latest unemployment rate
Local CitiesUS Nevada Clark
0%
2%
4%
6%
8%
10%
12%
14%
16%
18%
US
ave
rag
e
Sta
tew
ide
av
era
ge
Cla
rk C
ou
nty
Hen
de
rso
n
La
s V
eg
as
No
rth
La
s V
eg
as

PREPARED FOR THE LAS VEGAS GLOBAL ECONOMIC ALLIANCE
Theory Into Practice Page | 41
HOW HAS THE UNEMPLOYMENT RATE COMPARED TO THE NATION OVER TIME? E
con
om
y
Infr
astr
uct
ure
T
ax B
ase
■ In neither the 1991-1992 recession nor the
2001-2002 recession did unemployment
rates in Nevada, Clark County, or Las
Vegas, diverge significantly from the US
average.
▪▪▪▪
■ The Great Recession of 2007-2009 was
different. Jobless rates in Nevada swung
wildly out of balance from a US cyclical
pattern that was already quite severe. This
reflects the “one-two punch” of discretionary
losses to the region’s export base (tourism
and gaming) and the secondary impacts on
its growth sector.
Figure 38: Unemployment rates compared
Latest 2012 unemployment rate relative to the historical range.
SOURCE: U.S. Bureau of Labor Statistics, CPS (US rate) and LAUS (state & county rates)
0%
2%
4%
6%
8%
10%
12%
14%
16%
19
91
19
92
19
93
19
94
19
95
19
96
19
97
19
98
19
99
20
00
20
01
20
02
20
03
20
04
20
05
20
06
20
07
20
08
20
09
20
10
20
11
20
12
USA Nevada Clark County
PREPARED FOR THE LAS VEGAS GLOBAL ECONOMIC ALLIANCE
Theory Into Practice Page | 42
HOW MUCH HAS UNEMPLOYMENT IMPROVED? E
con
om
y
Infr
astr
uct
ure
T
ax B
ase
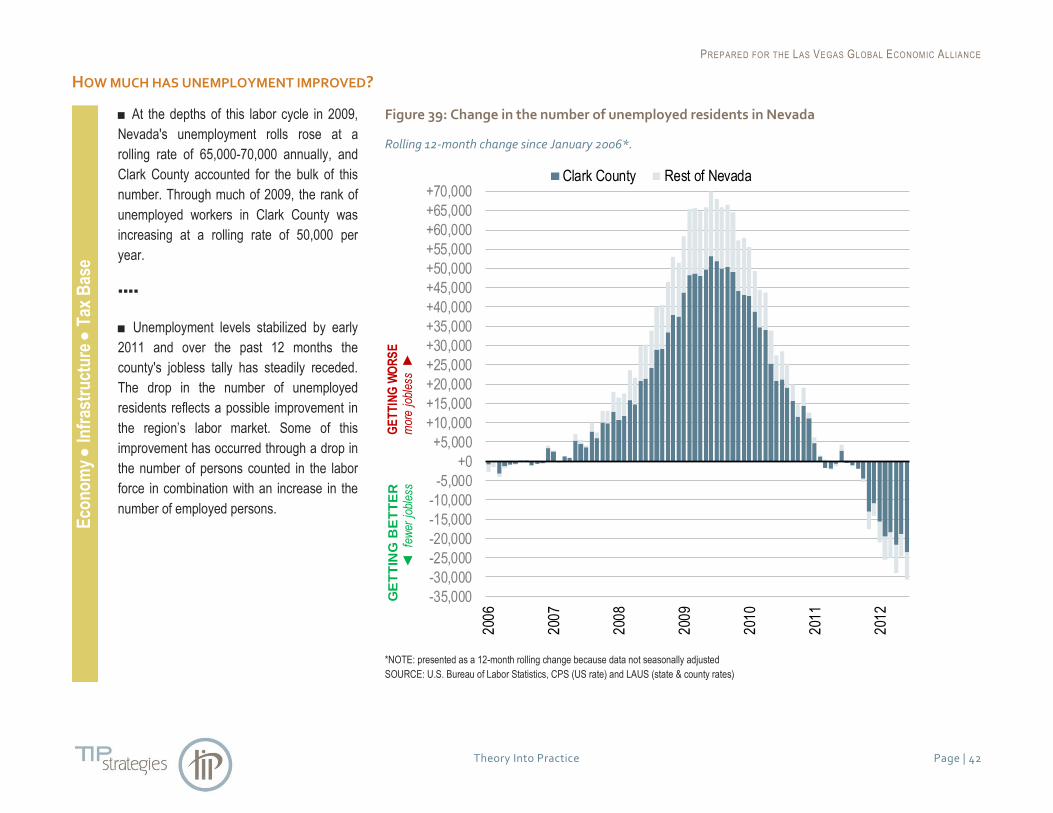
■ At the depths of this labor cycle in 2009,
Nevada's unemployment rolls rose at a
rolling rate of 65,000-70,000 annually, and
Clark County accounted for the bulk of this
number. Through much of 2009, the rank of
unemployed workers in Clark County was
increasing at a rolling rate of 50,000 per
year.
▪▪▪▪
■ Unemployment levels stabilized by early
2011 and over the past 12 months the
county's jobless tally has steadily receded.
The drop in the number of unemployed
residents reflects a possible improvement in
the region’s labor market. Some of this
improvement has occurred through a drop in
the number of persons counted in the labor
force in combination with an increase in the
number of employed persons.
Figure 39: Change in the number of unemployed residents in Nevada
Rolling 12-month change since January 2006*.
*NOTE: presented as a 12-month rolling change because data not seasonally adjusted
SOURCE: U.S. Bureau of Labor Statistics, CPS (US rate) and LAUS (state & county rates)
-35,000
-30,000
-25,000
-20,000
-15,000
-10,000
-5,000
+0
+5,000
+10,000
+15,000
+20,000
+25,000
+30,000
+35,000
+40,000
+45,000
+50,000
+55,000
+60,000
+65,000
+70,000
200
6
200
7
200
8
200
9
201
0
201
1
201
2
Clark County Rest of Nevada
GE
TT
ING
WO
RS
Em
ore
jobl
ess
GE
TT
ING
BE
TT
ER
few
er j
oble
ss
PREPARED FOR THE LAS VEGAS GLOBAL ECONOMIC ALLIANCE
Theory Into Practice Page | 43
WHERE DO THE UNEMPLOYED LIVE IN THE REGION? E
con
om
y
Infr
astr
uct
ure
T
ax B
ase
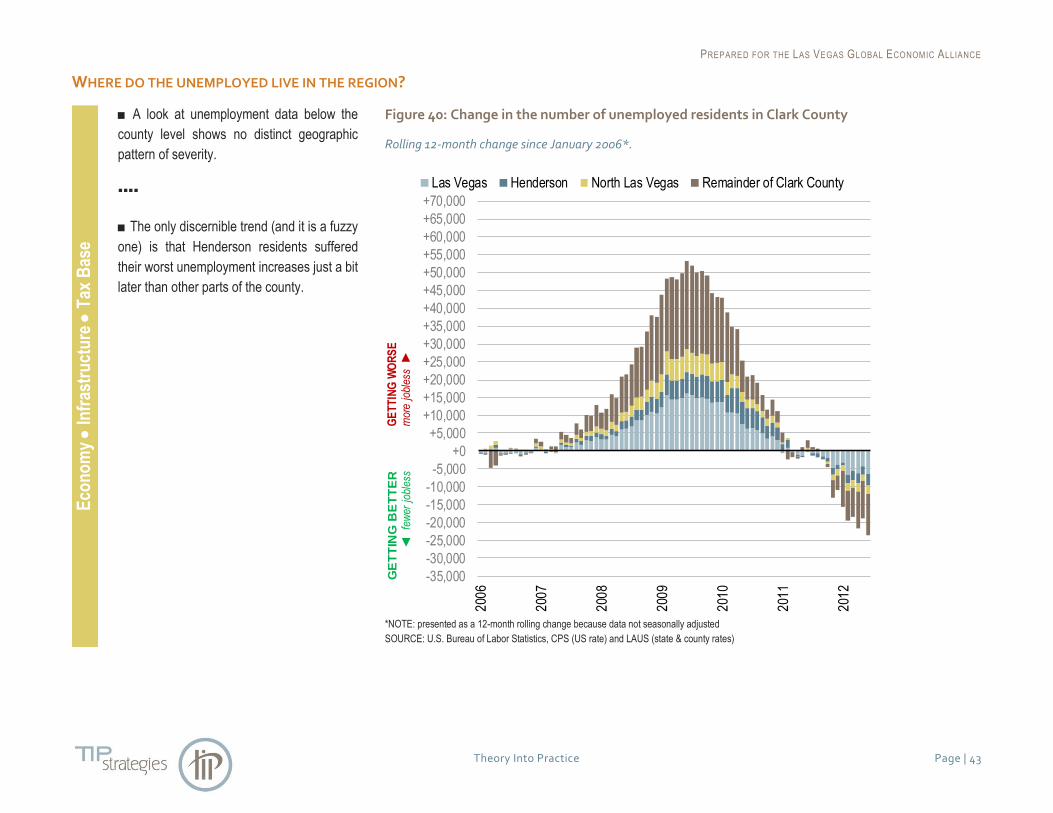
■ A look at unemployment data below the
county level shows no distinct geographic
pattern of severity.
▪▪▪▪
■ The only discernible trend (and it is a fuzzy
one) is that Henderson residents suffered
their worst unemployment increases just a bit
later than other parts of the county.
Figure 40: Change in the number of unemployed residents in Clark County
Rolling 12-month change since January 2006*.
*NOTE: presented as a 12-month rolling change because data not seasonally adjusted
SOURCE: U.S. Bureau of Labor Statistics, CPS (US rate) and LAUS (state & county rates)
-35,000
-30,000
-25,000
-20,000
-15,000
-10,000
-5,000
+0
+5,000
+10,000
+15,000
+20,000
+25,000
+30,000
+35,000
+40,000
+45,000
+50,000
+55,000
+60,000
+65,000
+70,000
200
6
200
7
200
8
200
9
201
0
201
1
201
2
Las Vegas Henderson North Las Vegas Remainder of Clark County
GE
TT
ING
WO
RS
Em
ore
jobl
ess
GE
TT
ING
BE
TT
ER
few
er j
oble
ss

PREPARED FOR THE LAS VEGAS GLOBAL ECONOMIC ALLIANCE
Theory Into Practice Page | 44
WHAT ARE LONG-TERM EMPLOYMENT TRENDS IN THE REGION? E
con
om
y
Infr
astr
uct
ure
T
ax B
ase
■ According to EMSI, total employment (this
includes full-time and part-time jobs and self-
employed workers) peaked just below 1.2
million in Clark County in 2007.
▪▪▪▪
■ EMSI does not project the county to
surpass its previous peak job level again
until 2017, another five years from now.
▪▪▪▪
■ The pace of job growth in the years ahead
will be slower than Clark County has
experienced in recent years.
Figure 41: The job base in Clark County
Projected recovery of lost jobs still years ahead.
SOURCE: EMSI Complete Employment - 2012.2
0
200,000
400,000
600,000
800,000
1,000,000
1,200,000
1,400,000
2001 2006 2011 2016 2021
history projection ►

PREPARED FOR THE LAS VEGAS GLOBAL ECONOMIC ALLIANCE
Theory Into Practice Page | 45
HOW MANY JOBS ARE PROJECTED FOR THE FUTURE? E
con
om
y
Infr
astr
uct
ure
T
ax B
ase
■ At the peak of the boom in 2005, the Las
Vegas MSA added nearly 74,000 jobs in a
single year. At the depths of the recession in
2009, more than 76,000 jobs were shed.
This was an unprecedented cyclical swing
within a four-year period.
▪▪▪▪
■ Sometimes severe recessions can be
followed by a palpable "snap" in recovery.
Not so this time. Employment in the years
ahead will flirt with perhaps as many as
20,000 net new jobs per year, but job growth
is unlikely to outpace this level according to
EMSI.
Figure 42: Annual net job change in Clark County
With projections for the decade ahead.
SOURCE: EMSI Complete Employment - 2012.2
-80,000
-60,000
-40,000
-20,000
+0
+20,000
+40,000
+60,000
+80,000
200
22
003
200
42
005
200
62
007
200
82
009
201
02
011
201
22
013
201
42
015
201
62
017
201
82
019
202
02
021
Annual net job change
(+/-)
history projection ►
PREPARED FOR THE LAS VEGAS GLOBAL ECONOMIC ALLIANCE
Theory Into Practice Page | 46
WHAT IS THE DISTRIBUTION OF JOBS IN CLARK COUNTY? E
con
om
y
Infr
astr
uct
ure
T
ax B
ase
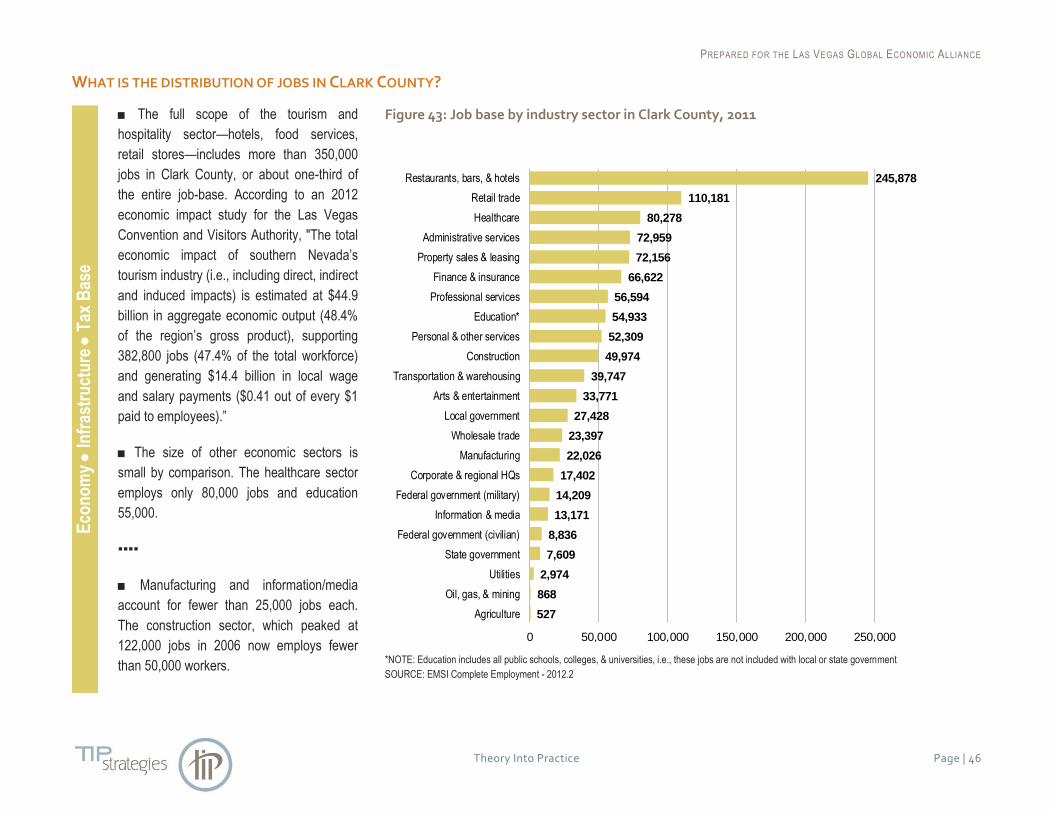
■ The full scope of the tourism and
hospitality sector—hotels, food services,
retail stores—includes more than 350,000
jobs in Clark County, or about one-third of
the entire job-base. According to an 2012
economic impact study for the Las Vegas
Convention and Visitors Authority, "The total
economic impact of southern Nevada’s
tourism industry (i.e., including direct, indirect
and induced impacts) is estimated at $44.9
billion in aggregate economic output (48.4%
of the region’s gross product), supporting
382,800 jobs (47.4% of the total workforce)
and generating $14.4 billion in local wage
and salary payments ($0.41 out of every $1
paid to employees).”
■ The size of other economic sectors is
small by comparison. The healthcare sector
employs only 80,000 jobs and education
55,000.
▪▪▪▪
■ Manufacturing and information/media
account for fewer than 25,000 jobs each.
The construction sector, which peaked at
122,000 jobs in 2006 now employs fewer
than 50,000 workers.
Figure 43: Job base by industry sector in Clark County, 2011
*NOTE: Education includes all public schools, colleges, & universities, i.e., these jobs are not included with local or state government
SOURCE: EMSI Complete Employment - 2012.2
527
868
2,974
7,609
8,836
13,171
14,209
17,402
22,026
23,397
27,428
33,771
39,747
49,974
52,309
54,933
56,594
66,622
72,156
72,959
80,278
110,181
245,878
0 50,000 100,000 150,000 200,000 250,000
Agriculture
Oil, gas, & mining
Utilities
State government
Federal government (civilian)
Information & media
Federal government (military)
Corporate & regional HQs
Manufacturing
Wholesale trade
Local government
Arts & entertainment
Transportation & warehousing
Construction
Personal & other services
Education*
Professional services
Finance & insurance
Property sales & leasing
Administrative services
Healthcare
Retail trade
Restaurants, bars, & hotels

PREPARED FOR THE LAS VEGAS GLOBAL ECONOMIC ALLIANCE
Theory Into Practice Page | 47
HOW DOES THE LOCAL DISTRIBUTION OF JOBS COMPARE TO THE STATE? E
con
om
y
Infr
astr
uct
ure
T
ax B
ase
■ As of 2011, Clark County was home to
71% of the state's jobs. The sector with the
largest share of statewide employment is
accommodation / food services (84%). More
than 1 in 5 of the state's military-related jobs
are also located in Clark County.
▪▪▪▪
■ Sectors with surprisingly low shares of
state employment are manufacturing (barely
half of the state total) and education (just
66% despite the presence of UNLV, CSN,
and other higher education institutions).
Figure 44: Distribution of jobs in Nevada as of 2011
*NOTE: Education includes all public schools, colleges, & universities, i.e., these jobs are not included with local or state government
SOURCE: EMSI Complete Employment - 2012.2
5%
8%
41%
52%
62%
65%
66%
67%
67%
68%
68%
69%
69%
69%
70%
70%
71%
71%
72%
72%
74%
77%
83%
84%
0% 20% 40% 60% 80% 100%
Oil, gas, & mining
Agriculture
State government
Manufacturing
Wholesale trade
Federal government (civilian)
Education*
Utilities
Local government
Professional services
Transportation & warehousing
Arts & entertainment
Healthcare
Finance & insurance
Construction
Personal & other services
TOTAL EMPLOYMENT
Property sales & leasing
Retail trade
Information & media
Administrative services
Corporate & regional HQs
Federal government (military)
Restaurants, bars, & hotels
Clark County Remainder of Nevada

PREPARED FOR THE LAS VEGAS GLOBAL ECONOMIC ALLIANCE
Theory Into Practice Page | 48
HOW HAVE THE VARIOUS SECTORS PERFORMED SINCE THE RECESSION? E
con
om
y
Infr
astr
uct
ure
T
ax B
ase
■ The construction sector shed substantial
numbers of jobs in each of the past five
years. Although in 2012, the job losses
began to abate.
▪▪▪▪
■ The healthcare sector grew steadily
through the past five years, even at the
depths of the downturn. Some sectors that
suffered heavy job losses in 2008 and 2009
were clearly in recovery by 2011. Job gains
in 2011 and 2012 in property sales & leasing
represented a hopeful sign of pending real
estate recovery.
▪▪▪▪
■ During the last three years, two tourism-
related industries (retail trade and
restaurants, bars, and hotels) have
experienced a rebound following losses
during the Great Recession.
▪▪▪▪
■ Notably finance & insurance and corporate
& regional HQs posted job losses early in the
recession but have added positions each
year since.
Figure 45: Clark County job trends by economic sector since 2008
A wide gap in the types of jobs gained and lost during the recession.
*NOTE: Education includes all public schools, colleges, & universities, i.e., these jobs are not included with local or state government
SOURCE: EMSI Complete Employment - 2012.3
4-year
Net change
+8,568+4,739+3,320+3,153+2,029+1,222
+817+417
-14-75-75
-190-1,996-2,337-2,509-2,586-2,959-3,768-5,817-6,916-7,040
-12,203-66,473
-70,000 -60,000 -50,000 -40,000 -30,000 -20,000 -10,000 +0 +10,000
ConstructionRestaurants, bars, & hotels
Retail tradeManufacturing
Administrative servicesWholesale trade
Local governmentProfessional servicesInformation & media
Transportation & warehousingProperty sales & leasing
UtilitiesOil, gas, & mining
Arts & entertainmentAgricultureEducation*
State governmentFederal government (civilian)Federal government (military)
Corporate & regional HQsPersonal & other services
Finance & insuranceHealthcare
2008 2009 2010 2011 2012
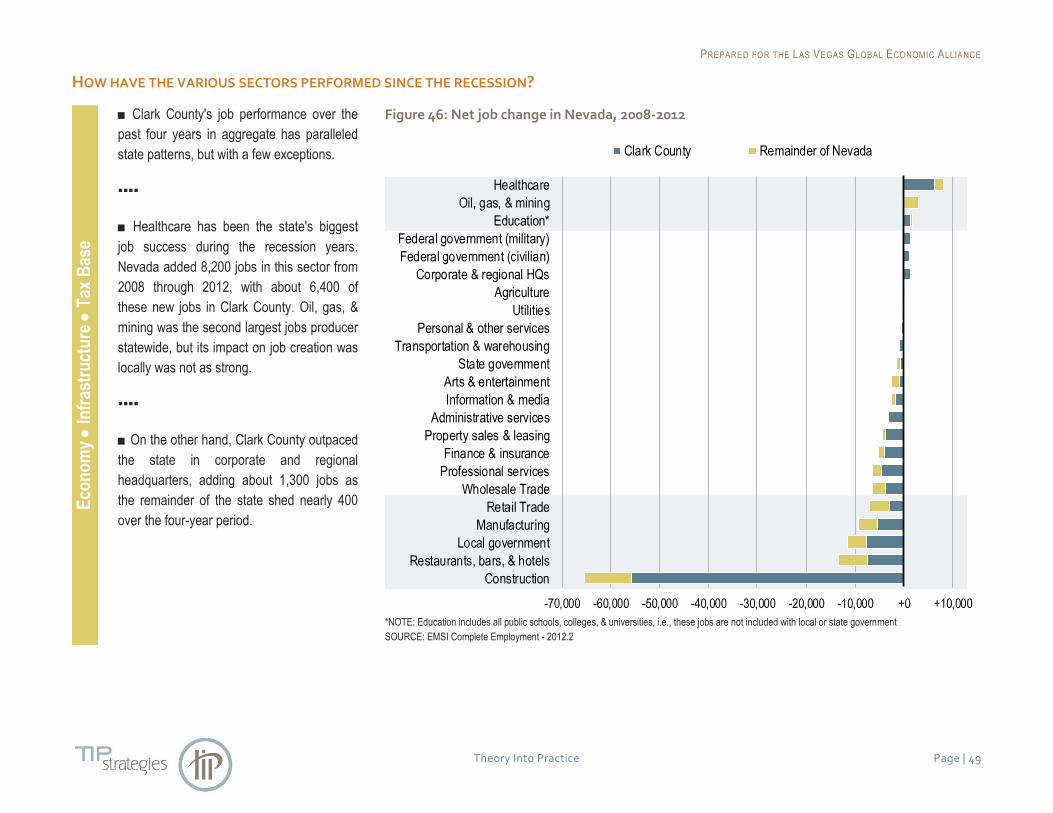
PREPARED FOR THE LAS VEGAS GLOBAL ECONOMIC ALLIANCE
Theory Into Practice Page | 49
HOW HAVE THE VARIOUS SECTORS PERFORMED SINCE THE RECESSION? E
con
om
y
Infr
astr
uct
ure
T
ax B
ase
■ Clark County's job performance over the
past four years in aggregate has paralleled
state patterns, but with a few exceptions.
▪▪▪▪
■ Healthcare has been the state's biggest
job success during the recession years.
Nevada added 8,200 jobs in this sector from
2008 through 2012, with about 6,400 of
these new jobs in Clark County. Oil, gas, &
mining was the second largest jobs producer
statewide, but its impact on job creation was
locally was not as strong.
▪▪▪▪
■ On the other hand, Clark County outpaced
the state in corporate and regional
headquarters, adding about 1,300 jobs as
the remainder of the state shed nearly 400
over the four-year period.
Figure 46: Net job change in Nevada, 2008-2012
*NOTE: Education includes all public schools, colleges, & universities, i.e., these jobs are not included with local or state government
SOURCE: EMSI Complete Employment - 2012.2
-70,000 -60,000 -50,000 -40,000 -30,000 -20,000 -10,000 +0 +10,000
Construction
Restaurants, bars, & hotels
Local government
Manufacturing
Retail Trade
Wholesale Trade
Professional services
Finance & insurance
Property sales & leasing
Administrative services
Information & media
Arts & entertainment
State government
Transportation & warehousing
Personal & other services
Utilities
Agriculture
Corporate & regional HQs
Federal government (civilian)
Federal government (military)
Education*
Oil, gas, & mining
Healthcare
Clark County Remainder of Nevada

PREPARED FOR THE LAS VEGAS GLOBAL ECONOMIC ALLIANCE
Theory Into Practice Page | 50
HOW ARE THE VARIOUS SECTORS EXPECTED TO PERFORM OVER THE NEXT DECADE? E
con
om
y
Infr
astr
uct
ure
T
ax B
ase
■ Healthcare will continue to be a major job
gainer in the years ahead, but other sectors,
including hotel & food services, retail trade,
financial services, and property sales/leasing
will also be among the largest job gainers.
▪▪▪▪
■ Construction jobs as well as state and
local government employment will be among
the weakest performing labor sectors in the
years ahead, according to EMSI.
Perspective
Notably, EMSI’s projections do not foresee
significant increases in the region’s
professional services sector or information &
media. It is within these two sectors that
most information technology companies are
classified. EMSI’s methodology is based
partially on national forecasts and past local
trends. This may account for low projections
in spite of the region’s recent success in
drawing IT investment in Clark County.
Figure 47: Clark County's job base in 2011 + forecast 10-year change
*NOTE: Education includes all public schools, colleges, & universities, i.e., these jobs are not included with local or state government
SOURCE: EMSI Complete Employment - 2012.2
10-year
net change
+18,002+14,312+16,328+10,366+16,594+19,558+10,505
+3,653+11,324
-6,073+5,754+5,863-1,515+4,806+3,466+3,490
+226+785+811-518
-94+394
+78
-25,000 25,000 75,000 125,000 175,000 225,000
AgricultureOil, gas, & mining
UtilitiesState government
Federal government (civilian)Information & media
Federal government (military)Corporate & regional HQs
ManufacturingWholesale trade
Local governmentArts & entertainment
Transportation & warehousingConstruction
Personal & other servicesEducation*
Professional servicesFinance & insurance
Property sales & leasingAdministrative services
HealthcareRetail trade
Restaurants, bars, & hotels
2011 10-year net change to 2021

PREPARED FOR THE LAS VEGAS GLOBAL ECONOMIC ALLIANCE
Theory Into Practice Page | 51
IN WHAT SECTORS IS CLARK COUNTY’S ECONOMY SPECIALIZED? E
con
om
y
Infr
astr
uct
ure
T
ax B
ase
■ Industry sectors associated with tourism
(hotels & restaurants; arts & entertainment)
as well as those associated with population
growth (property sales & leasing) held high
concentrations of employment in Clark
County as of 2011. More surprising is the
relatively high LQ of 1.36 for corporate and
regional headquarters, although this may be
associated with some of tourism and
gaming-related companies based in the
county.
▪▪▪▪
■ Slipping into the category of "under-
represented" are the healthcare and
education sectors, two of the most stable
types of jobs nationwide. The tech-oriented
sector of information & media also is a bit
below average.
Perspective
While the region has enjoyed recent success
in attracting investment from technology-
related companies, Clark County cannot yet
call itself a technology center. This, however,
is not to say that the Valley is without
significant potential.
Figure 48: Clark County industry sector strengths relative to the US
*NOTE: Education includes all public schools, colleges, & universities, i.e., these jobs are not included with local or state government
SOURCE: EMSI Complete Employment - 2012.2
Location quotient analysisUS average for each industry = 1.00
regional strength > 1.25
regional weakness < 0.75
AV
ER
AG
E .
0.00
0.25
0.50
0.75
1.00
1.25
1.50
1.75
2.00
2.25
2.50
2.75
3.00
3.25
Agriculture
Oil, gas, & mining
Manufacturing
State government
Federal government (civilian)
Education*
Wholesale trade
Healthcare
Information & media
Professional services
Personal & other services
Local government
Utilities
Construction
Retail trade
Transportation & warehousing
Finance & insurance
Federal government (military)
Administrative services
Corporate & regional HQs
Arts & entertainment
Property sales & leasing
Restaurants, bars, & hotels
ABOVE
BELOW
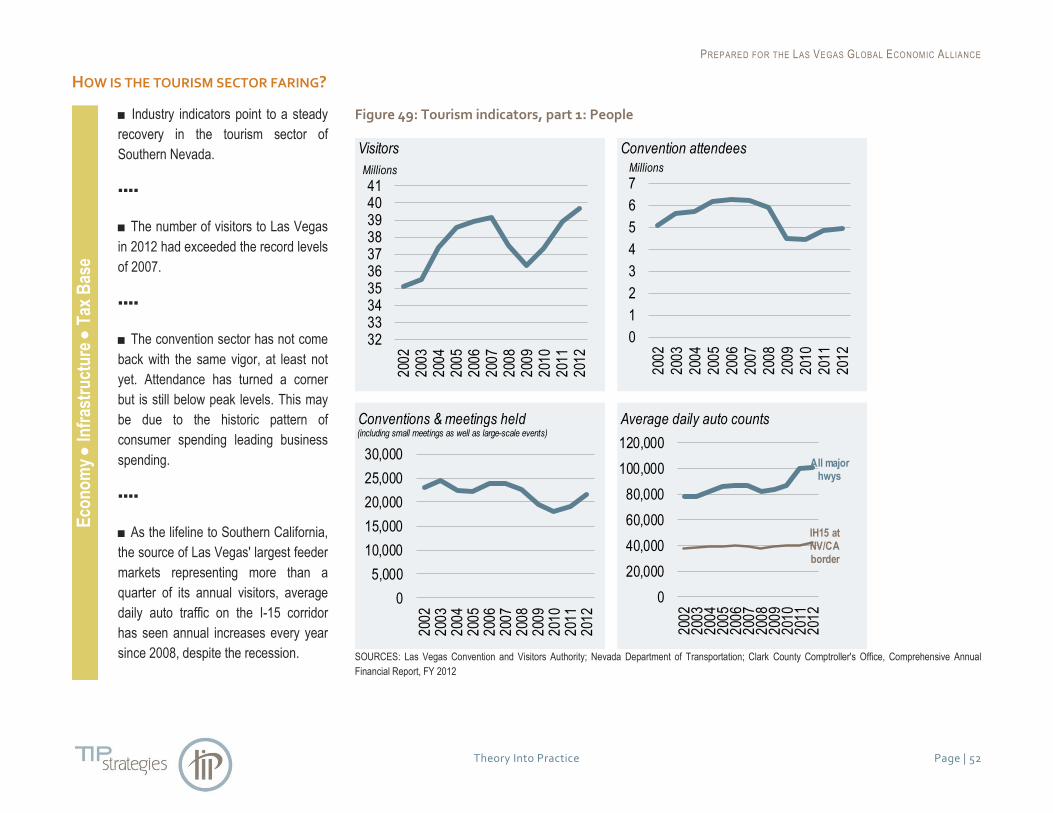
PREPARED FOR THE LAS VEGAS GLOBAL ECONOMIC ALLIANCE
Theory Into Practice Page | 52
HOW IS THE TOURISM SECTOR FARING? E
con
om
y
Infr
astr
uct
ure
T
ax B
ase
■ Industry indicators point to a steady
recovery in the tourism sector of
Southern Nevada.
▪▪▪▪
■ The number of visitors to Las Vegas
in 2012 had exceeded the record levels
of 2007.
▪▪▪▪
■ The convention sector has not come
back with the same vigor, at least not
yet. Attendance has turned a corner
but is still below peak levels. This may
be due to the historic pattern of
consumer spending leading business
spending.
▪▪▪▪
■ As the lifeline to Southern California,
the source of Las Vegas' largest feeder
markets representing more than a
quarter of its annual visitors, average
daily auto traffic on the I-15 corridor
has seen annual increases every year
since 2008, despite the recession.
Figure 49: Tourism indicators, part 1: People
SOURCES: Las Vegas Convention and Visitors Authority; Nevada Department of Transportation; Clark County Comptroller's Office, Comprehensive Annual
Financial Report, FY 2012
Visitors Convention attendees
(including small meetings as well as large-scale events)
Conventions & meetings held Average daily auto counts
32333435363738394041
200
22
003
200
42
005
200
62
007
200
82
009
201
02
011
201
2
Millions
0
5,000
10,000
15,000
20,000
25,000
30,000
200
22
003
200
42
005
200
62
007
200
82
009
201
02
011
201
2
All major hwys
IH15 at NV/CA border
0
20,000
40,000
60,000
80,000
100,000
120,000
200
22
003
200
42
005
200
62
007
200
82
009
201
02
011
201
2
0
1
2
3
4
5
6
7
200
2
200
3
200
4
200
5
200
6
200
7
200
8
200
9
201
0
201
1
201
2
Millions
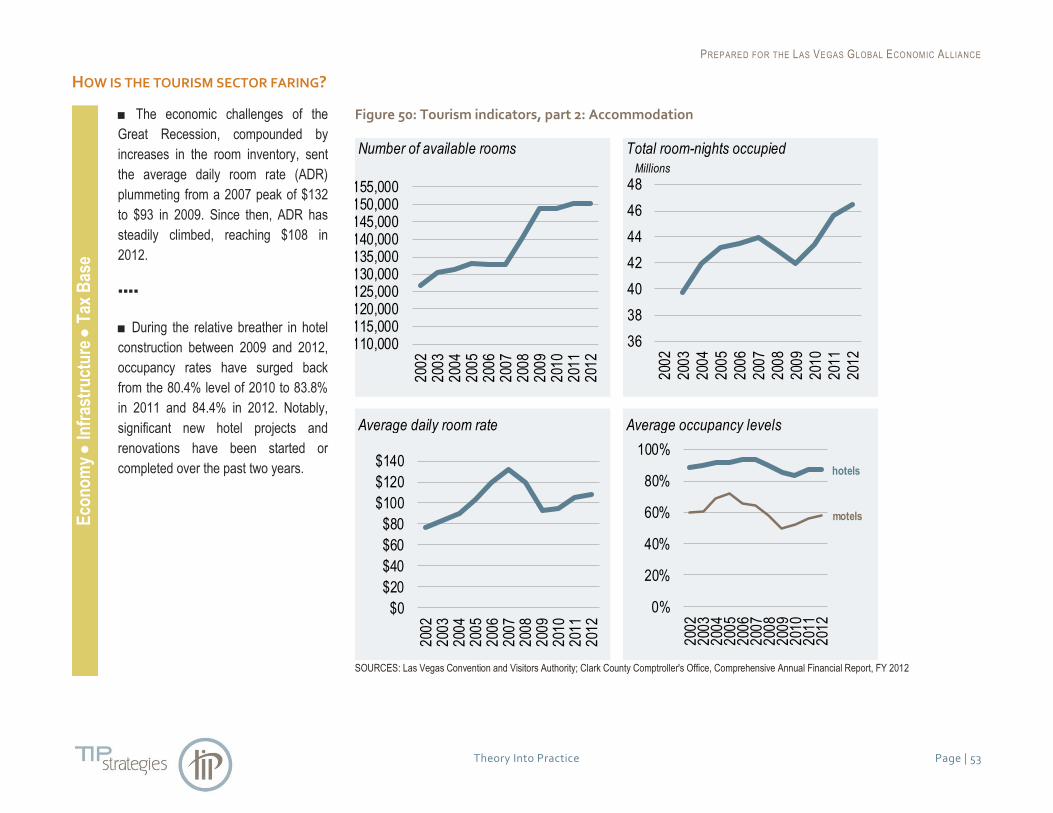
PREPARED FOR THE LAS VEGAS GLOBAL ECONOMIC ALLIANCE
Theory Into Practice Page | 53
HOW IS THE TOURISM SECTOR FARING? E
con
om
y
Infr
astr
uct
ure
T
ax B
ase
■ The economic challenges of the
Great Recession, compounded by
increases in the room inventory, sent
the average daily room rate (ADR)
plummeting from a 2007 peak of $132
to $93 in 2009. Since then, ADR has
steadily climbed, reaching $108 in
2012.
▪▪▪▪
■ During the relative breather in hotel
construction between 2009 and 2012,
occupancy rates have surged back
from the 80.4% level of 2010 to 83.8%
in 2011 and 84.4% in 2012. Notably,
significant new hotel projects and
renovations have been started or
completed over the past two years.
Figure 50: Tourism indicators, part 2: Accommodation
SOURCES: Las Vegas Convention and Visitors Authority; Clark County Comptroller's Office, Comprehensive Annual Financial Report, FY 2012
Number of available rooms Total room-nights occupied
Average daily room rate Average occupancy levels
110,000115,000120,000125,000130,000135,000140,000145,000150,000155,000
200
22
003
200
42
005
200
62
007
200
82
009
201
02
011
201
2$0
$20
$40
$60
$80
$100
$120
$140
200
22
003
200
42
005
200
62
007
200
82
009
201
02
011
201
2
hotels
motels
0%
20%
40%
60%
80%
100%
200
22
003
200
42
005
200
62
007
200
82
009
201
02
011
201
2
36
38
40
42
44
46
48
200
2
200
3
200
4
200
5
200
6
200
7
200
8
200
9
201
0
201
1
201
2
Millions
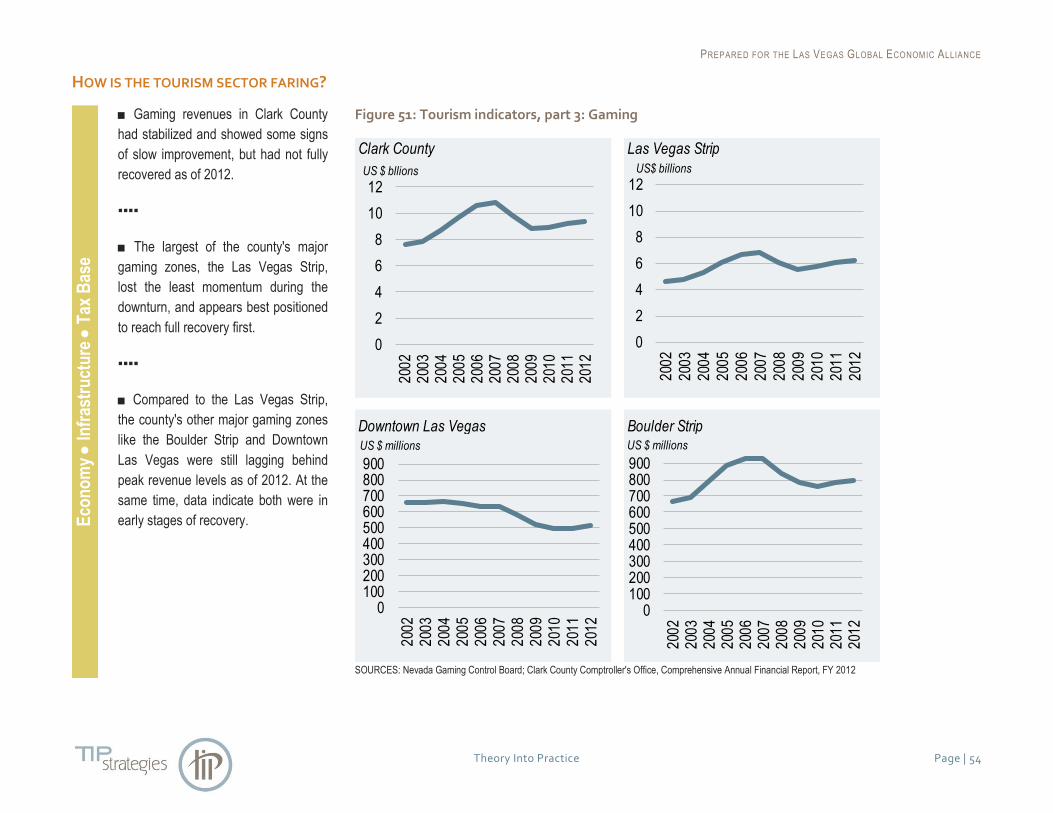
PREPARED FOR THE LAS VEGAS GLOBAL ECONOMIC ALLIANCE
Theory Into Practice Page | 54
HOW IS THE TOURISM SECTOR FARING? E
con
om
y
Infr
astr
uct
ure
T
ax B
ase
■ Gaming revenues in Clark County
had stabilized and showed some signs
of slow improvement, but had not fully
recovered as of 2012.
▪▪▪▪
■ The largest of the county's major
gaming zones, the Las Vegas Strip,
lost the least momentum during the
downturn, and appears best positioned
to reach full recovery first.
▪▪▪▪
■ Compared to the Las Vegas Strip,
the county's other major gaming zones
like the Boulder Strip and Downtown
Las Vegas were still lagging behind
peak revenue levels as of 2012. At the
same time, data indicate both were in
early stages of recovery.
Figure 51: Tourism indicators, part 3: Gaming
SOURCES: Nevada Gaming Control Board; Clark County Comptroller's Office, Comprehensive Annual Financial Report, FY 2012
Clark County Las Vegas Strip
Downtown Las Vegas Boulder Strip
0
2
4
6
8
10
12
200
22
003
200
42
005
200
62
007
200
82
009
201
02
011
201
2
US $ bllions
0100200300400500600700800900
200
22
003
200
42
005
200
62
007
200
82
009
201
02
011
201
2
US $ millions
0100200300400500600700800900
200
22
003
200
42
005
200
62
007
200
82
009
201
02
011
201
2
US $ millions
0
2
4
6
8
10
12
200
2
200
3
200
4
200
5
200
6
200
7
200
8
200
9
201
0
201
1
201
2
US$ billions

PREPARED FOR THE LAS VEGAS GLOBAL ECONOMIC ALLIANCE
Theory Into Practice Page | 55
HOW CONNECTED IS THE REGION THROUGH AIR? E
con
om
y
Infr
astr
uct
ure
T
ax B
ase
■ Passenger enplanements at
McCarran declined precipitously during
the Great Recession. Like other data
measuring visitor traffic, these are
showing healthy signs of improvement.
■ Air cargo volumes have not
performed as well but this may be due,
in part, to structural changes in the IT
era; similar trends have been seen at
other airports.
▪▪▪▪
■ Perhaps overlooked are the market
shares of passenger carriers.
Southwest continues to strengthen its
position as McCarran's top carrier. It
has lost a major direct competitor as
US Airway's role at the airport has
receded. As of 2012, SWA was nearly
four times the volume of the airport's
second placed carrier. Moreover, last
year saw a steep increase in market
share for other airlines serving
Southern Nevada.
Figure 52: McCarran International Airport: infrastructure & connectivity
SOURCES: McCarran International Airport, Department of Aviation; Clark County Comptroller's Office, Comprehensive Annual Financial Report, FY 2011
Number of passengers enplaned Tons of air cargo handled
*Delta includes the merged operations of Northwest; United includes the merged operations of Continental
Market share of 5 top passenger airlines at McCarran International Airport
18
19
20
21
22
23
24
200
6
200
8
201
0
201
2
Millions
18% 21% 22% 23% 25%32%
5% 5% 5% 6% 6%6%23% 19% 15% 9% 7%5%
9% 9% 9% 11% 11%9%
12% 11% 12% 12% 11% 9%
33% 35% 37% 39% 39% 39%
0%
20%
40%
60%
80%
100%
2007 2008 2009 2010 2011 2012
Southwest
United*
Delta*
US Airways
American
Remainder of market
0
20,000
40,000
60,000
80,000
100,000
120,000
200
6
200
8
201
0
201
2
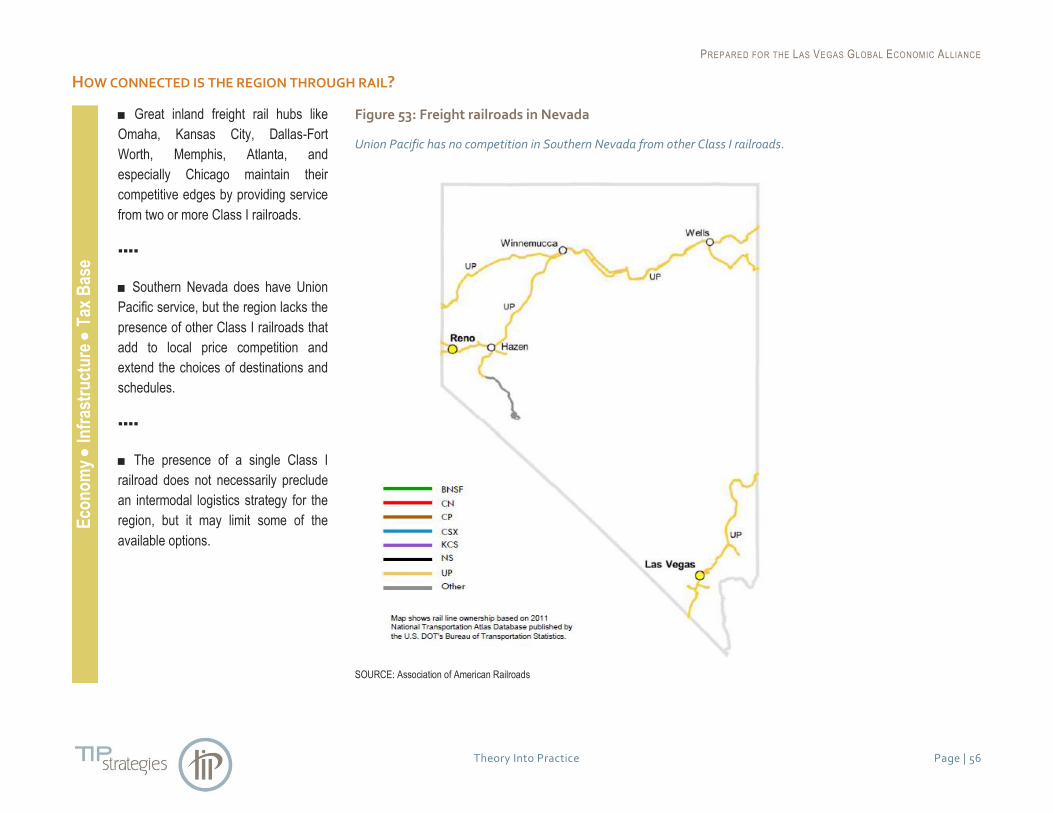
PREPARED FOR THE LAS VEGAS GLOBAL ECONOMIC ALLIANCE
Theory Into Practice Page | 56
HOW CONNECTED IS THE REGION THROUGH RAIL? E
con
om
y
Infr
astr
uct
ure
T
ax B
ase
■ Great inland freight rail hubs like
Omaha, Kansas City, Dallas-Fort
Worth, Memphis, Atlanta, and
especially Chicago maintain their
competitive edges by providing service
from two or more Class I railroads.
▪▪▪▪
■ Southern Nevada does have Union
Pacific service, but the region lacks the
presence of other Class I railroads that
add to local price competition and
extend the choices of destinations and
schedules.
▪▪▪▪
■ The presence of a single Class I
railroad does not necessarily preclude
an intermodal logistics strategy for the
region, but it may limit some of the
available options.
Figure 53: Freight railroads in Nevada
Union Pacific has no competition in Southern Nevada from other Class I railroads.
SOURCE: Association of American Railroads

PREPARED FOR THE LAS VEGAS GLOBAL ECONOMIC ALLIANCE
Theory Into Practice Page | 57
HOW DOES NEVADA COMPARE TO OTHER WESTERN STATES ON ELECTRICITY RATES? E
con
om
y
Infr
astr
uct
ure
T
ax B
ase
■ Nevada's electricity prices are near-
average among the Western US states.
It may be impossible to compete
directly against the cheap hydroelectric
power of the Pacific Northwest, yet
among the dry and highly urbanized
Southwestern states of California,
Arizona, and Colorado, Nevadans are
in a good competitive position.
▪▪▪▪
■ There is a noticeably wide gap in
average electricity prices for the state's
residential versus industrial customers.
In spite of Nevada's competitive prices
among the states of the US West,
Clark County has yet to see significant
industrial development as evidenced by
its low manufacturing LQ. The low
concentration of manufacturing activity
may, in part, be due to the lack of a
history of the industry in the region and
the associated lack of skilled workers.
Figure 54: Average retail price of electricity by end-use sector
Prices across Western US states as of May 2012.
SOURCE: U.S. Energy Information Administration, Form EIA-826, Monthly Electric Sales and Revenue Report with State Distributions Report.
Cents per kilowatthour
0
2
4
6
8
10
12
14
16
Ca
lifor
nia
Ari
zona
Co
lora
do
Ne
vada
Ne
w M
exic
o
Mon
tana
Ore
gon
Uta
h
Wyo
min
g
Wa
shin
gto
n
Idah
o
Residential
Commercial
Industrial
All Sectors
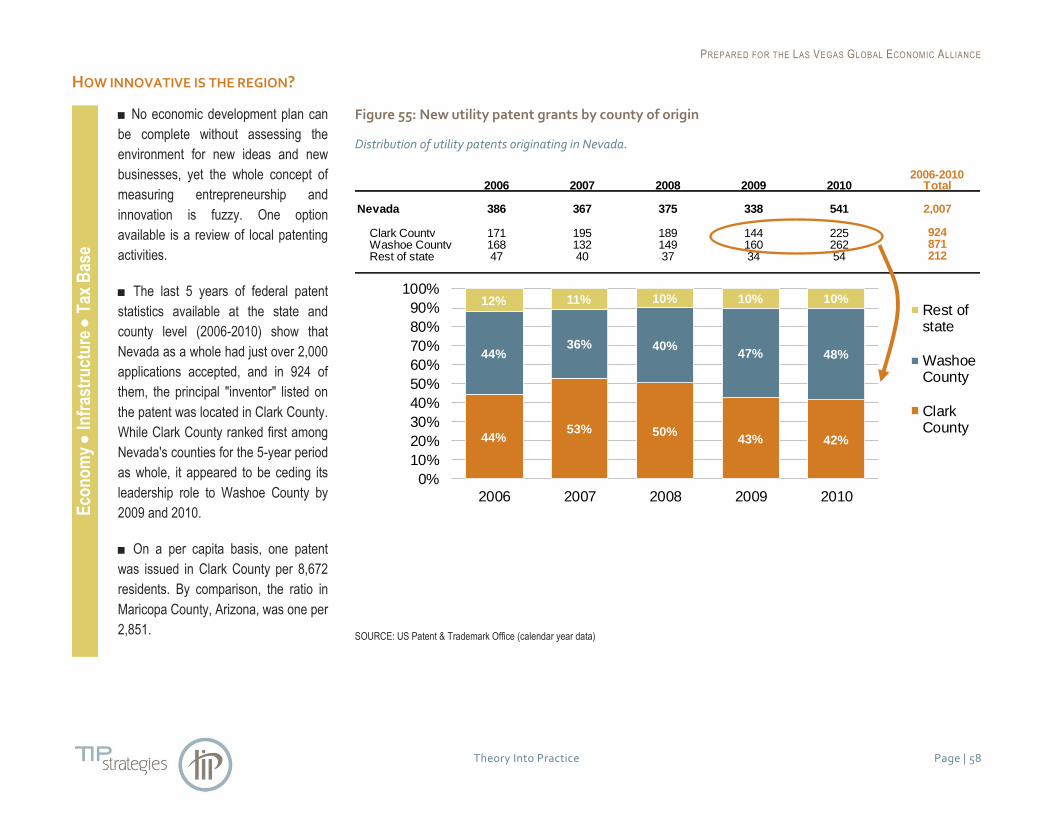
PREPARED FOR THE LAS VEGAS GLOBAL ECONOMIC ALLIANCE
Theory Into Practice Page | 58
HOW INNOVATIVE IS THE REGION? E
con
om
y
Infr
astr
uct
ure
T
ax B
ase
■ No economic development plan can
be complete without assessing the
environment for new ideas and new
businesses, yet the whole concept of
measuring entrepreneurship and
innovation is fuzzy. One option
available is a review of local patenting
activities.
■ The last 5 years of federal patent
statistics available at the state and
county level (2006-2010) show that
Nevada as a whole had just over 2,000
applications accepted, and in 924 of
them, the principal "inventor" listed on
the patent was located in Clark County.
While Clark County ranked first among
Nevada's counties for the 5-year period
as whole, it appeared to be ceding its
leadership role to Washoe County by
2009 and 2010.
■ On a per capita basis, one patent
was issued in Clark County per 8,672
residents. By comparison, the ratio in
Maricopa County, Arizona, was one per
2,851.
Figure 55: New utility patent grants by county of origin
Distribution of utility patents originating in Nevada.
SOURCE: US Patent & Trademark Office (calendar year data)
2006-20102006 2007 2008 2009 2010 Total
Nevada 386 367 375 338 541 2,007
Clark County 171 195 189 144 225 924Washoe County 168 132 149 160 262 871Rest of state 47 40 37 34 54 212
44%53% 50%
43% 42%
44%36% 40%
47% 48%
12% 11% 10% 10% 10%
0%
10%
20%
30%
40%
50%
60%
70%
80%
90%
100%
2006 2007 2008 2009 2010
Rest ofstate
WashoeCounty
ClarkCounty

PREPARED FOR THE LAS VEGAS GLOBAL ECONOMIC ALLIANCE
Theory Into Practice Page | 59
WHO IS INNOVATING IN THE REGION? E
con
om
y
Infr
astr
uct
ure
T
ax B
ase
■ Over the past five years, Clark
County's top patent grant recipients
have all been associated in some way
with the gaming industry.
Figure 56: New utility patent grants by applicant
Top 5 patent grantees from Clark County since 2006.
SOURCE: US Patent & Trademark Office (calendar year data)
2006-20102006 2007 2008 2009 2010 Total
International Game Technology (IGT)
Shuffle Master, Inc.
Bally Gaming, Inc.
Wms Gaming, Inc.
Progressive Gaming International Corp.
9 14 14
21
16 31 84
7 12 14 9 11 53
1 8 4 8
12
3 4 6 6 19
2 9 1
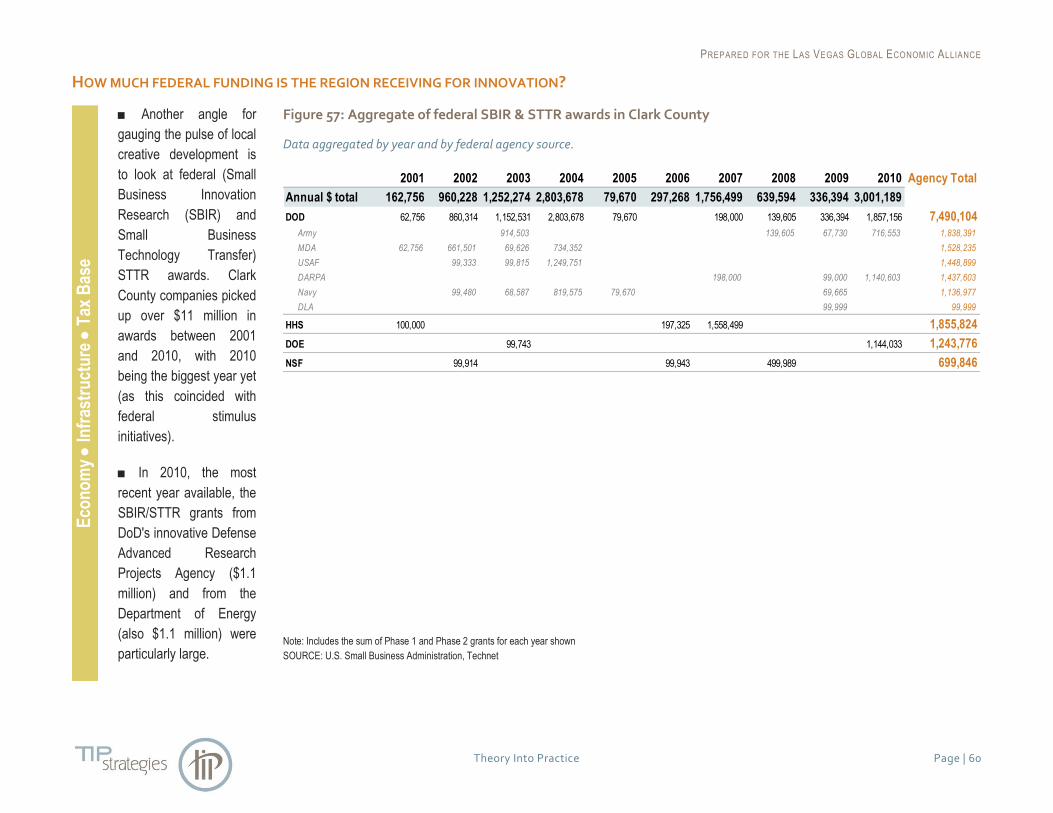
PREPARED FOR THE LAS VEGAS GLOBAL ECONOMIC ALLIANCE
Theory Into Practice Page | 60
HOW MUCH FEDERAL FUNDING IS THE REGION RECEIVING FOR INNOVATION? E
con
om
y
Infr
astr
uct
ure
T
ax B
ase
■ Another angle for
gauging the pulse of local
creative development is
to look at federal (Small
Business Innovation
Research (SBIR) and
Small Business
Technology Transfer)
STTR awards. Clark
County companies picked
up over $11 million in
awards between 2001
and 2010, with 2010
being the biggest year yet
(as this coincided with
federal stimulus
initiatives).
■ In 2010, the most
recent year available, the
SBIR/STTR grants from
DoD's innovative Defense
Advanced Research
Projects Agency ($1.1
million) and from the
Department of Energy
(also $1.1 million) were
particularly large.
Figure 57: Aggregate of federal SBIR & STTR awards in Clark County
Data aggregated by year and by federal agency source.
Note: Includes the sum of Phase 1 and Phase 2 grants for each year shown
SOURCE: U.S. Small Business Administration, Technet
2001 2002 2003 2004 2005 2006 2007 2008 2009 2010 Agency Total
Annual $ total 162,756 960,228 1,252,274 2,803,678 79,670 297,268 1,756,499 639,594 336,394 3,001,189
DOD 62,756 860,314 1,152,531 2,803,678 79,670 198,000 139,605 336,394 1,857,156 7,490,104
Army 914,503 139,605 67,730 716,553 1,838,391
MDA 62,756 661,501 69,626 734,352 1,528,235
USAF 99,333 99,815 1,249,751 1,448,899
DARPA 198,000 99,000 1,140,603 1,437,603
Navy 99,480 68,587 819,575 79,670 69,665 1,136,977
DLA 99,999 99,999
HHS 100,000 197,325 1,558,499 1,855,824
DOE 99,743 1,144,033 1,243,776
NSF 99,914 99,943 499,989 699,846
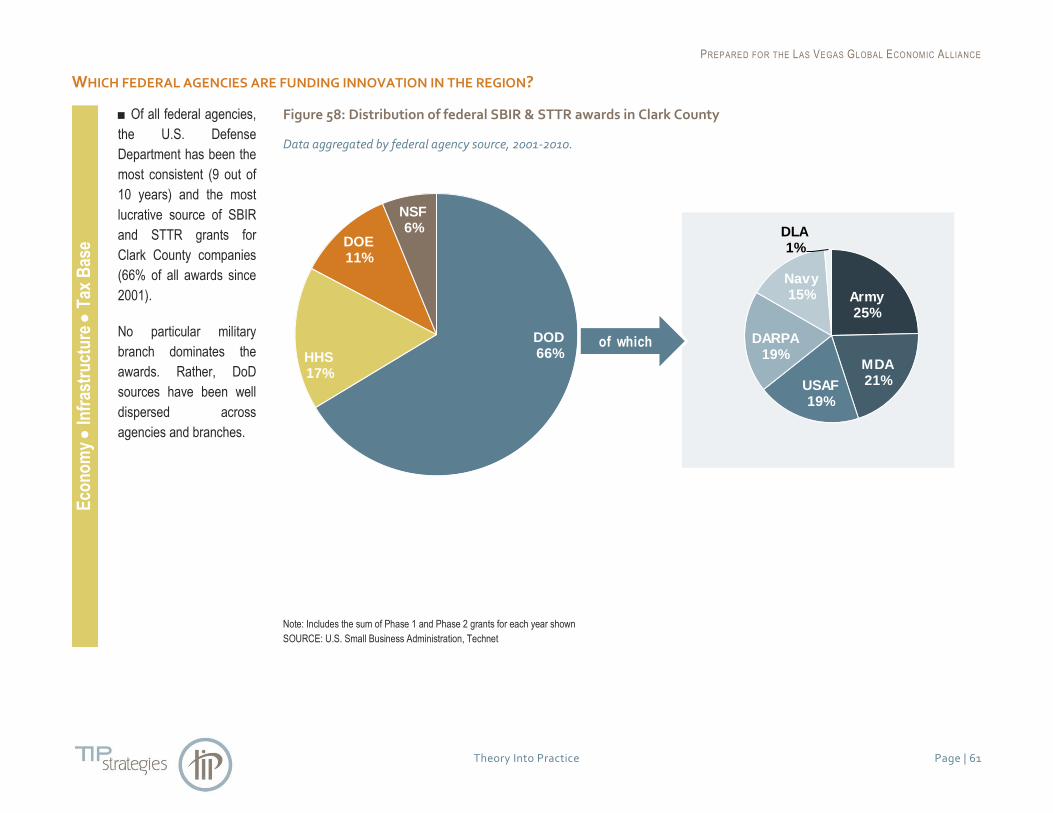
PREPARED FOR THE LAS VEGAS GLOBAL ECONOMIC ALLIANCE
Theory Into Practice Page | 61
WHICH FEDERAL AGENCIES ARE FUNDING INNOVATION IN THE REGION? E
con
om
y
Infr
astr
uct
ure
T
ax B
ase
■ Of all federal agencies,
the U.S. Defense
Department has been the
most consistent (9 out of
10 years) and the most
lucrative source of SBIR
and STTR grants for
Clark County companies
(66% of all awards since
2001).
No particular military
branch dominates the
awards. Rather, DoD
sources have been well
dispersed across
agencies and branches.
Figure 58: Distribution of federal SBIR & STTR awards in Clark County
Data aggregated by federal agency source, 2001-2010.
Note: Includes the sum of Phase 1 and Phase 2 grants for each year shown
SOURCE: U.S. Small Business Administration, Technet
DOD66%HHS
17%
DOE11%
NSF6%
Army25%
MDA21%USAF
19%
DARPA19%
Navy15%
DLA1%
of which
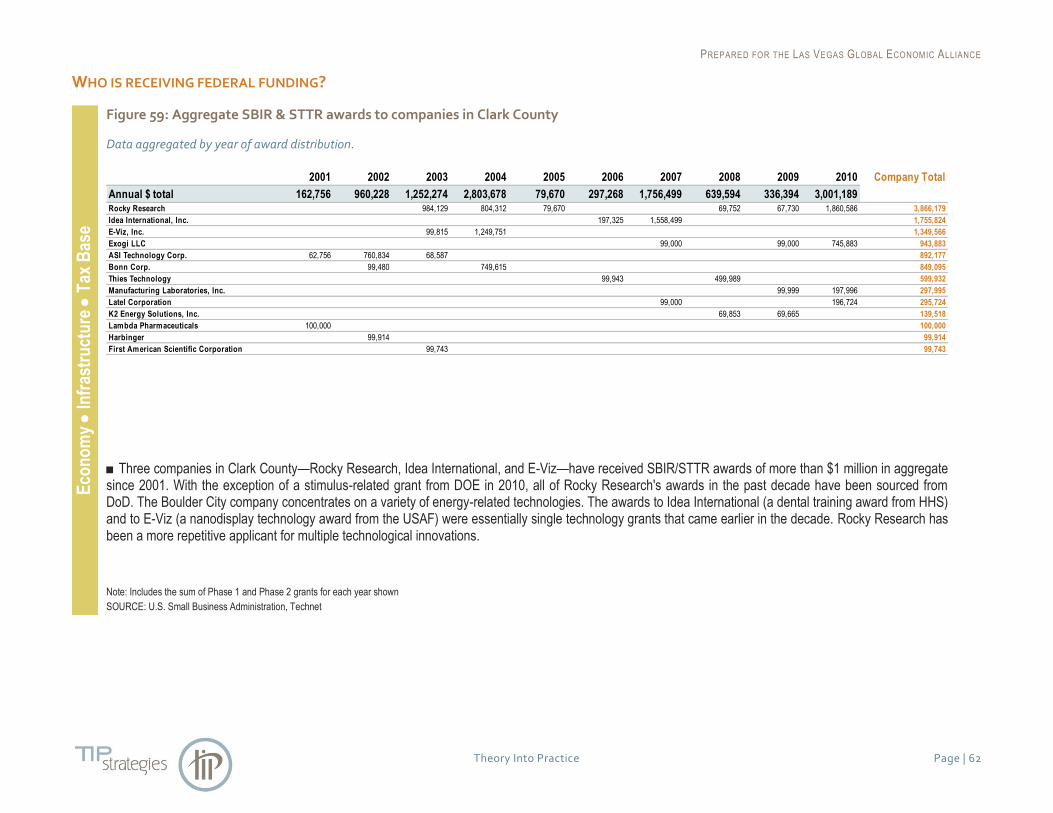
PREPARED FOR THE LAS VEGAS GLOBAL ECONOMIC ALLIANCE
Theory Into Practice Page | 62
WHO IS RECEIVING FEDERAL FUNDING? E
con
om
y
Infr
astr
uct
ure
T
ax B
ase
Figure 59: Aggregate SBIR & STTR awards to companies in Clark County
Data aggregated by year of award distribution.
■ Three companies in Clark County—Rocky Research, Idea International, and E-Viz—have received SBIR/STTR awards of more than $1 million in aggregate since 2001. With the exception of a stimulus-related grant from DOE in 2010, all of Rocky Research's awards in the past decade have been sourced from DoD. The Boulder City company concentrates on a variety of energy-related technologies. The awards to Idea International (a dental training award from HHS) and to E-Viz (a nanodisplay technology award from the USAF) were essentially single technology grants that came earlier in the decade. Rocky Research has been a more repetitive applicant for multiple technological innovations.
Note: Includes the sum of Phase 1 and Phase 2 grants for each year shown
SOURCE: U.S. Small Business Administration, Technet
2001 2002 2003 2004 2005 2006 2007 2008 2009 2010 Company Total
Annual $ total 162,756 960,228 1,252,274 2,803,678 79,670 297,268 1,756,499 639,594 336,394 3,001,189Rocky Research 984,129 804,312 79,670 69,752 67,730 1,860,586 3,866,179
Idea International, Inc. 197,325 1,558,499 1,755,824
E-Viz, Inc. 99,815 1,249,751 1,349,566
Exogi LLC 99,000 99,000 745,883 943,883
ASI Technology Corp. 62,756 760,834 68,587 892,177
Bonn Corp. 99,480 749,615 849,095
Thies Technology 99,943 499,989 599,932
Manufacturing Laboratories, Inc. 99,999 197,996 297,995
Latel Corporation 99,000 196,724 295,724
K2 Energy Solutions, Inc. 69,853 69,665 139,518
Lambda Pharmaceuticals 100,000 100,000
Harbinger 99,914 99,914
First American Scientific Corporation 99,743 99,743

PREPARED FOR THE LAS VEGAS GLOBAL ECONOMIC ALLIANCE
Theory Into Practice Page | 63
HOW ARE THE REGION’S REAL ESTATE SUBMARKETS DEFINED? R
eal E
stat
e
Figure 60: Real estate submarkets in the Las Vegas Valley
SOURCE: RCG Economics
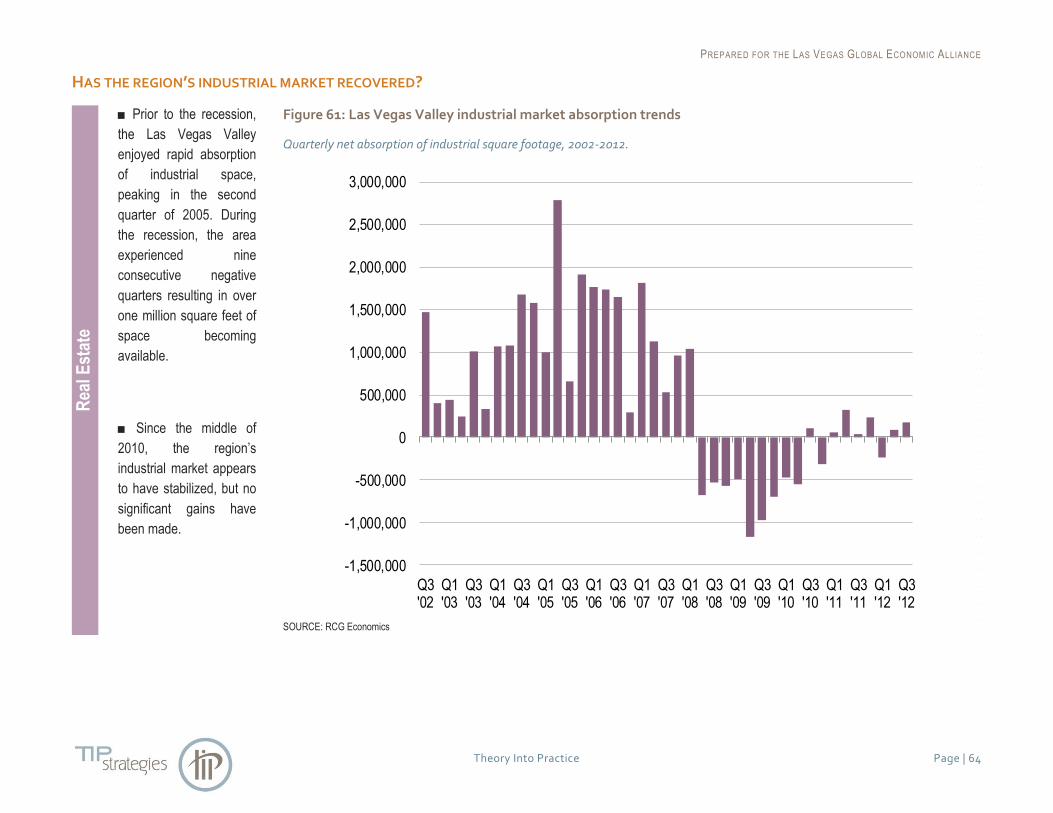
PREPARED FOR THE LAS VEGAS GLOBAL ECONOMIC ALLIANCE
Theory Into Practice Page | 64
HAS THE REGION’S INDUSTRIAL MARKET RECOVERED? R
eal E
stat
e
■ Prior to the recession,
the Las Vegas Valley
enjoyed rapid absorption
of industrial space,
peaking in the second
quarter of 2005. During
the recession, the area
experienced nine
consecutive negative
quarters resulting in over
one million square feet of
space becoming
available.
■ Since the middle of
2010, the region’s
industrial market appears
to have stabilized, but no
significant gains have
been made.
Figure 61: Las Vegas Valley industrial market absorption trends
Quarterly net absorption of industrial square footage, 2002-2012.
SOURCE: RCG Economics
-1,500,000
-1,000,000
-500,000
0
500,000
1,000,000
1,500,000
2,000,000
2,500,000
3,000,000
Q3'02
Q1'03
Q3'03
Q1'04
Q3'04
Q1'05
Q3'05
Q1'06
Q3'06
Q1'07
Q3'07
Q1'08
Q3'08
Q1'09
Q3'09
Q1'10
Q3'10
Q1'11
Q3'11
Q1'12
Q3'12

PREPARED FOR THE LAS VEGAS GLOBAL ECONOMIC ALLIANCE
Theory Into Practice Page | 65
ARE VACANCY RATES WITHIN THE INDUSTRIAL MARKET DECLINING? R
eal E
stat
e
■ As industrial space was
quickly absorbed during
the middle of the last
decade, vacancy rates
declined to 3.1 percent in
the second quarter of
2006.
■ After a sharp rise in
rates during the
recession, the region’s
industrial vacancy rate
has stubbornly remained
above 16 percent since
the second quarter of
2010.
Figure 62: Las Vegas Valley industrial vacancy rate trends
Industrial market quarterly vacancy rates, 2002-2012.
SOURCE: RCG Economics
16.1%
0%
2%
4%
6%
8%
10%
12%
14%
16%
18%
Q3'02
Q1'03
Q3'03
Q1'04
Q3'04
Q1'05
Q3'05
Q1'06
Q3'06
Q1'07
Q3'07
Q1'08
Q3'08
Q1'09
Q3'09
Q1'10
Q3'10
Q1'11
Q3'11
Q1'12
Q3'12
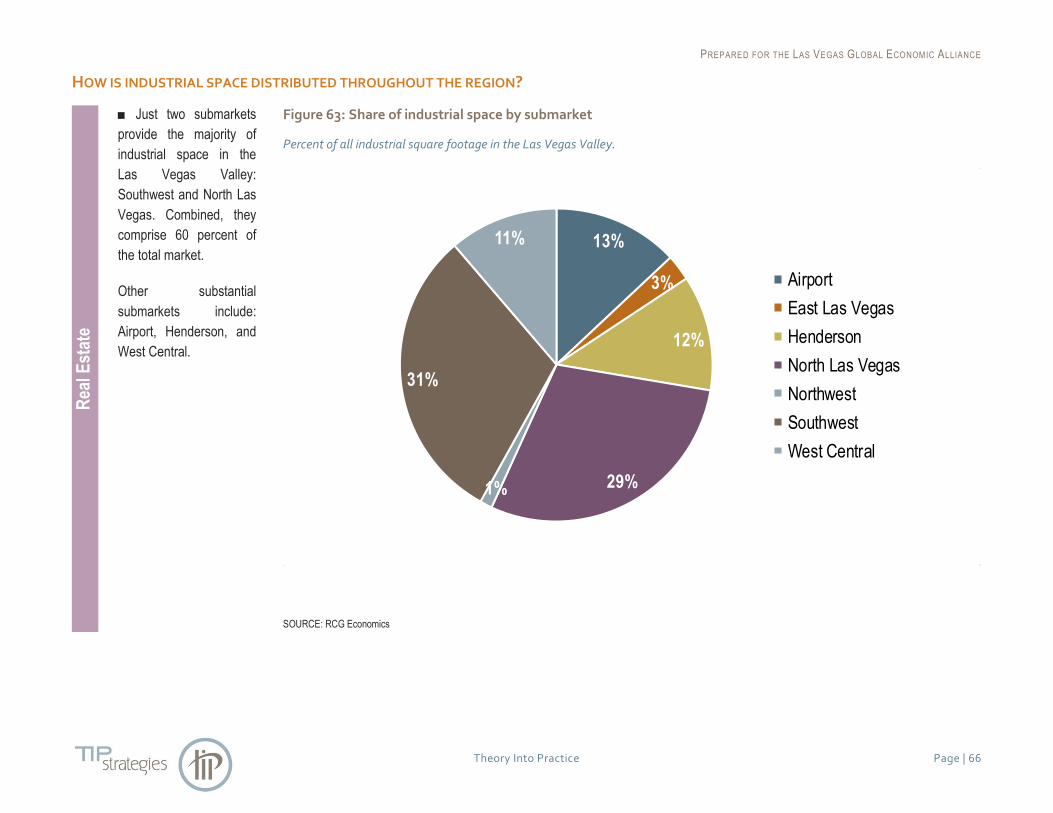
PREPARED FOR THE LAS VEGAS GLOBAL ECONOMIC ALLIANCE
Theory Into Practice Page | 66
HOW IS INDUSTRIAL SPACE DISTRIBUTED THROUGHOUT THE REGION? R
eal E
stat
e
■ Just two submarkets
provide the majority of
industrial space in the
Las Vegas Valley:
Southwest and North Las
Vegas. Combined, they
comprise 60 percent of
the total market.
Other substantial
submarkets include:
Airport, Henderson, and
West Central.
Figure 63: Share of industrial space by submarket
Percent of all industrial square footage in the Las Vegas Valley.
SOURCE: RCG Economics
13%
3%
12%
29%1%
31%
11%
Airport
East Las Vegas
Henderson
North Las Vegas
Northwest
Southwest
West Central
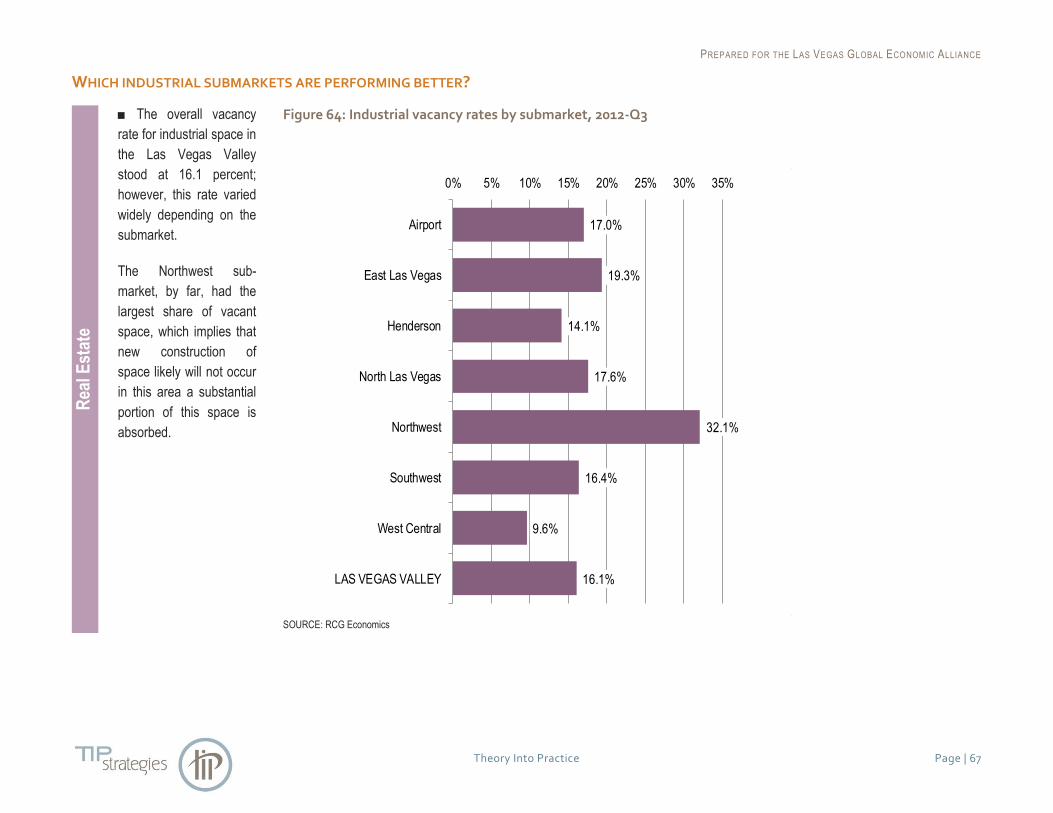
PREPARED FOR THE LAS VEGAS GLOBAL ECONOMIC ALLIANCE
Theory Into Practice Page | 67
WHICH INDUSTRIAL SUBMARKETS ARE PERFORMING BETTER? R
eal E
stat
e
■ The overall vacancy
rate for industrial space in
the Las Vegas Valley
stood at 16.1 percent;
however, this rate varied
widely depending on the
submarket.
The Northwest sub-
market, by far, had the
largest share of vacant
space, which implies that
new construction of
space likely will not occur
in this area a substantial
portion of this space is
absorbed.
Figure 64: Industrial vacancy rates by submarket, 2012-Q3
SOURCE: RCG Economics
17.0%
19.3%
14.1%
17.6%
32.1%
16.4%
9.6%
16.1%
0% 5% 10% 15% 20% 25% 30% 35%
Airport
East Las Vegas
Henderson
North Las Vegas
Northwest
Southwest
West Central
LAS VEGAS VALLEY

PREPARED FOR THE LAS VEGAS GLOBAL ECONOMIC ALLIANCE
Theory Into Practice Page | 68
HAS THE REGION’S OFFICE MARKET RECOVERED? R
eal E
stat
e
■ Prior to the “Great
Recession,” office space
within the region was
absorbed at a rapid pace,
peaking during the third
quarter of 2005 with over
a million square feet
occupied during those
three months.
Absorption rates
plummeted during the
first quarter of 2008,
which was the first period
of negative absorption
during the time series.
■ After several quarters
of more office space
becoming vacant than
occupied, the Las Vegas
Valley began to
experience positive
absorption occurring at a
noticeable rate during
2012.
Figure 65: Las Vegas Valley office market absorption trends
Quarterly net absorption of office square footage, 2002-2012.
SOURCE: RCG Economics
-800,000
-600,000
-400,000
-200,000
0
200,000
400,000
600,000
800,000
1,000,000
1,200,000
1,400,000
Q3'02
Q1'03
Q3'03
Q1'04
Q3'04
Q1'05
Q3'05
Q1'06
Q3'06
Q1'07
Q3'07
Q1'08
Q3'08
Q1'09
Q3'09
Q1'10
Q3'10
Q1'11
Q3'11
Q1'12
Q3'12

PREPARED FOR THE LAS VEGAS GLOBAL ECONOMIC ALLIANCE
Theory Into Practice Page | 69
ARE VACANCY RATES WITHIN THE OFFICE MARKET DECLINING? R
eal E
stat
e
■ During the recession,
the vacancy rate for office
space in the region more
than doubled. Since
2010, however, the rate
stabilized.
In recent quarters, the
vacancy rate appears to
be declining, which
appears to indicate that
the Valley’s office market
is showing signs of
recovery.
Figure 66: Las Vegas Valley office vacancy rate trends
Office market quarterly vacancy rates, 2002-2012.
SOURCE: RCG Economics
22.9%
0%
5%
10%
15%
20%
25%
30%
Q3'02
Q1'03
Q3'03
Q1'04
Q3'04
Q1'05
Q3'05
Q1'06
Q3'06
Q1'07
Q3'07
Q1'08
Q3'08
Q1'09
Q3'09
Q1'10
Q3'10
Q1'11
Q3'11
Q1'12
Q3'12
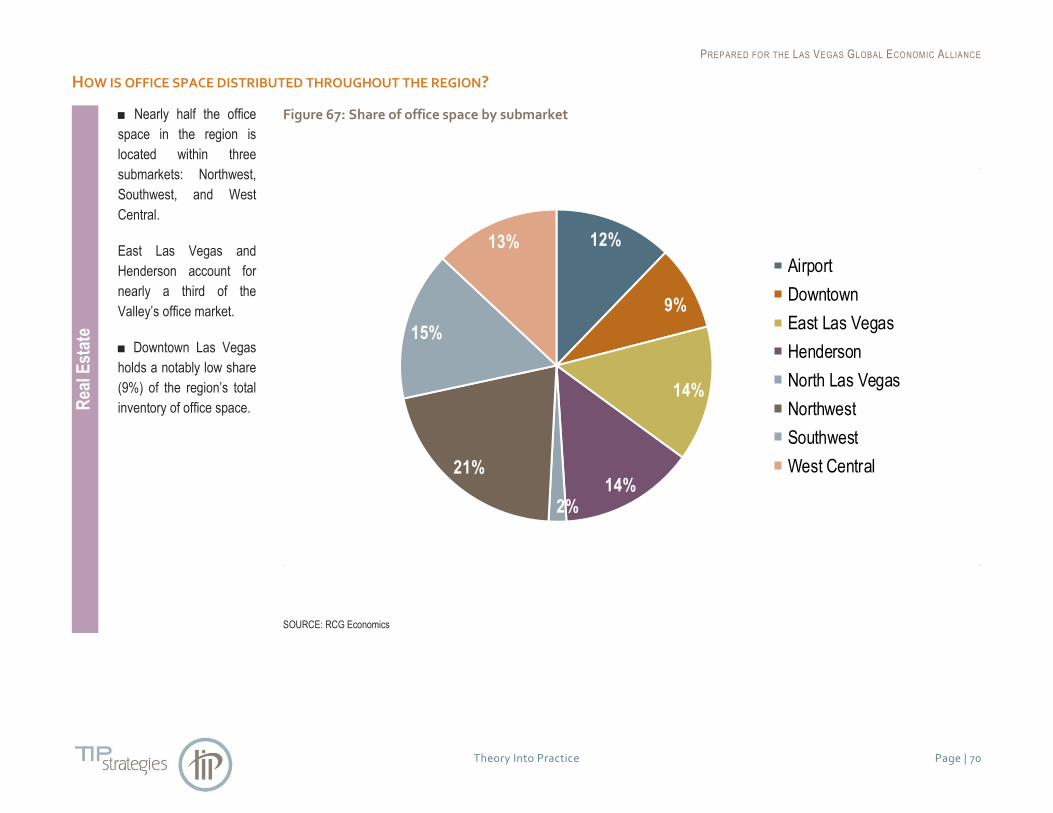
PREPARED FOR THE LAS VEGAS GLOBAL ECONOMIC ALLIANCE
Theory Into Practice Page | 70
HOW IS OFFICE SPACE DISTRIBUTED THROUGHOUT THE REGION? R
eal E
stat
e
■ Nearly half the office
space in the region is
located within three
submarkets: Northwest,
Southwest, and West
Central.
East Las Vegas and
Henderson account for
nearly a third of the
Valley’s office market.
■ Downtown Las Vegas
holds a notably low share
(9%) of the region’s total
inventory of office space.
Figure 67: Share of office space by submarket
SOURCE: RCG Economics
12%
9%
14%
14%2%
21%
15%
13%
Airport
Downtown
East Las Vegas
Henderson
North Las Vegas
Northwest
Southwest
West Central

PREPARED FOR THE LAS VEGAS GLOBAL ECONOMIC ALLIANCE
Theory Into Practice Page | 71
WHICH OFFICE SUBMARKETS ARE PERFORMING BETTER? R
eal E
stat
e
■ Twenty-three percent
of the region’s office
space was vacant in the
third quarter of 2012. Two
submarkets (East Las
Vegas and Southwest)
had rates topping 25
percent.
The vacancy rate in
Henderson was
approximately 24 percent.
■ The vacancy rate in
Downtown Las Vegas
was a much lower 13.2
percent, an indicator of
that area’s recent
success in attracting new
businesses and start-ups.
Figure 68: Office vacancy rates by submarket, 2012-Q3
SOURCE: RCG Economics
22.4%
13.2%
26.6%
23.7%
23.1%
23.8%
25.9%
20.2%
22.9%
0% 5% 10% 15% 20% 25% 30%
Airport
Downtown
East Las Vegas
Henderson
North Las Vegas
Northwest
Southwest
West Central
LAS VEGAS VALLEY
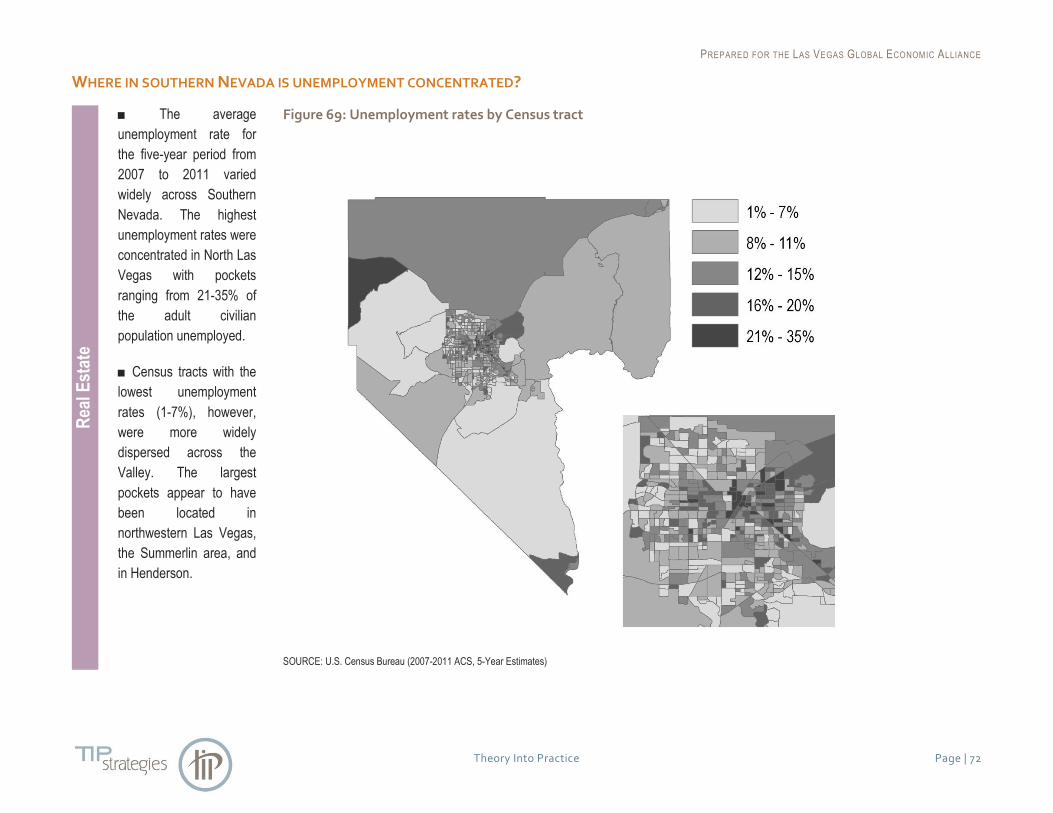
PREPARED FOR THE LAS VEGAS GLOBAL ECONOMIC ALLIANCE
Theory Into Practice Page | 72
WHERE IN SOUTHERN NEVADA IS UNEMPLOYMENT CONCENTRATED? R
eal E
stat
e
■ The average
unemployment rate for
the five-year period from
2007 to 2011 varied
widely across Southern
Nevada. The highest
unemployment rates were
concentrated in North Las
Vegas with pockets
ranging from 21-35% of
the adult civilian
population unemployed.
■ Census tracts with the
lowest unemployment
rates (1-7%), however,
were more widely
dispersed across the
Valley. The largest
pockets appear to have
been located in
northwestern Las Vegas,
the Summerlin area, and
in Henderson.
Figure 69: Unemployment rates by Census tract
SOURCE: U.S. Census Bureau (2007-2011 ACS, 5-Year Estimates)
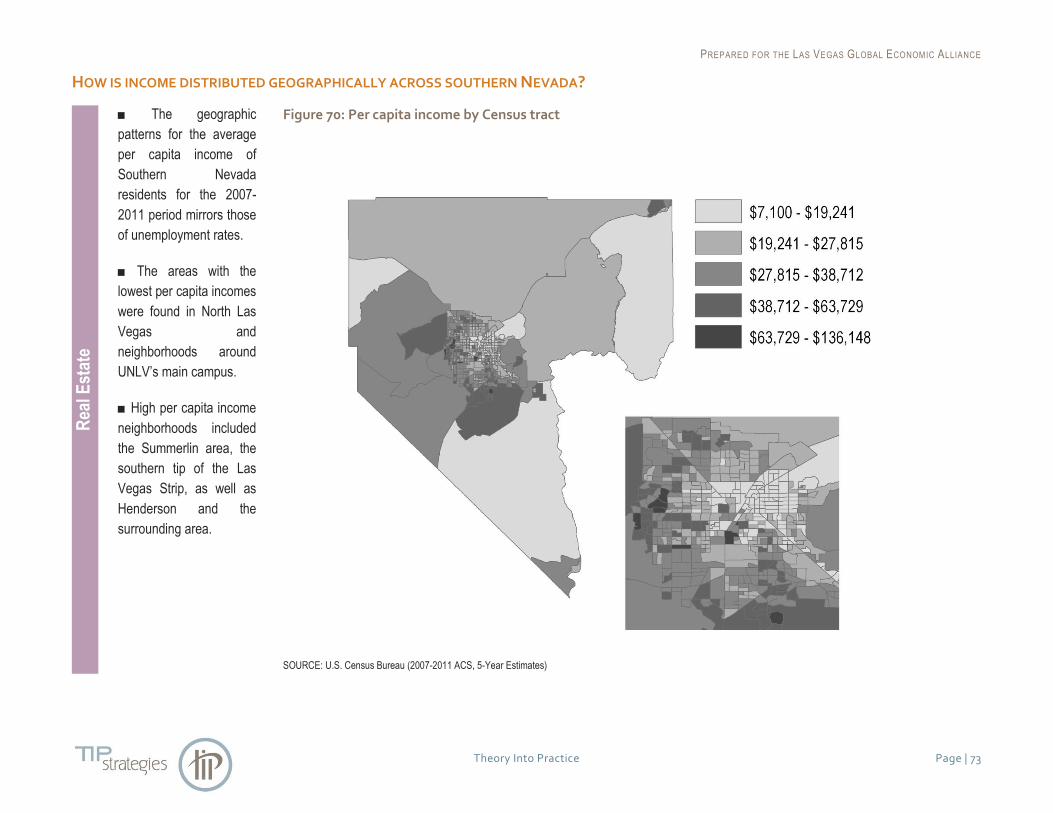
PREPARED FOR THE LAS VEGAS GLOBAL ECONOMIC ALLIANCE
Theory Into Practice Page | 73
HOW IS INCOME DISTRIBUTED GEOGRAPHICALLY ACROSS SOUTHERN NEVADA? R
eal E
stat
e
■ The geographic
patterns for the average
per capita income of
Southern Nevada
residents for the 2007-
2011 period mirrors those
of unemployment rates.
■ The areas with the
lowest per capita incomes
were found in North Las
Vegas and
neighborhoods around
UNLV’s main campus.
■ High per capita income
neighborhoods included
the Summerlin area, the
southern tip of the Las
Vegas Strip, as well as
Henderson and the
surrounding area.
Figure 70: Per capita income by Census tract
SOURCE: U.S. Census Bureau (2007-2011 ACS, 5-Year Estimates)