hispanic immigration and us e conomic growth - markit immigration and us e conomic growth ... ihs...
TRANSCRIPT

IHS economIcS
Hispanic Immigration and US economic GrowthFebruary 2015 ihs.com
James GillulaManaging Director

February 2015 2 © 2015 IHS
IHS Economics | Hispanic Immigration and US Economic Growth
EMBARG
OED
IHS™ ECONOMICSCopyright notice and legal disclaimer© 2014 IHS. No portion of this report may be reproduced, reused, or otherwise distributed in any form without prior written consent, with the exception of any internal client distribution as may be permitted in the license agreement between client and IHS. Content reproduced or redistributed with IHS permission must display IHS legal notices and attributions of authorship. The information contained herein is from sources considered reliable but its accuracy and completeness are not warranted, nor are the opinions and analyses which are based upon it, and to the extent permitted by law, IHS shall not be liable for any errors or omissions or any loss, damage or expense incurred by reliance on information or any statement contained herein. IHS and the IHS logo are trademarks of IHS. For more information, please contact IHS at www.ihs.com/CustomerCare.
About IHS EconomicsIHS Economics is a global leader in economic analysis and forecasting. With over 600 economists and industry specialists in 25 o� ces worldwide, IHS Economics o� ers market intelligence for over 200 countries and coverage of over 170 industries that helps more than 3,800 clients to monitor, analyze, and interpret conditions a� ecting their business. IHS Economics and its legacy companies Global Insight, Data Resources, Inc. and WEFA have an established track record for providing rigorous, objective forecast analysis and data to businesses, governments, and industry associations.
About IHS (www.ihs.com)IHS (NYSE: IHS) is the leading source of insight, analytics and expertise in critical areas that shape today’s business landscape. Businesses and governments in more than 150 countries around the globe rely on the comprehensive content, expert independent analysis and fl exible delivery methods of IHS to make high-impact decisions and develop strategies with speed and confi dence. IHS has been in business since 1959 and became a publicly traded company on the New York Stock Exchange in 2005. Headquartered in Englewood, Colorado, USA, IHS is committed to sustainable, profi table growth and employs about 8,800 people in 32 countries around the world.
For more information, contact:James Gillula
Managing Director, IHS Economics 1150 Connecticut Ave., NW, Suite 401
Washington, DC 20036+1 202-481-9217
Hispanic Immigration and US Economic Growth was commissioned by Univision Communications, Inc. IHS o� ers an independent assessment and is exclusively responsible for the analysis, content, and conclusions contained in the study.
February 2015 3 © 2015 IHS
IHS Economics | Hispanic Immigration and US Economic Growth
Contents
Executive summary 5
1. The 2008-09 recession: Impact on the Hispanic population 6
2. The long-term US economic outlook 8
3. Hispanic and non-Hispanic labor force growth 11Baseline forecast results 12An alternative immigration scenario 15
4. Latin American economies and Hispanic migration 16
5. Immigration and Hispanic demographic characteristics 18


February 2015 5 © 2015 IHS
IHS Economics | Hispanic Immigration and US Economic Growth
Executive summaryThe US economy is nearing a period when labor force growth will slow sharply as an ever larger proportion of the Baby Boomer generation retires. During this time, Hispanic employment will continue to show strong growth, even under conservative assumptions about Hispanic immigration. This report presents the results of projections of future US labor force and employment growth, broken out to identify di� ering trends for the Hispanic and non-Hispanic populations. Principal fi ndings of our analysis are
• Labor force growth is expected to accelerate over the next three years as the pace of economic growth picks up and more people are drawn back into the labor force, but thereafter labor force growth will begin to slow sharply. From 2020 to 2034, labor force growth is expected to average only 0.6% per year.
• The Hispanic population will play an increasingly signifi cant role in US employment growth because Hispanics are a younger and faster-growing segment. Under conservative assumptions about Hispanic immigration, we project that Hispanic employment growth will average 2.6% per year over the next 20 years and rise from 16% of US employment in 2014 to 23% in 2034.
• In this baseline forecast, over the next fi ve years the Hispanic population will account for over 40% of the increase in US employment. Over the last 15 years of the forecast period, Hispanics will account for over three-fourths of the increase in US employment.
Higher levels of immigration are conducive to stronger US economic growth. There are credible scenarios for greater Hispanic immigration than assumed in our baseline forecast, especially if the immigration policy gridlock in Washington is broken. We examined the implications of a scenario in which Hispanic immigration returns to the levels in the last economic expansion and is sustained thereafter, partially o� setting the slowing of US labor force growth. Using these immigration assumptions we fi nd
• Hispanic population growth averages 2.4% over the 20-year period, compared with 2.1% in the baseline forecast.
• Hispanic employment is 2.4 million higher in 2034, and the Hispanic share of US employment rises to 23.8%, compared with 22.9% in the baseline forecast.
• Higher immigration and the greater potential for labor force growth that it brings can stimulate increased investment and improved productivity. In this high-immigration scenario, real GDP growth averages 3.0% over the 20-year forecast period compared with 2.5% in the baseline forecast, and real GDP is 10% higher in 2034 than in the baseline.
• Although assumptions about growth of the non-Hispanic population are unchanged in this alternative economic scenario, non-Hispanic employment is 900 thousand higher in 2034 because of the more robust economic growth and a lower unemployment rate.
We also examined the potential for future US Hispanic immigration from the standpoint of economic conditions in the 10 Latin American countries that have been the primary countries of origin. Principal fi ndings are
• Some of these countries were less a� ected by the global fi nancial crisis and recession, and economic conditions in most are improving. IHS International Economics forecasts real GDP growth of 3–5% for these countries over the next 20 years.
• Despite the improved growth the UN forecasts continuing net outmigration from all 10 of these Latin American countries. UN data indicate that these countries had a net population loss of over 9 million because of migration during 2000–10. Net population outfl ows are projected to continue from all countries over the next two decades.
• The United States is the destination country for 80% of all migrants from these countries. Most of them are likely in search of greater economic opportunity and a better quality of life; seven of these Latin American countries rank in the bottom half of all countries globally in GDP per capita, and most lag in basic indicators of the quality of life.
February 2015 6 © 2015 IHS
IHS Economics | Hispanic Immigration and US Economic Growth
EMBARG
OED
• The potential clearly exists for Hispanic emigration to the United States consistent with our projections given the scale of projected population outfl ows from these 10 Latin American countries, the desire to emigrate to the United States, the expectation of continuing emigration from Puerto Rico to the United States, and potential emigration to the United States from other countries not specifi cally analyzed here.
The demographic characteristics of Hispanic immigrants di� er in many respects from those of the US-born Hispanic population. Therefore, the rate of immigration and the resulting change in the percentage of the foreign-born a� ect average indicators of the US Hispanic population such as the use of Spanish in the home. Our estimates and projections of Hispanic language use in the home show
• A total of 73.8% of the Hispanic population age 5 and over speak Spanish in the home. Among the US-born population, 58% report that they speak Spanish in the home. Among the foreign-born population, 94% report that they speak Spanish in the home.
• The incidence of speaking Spanish in the home falls o� very slowly for immigrants with length of time in the country.
• A total of 19.2% of the Hispanic population age 5 and over speak only Spanish in the home. Among the foreign-born, 65% of new arrivals speak only Spanish. This percentage falls gradually with time in the country, but even after 30 years in the United States, about one-third of foreign-born Hispanics still only speak Spanish in the home.
• In our baseline population forecast, the foreign-born share of the Hispanic population falls gradually, from 39.7% in 2014 to 34.8% in 2034. Yet, because of the patterns of persistence in the use of Spanish, the share of the Hispanic population that speaks Spanish in the home will fall very little—from 73.3% in 0214 to 71.3% in 2034.
• In our alternative scenario, which assumes higher Hispanic immigration, the foreign-born share of the Hispanic population is higher in 2034 (37%), and the share of the population 5 and over that speaks Spanish in the home is slightly higher throughout the forecast period and stands at 72.1% in 2034.
1. The 2008-09 recession: Impact on the Hispanic populationThe fi nancial crisis and recession of 2008–09 was a severe blow to the US economy. It was the deepest recession in the postwar period, and the rate of recovery in terms of output and employment is well below that of past economic expansions. Total nonfarm employment declined by 8.6 million from the peak in the fi rst quarter of 2008 to the fi rst quarter of 2010, and the prerecession peak was attained again only in the second quarter of 2014. Over 2010–13, real GDP growth has averaged only 2.2% and growth was as high as 2.5% only in the fi rst year of the recovery.
The greatest job losses from 2007 to 2010 were in construction—2.8 million jobs. Manufacturing jobs fell by 2.2 million based on the annual average data from the Current Population Survey (CPS). Between 2010 and 2013, manufacturing regained 900 thousand jobs but construction only regained 200 thousand. Gains in employment over this period were greatest in service categories, including professional and business services and leisure and hospitality services.

February 2015 7 © 2015 IHS
IHS Economics | Hispanic Immigration and US Economic Growth
Table 1
US employment by industry Employment (millions) Industry shares
2007 2010 2013 2007 2010 2013
Agriculture and forestry 2.1 2.2 2.1 1.5% 1.6% 1.5%
Mining 0.7 0.7 1.1 0.5% 0.5% 0.7%
Construction 11.8 9.1 9.3 8.1% 6.5% 6.4%
Manufacturing 16.1 14.0 14.9 11.1% 10.0% 10.3%
Wholesale & retail trade 21.1 19.7 19.7 14.4% 14.2% 13.7%
Transportation and utilities 7.6 7.2 7.4 5.2% 5.1% 5.2%
Information 3.7 3.2 3.0 2.5% 2.3% 2.1%
Financial activities 10.5 9.4 9.9 7.2% 6.8% 6.9%
Professional & business services 15.6 15.4 16.7 10.7% 11.0% 11.6%
Educational and health services 30.6 32.1 32.5 21.0% 23.1% 22.6%
Leisure and hospitality 12.5 12.5 13.6 8.5% 9.0% 9.4%
Other services 7.0 6.7 7.2 4.8% 4.8% 5.0%
Public administration 6.7 7.0 6.7 4.6% 5.0% 4.7%
Total 146.0 139.1 143.9 100.0% 100.0% 100.0%Source: IHS tabulation of Current Population Survey public-use microdata fi les © 2015 IHS
Two indicators of the depth of the recession and the distance yet to go before the economy fully recovers are displayed in Figure 1. The blue bar shows the gap between real GDP and the level of real GDP that could be produced if the economy were operating at full capacity. In 2009 the economy was operating at more than 6% below capacity—a much larger gap than in either of the previous two recessions. The gray line in Figure 1 illustrates the slack in the US labor market created by the recession. This indicator is the gap between the US unemployment rate and an estimate of what the rate would be with the economy operating at full capacity without accelerating infl ation. From 2009–11 the unemployment rate was about 4 percentage points above this equilibrium level.
The 2008–09 recession had a greater impact on Hispanic employment than on the overall workforce because the Hispanic workforce contributes signifi cantly to the construction industry. Consequently, the sharp decline in the housing sector, which was at the root of the recession, led to big Hispanic job losses. Construction was the leading sector for Hispanic employment in 2007, and Hispanic employment in construction declined by 700 thousand between 2007 and 2009. By 2013 only about 100 thousand of those construction jobs had been regained.
-8
-6
-4
-2
0
2
4
6
-8%
-6%
-4%
-2%
0%
2%
4%
6%
1988
1989
1990
1991
1992
1993
1994
1995
1996
1997
1998
1999
2000
2001
2002
2003
2004
2005
2006
2007
2008
2009
2010
2011
2012
2013
2014
2015
2016
2017
2018
2019
2020
Output gap Unemployment gap
Measures of slack in the economy
© 2015 IHS
Out
put g
ap (b
ar)
Empl
oym
entg
ap (l
ine)
Source: IHS US Economics Service.
Figure 1

February 2015 8 © 2015 IHS
IHS Economics | Hispanic Immigration and US Economic Growth
EMBARG
OED
Table 2
Hispanic employment by industry Employment (x 1,000) Industry shares
2007 2010 2013 2007 2009 2013
Agriculture and forestry 0.426 0.452 0.492 2.1% 2.3% 2.2%
Mining 0.095 0.109 0.218 0.5% 0.6% 1.0%
Construction 2.980 2.260 2.393 14.6% 11.5% 10.6%
Manufacturing 2.350 2.150 2.315 11.5% 10.9% 10.3%
Wholesale & retail trade 2.868 2.750 3.056 14.1% 14.0% 13.6%
Transportation and utilities 1.022 1.027 1.197 5.0% 5.2% 5.3%
Information 0.360 0.307 0.309 1.8% 1.6% 1.4%
Financial activities 1.134 0.974 1.140 5.6% 5.0% 5.1%
Professional & business services 2.141 2.058 2.656 10.5% 10.5% 11.8%
Educational services 1.114 1.195 1.306 5.5% 6.1% 5.8%
Health services 1.803 1.939 2.393 8.8% 9.9% 10.6%
Leisure and hospitality 2.404 2.470 2.998 11.8% 12.6% 13.3%
Other services 1.109 1.257 1.284 5.4% 6.4% 5.7%
Public administration 0.591 0.689 0.771 2.9% 3.5% 3.4%
Total 20.396 19.638 22.529 100.0% 100.0% 100.0%Source: IHS tabulation of Current Population Survey public-use microdata fi les © 2015 IHS
During the recession, the Hispanic unemployment rate rose to a high of 12.7%, and the gap between the Hispanic and non-Hispanic rates rose to nearly 4 percentage points. Over the past three years, however, the Hispanic unemployment rate has fallen faster than the non-Hispanic rate, and the gap has again been reduced to just over 1 percentage point.
With the deteriorating employment conditions during the recession, the net fl ow of Hispanic immigrants to the United States declined sharply, and there was a signifi cant drop in Hispanic births in the country. Data from the National Center for Health Statistics show the Hispanic fertility rate declined by 25% between 2006 and 2013, while the non-Hispanic fertility rate declined by much less—only 5% from its peak in 2007 to 2011—and has stabilized since then. As a result, Hispanic population growth slowed from 3.7% in 2006 to 2.1% in 2013, according to the Census Bureau.
2. The long-term US economic outlookAt present the economy continues to operate below capacity, but IHS Economics projects that, with the expected acceleration of growth in the next two to three years, the economy will fi nally move closer to full recovery as the housing market resumes its growth and employment accelerates to the point that wage gains improve, stimulating stronger consumer spending. Real GDP is expected to increase 3.1% in 2015 and 2.7% in 2016 and 2017. Employment growth will average 1.7% over these three years, and the unemployment rate should fall to 5.2% by 2017. The IHS
0%
2%
4%
6%
8%
10%
12%
14%
1990
Q1
1990
Q4
1991
Q3
1992
Q2
1993
Q1
1993
Q4
1994
Q3
1995
Q2
1996
Q1
1996
Q4
1997
Q3
1998
Q2
1999
Q1
1999
Q4
2000
Q3
2001
Q2
2002
Q1
2002
Q4
2003
Q3
2004
Q2
2005
Q1
2005
Q4
2006
Q3
2007
Q2
2008
Q1
2008
Q4
2009
Q3
2010
Q2
2011
Q1
2011
Q4
2012
Q3
2013
Q2
2014
Q1
2014
Q4
Hispanic Non-Hispanic Difference
Hispanic and non-Hispanic unemployment rates
© 2015 IHSSource: Bureau of Labor Statistics.
Figure 2

February 2015 9 © 2015 IHS
IHS Economics | Hispanic Immigration and US Economic Growth
baseline long-term forecast for the US economy is for real GDP growth to average 2.5% per year over 2015–34, 0.3 percentage point slower than during the past 20 years.
Table 3
US long-term economic outlook(Average annual growth rates)
2010-14 2015-19 2020-24 2025-29 2030-34
Real GDP 2.2% 2.7% 2.5% 2.3% 2.3%
Real personal consumption 2.2% 2.8% 2.4% 2.4% 2.4%
Consumer price infl ation 2.0% 2.0% 2.3% 2.1% 2.0%
Population 0.7% 0.8% 0.8% 0.7% 0.6%
Labor force 0.2% 1.2% 0.7% 0.4% 0.6%
Nonfarm employment 1.1% 1.3% 0.8% 0.5% 0.6%
Unemployment rate (period average) 8.0% 5.4% 5.1% 5.1% 5.0%Source: IHS US Economic Service © 2015 IHS
Other indicators will also improve, with real consumption growth averaging 2.5% per year over the forecast period. Per capita growth will be about 1.8% per year, down 0.2 percentage points from 1994–2014. Expenditures, in the long term, are primarily determined by the growth of real permanent income, demographic infl uences, and changes in relative prices. The share of personal consumption in GDP hovers around 67–68% of GDP over the forecast period. The share of consumption devoted to services will rise, mainly due to rising health expenditures, while that for goods will fall. Real personal disposable income, which climbed 2.7% in 1994–2014, will again rise at a 2.7% pace over the next 20 years.
Unemployment will decline and settle at about 5%. Among the major sectors of the economy, the construction industry will have the second-biggest employment gain, after professional and business services. The demands of both residential and nonresidential investment will push the construction sector’s share of employment up from 4.3% in 2013 to 5.8% in 2034 (Figure 3). Housing starts are projected to average 1.59 million units annually in the forecast period, compared with 1.35 million for 1994–2014. The 25–34 year-old group is a key driver for the new housing demand, as this is when individuals typically purchase their fi rst home. The demand for new housing was boosted by the large gains in this age group , as baby-boomers entered the housing market. This generation began to pass through this age bracket in the mid-1980s, limiting the demand for additions to the housing stock. The number of households in this age group began a modest increase after 2005, and the demand for housing will be a bit stronger over the next 20 years than over the past 20 years.
This long-term upward trend in construction employment is a positive factor for Hispanic employment growth, since construction is the industry with the highest concentration of Hispanic employment.
0%
1%
2%
3%
4%
5%
6%
7%
1971
1973
1975
1977
1979
1981
1983
1985
1987
1989
1991
1993
1995
1997
1999
2001
2003
2005
2007
2009
2011
2013
2015
2017
2019
2021
2023
2025
2027
2029
2031
2033
Share of construction in US employment
© 2015 IHSSource: IHS US Economics Service.
Figure 3

February 2015 10 © 2015 IHS
IHS Economics | Hispanic Immigration and US Economic Growth
EMBARG
OED
Table 4
Shares of US employment by industry(Percent)
2007 2013 2019 2024 2029 2034
Total nonfarm payrolls 100.0 100.0 100.0 100.0 100.0 100.0
Private nonfarm establishments 83.9 84.0 84.7 84.4 84.3 84.7
Natural resources & mining 0.5 0.6 0.7 0.7 0.7 0.6
Construction 5.5 4.3 5.2 5.5 5.7 5.8
Trade, transportation & utilities 19.3 19.0 18.6 17.8 17.4 16.9
Information 2.2 2.0 1.9 2.0 2.0 2.1
Financial activities 6.1 5.8 5.3 5.1 5.0 5.0
Professional & business services 13.0 13.6 14.8 16.2 17.2 18.1
Education & health services 13.5 15.5 15.6 15.4 15.3 15.5
Leisure & hospitality 9.7 10.4 10.6 10.4 10.2 10.1
Other services 4.0 4.0 3.7 3.6 3.6 3.6
Manufacturing 10.1 8.8 8.4 7.8 7.3 7.0
Government 16.1 16.0 15.3 15.6 15.7 15.3Source: IHS tabulation of Current Population Survey public-use microdata fi les © 2015 IHS
Labor force growth is expected to accelerate over the next four years as the pace of economic growth picks up and more people are drawn back into the labor market. But as increasing numbers of Baby Boomers retire, the rate of growth will slow to an average of only 0.6% per year from 2020 through 2034.
-0.5%
0.0%
0.5%
1.0%
1.5%
2.0%
2.5%
3.0%
3.5%
1968
1970
1972
1974
1976
1978
1980
1982
1984
1986
1988
1990
1992
1994
1996
1998
2000
2002
2004
2006
2008
2010
2012
2014
2016
2018
2020
2022
2024
2026
2028
2030
2032
2034
Ages 16+
US labor force annual growth rate
© 2015 IHSSource: IHS US Economics Service.
Figure 4

February 2015 11 © 2015 IHS
IHS Economics | Hispanic Immigration and US Economic Growth
As the growth of the working age population slows and the annual increment to the labor force declines, immigration will become more important as a source of employment growth. By 2020 labor force growth is expected to slow to the point that the annual change in the labor force is roughly equal to the amount of net migration.
3. Hispanic and non-Hispanic labor force growthThe Hispanic population will play an increasingly signifi cant role in US employment growth because the Hispanic population is a younger and faster growing segment of the population, while trends in the non-Hispanic population are heavily infl uenced by the aging Baby Boomer generation that is moving into retirement.
Looking at the age distribution of the labor force in 2013 (Table 5):
• A total of 5.8% of the non-Hispanic labor force is age 65 and over, but only 2.2% of the Hispanic labor force is in this age category.
• A total of 17.4% of the non-Hispanic labor force is in the age group approaching retirement over the next 10 years (55-64), while only 9.8% of the Hispanic population is in this age category.
The overall US labor force participation rate was declining before the 2008–09 recession, and
0.0
0.5
1.0
1.5
2.0
2.5
2015
2016
2017
2018
2019
2020
2021
2022
2023
2024
2025
2026
2027
2028
2029
2030
2031
2032
2033
2034
Census Bureau - Net migration IHS - Annual growth of labor force
Annual immigration will exceed labor force growth by 2020
© 2015 IHS
Mill
ions
Source: BLS and IHS US Economics Service.
Figure 5
Table 5
Age distribution of labor force, 2013Age category Hispanic Non-Hispanic
Total 100.0% 100.0%
16-24 17.9% 13.0%
25-34 27.0% 20.7%
35-44 24.6% 20.3%
45-54 19.0% 22.8%
55-64 9.4% 17.4%
65+ 2.2% 5.8%Source:
58%
60%
62%
64%
66%
68%
70%
72%
2000
Q1
2000
Q3
2001
Q1
2001
Q3
2002
Q1
2002
Q3
2003
Q1
2003
Q3
2004
Q1
2004
Q3
2005
Q1
2005
Q3
2006
Q1
2006
Q3
2007
Q1
2007
Q3
2008
Q1
2008
Q3
2009
Q1
2009
Q3
2010
Q1
2010
Q3
2011
Q1
2011
Q3
2012
Q1
2012
Q3
2013
Q1
2013
Q3
2014
Q1
2014
Q3
Hispanic Non-Hispanic
US labor force participation rate by ethnicity
© 2015 IHSSource: IHS tabulations of Current Population Survey public-use microdata files.
Figure 6

February 2015 12 © 2015 IHS
IHS Economics | Hispanic Immigration and US Economic Growth
EMBARG
OED
this decline was exacerbated by the slowdown. The Hispanic labor force participation rate is above that of the non-Hispanic population. The gap between the Hispanic and non-Hispanic rates averaged about 3 percentage points from prerecession times up until the fi rst three years of the recovery. In the last several quarters, however, the Hispanic participation rate has stabilized at about 66%, while the non-Hispanic rate continued to decline—widening the gap to about 4 percentage points.
IHS projects that, with the pickup in the rate of economic growth over the next three to fi ve years, the labor force participation rate will rise slightly, but thereafter it will continue its gradual decline (see Figure 7). A continuing rise in the participation rate for the population age 65 and over will contribute to the slight increase in the overall labor participation rate through 2019. But we expect the participation rate in this 65-plus age category to stabilize near 22% during the last 10 years of the forecast period.
To examine the potential contribution of the Hispanic population to US economic growth over the next 20 years given this scenario of slower growth of the overall labor force, we developed projections of labor force and employment growth separately for the non-Hispanic and Hispanic populations. Our long-term population projections are produced with an age cohort survival model beginning with the most recent Census Bureau population estimates. Our assumptions about age-specifi c survival rates are drawn from the supporting data from the Census Bureau’s most recent (December 2014) long-term population projections. Our baseline population projections also adopt the Census Bureau’s assumptions about net international migration through 2034—in total and separately for the Hispanic and non-Hispanic populations.
We also adopt Census Bureau assumptions regarding fertility rates for the non-Hispanic population. However, we make independent projections of Hispanic fertility rates. Our models indicate that as economic conditions improve and the unemployment rate falls, Hispanic fertility rates will rebound slightly more than the Census Bureau assumes over the next fi ve years and decline more slowly over the following 15 years.
Baseline forecast resultsUS population growth is expected to average 0.8% over the forecast period: non-Hispanic population growth will slow from 0.5% in 2015–19 to 0.3% in 2029–34. Hispanic population growth is also projected to slow but still average 2.1% over the 20-year forecast period.
The contrast in growth rates between the Hispanic and non-Hispanic populations is even more stark among the population of core working age (16–64). The non-Hispanic population age 16–64 will decline through 2029 before levelling o� to a 0.1% annual increase in 2030–34. The Hispanic population in this core age group will grow at an average annual rate of 2.0% over the 20-year forecast period. As a result, the Hispanic share of the population age 16–64 will rise from 17.3% in 2014 to 24.2% in 2034. Labor force participation rates are expected to rise slightly over the next fi ve years as the economy recovers, but then resume a gradual decline.
0%
10%
20%
30%
40%
50%
60%
70%
80%
2007
2008
2009
2010
2011
2012
2013
2014
2015
2016
2017
2018
2019
2020
2021
2022
2023
2024
2025
2026
2027
2028
2029
2030
2031
2032
2033
2034
Population 16+ Population 16-64 Population 65+
US labor force participation rate by age
© 2015 IHSSource: BLS and IHS US Economics Service.
Figure 7

February 2015 13 © 2015 IHS
IHS Economics | Hispanic Immigration and US Economic Growth
Table 6
Baseline Hispanic and non-Hispanic population forecastPopulation (millions) 2014 2019 2024 2029 2034
Total 318.9 332.3 346.1 359.4 371.4
Hispanic 55.4 62.2 69.5 77.0 84.5
Non-Hispanic 263.4 270.1 276.6 282.4 286.9
Hispanic share 17.4% 18.7% 20.1% 21.4% 22.8%
Average annual growth rate 2015-19 2020-24 2025-29 2030-34
Total 0.8% 0.8% 0.8% 0.7%
Hispanic 2.3% 2.2% 2.1% 1.9%
Non-Hispanic 0.5% 0.5% 0.4% 0.3%
Population age 16-64 (millions) 2014 2019 2024 2029 2034
Total 207.1 211.5 214.1 216.3 221.1
Hispanic 35.8 40.6 45.2 49.5 53.5
Non-Hispanic 171.3 170.9 168.9 166.8 167.6
Hispanic share 17.3% 19.2% 21.1% 22.9% 24.2%
Average annual growth rate 2015-19 2020-24 2025-29 2030-34
Total 0.4% 0.2% 0.2% 0.4%
Hispanic 2.6% 2.2% 1.8% 1.6%
Non-Hispanic 0.0% -0.2% -0.2% 0.1%Source: IHS © 2015 IHS
We projected labor force participation rates separately for two broad age categories to capture the impact of di� erences in the age distribution of the Hispanic and non-Hispanic groups.
Table 7
Labor force participation rate projections2014 2019 2024 2029 2034
Overall
Economywide 62.9% 63.7% 62.9% 61.9% 61.6%
Hispanic 66.1% 67.7% 67.6% 67.1% 66.7%
Non-Hispanic 62.3% 62.9% 61.9% 60.6% 60.2%
Ages 16-64
Economywide 72.7% 74.5% 74.9% 75.0% 75.5%
Hispanic 70.9% 73.2% 74.0% 74.5% 75.2%
Non-Hispanic 73.0% 74.8% 75.2% 75.2% 75.6%
Ages 65+
Economywide 18.6% 21.7% 22.8% 22.6% 22.0%
Hispanic 17.0% 20.4% 21.7% 21.8% 21.5%
Non-Hispanic 18.7% 21.8% 22.9% 22.7% 22.1%Source: IHS © 2015 IHS
Under the above conditions, the non-Hispanic labor force will grow at an average annual rate of 0.8% over the next fi ve years but then slow to an average annual rate of less than 0.2% over the following 15 years. Growth of the Hispanic labor force will average 2.5% per year over the forecast period and will make up 23.0% of the US total in 2034.

February 2015 14 © 2015 IHS
IHS Economics | Hispanic Immigration and US Economic Growth
EMBARG
OED
Table 8
Baseline labor force forecasts (Millions)
2014 2019 2024 2029 2034
Total 155.9 165.9 171.4 175.1 180.4
Hispanic 25.4 30.0 34.0 37.8 41.4
Non-Hispanic 130.5 135.9 137.4 137.4 139.0
Hispanic share 16.3% 18.1% 19.8% 21.6% 23.0%
Average annual growth rate 2015-19 2020-24 2025-29 2030-34
Total 1.3% 0.7% 0.4% 0.6%
Hispanic 3.4% 2.6% 2.1% 1.9%
Non-Hispanic 0.8% 0.2% 0.0% 0.2%Source: IHS © 2015 IHS
The economywide unemployment rate is projected to fall to near 5% by 2024 and remain near that level over the forecast period. The gap in unemployment rates between Hispanics and non-Hispanics is expected to continue to narrow over the forecast period, with Hispanic unemployment falling from 7.4% in 2014 to 5.4% in 2034.
Table 9
Baseline unemployment rate projections2014 2019 2024 2029 2034
Overall
Economywide 6.2% 5.3% 5.1% 5.1% 5.0%
Hispanic 7.4% 6.2% 5.7% 5.6% 5.4%
Non-Hispanic 5.9% 5.1% 4.9% 4.9% 4.9%
Hispanic–non-Hispanic di� erence 1.5% 1.1% 0.8% 0.7% 0.5%Source: IHS © 2015 IHS
Non-Hispanic employment will grow at an average annual rate of 1.0% over the next fi ve years but then slow to an average annual rate of 0.2% over the following 15 years. Hispanic employment growth will average 2.6% per year over the 20-year forecast period and rise from 16% of the US total in 2014 to 23% in 2034.
Over the next fi ve years, the Hispanic population will account for over 40% of the increase in US employment. Over the last 15 years of the forecast period, the Hispanic population will account for over three-fourths of the increase in US employment (an 11 million increase in Hispanic employment out of an economy wide gain of 14 million). It is useful to note that these conclusions about the Hispanic contribution to future employment growth are virtually una� ected by the assumption of a slightly higher long-term trajectory for Hispanic fertility rates (the one deviation from Census Bureau assumptions that we adopted in producing our demographic projections).
Table 10
Baseline employment forecasts (Millions)
2014 2019 2024 2029 2034
Total 146.3 157.1 162.7 166.3 171.4
Hispanic 23.5 28.1 32.1 35.6 39.2
Non-Hispanic 122.8 129.0 130.7 130.7 132.2
Hispanic share 16.1% 17.9% 19.7% 21.4% 22.9%
Average annual growth rate 2015-19 2020-24 2025-29 2030-34
Total 1.4% 0.7% 0.4% 0.6%
Hispanic 3.6% 2.7% 2.1% 1.9%
Non-Hispanic 1.0% 0.3% 0.0% 0.2%Source: IHS © 2015 IHS

February 2015 15 © 2015 IHS
IHS Economics | Hispanic Immigration and US Economic Growth
An alternative immigration scenarioThe forecasts of Hispanic population and employment growth presented above are based largely on the most recent Census Bureau estimates and projections of Hispanic fertility and mortality rates and net international migration. The big unknown in any long-term Hispanic population projection is the pace of net international migration. Our baseline assumptions are identical to those in the Census Bureau projections, but there are credible scenarios for higher levels of immigration and, thus, higher rates of growth of the Hispanic population. The level of Hispanic immigration could be considerably higher, especially if the immigration policy gridlock in Washington is broken given the faster economic growth and return to near full-employment expected over the next three to fi ve years and, in particular, the acceleration of home building and construction.
To examine the implications of a higher rate of Hispanic immigration, we modeled a scenario that begins with annual average net migration of 700 thousand in 2015–19. This is approximately the level of immigration estimated to have occurred during the last expansion. The rate of US labor force growth is expected to slow sharply between 2020 and 2034. We continue our assumption of Hispanic immigration of 700 thousand per year during this period. Over the fi nal 10 years of the baseline forecast, total labor force growth is projected to be only 0.5% per year. This should create conditions for additional labor demand, and we increase the Hispanic immigration assumption in our alternative scenario to 750 thousand per year over this period. This scenario with increased Hispanic immigration while keeping non-Hispanic immigration at the levels of the baseline scenario results in a Hispanic share of total immigration that is more similar to the high-growth prerecession period, when Hispanic immigration was 50-55% of total immigration annually.
Highlights of this alternative economic scenario for growth of the Hispanic population and employment are
• Total net Hispanic migration is 3.7 million higher over the 20-year forecast period and with the additional births (net of deaths) to these immigrants, Hispanic population in 2034 is 4.6 million higher at 89.1 million (see Table 11).
• Hispanic population growth averages 2.4% over the 20-year period, compared with 2.1% in the baseline forecast.
• Hispanic employment is 2.4 million higher in 2034, and the Hispanic share of US employment rises to 23.8%, compared with 22.9% in the baseline forecast (see Table 12).
• Although assumptions about growth of the non-Hispanic population are unchanged in this alternative economic scenario, employment of the non-Hispanic population is 900 thousand higher in 2034 because of the more robust economic growth and a lower unemployment rate.
Table 11
Population growth: Alternative forecast(Millions)
2014 2019 2024 2029 2034
Total 318.9 333.2 348.0 362.6 376.0
Hispanic 55.4 63.1 71.4 80.2 89.1
Non-Hispanic 263.4 270.1 276.6 282.4 286.9
Hispanic share 17.4% 18.9% 20.5% 22.1% 23.7%
Average annual growth rate 2015-19 2020-24 2025-29 2030-34
Total 0.9% 0.9% 0.8% 0.7%
Hispanic 2.6% 2.5% 2.4% 2.1%
Non-Hispanic 0.5% 0.5% 0.4% 0.3%Source: IHS © 2015 IHS
February 2015 16 © 2015 IHS
IHS Economics | Hispanic Immigration and US Economic Growth
EMBARG
OED
Table 12
Employment growth: Alternative scenario (Millions)
2014 2019 2024 2029 2034
Total 146.3 158.3 164.4 169.0 174.7
Hispanic 23.5 28.7 33.1 37.4 41.6
Non-Hispanic 122.8 129.6 131.3 131.6 133.1
Hispanic share 16.1% 18.1% 20.2% 22.1% 23.8%
Average annual growth rate 2015-19 2020-24 2025-29 2030-34
Total 1.6% 0.8% 0.6% 0.7%
Hispanic 4.1% 3.0% 2.4% 2.2%
Non-Hispanic 1.1% 0.3% 0.1% 0.2%Source: IHS © 2015 IHS
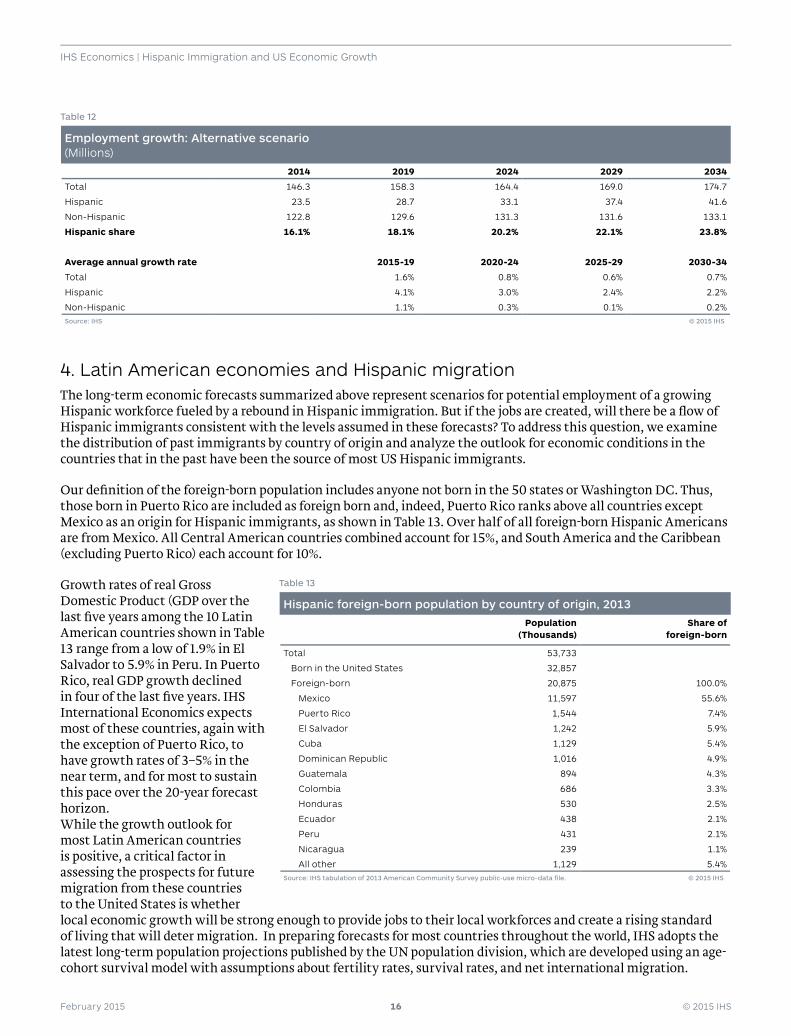
4. Latin American economies and Hispanic migrationThe long-term economic forecasts summarized above represent scenarios for potential employment of a growing Hispanic workforce fueled by a rebound in Hispanic immigration. But if the jobs are created, will there be a fl ow of Hispanic immigrants consistent with the levels assumed in these forecasts? To address this question, we examine the distribution of past immigrants by country of origin and analyze the outlook for economic conditions in the countries that in the past have been the source of most US Hispanic immigrants.
Our defi nition of the foreign-born population includes anyone not born in the 50 states or Washington DC. Thus, those born in Puerto Rico are included as foreign born and, indeed, Puerto Rico ranks above all countries except Mexico as an origin for Hispanic immigrants, as shown in Table 13. Over half of all foreign-born Hispanic Americans are from Mexico. All Central American countries combined account for 15%, and South America and the Caribbean (excluding Puerto Rico) each account for 10%.
Growth rates of real Gross Domestic Product (GDP over the last fi ve years among the 10 Latin American countries shown in Table 13 range from a low of 1.9% in El Salvador to 5.9% in Peru. In Puerto Rico, real GDP growth declined in four of the last fi ve years. IHS International Economics expects most of these countries, again with the exception of Puerto Rico, to have growth rates of 3–5% in the near term, and for most to sustain this pace over the 20-year forecast horizon.While the growth outlook for most Latin American countries is positive, a critical factor in assessing the prospects for future migration from these countries to the United States is whether local economic growth will be strong enough to provide jobs to their local workforces and create a rising standard of living that will deter migration. In preparing forecasts for most countries throughout the world, IHS adopts the latest long-term population projections published by the UN population division, which are developed using an age-cohort survival model with assumptions about fertility rates, survival rates, and net international migration.
Table 13
Hispanic foreign-born population by country of origin, 2013Population
(Thousands)Share of
foreign-born
Total 53,733
Born in the United States 32,857
Foreign-born 20,875 100.0%
Mexico 11,597 55.6%
Puerto Rico 1,544 7.4%
El Salvador 1,242 5.9%
Cuba 1,129 5.4%
Dominican Republic 1,016 4.9%
Guatemala 894 4.3%
Colombia 686 3.3%
Honduras 530 2.5%
Ecuador 438 2.1%
Peru 431 2.1%
Nicaragua 239 1.1%
All other 1,129 5.4%Source: IHS tabulation of 2013 American Community Survey public-use micro-data fi le. © 2015 IHS

February 2015 17 © 2015 IHS
IHS Economics | Hispanic Immigration and US Economic Growth
Fertility rates are expected to decline gradually from current levels over the next 20 years in all countries except Cuba. Thus, with the possible exception of Guatemala (whose population is expected to grow about 2.2% over the forecast period), birth rates for Latin American countries are not high enough to lead to population growth that exceeds the capacity of the countries’ economies to create su� cient jobs for the working-age population, unless these countries were to experience an economic downturn.
Table 14
Population growth of Latin American countries and Puerto Rico(Average annual growth rates)
2010-14 2015-19 2020-24 2025-29 2030-34
Colombia 1.3% 1.2% 1.0% 0.8% 0.7%
Cuba -0.1% -0.1% -0.2% -0.3% -0.4%
Dominican Republic 1.3% 1.1% 0.9% 0.8% 0.7%
Ecuador 1.6% 1.5% 1.3% 1.2% 1.0%
El Salvador 0.6% 0.6% 0.5% 0.4% 0.2%
Guatemala 2.5% 2.4% 2.2% 2.1% 1.9%
Honduras 2.0% 1.9% 1.7% 1.5% 1.4%
Mexico 1.2% 1.1% 1.0% 0.8% 0.7%
Nicaragua 1.4% 1.3% 1.1% 1.0% 0.9%
Peru 1.2% 1.2% 1.1% 0.9% 0.8%
Puerto Rico -0.4% 0.0% 0.1% 0.1% 0.0%Source: IHS International Economics Group, based on U.N. population projections. © 2015 IHS
Despite moderate birth rates and prospects for good economic growth, the UN projects continuing net outmigration from all 10 Latin American countries analyzed here, although at somewhat lower levels than in 2005–10.
Table 15
UN projections of net migration from Latin American countries (Thousands per fi ve-year period)
Country 2000-05 2005-10 2010-15 2015-20 2020-25 2025-30 2030-35
Colombia -120 -120 -120 -120 -120 -120 -120
Cuba -143 -190 -140 -140 -140 -100 -100
Dominican Republic -148 -140 -140 -140 -140 -140 -140
Ecuador -43 -46 -30 -30 -30 -30 -30
El Salvador -356 -292 -225 -225 -225 -200 -200
Guatemala -300 -200 -75 -75 -75 -75 -75
Honduras -150 -100 -50 -50 -50 -50 -50
Mexico -2,929 -2,051 -1,200 -1,200 -1,000 -1,000 -1,000
Nicaragua -206 -200 -120 -120 -120 -100 -100
Peru -625 -725 -300 -200 -200 -200 -200
Sum -5,020 -4,065 -2,400 -2,300 -2,100 -2,015 -2,015Source: United Nations, Department of Economic and Social A� airs, Population Division (2013). World Population Prospects: The 2012 Revision. Middle Series. © 2015 IHS
Where do these migrants go? UN data shows that the United States is the top destination for all of these countries except Colombia and Nicaragua. For six of these countries, over four-fi fths of migrants go to the United States. For Mexico the share is 98%. On a weighted-average basis, 80% of all former migrants from these countries are in the United States.
If excess population growth and/or weak economic growth are not driving migration from these Latin American countries, what is the driving force? Very likely the answer is a search for greater economic opportunity and a better quality of life. Seven of these Latin American countries rank among the bottom half of all countries globally in GDP per capita, and none rank in the top one-third. Mexico is the leader among the 10 countries at an estimated $10,307 GDP per capita in 2013, but this only puts Mexico in 80th place among 205 countries. Puerto Rico shows a higher GDP per capita, but as noted above it faces weaker economic growth than any of the 10 Latin American countries, and its low population growth refl ects an expectation of continuing outfl ows of population to the United States
February 2015 18 © 2015 IHS
IHS Economics | Hispanic Immigration and US Economic Growth
EMBARG
OED
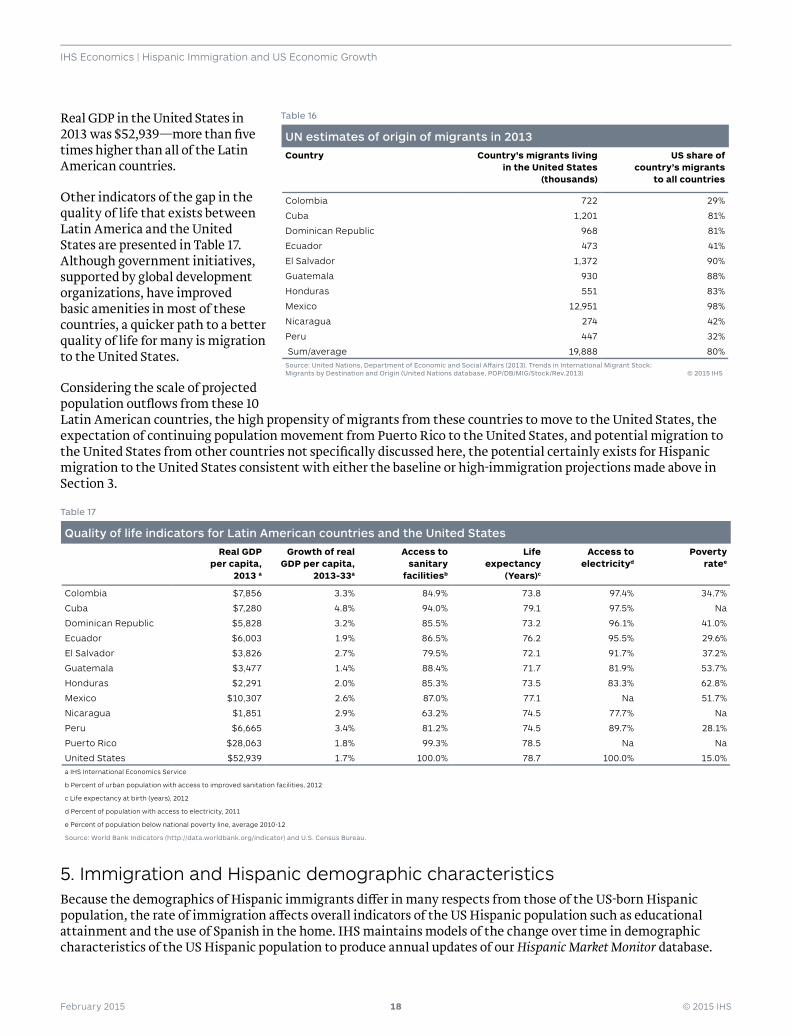
Real GDP in the United States in 2013 was $52,939—more than fi ve times higher than all of the Latin American countries.
Other indicators of the gap in the quality of life that exists between Latin America and the United States are presented in Table 17. Although government initiatives, supported by global development organizations, have improved basic amenities in most of these countries, a quicker path to a better quality of life for many is migration to the United States.
Considering the scale of projected population outfl ows from these 10 Latin American countries, the high propensity of migrants from these countries to move to the United States, the expectation of continuing population movement from Puerto Rico to the United States, and potential migration to the United States from other countries not specifi cally discussed here, the potential certainly exists for Hispanic migration to the United States consistent with either the baseline or high-immigration projections made above in Section 3.
Table 17
Quality of life indicators for Latin American countries and the United StatesReal GDP
per capita, 2013 a
Growth of real GDP per capita,
2013-33a
Access to sanitary
facilitiesb
Life expectancy
(Years)c
Access to electricityd
Poverty ratee
Colombia $7,856 3.3% 84.9% 73.8 97.4% 34.7%
Cuba $7,280 4.8% 94.0% 79.1 97.5% Na
Dominican Republic $5,828 3.2% 85.5% 73.2 96.1% 41.0%
Ecuador $6,003 1.9% 86.5% 76.2 95.5% 29.6%
El Salvador $3,826 2.7% 79.5% 72.1 91.7% 37.2%
Guatemala $3,477 1.4% 88.4% 71.7 81.9% 53.7%
Honduras $2,291 2.0% 85.3% 73.5 83.3% 62.8%
Mexico $10,307 2.6% 87.0% 77.1 Na 51.7%
Nicaragua $1,851 2.9% 63.2% 74.5 77.7% Na
Peru $6,665 3.4% 81.2% 74.5 89.7% 28.1%
Puerto Rico $28,063 1.8% 99.3% 78.5 Na Na
United States $52,939 1.7% 100.0% 78.7 100.0% 15.0%a IHS International Economics Service
b Percent of urban population with access to improved sanitation facilities, 2012
c Life expectancy at birth (years), 2012
d Percent of population with access to electricity, 2011
e Percent of population below national poverty line, average 2010-12
Source: World Bank Indicators (http://data.worldbank.org/indicator) and U.S. Census Bureau.
5. Immigration and Hispanic demographic characteristicsBecause the demographics of Hispanic immigrants di� er in many respects from those of the US-born Hispanic population, the rate of immigration a� ects overall indicators of the US Hispanic population such as educational attainment and the use of Spanish in the home. IHS maintains models of the change over time in demographic characteristics of the US Hispanic population to produce annual updates of our Hispanic Market Monitor database.
Table 16
UN estimates of origin of migrants in 2013Country Country’s migrants living
in the United States (thousands)
US share of country’s migrants
to all countries
Colombia 722 29%
Cuba 1,201 81%
Dominican Republic 968 81%
Ecuador 473 41%
El Salvador 1,372 90%
Guatemala 930 88%
Honduras 551 83%
Mexico 12,951 98%
Nicaragua 274 42%
Peru 447 32%
Sum/average 19,888 80%Source: United Nations, Department of Economic and Social A� airs (2013). Trends in International Migrant Stock: Migrants by Destination and Origin (United Nations database, POP/DB/MIG/Stock/Rev.2013) © 2015 IHS
February 2015 19 © 2015 IHS
IHS Economics | Hispanic Immigration and US Economic Growth
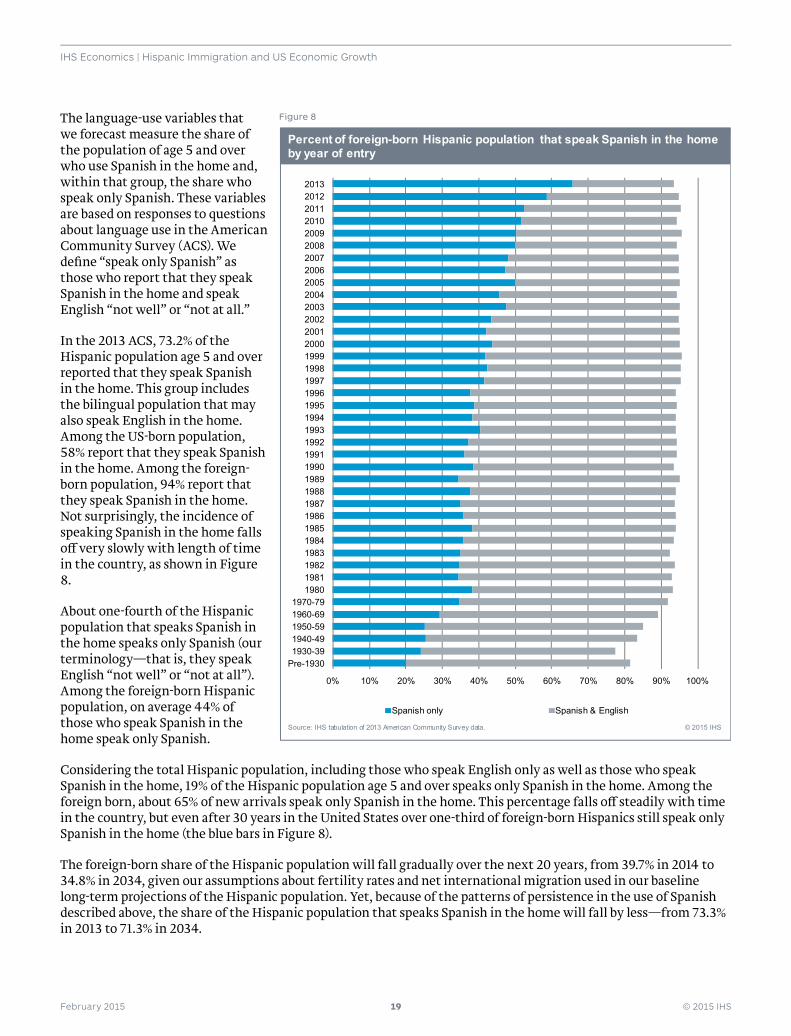
The language-use variables that we forecast measure the share of the population of age 5 and over who use Spanish in the home and, within that group, the share who speak only Spanish. These variables are based on responses to questions about language use in the American Community Survey (ACS). We defi ne “speak only Spanish” as those who report that they speak Spanish in the home and speak English “not well” or “not at all.”
In the 2013 ACS, 73.2% of the Hispanic population age 5 and over reported that they speak Spanish in the home. This group includes the bilingual population that may also speak English in the home. Among the US-born population, 58% report that they speak Spanish in the home. Among the foreign-born population, 94% report that they speak Spanish in the home. Not surprisingly, the incidence of speaking Spanish in the home falls o� very slowly with length of time in the country, as shown in Figure 8.
About one-fourth of the Hispanic population that speaks Spanish in the home speaks only Spanish (our terminology—that is, they speak English “not well” or “not at all”). Among the foreign-born Hispanic population, on average 44% of those who speak Spanish in the home speak only Spanish.
Considering the total Hispanic population, including those who speak English only as well as those who speak Spanish in the home, 19% of the Hispanic population age 5 and over speaks only Spanish in the home. Among the foreign born, about 65% of new arrivals speak only Spanish in the home. This percentage falls o� steadily with time in the country, but even after 30 years in the United States over one-third of foreign-born Hispanics still speak only Spanish in the home (the blue bars in Figure 8).
The foreign-born share of the Hispanic population will fall gradually over the next 20 years, from 39.7% in 2014 to 34.8% in 2034, given our assumptions about fertility rates and net international migration used in our baseline long-term projections of the Hispanic population. Yet, because of the patterns of persistence in the use of Spanish described above, the share of the Hispanic population that speaks Spanish in the home will fall by less—from 73.3% in 2013 to 71.3% in 2034.
0% 10% 20% 30% 40% 50% 60% 70% 80% 90% 100%
Pre-19301930-391940-491950-591960-691970-79
1980198119821983198419851986198719881989199019911992199319941995199619971998199920002001200220032004200520062007200820092010201120122013
Spanish only Spanish & English
Percent of foreign-born Hispanic population that speak Spanish in the home by year of entry
© 2015 IHSSource: IHS tabulation of 2013 American Community Survey data.
Figure 8
February 2015 20 © 2015 IHS
IHS Economics | Hispanic Immigration and US Economic Growth
EMBARG
OED
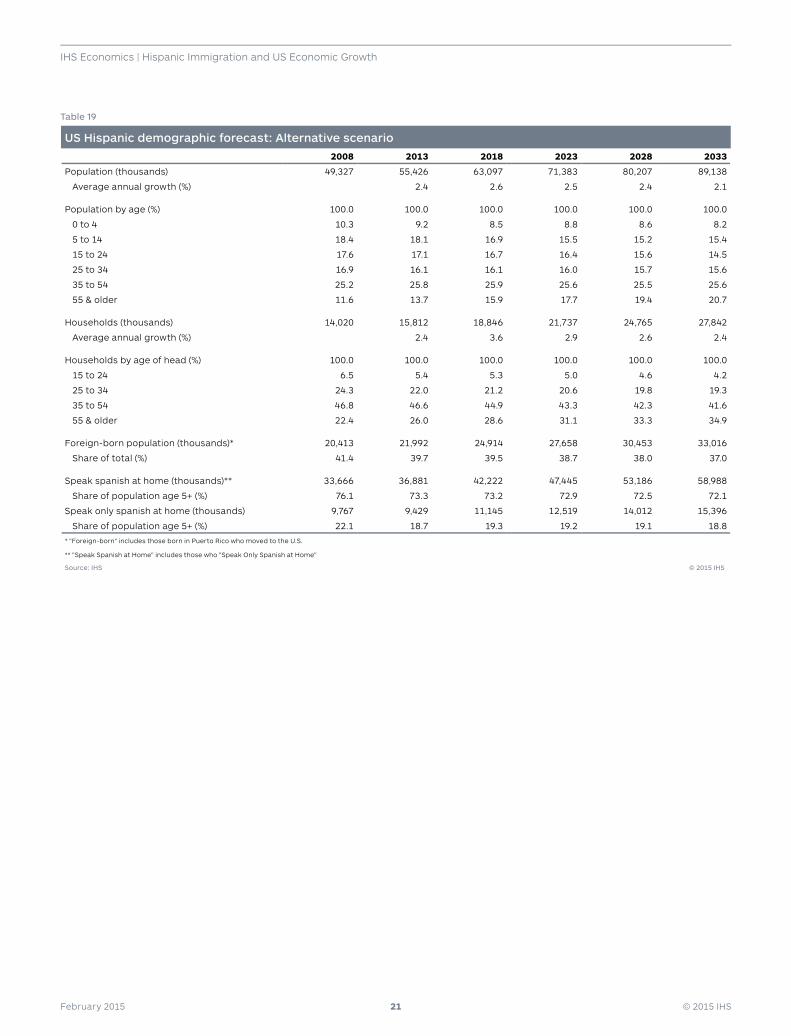
In the alternative scenario of Hispanic population and employment growth presented above, which assumes a higher level of Hispanic immigration:
• Net migration accounts for 43% of Hispanic population change over the forecast period. As a result, the foreign-born share of the Hispanic population declines less and stands at 37.0% in 2034.
• With a higher foreign-born share of the population, the share of the population 5 and over that speaks Spanish in the home is slightly higher throughout the forecast period and stands at 72.1% in 2034.
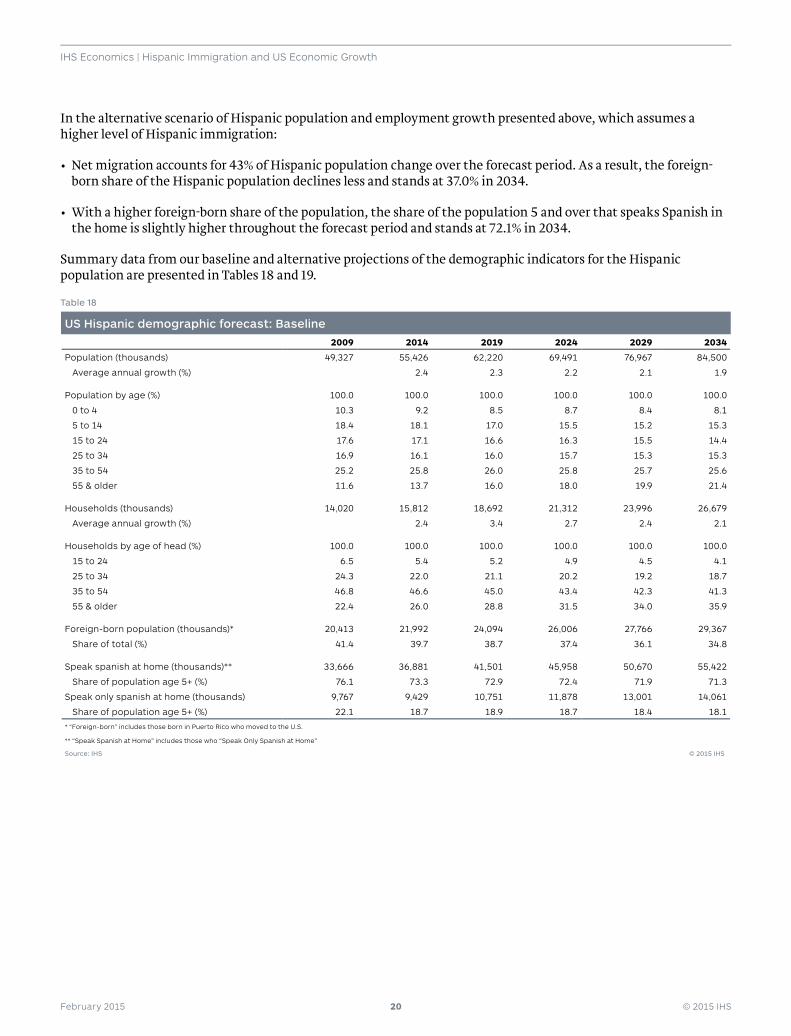
Summary data from our baseline and alternative projections of the demographic indicators for the Hispanic population are presented in Tables 18 and 19.
Table 18
US Hispanic demographic forecast: Baseline2009 2014 2019 2024 2029 2034
Population (thousands) 49,327 55,426 62,220 69,491 76,967 84,500
Average annual growth (%) 2.4 2.3 2.2 2.1 1.9
Population by age (%) 100.0 100.0 100.0 100.0 100.0 100.0
0 to 4 10.3 9.2 8.5 8.7 8.4 8.1
5 to 14 18.4 18.1 17.0 15.5 15.2 15.3
15 to 24 17.6 17.1 16.6 16.3 15.5 14.4
25 to 34 16.9 16.1 16.0 15.7 15.3 15.3
35 to 54 25.2 25.8 26.0 25.8 25.7 25.6
55 & older 11.6 13.7 16.0 18.0 19.9 21.4
Households (thousands) 14,020 15,812 18,692 21,312 23,996 26,679
Average annual growth (%) 2.4 3.4 2.7 2.4 2.1
Households by age of head (%) 100.0 100.0 100.0 100.0 100.0 100.0
15 to 24 6.5 5.4 5.2 4.9 4.5 4.1
25 to 34 24.3 22.0 21.1 20.2 19.2 18.7
35 to 54 46.8 46.6 45.0 43.4 42.3 41.3
55 & older 22.4 26.0 28.8 31.5 34.0 35.9
Foreign-born population (thousands)* 20,413 21,992 24,094 26,006 27,766 29,367
Share of total (%) 41.4 39.7 38.7 37.4 36.1 34.8
Speak spanish at home (thousands)** 33,666 36,881 41,501 45,958 50,670 55,422
Share of population age 5+ (%) 76.1 73.3 72.9 72.4 71.9 71.3
Speak only spanish at home (thousands) 9,767 9,429 10,751 11,878 13,001 14,061
Share of population age 5+ (%) 22.1 18.7 18.9 18.7 18.4 18.1
* “Foreign-born” includes those born in Puerto Rico who moved to the U.S.
** “Speak Spanish at Home” includes those who “Speak Only Spanish at Home”
Source: IHS © 2015 IHS
February 2015 21 © 2015 IHS
IHS Economics | Hispanic Immigration and US Economic Growth
Table 19
US Hispanic demographic forecast: Alternative scenario2008 2013 2018 2023 2028 2033
Population (thousands) 49,327 55,426 63,097 71,383 80,207 89,138
Average annual growth (%) 2.4 2.6 2.5 2.4 2.1
Population by age (%) 100.0 100.0 100.0 100.0 100.0 100.0
0 to 4 10.3 9.2 8.5 8.8 8.6 8.2
5 to 14 18.4 18.1 16.9 15.5 15.2 15.4
15 to 24 17.6 17.1 16.7 16.4 15.6 14.5
25 to 34 16.9 16.1 16.1 16.0 15.7 15.6
35 to 54 25.2 25.8 25.9 25.6 25.5 25.6
55 & older 11.6 13.7 15.9 17.7 19.4 20.7
Households (thousands) 14,020 15,812 18,846 21,737 24,765 27,842
Average annual growth (%) 2.4 3.6 2.9 2.6 2.4
Households by age of head (%) 100.0 100.0 100.0 100.0 100.0 100.0
15 to 24 6.5 5.4 5.3 5.0 4.6 4.2
25 to 34 24.3 22.0 21.2 20.6 19.8 19.3
35 to 54 46.8 46.6 44.9 43.3 42.3 41.6
55 & older 22.4 26.0 28.6 31.1 33.3 34.9
Foreign-born population (thousands)* 20,413 21,992 24,914 27,658 30,453 33,016
Share of total (%) 41.4 39.7 39.5 38.7 38.0 37.0
Speak spanish at home (thousands)** 33,666 36,881 42,222 47,445 53,186 58,988
Share of population age 5+ (%) 76.1 73.3 73.2 72.9 72.5 72.1
Speak only spanish at home (thousands) 9,767 9,429 11,145 12,519 14,012 15,396
Share of population age 5+ (%) 22.1 18.7 19.3 19.2 19.1 18.8
* "Foreign-born" includes those born in Puerto Rico who moved to the U.S.
** "Speak Spanish at Home" includes those who "Speak Only Spanish at Home"
Source: IHS © 2015 IHS