connie j. koli kn* d noreen tuross j ancient … ancient dnaanalysis of human populations connie j....
TRANSCRIPT

AMERICAN JOURNAL OF PHYSICAL ANTHROPOLOGY 111:5-23 (20001
j Ancient DNAAnalysis of Human PopulationsCONNIE J. KOLI_kN* _D NOREEN TUROSSSmithsonian Center for Materials Research and Education,Suitland, Maryland 20746-0534
KEY WORDS aDNA; mitochondrial DNA; PCR contamination;New World
ABSTRACT The use of ancient DNA (aDNA) in the reconstruction ofpopulation origins and evolution is becoming increasingly common. Theresultant increase in number of samples and polymorphic sites assayed andthe number of studies published may give the impression that all technologi-cal hurdles associated with aDNA technology have been overcome. However,analysis of aDNA is still plagued by two issues that emerged at the advent ofaDNA technology, namely the inability to amplify a significant number ofsamples and the contamination of samples with modem DNA. Herein, weanalyze five well-preserved skeletal specimens from the western UnitedStates dating from 800-1600 A.D. These specimens yielded DNA sampleswith levels of contamination ranging from 0-100%, as determined by thepresence or absence of New World..specific mitechondrial markers. All sampleswere analyzed by a variety of protocols intended to assay genetic variabilityand detect contamination, including amplification of variously sized DNAtargets, direct DNA sequence analysis of amplification products and sequenceanalysis of cloned amplification products, analysis of restriction fragmentlength polymorphisms, quantitation of target DNA, amino acid racemization,and amino acid quantitation. Only the determination of DNA sequence from acloned amplification product clearly revealed the presence of beth ancientDNA and contaminating DNA in the same extract.
Our results demonstrate that the analysis of aDNAis still an excruciatinglyslow and meticulous process. All experiments, including stringent quality andcontamination controls, must be performed in an environment as free aspossible of potential sources of contaminating DNA, including modem DNAextracts. Careful selection of polymorphic markers capable of discriminatingbetween ancient DNA and probable DNA contaminants is critical. Researchstrategies must be designed with a goal of identifying all DNA contaminantsin order to differentiate convincingly between contamination and endogenousDNA. Am J Phys Anthropol 111:5-23, 2000. ©2000Wiley-Liss,Inc.
New World indigenous groups were first founding haplotypes of the New World (Tor-assayed for mitochondrial DNA (mtDNA) roni et al., 1992). The RFLP/deletion datarestriction fragment length polymorphisms were influential in shaping future molecular(RFLPs) and deletion/insertion events by studies of indigenous groups in the Ameri-Douglas C. Wallace and coworkers in the1980s. These investigators defined four hap-
I logroups, each based on a single RFLP or G_t_po,_o_:Smithsonia_Institution.
deletion, that were present at varying fre- *Correspondenceto: ConmeJ. Kol.... NIH/NIAAAfLNG.12420 Parklawn Dr, Park Bldg., Room 451, Rock.lie, MD
quencies in populations throughout the New 20852.E-mail:[email protected] and were proposed to represent the m_iv_d7December1998;accept_t3August1999
© 2000 WILEY-LISS, INC.
DOI 05592

6 c.J. KOLMANANDN.TUROSS
cas, and thousands of New World individu- determined by DNA sequence analysis. Theals have now been assayed for mitochondrial reduced mitochondrial diversity of NewRFLP/deletions (e.g., Ward et al., 199L 1993; World populations (Kolman et al., 1996) andTorroni et al., 1993; Kolman et al., 1995; thelarge comparative database ofmitochon-Kolman and Bermingham, 1997; Merri- drial sequences wordwide permit thewether et al., 1995). Varying frequencies of straightforward identification of outlier hap-the four haplotype classes have been used to lotypes in New World populations. The highly
support or refute the controversial three- unusual confluence of ;hese characteristicswave hypothesis of New World colonization makes the New World an ideal case for(Greenberg et al., 1986; Torroni et al., 1992; detection of contaminants. Ancient DNAKolman et al., 1996). studies wherein the prehistoric population
With the advent ofpolymerase chain reac- and likely source(s) of contamination aretion (PCR) technology in the field of ancient genetically similar will be much more diffi-DNA(aDNA), the application of these mark- cult, if not impossible, to conduct (e.g., Rich-ers to prehistoric populations would seem ards et al., 1995).obvious, though perhaps not as straightfor- We present results on five well-preserved
ward as originally thought. The RFLPs and skeletal specimens from the western Uniteddeletion defined by Wallace and coworkers States dating from 800-1600 A.D. In addi-represent only a subset of all mitochondrial tion to D-loop sequence determination andpolymorphisms currently assayed in contem- mitochondrial RFLP/deletions, numerousporary New World indigenous populations analyses were performed in order to assayand, furthermore, contemporary New World genetic variation and detect contaminationpopulations carry only a fraction of the in these samples. In sum, our data demon-mitochondrial variation present worldwide, strate that: I) negative extraction and PCRThe diagnostic RFLP/deletions do not define controls do not ensure lack of contamina-monophyletic haplotype clusters in popula- tion, 2) the presence of intact and cut bandstions outside the New World, even in ances- in a restriction endonuclease digestion does
tral Asian populations (Kolman et al., 1996). not necessarily signify an incomplete digestSince modern populations may canw less but may reveal the presence of two DNAs,genetic variation than their ancestors or one of which is likely to be a modern contami-may be more distantly related to ancient nant, 3) DNA sequence determination ofpopulations than is currently recognized, it cloned amplification products is necessary tomay be a dangerous strategy to assay prehis- give a clear picture of the nature and extenttoric populations for a restricted set ofpoly- of contamination in a sample, 4) methodsmorphisms that have been culled from con- such as amino acid racemization and DNAtemporary populations. To assay a_cient quantitation are minimally useful'in detect-specimens for only a few diagnostic markers ing contamination, and 5) assaying the com-with the justification of damaged aDNA and plete set of diagnostic RFLP/deletions cancommensurate increase in time required for provide corroborative support for haplotypeaDNA analyses is to invite incorrect hap- identification based on DNA sequence deter-logroup assignments, mination.
Identification of contamination and au-
thentication of results in aDNA studies rely MATERIALS AND METHODS
on the ability to discriminate between an- Samplescient populations and DNA contamination.Numerous polymorphisms have been identi- Five skeletons, excavated at four sites infled which distinguish New World _mpula- the Plains region, were investigated. Thetions from European populations (it is gener- five specimens span 800 years in time, withally assumed that DNA contamination is samples I and 5 dating to the late Woodlandlikely to be of European origin), Mr,hough period (sample 5 has an uncalibrated radio-the majority of these markers occur as mito- carbon date of 760 -_:50 AD [TO-21891)chondrial D-loop haplotypes that a_e not Samples 2-4 date to the period 1200-1600detected by RFLP analysis but must be AD. Afemoral fragment from each specimen
DOI 05593

ANCIENT DNA ANALYSIS OF HUMANS 7
was used in all DNA and protein extractions. DNA extraction and purification
DNA extractions were saved from a previous Powdered bone, for D NA extraction, wasnatural abundance stable isotope study, generated by grinding bone fragments un-These skeletons were collected prior to the der liquid nitrogen in a Spex mill (Spexuse of molecular biological techniques and Industries, Inc., Edison, NJ). The bone pow-the attendant precautions now established der was then placed in 6,00_8,000 molecu-to reduce contamination during excavation Iar weight cut-off (MWCO) (Spectrum Medi-and curation. The results reported herein cal Industries, Los Angeles, CA) dialysisare considered representative of the many tubing and immersed in 0.5 M EDTA, pHaDNA studies currently being pursued on 7.3, at 4°C until complete decalcification hadsimilar collections, occurred. Due to the high collagen content of
the skeletal material and the low tempera-Contamination precautions ture used for decalcification, complete decal-
No DNA-based studies of modern human cification required appro_Smately 2-3 weeks.populations were ever conducted in the build- The EDTA extract was washed extensivelying in which these experiments were ex- with doubly distilled water (ddH20) and
concentrated by passage through a YM30ecuted. Positive PCRs were never per- filter (Amicon, Inc., Beverly, MA). Each filterformed. Several "no DNA" PCRs were
was washed five times with ddH20, and theperformed in each series of reactions. Cross-washes were processed as blanks in order to
contamination between samples was consid- detect cross-contamination between YM30ered unlikely due to the low levels of amplifi- filtrations. To decontaminate the filtrationable aDNA present in the samples. In unit, it was boiled between samples.retrospect, the contaminants also appeared Experiments were performed to test theto be present at very low levels and not efficacy of bleach or EDTA pretreatment inprone to cross-contamination, given that reducing DNAcontamination of the skeletalonly one out of eight contaminating' se- material. Bleach treatment involved immers-quences was found in more than one sample, ing the powdered bone in 20% bleach for 2All pre-PCR protocols were performed in a min followed by extensive ddH20 washing.laboratory designed with positive hepa- The EDTA protocol consisted of a 2-dayfiltered air pressure and dedicated to aDNA treatment with 0.5 M EDTA at 55°C. Follow-work. PCR and post-PCR analyses were ing each pretreatment, 1-)NAwas extractedconducted in separate wings of the building, by immersing the powdered bone in 0.5 MAll post-extraction manipulations were con- EDTA at 4°C until complete decalcificationducted by C.J.K. All reagents, including occurred.sterile water, were purchased as ready- A variety of purification protocols weremade solutions (Amresco, Inc., Solon, OH). tested, including proteinase K digestionDisposable laboratory coats, gloves, filter (Sigma, St. Louis, MO), organic extraction oftips, dedicated pipetmen, and disposable proteins with phenol and/or chloroform:laboratory ware were used throughout the isoamyl alcohol (Amresco. Inc.), ethanol pre-analyses. Benches and equipment were fre- cipitation of nucleic acids, filtration throughquently treated with a 20% bleach solution. Centricon-30 concentrators (Amicon. [nc.I.Sterile water (Amresco, Inc.) was aliquoted and resin-based purification (Magic Mega-and irradiated by placing the tubes directly prep DNA Purification System, Promega,on a light source of 254 nm for 30 min Madison, WI).(Sarkar and Sommer, 1990). All PCR re- Optimization of the extraction and purifi-agents and primers were also aliquoted and cation protocol is presented below.irradiated at 254 nm for 30 min. DuringPCR setup, all tubes and the reaction cock- Inhibition assaytail minus DNA and enzyme were irradiated An assay to detect inhibition of the PC Rat 254 nm for 20 min prior to addition of enzyme was performed on all DNA extractsDNAand enzyme, and extract dilutions up to 1:100. The 10-jal
DO/05594

8 C.J. KOLMAN AND N. TUROSS
TABLE 1. Polymorphic regions and corresponding amplification cond_ tions
Annealing LengthRegion Primer_ Sequence temperature (bp) Reference
Control region I L16210 CCCATGCTTACAAGCAAGTA 51°C 132 TnisstudyH16301 TGGCTTTATGTACTATGTACTG T%is study
ControlregionI L16210 See above 59°C 184 TaisstudyH16356 GTCATCCATGGGGACGAGAA Handt et al., 1996
Controlregion I L16210 See above 51°C 239 Tais studyH16410 GCGGGATATTGATTTCACGG Handt et al., 1996
Controlregion l L16210 See above 51°C 327 ThisstudyH16498 CCTGAAGTAGGAACCAGATG %%'ardetaL,1991
COIUtRNA Lys L06215 ACAGTTTCATGCCCATCGTC 55°C 121 VCrisehnik et al., 1987Intergenic deletion H08297 ATGCTAAGTTAGCTTTACAG _rischnik et al., 1987
HaeIII:bp 663 L00602 TGTAGCTTACCTCCTCAAAGC 49°C 164 This studyH00725TTGATCGTGGTGATTTAGAGG T_isstudy
Alu[:bp5,176 L05170 CCTACTAC TATCTCGCACCTG 49°C 132 T]isstudyH05261 GTGAATTCTTCGATAATGGCC Wlisstudy
DdeI:bp 10,394, L10308 CCATGAGCCCTACtu_ACAACTAACC 55°C 201 Kolman et al., 1996AluI:bp 10,397 H10459 GTAAATGA_CATTTGGTAAATAT Kolman et al., 1996
AluI:bp 13,262 L13232 CGCCCTTACACAAAATGACATCAA 49°C 207 Ward et al., 1991H13393 TCCTATTTTTCGAATATCTTGTTC S_one and Stoneking, 1998
HaeIII:bp 16,517 L16495 TAGCTAAAGTGAACTGTATCC 49°C 113 T_is studyH16567GGTGATAGACCTGTGATCCAT W'llSstudy
INumbers in the primer designations identify the 3' ends of the primer according to the human reference sequence (Anderson et al.,1981).
assay consisted of 0.5 p/ control template terns) were added. Reaction volumes variedlambda DNA (PE Applied Biosystems, Fos- between 10-40 _l. Table 1 lists the primerster City, CA), 0.5 _1 each of primers PC01 used and the corresponding DNA sequences,and PC02 (PE Applied Biosystems), variable anne_li,_g temperatures, and amplificationamounts of sample DNA extract, and reac- product lengths. All reagents except DNAtion components as described below, except and enzyme were combined into a reactionthat bovine serum albumin was not added cocktail and, along with reaction tubes, wereand 0.4 unit AmplitaqGold (PE Applied Bio- irradiated at 254 nm for 20 rain. Followingsystems) was used. Thermal cycler condi- an initial 12-min incubation at 95°C to acti-
tions consisted of an initial 12-min incuba- vate the enzyme, 50 cyc]es of PCR, 30 sec attion at 95°C, followed by 23 cycles of 30 sec 94°C, 30 sec at the relevant annealing tem-at 94°C, 30 sec at 53°C, and 45 sec at 72°C. perature, and 45 sec at 72°C, with a finalPCR products were analyzed by electropho- extension cycle at 72°C for 5 min, wereresis on 2% agarose gels. Magnitude ofinhi- performed in a Perkin Elmer 480 Thermocy-bition was determined by a visual compari- cler (Foster City, CA) using a CyclerMateson of sample DNA PCR to a control PCR (Biologic Engineering, Inc., Shelton, CT) inlacking sample DNA. lieu of paraffin oil. A Perkin Elmer 9600
DNA amplification Thermocycler and Idaho Technology 1605
Amplifications were performed in Gene- Air-Thermo Cycler (Idaho Falls, ID) wereAmp buffer (PE Applied Biosystems, 1x = 10 also tested.mM Tris, pH 8.3, 50 mM KC1), 1.75 mM Restriction digests of PCR products withMgC12 (PE Applied Biosystems), 200 ]aM of 10-20 units of the apl=.ropriate restrictioneach dNTP (PE Applied Biosystems), 20 enzyme (New England Biolabs, Beverly, MA)_g/ml bovine serum albumin (BSA; Sigma), were performed using the recommendedand 1 pM of each primer (Integrated DNA buffer and incubated overnight at 37°C.Technologies, Inc., Coralville, IA). Spermi- Digestion products were analyzed by electro-dine (400_00 ]aM) was added to facilitate phoresis on 2% agarose gels. Amplificationamplification of DNA s_mples that did not products covering the 9-bp region were ana-amplify initially. For each 10-]_1 reaction, lyzed on 4% Metaphor (FMC BioProducts,1.25 unitsAmplitaqGold (PE Applied Biosys- Rockland, ME) gels.
DOI05595
ANCIENTDNA.aNALYSISOF HUMANS 9
Optimization of the DNA amplification al., 1981). Both light and heavy strandsreaction is presented below, were sequenced for all clor.es.
DNA quantitation Amino acid racemization
DNA quantitation was performed as de- Approximately 10 mg of powdered bone orscribed in Handt et al. (1996). A competitor insoluble collagen were hydrolyzed by piac-construct containing a deletion in the mite- ing samples in sealed tubes containing 6 Nchondrial D-loop region, constructed by HC1 at ll0°C for 20 hr. Insoluble collagenHandt et al. (1996), was used. DNA concen- was prepared by complete decalcification oftration of the deletion plasmid was deter- powdered bone samples in 0.5 M EDTA, pHmined by optical density measurement at 7.4, at room temperature. Trifluoroacetic260 and 280 nm. D-loop control region I isopropyl ester derivatives ofthehydrolyzedprimers listed in Table 1 were used to ]pro- amino acids were prepared using a TFA-IPAduce four PCR products of increasing size: Amino Acid Derivatization kit (Alltech Asso-132 bp, 184 bp, 239 bp, and 327 bp. Reaction ciates, Inc., Deerfield, IL). Chiral separationcomponents were as described above. Ther- of the amino acid enantiomers was per-mal cycler conditions consisted of an initial formed on a Carlo Erba Mega Series 530012-min incubation at 95°C followed by 45 gas chromatograph (Thermo Separations,cycles of 50 sec at 94°C, 50 sec at 48°C, and Riviera Beach, FL) with a Chirasil-Val capil-50 sec at 72°C, with a final extension cycl,e at lary column (Alltech) and flame ionization72°Cfor 5 rain. detection. To determine the extent of race-
mization due to the experimental procedure,Cloning and sequencing a fragment of fresh, whole cow bone was
PCR products were separated by gel elec- analyzed. Powdered bone samples weretrophoresis, excised as agarose bands, purl- available only for samples 1-3.
fled using a GeneClean II kit (Bio 101, Inc., Individual amino acid determinationLa Jolla, CA), and resuspended in approxi-mately 10 !al ddH20. PCR products were Approximately 10 mg of powdered bonethen either sequenced directly or ligated were hydrolyzed by placing samples in sealedinto pCR-Script SK(+) and cloned in X.L1- tubes containing 6 N HC1 at 110°C for 20 hr.Blue MRF' cells (Stratagene, La Jolla, CA). Hydrolysates were dried and resuspendedDirect sequencing was performed usingPCR in a dilute HC1 solution, pH 2.0. Samplesprimers and a DNA Sequencing Kit: FS were analyzed on a Model 2000 amino acidversion (PE Applied Biosystems). In order to analyzer liquid chromatograph (St. John'sgenerate PCR clones, approximately 5 gl of Associates, Beltsville, MD) using a cationpurified PCR product were cloned using the exchange column (St. John's Associates).PCR-Script Cloning Kit (Stratagene). Plas- Ehited amino acids were derivatized post-mid DNA from clones was prepared using a column using o-phthaldehyde and floures-modified alkaline lysis/polyethylene glycol cently detected. Premixed amino acid stan-precipitation plasmid miniprep protocol (PE dards were used for quantitation (StandardApplied Biosystems). Sequencing was per- H, Pierce, Rockford, IL). Sufficient boneformed using M13 forward and reverse prim- material for amino acid determination wasers (Integrated DNA Technologies, Inc.) and available only for samples 1-3.a DNA Sequencing Kit, FS version (PE RESULTSApplied Biosystems). All sequencing reac-tions were analyzed on a 373 DNA Se- The studied skeletal material was exca-quencer (PE Applied Biosystems). DNA se- rated in the middle of the twentieth centuryquence data were collected between bp and represents part. of a large population16,211-16,400 of the mitochondrial D-loop that spanned almost 2,C00 years of humancontrol region I, with the exception of six habitation. The geologic condition of theclones which contained a 132-bp PCR prod- excavation sites was cool and dry, and theuct and were sequenced between bp 16,211- skeletal material was in uniformly excellent16,300 (numbering according to Ander.,Lon et condition. Scanning electron micrographs of
DO105596

I0 C.J. KOLMAN ._A_rDN TUROSS
bone cross sections confirmed the excellent _ Sample 2preservation of morphological characteris-tics such as collagen fibers and nonmineral- _ ÷ Alul -5 C]o _ oized, open Haversian canals (data not e- : r-shown). Colson et al. (1997) proposed thathistological preservation of skeletal mate- 31otn_s
rial is the best indicator of DNA Amplifiabil- 271/281bpsity. The skeletal material was generally apalecolorsimilar tofresh bone,with little of 194_
the dark discolorationfoundin buriedbones 11s_subjected to frequent perfusion by groundwa-ter and accompanying compounds. Soil-derived humic acids result in brown stainingon bone and are thought to be at least 72bpspartially responsible for the inhibitors pres-ent in archaeological skeletal material 1 2 3 4 5 6 7
Nucleic acids were extracted from 19 speci-mens. In general, it was possible to obtain Fig. 1. Ethidiumbromide.stainedagarose gel show-appropriately-sized PCR products from all ing the results of PCR analys:,s of the A/uI/13262 site insample 2. Lanes 1 and 6 depict "no DNA" PCR controls,DNA samples. However, it became clear lanes 2-4 depict three amplification reactions using
early in the study that contamination of the varying amounts of the same sample 2 DNA extractfollowed by A/uI digestion, ar d lane 5 is an undigested
aDNA samples with modern DNA was a PCR of sample 2. DNA size markers were run in lane 7.persistent problem. Extraction controls andPCR controls were negative for all reportedresults, so the cause was not simple contnmi- result was obtained wiLh multiple DNA ex-nation of reagents or laboratory ware. Only tractions from the two samples. In this case,select specimens produced DNA samples there was no possibility of a partial digestwith evidence of modern contamination and, accounting for the two bands, and the causein these samples, the contamination was not was clearly two sources of DNA.consistent in every amplification reaction. At this point, five skeletal specimens were
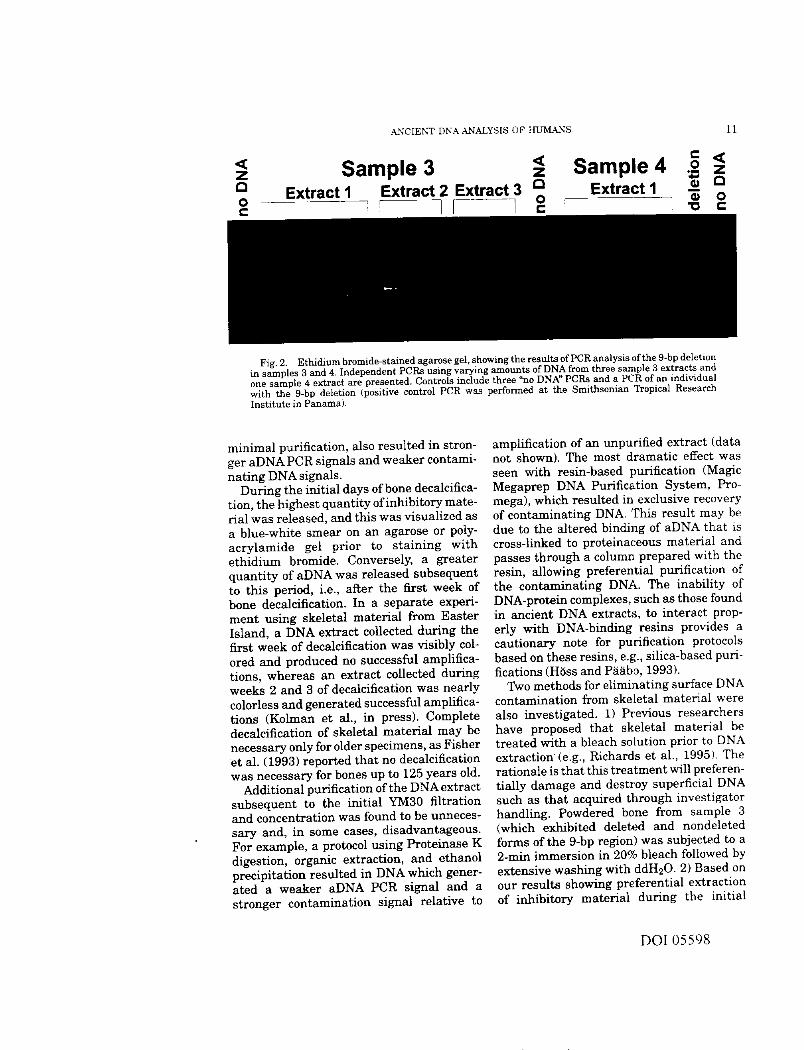
When present, contamination was ob- chosen for further analysis based on theserved as two bands on an agarose gel when following criteria: dating consistent witha single New World-specific polymorphism pre-European contact, reproducible amplifi-was assayed. For example, sample 2 exhib- ability of DNA extracts, and representationitedtheAluIsiteatbp13,262thatisdiagnos- of the full range of contamination fromtic for haplogroup C. However, agarose gel 0-100%.electrophoresis revealed two bands in sam-ple 2 corresponding to the presence and Optimization of DNhextractionabsence of the AluI recognition site (Fig. 1). and purification protocolThe two bands are unlikely to reflect a A variety of extraction and purificationpartial digestion by the A/uI restriction en- protocols were tested which involved vary-zyme since PCR products from all other ing degrees of decalcification of the skeletalsamples (a total of five samples were as- material and subsequent purification usingsayed for AluI:13,262) digested completely, combinations of proteinase K digestion, or-Instead, the two bands most likely corre- ganic extraction of proteins, ethanol precipi-spond to two sources of DNA, one an ancient tation of nucleic acids, Centricon filtration,group C haplotype and the other a modern and resin-based purification. The results ofvariant lacking the AluI site. In addition, these experiments can be summarized assamples 3 and 4 exhibited the 9-bp deletion follows: 1) More complete decalcification re-that is diagnostic for haplogroup B. How- suited in stronger aDNA PCR signals andever, they both showed a band correspond- weaker contaminating DNA signals (whening to the undeleted form of this marker in contnmluation was present). 2) Minimaladdition to the deletion (Fig. 2). The same modification of the crude DNA extracts, i.e.,
DOI05597
._NC[ENT DNA ANALYSIS OF HUMANS 11
<z Sample 3 <z Sample 4 <z
Extract I ,Extract _ZjExtract 3 a Extract I _ _
Pig. 2. Ethidium bromide-stained agarose gel, showing the results of PCR analysis Iff the 9-bp deletionin samples 3 and 4. Independent PCRs using varying amounts of DNA from three sample 3 extracts andone sample 4 extract are presented. ControL_ include three _no DNA" PCRs and a PCR of an individualwith the 9-bp deletion (positive control PCR was performed at the Smithsonian Tropical ResearchInstitute in Panama).
minimal purification, also resulted in sl_ron- amplification of an unpurified extract (datager aDNA PCR signals and weaker contami- not shown). The most dramatic effect wasnating DNAsignals. seen with resin-based purification (Magic
During the initial days of bone decalcifica- Megaprep DNA Purification System, Pro-tion, the highest quantity ofinhibitery mate- mega), which resulted in exclusive recoveryrial was released, and this was visualized as of contaminating DNA. This result may bea blue-white smear on an agarose or poly- due to the altered binding of aDNA that isacrylamide gel prior to staining with cross-linked to proteinaceous material andethidium bromide. Conversely, a greater passes through a column prepared with thequantity of aDNA was released subsequent resin, allowing preferential purification ofto this period, i.e., after the first week of the contaminating DNA. The inability ofbone decalcification. In a separate experi- DNA-protein complexes, such as those foundmerit using skeletal material from Easter in ancient DNA extracts, to interact prop-Island, a DNA extract collected during the erly with DNA-binding resins provides afirst week of decalcification was visibly col- cautionary note for purification protocolsored and produced no successful amplifica- based on these resins, e.g., silica-based puri-tions, whereas an extract collected during fications (HSss and P_i_ibo, 1993).weeks 2 and 3 of decalcification was nearly Two methods for eliminating surface DNAcolorless and generated successful amplifica- contamination from skeletal material weretions (Kolman et al., in press). Complete also investigated. 1) l_evious researchersdecalcification of skeletal material may be have proposed that skeletal material benecessary only for older specimens, as Fisher treated with a bleach solution prior to DNAet al. (1993) reported that no decalcification extraction (e.g., Richards et al., 1995). Thewas necessary for bones up to 125 years old. rationale is that this treatment will preferen-
Additional purification of the DNAextract tially damage and destroy superficial DNAsubsequent to the initial YM30 filtration such as that acquired through investigatorand concentration was found to be unrteces- handling. Powdered bone from sample 3sary and, in some cases, disadvantageous. (which exhibited deleted and nondeletedFor example, a protocol using Proteinase K forms of the 9-bp region) was subjected to adigestion, organic extraction, and ethanol 2-min immersion in 20% bleach followed byprecipitation resulted in DNA which gener- extensive washing with ddH20.2) Based onated a weaker aDNA PCR signal _md a our results showing preferential extractionstronger contamination signal relative to of inhibitory material during the initial
DOI05598

12 C.J.KOLMANANDN. TUROSS
stages of decalcification, a 2-day pretreat- A "heat-soak" step (Ruano et al., 1992) atment with 0.5 M EDTA at 55°C was also 95°C for 10-20 min prior to temperaturetested for efficiency in removing contamina- cycling was essential for strong DNA ampli-tion. Bone powder treated by both proce- fication. This was achieved either by addingdures was then placed in 0.5 M EDTA at 4°C the primers, dNTPs, and enzyme after theto extract DNA. Although both treatments "heat-soak" step, or by using AmplitaqGolddecreased the incidence of the nondeleted DNA polymerase which required a 12-min9-bp band in sample 3, neither treatment 95°C incubation for full activity.completely eliminated this evidence of con- Low levels ofspermidme facilitated ampli-tamination. With no pretreatment, 67% (,116) fication of certain DNA samples (Wan andof PCRs generated both deleted and nonde- Wilkins, 1993). The spermidine concentra-leted 9-bp bands. Following either Clorox or tion was critical, because too much spermi-EDTA treatment, only 25% (1/4) of PCRs dine was found to inhibit the PCR. Optimalgenerated both bands. In all other PCRs, final concentrations of40£L-800 _M spermi-only a single, deleted 9-bp band, diagnostic dine were empirically determined. However,for haplogroup B, was generated. The inabil- these spermidine concentrations inhibitedity to eliminate contamination derived from amplification of DNA samples that amplifiedspecimen handling is not unexpected, due to in the absence of spermidine. Therefore,the porous nature of bone material that DNA samples were first tested for amplifica-provides easy access for contaminating DNA tion in the absence of spermidine, and thosemolecules deposited during handling. DNA samples with no amplification were
tested again with spermidme.
Optimization of DNA amplification Reamplification of a weak PCR productextracted from an agarese gel was unsatisfac-
Approximately 1-5 _l of DNA extract were tory and consistently generated contamina-typically used in DNA amplifications. The tion. The cont_rnlnation most likely derivedDNA extracts were not inhibitory as deter- from previously amplified DNA that wasmined by lambda DNA amplification and, present in the electrophoresis equipment.thus, DNA dilutions were not necessary for Supporting this interpretation, successhflsuccessful amplification, amplification of human mitochondrial D-loop
Irradiation of all reaction components, DNA was recovered from a piece of agaroseincluding tubes, ddH20, buffer, MgC12, BSA, in which no DNA had been electrophoresed.dNTPs, and DNAprimers, immediately prior Various thermal cycling machines wereto addition of DNA and enzyme (Sarkar and also tested. An air cycler (Idaho Technolo-Somrner, 1990), was necessary for consis- gies) never yielded successful amplificationtently negative extraction and PCR controls, of the aDNA samples. In a comparison be-Three sets of irradiation conditions were tween Thermocyclers 480 and 9600 (Perkintested: 312 nm for 20 min, 312 nm for 40 Elmer, Idaho Falls, ID), the 480 model consis-min, and 254 nm for 20 min. Only irradla- tently yielded stronger aDNA PCR signalstion at the more intense wavelength of 254 and weaker contamination PCR signals.ran for 20 min successfully eliminated all Both results were supported by a separatesignals in negative controls and signifi- study of DNA extracted from archival fishcantly reduced the intensity of the contami- specimens (Kolman and Tuross, unpub-nating DNA PCR when contamination was lished data).present. Additionally, commercially obtainedDNA primers were frequently found to be RFLP analysiscontsmiJaated and were routinely "decon- Four haplogroups, labeled A, B, C, and D,taminated" by irradiation at 254 nm for 20 were defined by Torroni et al. (1992, 1993}min. This practice did not destroy the utility based on mitochondrial restriction/deletionof the DNA primers despite the frequent polymorphisms, and were proposed to repre-occurrence of neighboring thymines in the sent founding New World haplogroups. Theprimer sequences and the potential for fbr- diagnostic sites are listed in Table 2. Thesemation of ultraviolet (UV)-induced thymine six polymorphisms were assayed in the fivedimers, ancientsamplesand arepresentedin Table3.
DO105599

ANCIENT DNAANALYSIS OF HUMANS 13
TABLE 2. Mitochondrial DNA markers diagnostic for founding New World hapiogroups
Site I Haplogroup A Haplogroup B Haplogroup C Haplogroup D
Restriction/deletion sitesHaeIII:663 1 0 0 0A/uI:5176 1 1 1 0
DdeI: 10,394 0 0 1 1A/uI:10,397 0 0 1 1AluI:13,262 0 0 1 0
9-bp 2 1 2 2Control region I polymorphisms
16,217 T C T T16,223 T C T T16,290 T C C C16,298 T T C T16,319 A G G G16,325 T T C/t C16,327 C C T C16,362 C T T C
iDiagnosticrestriction/deletionsitesweredefinedbyTortonietal.(1993),and diagnosticcontrolregionI_olymorpbJsm_were definedby HoraJetal.(1993).Presenceand absenceofa restrictionsiteareindicatedby i and O,respectlvely.One and two coprasofthe9-bprepeat are indicated by 1 and 2, respectively. For control region I DNA sequence data, the dplq-ln_ sites ace underlined. X/y indicatesthat X is the predominant uucleotide at that position, although Y occurs at a low frequenc_
TABLE 3. Polymorphic restriction, deletion, and nucleoti_e sites of ancient DNA samples
DNA sequence analysis of cloned PCR producte 2
RFLP/deletionanalysisofPCR productsI D-looppelymorphicsites New
9-bp 2 2 2 2 2 2 2 3 3 3 3 3 3 WorldHaeIII A/ul Ddel A/ul A/u[ 9,272/ New World 1 I 2 9 9 9 9 0 1 2 2 2 6 haplo- No. of
Sample 663 5,176 10,394 10,397 13,262 8,289 haplogroup 7 8 3 1 4 6 8 4 1 5 7 8 2 group clone_
Reference 0 _ 0 0 O 2 T C C C C C T T T T C C T 54Samplel 0 1 1 2 C . . T . . . C . . C T CSample2 0 1 UO U0 U0 2 C¢_ . . T . . . C . C T C
• . T . . . C nd nd nd nd nd nd C 5• G ..... nd nd nd nd nd nd nN
C . T .... nd nd nd nd nd nd aNSample 3 0 1 0 0 0 I/2 B2_ C ............ B• T ......... A C nN 3
C T .......... aN 3............. aN........ C .... aN 2
Sample4 O 1 0 0 0 112 B2_N _ ............... T T . C ..... B_N 4............. aN 3
Sample 5 0 1 O 0 0 2 aN T nN 2
l Presence and absence of a restriction site are indicated by i and O.respectively. One and two copies of the 9-bp repeat are indicated by1 and 2, re--rely. 1/0 or 122siffni_es tha¢ two sets of bands were identified in the same sample.2 DNA sequences determined _ direct sequencing of PCR preducte are shown in bold type. nd, not determined. DNA sequence of132-bp PCR pruducte was only determined between bp 16,210-IS,300. nN, a non-New World haplotype.
SAmples 1 and 2 exhibited the A/uI site at However, they both showed a band corre-bp 13,262 that is diagnostic for haplogroup sponding to the undeleted form of thisC. However, agarose gel electrophoresis re- marker in addition to tl=e deletion (Fig. 2).vealed two bands in sample 2 corresponding The same result was obtained with multipleto the presence and absence of the A/uI DNAextractions.recognition site (Fig. 1). SAmple 2 was also Sample 5 displayed none of the diagnosticpolymorphic for the DdeI site at bp 10,394 RFLP/deletion polymorphisms for Newand the A/uI site at bp 10,397 (Table 3). The World founding haplogroups.presence of these three sites is diagnostic forNew World haplogroup C, while absence of
thesesitesismost common in European DNA sequence analysispopulations.Sample iwas invariantforthepresenceofDdeI:10,394,AluI:10,397,and Diagnosticpelymorphismsin the mito-A/uI:13,262. chondrialD-loopcontrolregionIhave also
Samples 3 and 4 displayedthe 9-bpdele- beendefinedforNew World foundinghap-tionthat isdiagnosticfor haplogronpB. logroupsand are presentedin Table2,as
DOI 05600

14 C,J. KOLMAN AND N. TUROSS
summarized in Kolman et al. (1996) from et al., 1990), polymerase error, templateHorai et al. (1993). D-loop DNA sequences damage, or a combination of these events.were determined for the five ancient samples Direct sequence analysis of 132-bp PCRdirectly from the amplified fragments and products identified the C haplotype se-from cloned PCR products (unless otherwise quence.stated, each set of clones was derived t_roma The DNA sequence for sample 3 was deter-single amplification reaction). A summary of mined from clones offiw. _independent ampli-the cloned DNA sequences is presented in fication reactions representing three 239-bpTable 3, with direct PCR sequences identi- fragments and two 327-bp fragments. Fivefled in bold type. DNAsequences are summa- DNA sequences were recovered. One se-rized such that sequences that appeared in quence (n = 3) contained the sites diagnos-only one clone and carried only a single tic for haplogroup B, and was consistentmutation relative to another sequence in the with the identification of the 9-bp deletion in
sample were assumed to reflect DNA dam- sample 3 by RFLP/deletion analysis. Directage or polymerase errors and were not PCR sequencing also identified the B haplo-shown. Complete DNA sequences of all clones type. None of the rema:ning sequences con-can be found in the Appendix. tained all of the diagnostic sites for any New
All clones of sample 1 (n = 4) exhibited a World haplogroup. The second sequencesingle DNA sequence that contained all of (n = 3) was also identified by direct sequenc-the sites diagnostic for haplogroup C. Direct ing of a second PCR and contained both aDNA sequence analysis of an amplification rare polymorphism (16218:T) and a novelproduct confirmed the identical C haplotype transversion (16328:A_ that could reflectsequence. No evidence of contaminating se- polymerase error or template damage. Thequences was observed. These results were third sequence (n = 3) carried the 16217:Cconsistent with the RFLP/deletion analysis, polymorphism that is present in haplogroup
The DNA sequence for sample 2 was deter- B but did not contain the 16223:C site thatmined using cloned products from two inde- also defines haplogroup B. The fourth se-pendent PCRs. In one case, amplification quence (n = 2) corresponded to the humanwas successful for the 239-bp product and, reference sequence, wtfich is the predomi-in the second case, amplification was recov- nant haplotype in European populationsered for only the smallest 132-bp product. (Richards et al., 1996). The 16311:C muta-All clones of the 239-bp fragment (n = 5) tion present in the fifth sequence (n = 2) isyielded sequences which corresponded to found in populations worldwide, althoughhaplogroup C and were consistent with the always in combination with other mutationsidentification ofanAluI site at bp 13,262 by (Kolman et al., 1996; Pdchards et al., 1996;RFLP/deletion analysis. Cloned sequence Torronietal., 1996).analysis of the 132-bp fragment resti[ted in Sample 4 clones exhibited two distinctmultiple sequences, although the predomi- DNA sequences. The predominant sequencenant sequence (n = 5) corresponded to hap- (n = 4) corresponded to one previously iden-logroup C. The second sequence (n = 1) tiffed in European populations as hap-showed a single, rare 16218:G mutation logroup T (Torroni et al., 1996; C.J.K. is alsorelative to the human reference sequence, haplogroup T). The second sequence (n - 2)The reference sequence is the most frequent contained the sites diagnostic for hap-haplotype in European populations (Rich- logroup B and was consistent with the iden-ards et al., 1996). A third sequence from the tification of a 9-bp deletion in sample 4 by132-bp PCR (n = 1) contained two diagnos- RFLP/deletion analysis. Direct DNA se-tic polymorphisms for New World haplo- quence analysis of PCR products identifiedtypes but they define different haplotypes, the predominant haplogroup T sequence.i.e., 16217:C defines haplogroup B and DNAsequenceanalysisofsample5identi-16223:C occurs in the three remaining New fled two DNA sequences that differed by aWorld haplotypes. This sequence may repre- single nucleotide. One sequence (n = 3) wassent back-mutations, "jumping¢' PCR (Pa_ibo identical to the humml reference sequence
DOI 05601

ANCIENT DNA ANALYSIS OF HUMANS 15
(Anderson et al., 1981). The second sequence TABLE4. Quantitation(,frntDNAfragments
(n = 2) carried a C-to-T transition at nucleo- No. ofcoples of variously Longesttide 16291 that has never been identified sizedPCRpr.:s:lucts_ D-loop
fragmentwithout accompanying mutations (Horai and 132 bp 184 bp 2_;9 bp 327 bp amplified 2Hayasaka, 1990; Horai et al., 1993) and
Sample 1 104-105 104-10 s 103-104 0 239 bpmost likely represents polymerase error or Sample 2 104-105 104-105 103 0 239 bptemplate damage. Direct sequence analysis Sample3 104-105 104-105 10_-10 s 103-104 327 bp
of three independent PCRs identified the Sample 4 105 104-105 10L10 s 104-105 327 bp
human reference sequence (Anderson et al., Sample 5 10s-106 105-106 10L105 104-105 327 bp
1981). These results confirmed the RFLP/ 1Numbers of amplifiable copies are given for the minimumvoltuneof DNAextract required for_uccessful DNAamplification
deletion analysis that also failed to identify m_lo-,l reaction.2Length of longest D-loop PCR product which was cloned and
any polymorphisms diagnostic for New World _yzodindigenous populations in sample 5. A radio-carbon date of 760 -+50 AD was determined
for sample 5, thus eliminating the possibil- DNA extracts of all five samples presentedity that it represented an intrusive burial, here contained this number of copies orSample 5 most likely experienced signifi- more for all except the longest PCR product.cantly more investigator handling than the A gradual reduction in number of copies wasother samples because of lesions suggestive seen with increasing PCR product size andof treponemal infection that were present on was consistent with the maximum size of
several of the bones. D-loop fragment amplified in each sample.DNA sequence analysis of cloned amplifi-
cation products confirmed and clarifie_] the Amino acid racemizaUon
results from the RFLP/deletion analysis. Racemization ofaspartic acid (Asp), whichSamples 2-4, which exhibited two sets of has one of the fastest racemization rates ofagarosebands for differentdiagnosticrestric- all amino acids, was assayed and is pre-tion/deletion sites, displayed at least two sented in Table 5 as a ratio of D-enantiomerD-loop DNA sequences, one consistent with to L-enantiomer (ratios are uncorrected fora New World haplogroup and at least one racemization caused by the experimentalnon-New World haplotype that was likely of procedure, which was determined to beEuropean origin. 0.030). D/L ratios were determined using
both powdered bone (samples 1-3 only) andDNA quantitation insoluble collagen. Using bone samples, Poi-
The number of amplifiable copies of four nar et al. (1996) proposed that an Asp D/Lvariously sized DNA fragments in the DNA ratio of 0.08 (uncorrected) represented theextracts was determ;ned using a competi- upper limit for extraction of _mplifiabletion assay. A D-loop construct engineered DNA. All D/L ratios reported for sampleswith a deletion was utilized which allowed 1-5 are equal to or lower than this value,electrophoretic separation of the two sets of suggesting that all five samples are equallyPCR products (Handt et al., 1996). All DNA good candidates for aDNA studies.copy m_rnbers are presented as the quantitypresent in a 10-_ amplification reaction Individual amino acid quantitation(Table 4). Sporadic, unsuccessful PCRs were Quantitation of 14 amino acids was deter-recovered for samples 1 and 2 with primers mined in the three samples for which suffi-for the 327-bp product, indicating that the cient bone material existed. For all aminoDNA concentration was so low that stochas- acids, the ancient samples showed levelstic effects played a large role in the outcome comparable to those found in a fresh, wholeofthereaction(Krmgs, personalcommlmica- cow bone sample (data not shown). Thetion). These reactions were scored as contain- largest difference was seen in glycine, theing zero copies of the large DNA fragment, amino acid present in the highest proportionHandt et al. (1996) proposed that a mini- due to its elevated levels in bone collagen;mum of 103-104 copies was required for samples 1, 2, and 3 contained 78%, 102%,unambiguous and reproducible PCR results, and 91% of the glycine, respectively, present
DOI05602

16 c.J. KCLMA_NANDN. TUROSS
TABLE 5. Amino acid analyses of ancient tion reported here. The contaminated speci-
b°nesamplesl mens studied here appear to contain twoAsp D/Lratio Totalprotein populations of amplifiable DNA molecules,
(pmolamino one ancient in origin and the other of mod-Powdered Insoluble acid/_gbone collagen drybone) ern origin (assuming no heteroplasmy). Both
Sample 1 0.082 0.066 1,613 DNAs were present at extremely low concen-Sample 2 0.071 0.046 2,].42 trations and were unable to efficiently am- ,Sample3 0.068 0.078 1,884 plify alone. Both DNAs were needed to in-Sample4 ND 0.065 NDSample 5 ND 0.077 ND crease the DNA concentration to a criticalFreshcowbone 0.030 ND 1,914 level, at which point they began competing1 ND.notdetermined, for reagents (Handt et al., 1994).
Contamination of arcl-_aeological materialand the complex interp:ay between endog-
in the modern sample. For comparatiw; pur- enous ancient DNA and modern contamina-poses, a collection of Panamanian Amerind tion reported here are unlikely to representbones that did not yield amplifiable DNA a unique situation. Numerous cases exist incontained only 5-62% of the glycine present the published literature that indicate simi-in a modern control (Kolman and Tttross, lar problems have been previously encoun-unpublished data). When summarized as tered, only some of which were identified astotal amount of protein, the ancient bone contamination. The recent determination ofsamples contained 84-112% of the qum_tity the Neandertal mitochondrial D-loop con-of amino acids found in the modern controls trol region DNA sequence by Krings et al.(Table 5). Good preservation of protein, as (1997) was obtained through sequence analy-seen in the studied samples, suggests that sis of cloned PCR products. Two distinct setssimilar levels of DNA preservation may be of DNA sequences were reported, one signifi-expected, cantly different from raodern human se-
quences and presumed to be Neandertal inDISCUSSION origin, and the other identical to the human
Identification of contamination has reference sequence (Anderson et al., 1981)emerged as the single most critical issue in and presumed to be modern contamination.ancient DNA studies. Early, spectacular A second example of contamination is pro-claims of successful DNA extraction from vided by Handt et al. (1996), who identifiedextremely old specimens, such as 17-20 deleted and nondeleted forms of the 9-bpmillion year (Myr) old Magnolia leaf fiJssils region in two out of three 600-year-old New(Golenberg et al., 1990), 25-135 Myr old World skeletal samples. Recently, studiesspecimens preserved in amber (DeSa]le et have attempted to use human remains toal., 1992; Cano et al., 1993), and 80 Myr old identify infectious disease agents, such asdinosaur bones (Woodward et al., 1994), Mycobacterium tuberculosis, Yersiniapestis,have generally been disproved or cast; into and Bacillus anthracis (pathologic agentsserious doubt (Sidow et al., 1991; DeSalle et for tuberculosis, bubomc plague, and an-al., 1993; Lindahl, 1993;Austinetal., 1997a). thrax, respectively; Salo et al., 1994; Dran-Later authors, using relatively simple meth- court et al., 1998; Jackson et al., 1998).ods, were able to detect contamination in the However, these studies all suffer from theearly studies, such as the phylogenetic analy- common practice of inclusion of a positivesis by Hedges and Schweitzer (1995) of PCR control that, in the reported studies,proposed dinosaur DNA which identified it yielded identical DNAsequences to the puta-as modern human contamination. Current tive ancient DNA extracts. The finding ofoccurrences of contamination are subtler identical sequences in an archaeologicaland more dlmcult to detect. Standard precau- specimen and the control DNA sample pre-tionary measures such as negative extrac- cludes convincing proof that ancient DNAtion and PCR controls, multiple extractions, was extracted and analyzed. Conscientious-and "clean" rooms, while necessary, are insuf- ness and complete disclosure of results makeficient and did not identify the contaraina- it possible to assess the types and extent of
DOI 05603

._NCIENTDNAANALYSISOFHUMANS 17
contamination that may be present in the able copies of PCR products ranging in sizemajority of aDNA studies. Reluctance to from 131-238 bp were present in the fivereport evidence of contamination ancVor the DNA extracts. These values were equal to oruse of research strategies that are unlikely greater than the minimum level of 10a cop-to detect contamination, e.g., partial typing ies suggested by Handt et al. (1996) forof samples, should not be interpreted as unambiguous, reproducible PCR results.absence of contamination or as proof of Number of copies correlated negatively withauthenticity of the data. PCR product size as expected for damaged,
Experiments need to be redesigned with ancient DNA. However, the number of ampli-the goal of identifying all DNA contami- fiable copies was not markedly different innants, in order to differentiate convincingly contaminated and uncontaminated samples.between contamination and endogenous For example, samples 1 and 2 gave nearlyDNA. Richards et al. (1995) reported that identical quantitation results, yet sample 2approximately 50% of animal bones from an was contaminated and sample 1 was not. InEnglish site exhibited contamination with sum, all of the methods gave positive indica-human sequences. Human bones should be tors as to the amplifiabi:ity and antiquity ofassumed to be similarly contaminated. The the DNAextracts, but ncne of them providedinconsistent occurrence of the eontaminat- any indication of the corttamination present
ing band in the samples presented here in these samples.illustrates the insidious nature of very low Certain PCR controls have been proposedlevel contamination and the need for' con- specifically to detect contamination, though
stant vigilance in the detection of such con- they also proved inadequate to identify thecurrent contamination. Negative extractiontamination, and PCRcontrolsclearlymissedthe contami-
nation. Similarly, the idea that undamagedAncient DNA or DNA contamination? DNA contaminants would outcompete dam-
Several methods have been proposed as aged aDNA (Austin et al, 1997b) is probablyindicators for the suitability of specimens for an overly simplistic view of the manner inaDNA studies. These protocols were in- which nucleic acids interact. The two groupstended to test the availability of Amplifiable of DNAs did compete, but the results wereDNA, and we investigated their utility in not preordained and varied from sample todetecting contamination as one dimension of sample; increasing amotmts of DNA extracta sample's suitability for aDNA study. Our resulted in increased amplification of theresults demonstrate that no analytical indi- DNA contaminant in some cases and in-cater, including protein analysis, Amino acid creased amplification of the endogenous DNAracemization, DNA quantitation, or inabil- in other cases (data not shown). It has also
been proposed that shorter PCR productsity to amplify large DNA fragments, was are more likely to represent ancient DNAable to predict the modern DNA contamina- (Handt et al., 1994; Richards et al., 1995).tion that was present in the studied samples. However, the 238-bp PCR products fromWith amino acid quantitation, levelsofsmino sample 2 were all ancient haplotype C,acids were similar to those in fresh ]bone, whereas the 132-bp products were a mixturesuggesting that similar preservation of ofhaplotype C and contaminating sequences.nucleic acids could be expected. With amino How, then, does one determine which dataacid racemization, amlno acids showed low constitute contamination and which reflect
levels ofracemization, suggesting that ampli- legitimately ancient DNA? The study byflable DNA might be present. However, the Stone and Steneking (1998) of a prehistoricsamples were contaminated with DNA, not Amerind population from Illinois providesprotein, so that measures of protein quan- an excellent illustration of this dilemma.tity were unlikely to detect very low levels of Out of the 25 DNA sequences that theyDNA contamination. Therefore, a measure determined, 22 could clearly be identified asof DNA quantity was also determined. With one of the four New World haplogroups. TheDNAquantitation, between 103-106 ampliii- remaining three did not carry any of the
DOI 056()4

18 cJ. KOLMANANDN TUROSS
sites diagnostic for New World haplogroups, quence may conceal multiple sources of con-although multiple extractions resulted in tamination. These results illustrate the prob-identical sequences. One sequence was ex- lem in attempting to design a simple criterioneluded from analysis because it was identi- by which to classify a sequence as endog- ,cal to the haplotype of one of the authors, enous. The most common sequence cannotand one sequence was excluded because it be assumed to be endogenous, as illustratedmatched one found in two Finnish individu- by the predominant non-New World se-als (Lahermo et al., 1996). However, the quence in sample 4. Eliminating all author'sthird sequence was retained because there sequences and previously reported non-Newwas no compelling reason to exclude it. This World sequences would still leave four out ofsequence contains a 16278:T polymorphism seven contaminating sequences in the cur-that has been used to define haplogroup X, a rent study. In sum, there is no easy, objectivenovel New World founding haplotype pro- method of identifying contaminating se-posed by Forster et al. (1996). Although quences other than to painstakingly analyzeStone and Stoneking (1998) made no such them within the genetic framework of theclaims, their data illustrate the problem in ancient population under study.determining whichdatatoacceptas authen- In the current study, the initial hap-tic in an aDNA study. Basically, does the logroup assignments for each sample basedburden of proof lie in providing support of on the RFLP/deletion analysis were ulti-the authenticity of the ancient sequence or mately unchanged by the DNA sequencein providing justification to exclude data? analysis. However, this high level of accu-Given the problems illustrated in the cur- racy was possible because of the presence ofrent study, it seems prudent to require sig- the large molecular database on New Worldnificantly more critical review of aDNA data indigenous populations that allowed simplethan of modern DNA and to consider as identification of contaminating haplotypes.
preliminary any data that challenge histori- The situation would be more difficult for acal orthodoxy. The data presented here can different population or a less-studied locusbe used to illustrate the dangers of impru- or when dealing with an extinct lineage.dent inclusion of data. The DNA sequence Lacking an extensive database, only theidentified in sample 5 had never been de- thorough contaminatior_ protocol presentedtected in our laboratory or in New World here would have revealed the extent of
contamination present. For example, sam-indigenous populations. All associated ex-traction and PCR controls were negative, ple 5 could readily have been mistakenlyMultiple extractions resulted in the same identified as a novel foune]ing lineage in theRFLP/deletion haplotype. Therefore, it could absence of a reference database or an exten-be proposed that this haplotype represents a sive contamination investigation.new founding lineage for the New World. Ancient DNA applications to New WorldHowever, the fact that this haplotype isfound at high frequency in European popula- population studiestions (17%, Richards et al., 1996) and is not In theory, aDNA studies have the poten-found in presumably ancestralAsian popula- tial to make a significant contribution to ourtions argues against this interpretation and understanding of human population originsagainst the inclusion of this sequence; in a and evolution in the Americas and through-New World database, out the world. Since New World populations
In total, seven rlifferent non-New World are relatively depauperate in mitochondrialsequences were identified in the current variation, the identification of a novel found-study. They are most likely all European in ing lineage that has been lost in contempo-origin and may represent a minimum of rary populations is a straightforward appli-seven independent sources of contamina- cation ofaDNA analyses. Many studies havetion. European populations are highly homo- also suggested that the morphology of Paleo-geneous from a mitechondrial perspective, indians differs from that of contemporaryand identification of a common European groups. A genetic analysis of the relevantsequence such as the human reference se- archaeological specimens could provide an
DOI 05505

ANCIENTDNAAN._LYSISOFHUMANS 19
•:Z explicit answer as to whether or not these ing haplotypes is such an application. How* -"- =--=: :d_.v]y_populatioas became extinct or evolved ever, identification of a novel h_qtype
•_--'-_4_ _:m_to_ese_t/_liiy-._tdations Thus far the make it difficult to fulfill the
__ __'-_,_:'e_'_ o*n ancient" ._nerind$ :: ti_._ pol_his m be
_e_ and_o_t,___- _._,_.-_wev_, numerousnovoicientand contemporarypol_la1_i "Fi- seqaepc_swere recoveredin the currentnally, a genetic analysis of spe_im_v_ from - study, yet it is unlikely that any of themselect geographic sites and temporal peri- represent new founding haplotypes. The im-ods, corresponding to the independent waves pressive database of polymorphic DNA dataof migration that have been propose,] by in modern human populations assures theGreenberg et al. (1986) and others, could merit of a project assaying these markers inprovide a direct determination of the num- ancient populations, but: only if extensiveber of genetically distinct groups of people precautions have been taken to ensure thethat migrated north out of Asia to colonize accuracy and reliability of the results.the New World. If the colonizing populations A promising new application of aDNAwere independent, both geographically and technology is the analysis of ancient humantemporally, their genetic distinctiveness pathogens, which can be, conducted with ashould be most clearly manifest in prehis- reduced risk of contamination. A recent studytoric New World populations. Any one of has detected DNA from Treponema pall-these questions represents an intere,_ting idum subsp, pallidum, tae causative agentand worthwhile scientific investigation. The for venereal syphilis, in a 200-year-old skel-current reality, however, is that very few etal specimen from Easter Island (Kolmanarchaeological sites exist that contain well- et al., in press). In this collaborative study,preserved human remains likely to yield allwork on modern treponemai DNA(includ-high-quality DNAand are from a geographic ing primer testing and PCR optimization)and temporal period that is of compelling was conducted at the University of Washing-relevance to questions of New World origins, ten, and all work on _he archaeological
CONCLUSIONS specimen was conducted _t the SmithsonianInstitution. The geographic separation of
Each ancient DNA research project must modern and ancient DNA analyses and com-be custom-designed with specific popula- plete absence of modern treponemal speci-tions and polymorphic sites in mind. Poly- mens and DNA (including positive PCR con-morphisms that differentiate between an- trols) in the ancient DNA facility mean therecient specimens and any potential sources of is very little chance that the results reflectcontamination must be identified and ana- modern treponemal DNA contamination. Alyzed. This requirement is relatively simple collaborative arrangement such as this, into fulfill for New World populations due to which all research using modern DNA isthe existence ofpolymorphic sites that distin- conducted in one laboratery while the an-guish them from European populations, cient specimens are analyzed in anotherHowever, the relative ease of contamination laboratory, is critical for successful aDNAdetection in New World populations is atypi- studies.cal of human aDNA studies, where ancient
populations and likely source(s) of contami- ACKNOWLEDGMENTSnation are frequently genetically similar.
The incredible _mounts of time an(] re- M. Krings provided tze D-loop deletionsources necessary for human aDNA studies clone and assistance with the DNAquantita-mandate that only questions which cannot tion experiments. N.T. was supported by abe addressed with modern samples be under- Smithsonian Institution Scholarly Studiestaken. The search for novel, extinct found- Grant.
DO[05606
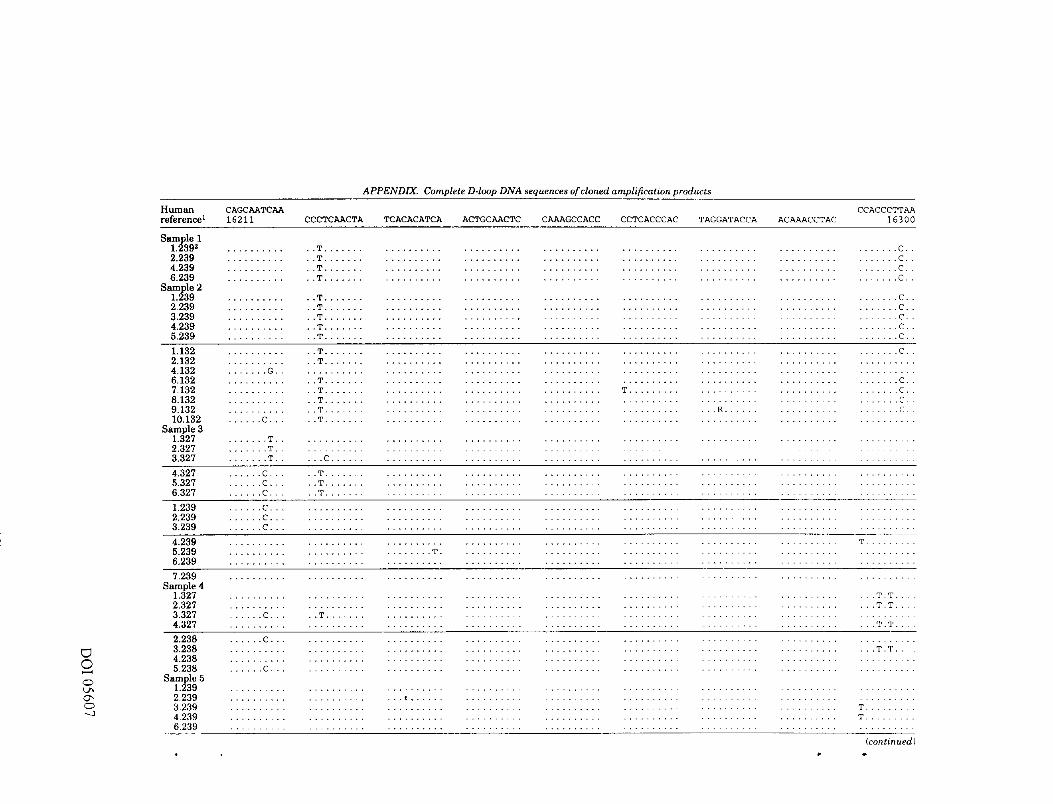
APPENDIX. Complete D-loop DNA sequences of cloned amplification products
Human CAGCAATCAA CCACCCTTAAreferenceI 16211 CCCTCAACTA TCACACATCA ACTGCAACTC CAAAGCCACC CCTCACCCAC TAGGATACCA ACAAACCTAC 16300
Sample 11.239 z ........... T ........................................................................ C..2.239 ........... T ........................................................................ C..4.239 ........... T ........................................................................ C..6.239 ........... T ....................................................................... C..
Sample 21.239 ........... T ....................................................................... c..2.239 ........... T ....................................................................... c..3.239 ........... T ....................................................................... C..4.239 ........... T ....................................................................... C..5.239 ........... T ....................................................................... C..
1.132 ........... T ........................................................................ C..2.132 .T.............................................................................4.132 :::::::G:[ ................................................................................6.132 ............ T ........................................................................ C..7.132 ............ T................................... T.................................... C.8.132 ............ T........................................................................ C.9.132 ............ T................................................ R....................... C10.132 ...... C ..... T ...........................................................................
Sample 31.327 ....... T..................................................................................2.327 ....... T.........................................3.327 ....... T ..... C ............................................................................
4.327 ...... C ..... T ..........................................................................5.327 ...... C ..... T ..........................................................................6.327 ...... c ..... T ...................................................................
1.239 ...... c ................................................................................2.239 ...... c ................................................................................3.239 ...... c ................................................................................
4.239 ............................................................................. w.........
5.239 ............................ T..........................................................6.239 .......................................................................................
7.239 .......................................................................................Sample 4
1.327 ................................................................................ T,T....2.327 ................................................................................. T.T....3.327 ...... C..... T ...................................................................
4.327 ................................................................................ :: :T:T::::
2.238 ...... C.................................
3.238 ........................................ ".... ::::" :::::::::: ...... :::: :::::::::: :::T:T::::4.238 ..... ................................................................................""_ 5.238 :C::: ................................................................................
C' Sample 51.239 ..........................................................................................2.239 ....................... _........................................................3.239 .......................................................................... T:::::::::
-'_ 4.239 ................................................................................ T.........6.239 ..........................................................................................
(continued)

APPENDIX (continued)
CAGTACATAG GTCCCTTGAC
Reference 16 3 01 TACATAAAGC CATTTACCGT ACATAGCACA TTACAGTCAA ATCCCTTCTC GTCCCCATGG ATGACCCCCC TCAGATAGGG 16 4 0 0
Sample 11.239 ........................ C.T...2.239 ........................ C.T... " .....................................................................
4.239 ........................ C.T .............6.239 ........................ C.T. . .............
Sample 2
1.239 ........................ c.T.. . ................2.239 ........................ C.T ...................3.239 ........................ C.T ................4.239 ..................... C..C.T...5.239 ........................ C.T
Sample 3
1.327 ........................... A ................................. C ......................................2.327 ........................... A ................................. C......................................3.327 ........................... A ................................. C ...........4.3275.3276.327
1,2392.239 . . A ....... _+:": .... " '
3.329 ............................................... ,]_!i i:................... : :'.4.239 ......... N ' , ,_-,-_--::-+ _.................................................................. +,....+,,5.239 .......... C............ ].... ,c, ,
6.239 .......... C ........................................................................ i+'*", _*',."+_._[_ +_: _.*&;7.239 C G _,i, _tL_ *_............. . ...................... ,.Sample 4 _, ._,$_,;!V.,_i_ "
1.327 ...c ......................... . ........... . +.2.327 c .................... _...........
3.327 ................................ _,_ . .....4.327 .c...
2.2383.238 ...c ......................................4.238 .....................................5.238
(:_ Sample 51,239 ....................................................................................................2.239
O 6 239(_¢L ....................................................................................................
_'_ I Mutations relaUve to the human reference sequence (Anderson et al., 1981) are depicted. Positions 16,211-16,300 are shown on the top half and positions 16,301 16,400 are shown on 1he bottomC half of the appendix
O_ 2 C Jones are labeled as number size of cloned PCR prod uct in bp Results for different samples are separated by a space, and results from independent amplificatton reactions are separated by a solidhne
22 c.d. KOLMAN AND N. TUROSS
LITERATURE CITED Jackson PJ, Hugh-Jones ME, Adair DM, Green G, HillKnske CR, Grinberg LM, Abramova FA. Keim P.
Anderson S, Bankier AT, Barrell BG, de Brinjn MHL. 1998. PCR analysis of tissue _ples from the 1979Coulson AR, Drouin J, Eperon IC, Nierlich DP, Roe Sverdtovsk anthrax victims: the presence of multipleBA, Sanger F, Schreier PH, Smith AJH, Staden R, Bacillus anthracis strains m different victims. Proc !
Young IG. 1981. Sequence and organization of the NatlAcad Sci USA95:1224-1229. .: ,human mitochondrial genome. Nature 290:457-465. Ko]man CJ, Bermingham E. 1997. Mitochondrial _nd
Austin JJ, Ross AJ, Smith AB, Fortey RA, Thomas RH. nuclear DNA diversity in the Choc6 mad Chibchai997a. Problems of reprodueibility_oes geologically Amerinds of Panama. Genetics 147:1289-1302. •ancient DNA survive in amber-preserved insects? Kolman CJ, Bermmgham E, Cc_)ke R, Ward RH,Arias T,Proc R Soc Lond [Biol] 264:467-474. Guionneau-Sinclair F. 1995. Reduced mtDNA diver-
Austin J J, Smith AB, Thomas RH. 1997b. Palaeontology sity in the Ng6b_ of Panama. U_enetics 140:275-283.in a molecular world: the search for authentic macient Kolman CJ, Sambuughin N, Berminghnm E. 1996.DNA. Trends Ecol Evol 12:303-306. Miteohondrial DNA analysis of Mongolian popula-
Cano RJ, Poinar HN, Pieniazek N J, Acra A, Poin_x GO. tions and implications for tim origin of New World1993. Amplification and sequencing of DNA t_mm a founders. Genetics 142:1321-1334.120-135-million-year-old weevil. Nature 363:536- Krings M, Stone A, Schmitz RW, Krainitzki H, Stonek-538. ingM,P_i_boS. 1997.NeandertalDNAsequencesand
Celson IB, Bailey JF, Vercauteren M, Sykes BC, Hedges the origin of modern humans. Cell 90:19-30.REM. 1997. The preservation of ancient DNA and Lahermo P, Sajantila A, Sistonen P, Lukka M, Aula P,bone diagenesis. Anc Biomole 1:109-117. Peltenen L, Savontens M-L. 1996. The genetic relation-
DeSalle R, Gatesy J, Wheeler W, Grimaldi D. 1992. DNA ships between the Fmns and the Finnish Saamisequences from a fossil termite in Oligo-Mmcene (Lapps): analysis of nuclear DNA and mtDNA. Am J_mher and their phylogenetic implications. Science Hum Genet 58:1309-1322.257:1933-1936. Lindahl T. 1993. Recovery of antediluvian DNA. Nature
DeSalle R, Barcia M, Wray C. 1993. PCR jump:rag in 365:700.clones of 30 million-year-old DNA fragments from Merriwether DA, Rothh_mmer F, Ferrell RE. 1995amber preserved termites (Mastotermes electrodx_mini- Distribution of the four founding lineage hapletypescus). Experientia 49:906-909. in native Americans suggests a single wave of migra-
Drancourt M, Aboudharam G, Sig'noli M, Duteur O, tion for the New World. AmJPhysAnthrepo198:411-Raoult D. 1998. Detection of 400-year-old Yersinia 430.pestis DNA in human dental pulp: an approach to the P_i_ibe S, Irwin DM, Wilson AC. 1990. DNA damagediagnosis of ancient septicemia. Proc Natl Acad Sci promotes jumping between templates during enzy-USA95:12637-12640. matic amplification. J BiolChem 265:4718-4721.
Fisher DL, Holland MM, Mitchell L, Sledzik PS, Webb Poinar I-IN, Hoss M, Bada JL, P,_iibe S. 1996. Amino acidWilcox A, Wadh_m_ M, Weedn VW. 1993. Extraction, racemization and the preservation of ancient DNA.evaluation, and amplification of DNA from deca[cified Science 272:864-866.and undecalcified Umted States Civil War bene. J Richards MB, Sykes BC, Hedges REM. 1995. Authenti-Forensic Sci 38:60-68. cating DNA extracted from a_eient skeletal remains.
Forster P, Harding R, Tortoni A, Bandelt H-J. 1996. JArcheolSci22:291-299.Origin and evolution of Native American mtDNA Richards M, C6rte-Roal H, Porster P, Macaulay V.variation: a reappraisal. Am J Hum Genet 59:935- Wilkin_on-Herbets H, Demalne A, Papiha S, Hedges945. R, BandeltH-J, SykesB. 1996.Paleolithicand ne_
Golenberg EM, GiAnnassi DE, Clegg MT, Smiley CJ, lithie lineages in the European miteohondrial geneDurbin M, Henderson D, Zurawski G. 1990. Chlero- pool. Am J Hum Genet 59:185-203.plast DNA sequence from a Miocene Magnolia spe- Ruano G, Pagilaro EM, SchwarI TR, Lamy IL Messinacies. Nature 344:656-658. D, Gaensslen RE, Lee HC. 1992. Heat-soaked PCR: an
Greenberg JH, Turner CG II, Zegura SL. 1986. The efficient method for DNA amplification with applica-settlement of the Americas: a comparison of the tions to forensic analysis. Biotechniques 13:266-274linguistic, dental, and genetic evidence. Curt A_lthro- Salo WL, Aufderheide AD, Buikstra J, Holcomb TA.po127:477-497. 1994. Identification of Mycobavterium tuberculosis
Handt O, H_ss M, Krings M, P_i_ibe S. 1994. Ancient DNA in a pre-Columbian Peruvian mummy. Proc NatlDNA: methodological challenges. Experientia 50:524- Acad Sci USA 91:2091-2094.529. Sarkar G, SommerSS. 1990.Sheddinglight on PCR
Handt O, Krings M, Ward RH, P_ifibo S. 1996. The contamination. Nature343:27.retrieval of ancient human DNA sequences..Am J Sidow A, Wilson AC, Pa_ibo S. 1991. Bacterial DNA mHum Genet 59:368-376. Clarkia fossils. Philos Trans R Soc Lond {Biol) 333:429-
Hedges SB, Schweitzer MH. 1995. Detecting dinosaur 433.DNA.Science 268:1191-1192. Stone AC, Steneking M. 1998 mtDNA analysis of a
Horai S, Hayasaka K. 1990. Intraspecific nucl_tide prehistoric Oneota populatien: implications for thesequence differences in the major noncoding region of peopling of the New World. Am J Hum Genet 62:1153-human miteohondrial DNA. Am J Hum Genet 46:828- 1170.842. TortoniA, SchurrTG, Yang C-C,Szathmary EJE. Wil-
Horai S, Kondo R, NMtugawa-HatteriY, Hayashi S, liamsRC, SchanfieldMS, Troup GA, Knowler WC.Sonoda S,TajimaK. 1993.PeoplingoftheAmericas, Lawrence DN, WeissKM, WallaceDC. 1992.NauvefoundedbyfourmajorlineagesofmitochondrialDNA. American mitochondrialDNA analysisindicatesthatMol BiolEvol10:23-47. theAmerind and Nadene populationswere founded
H_ss M, P_be S. 1993.DNA extractionfrom Pleis- by two independentmigrations.Genetics 130:153- ,tocenebonesby a silica-basedpurificationmethed. 162.NucleicAcidsIRes21:3913_3914. TorroniA, SchurrTG, Caben _F, Brown MD. NeeiJ_,'.
l)0105609

ANCIENTDNAANALYSISOF HUMANS 23
LarsenM, Smith DG, VulloCM, WallaceDC. 1993. Amerindian tribe.ProcNailAcad SciUSA 88:8720-Asian affinities and continental radiation of the four 8724.founding Native American mtDNAs. Am J Hum Genet Ward RH, Redd A, Valencia D, Frazier B, P_i_iboS. 1993.53:563-590. Genetic and linguistic differe atiation in the Americas.
Torroni A, Huoponen K, FrancLacci P, Petrozzi M, Mo- Proc Natl Acad Sci USA 90:10663-10667.relli L, Scozzari R. Obinu D, Savontaus M-L, Wallace Watson E, Forster P, Richards M, Bandelt H-J. 1997.DC. 1996. Classification of European mtDNA_ from Mitochondrial footprints of human expansions in Af-
rica. Am J Hum Genet 61:691-704.an analysis of three European populations. Genetics Woodward SR, Weyand NJ, Bunnell M. 1994. DNA144:1835-1850.
sequence from Cretaceous period bone fragments.Wan C-Y, Wilkins TA. 1993. Spermidine facilitates PCR Science 266:1229-1232.
amplification of target DNA. PCR Methods Applic Wrischnik LA, Higuchi RG, S-,oneking M, Erlich HA,3:208-210. Arnheim N, Wilson AC. 1987. Length mutations in
Ward RH, Frazier BL, Dew-Jager K, Pfi_ibo S. 1991. human mitochondrlal DNA: direct sequencing of enzy-Extensive mitochondrial diversity within a single maticaUy amplified DNA. Nucleic Acids Res 15:529_542.
DOI 05610