connecting principal evaluation to student academic progress student growth percentiles (sgps) 1
TRANSCRIPT
Connecting Principal Evaluation to Student Academic Progress
Student Growth Percentiles (SGPs)
1
Student Growth Percentile (SGP) Model
What should we know when including student growth percentiles in a
principal’s performance evaluation?
2
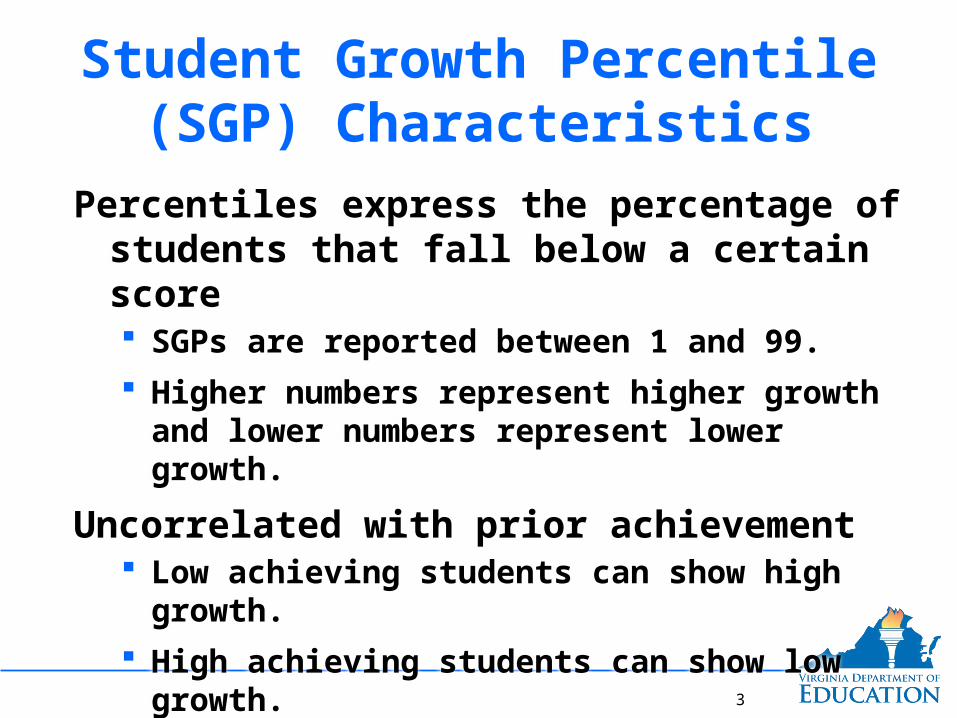
Student Growth Percentile (SGP) Characteristics
Percentiles express the percentage of students that fall below a certain score SGPs are reported between 1 and 99.
Higher numbers represent higher growth and lower numbers represent lower growth.
Uncorrelated with prior achievement Low achieving students can show high growth.
High achieving students can show low growth.
3
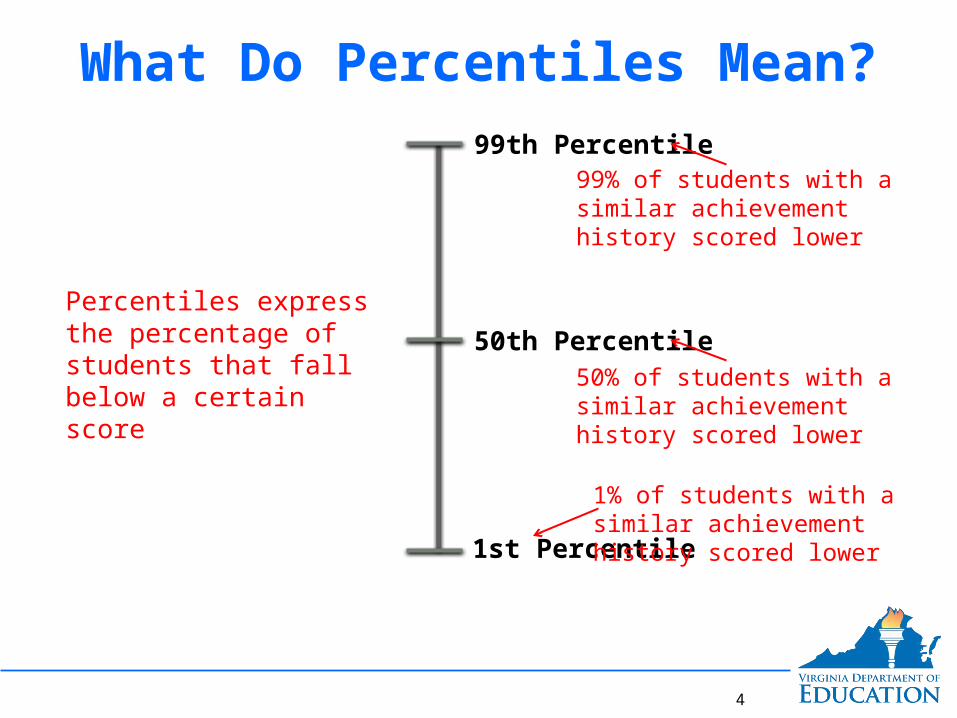
99th Percentile
1st Percentile
50th Percentile
What Do Percentiles Mean?
Percentiles express the percentage of students that fall below a certain score
99% of students with a similar achievement history scored lower
50% of students with a similar achievement history scored lower
1% of students with a similar achievement history scored lower
4
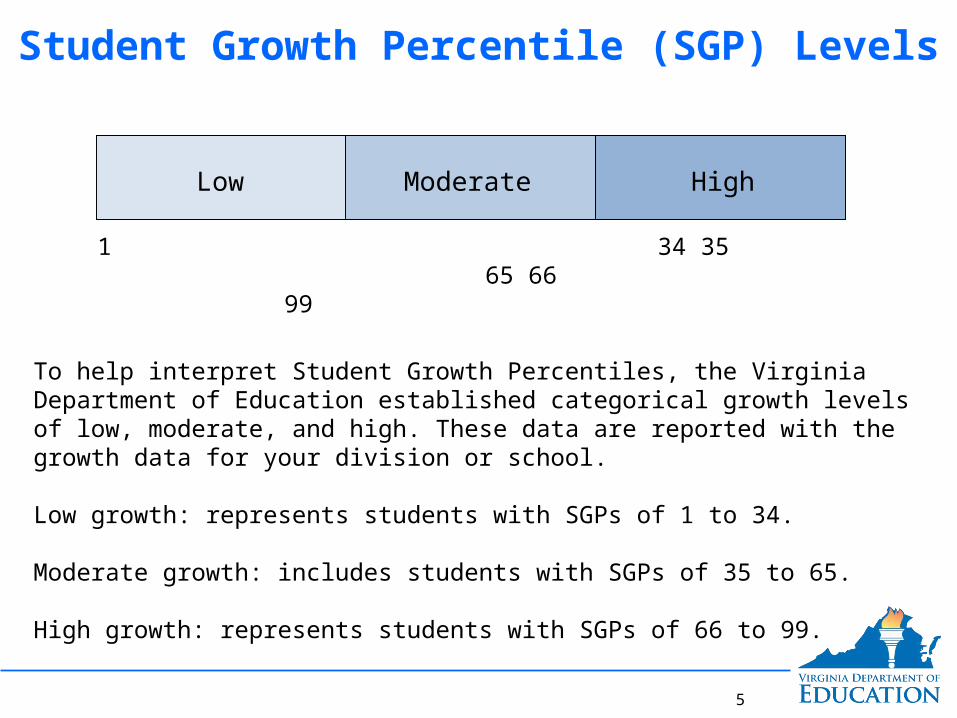
Student Growth Percentile (SGP) Levels
To help interpret Student Growth Percentiles, the Virginia Department of Education established categorical growth levels of low, moderate, and high. These data are reported with the growth data for your division or school.
Low growth: represents students with SGPs of 1 to 34.
Moderate growth: includes students with SGPs of 35 to 65.
High growth: represents students with SGPs of 66 to 99.
5
Moderate HighLow
1 34 35 65 66 99
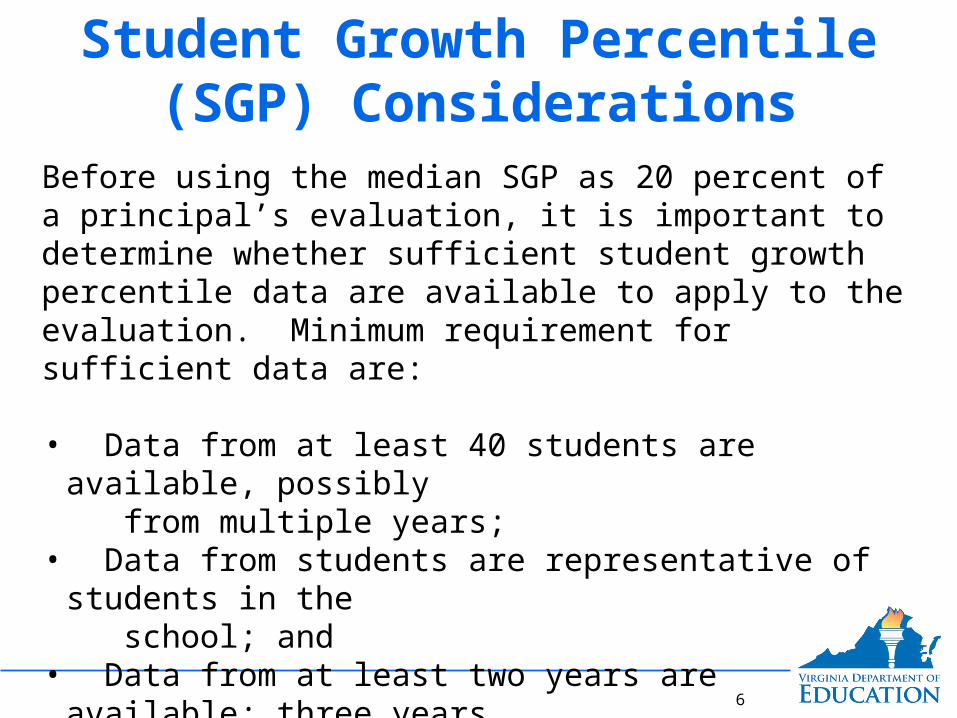
Student Growth Percentile (SGP) Considerations
Before using the median SGP as 20 percent of a principal’s evaluation, it is important to determine whether sufficient student growth percentile data are available to apply to the evaluation. Minimum requirement for sufficient data are:
• Data from at least 40 students are available, possibly from multiple years;
• Data from students are representative of students in the school; and
• Data from at least two years are available; three years should be reviewed whenever possible.
6
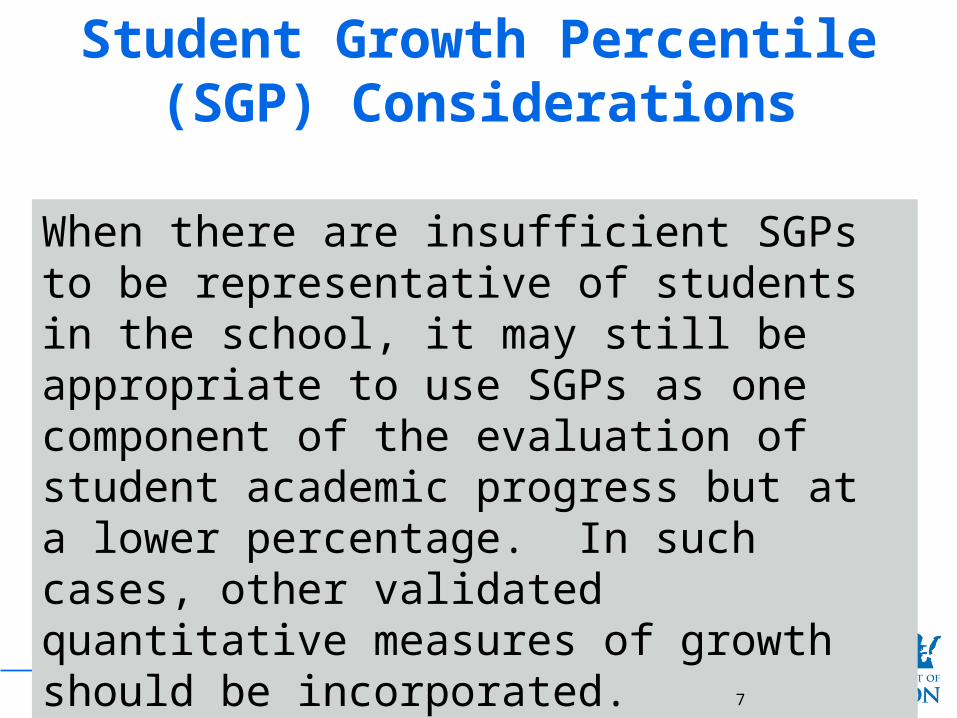
Student Growth Percentile (SGP) Considerations
When there are insufficient SGPs to be representative of students in the school, it may still be appropriate to use SGPs as one component of the evaluation of student academic progress but at a lower percentage. In such cases, other validated quantitative measures of growth should be incorporated.
7
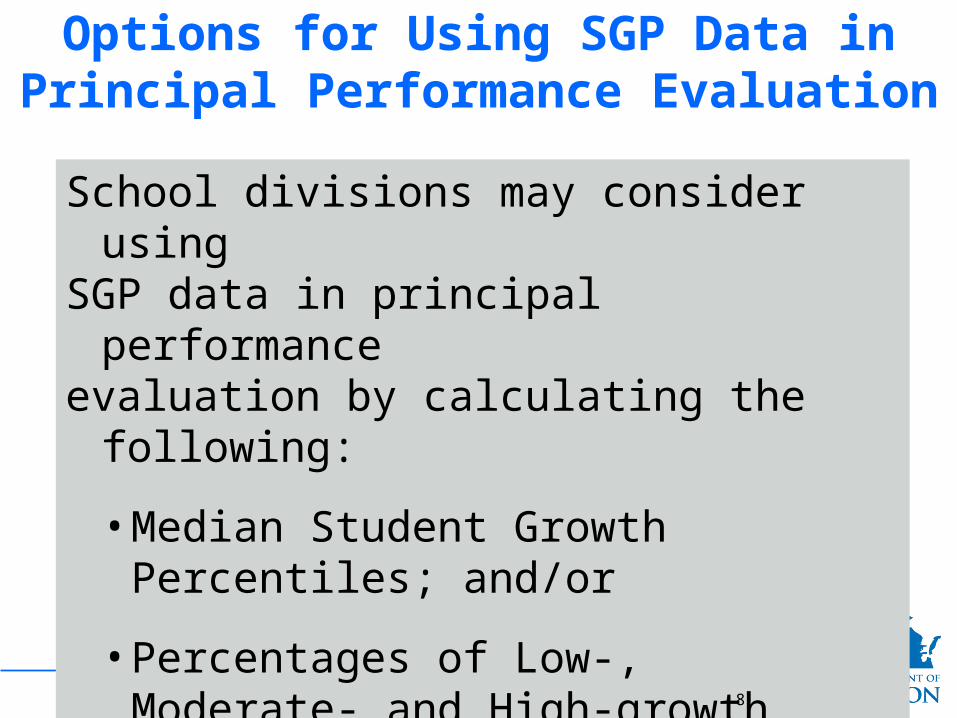
Options for Using SGP Data in Principal Performance Evaluation
School divisions may consider usingSGP data in principal performanceevaluation by calculating the following:
• Median Student Growth Percentiles; and/or
• Percentages of Low-, Moderate-,and High-growth Scores.
8
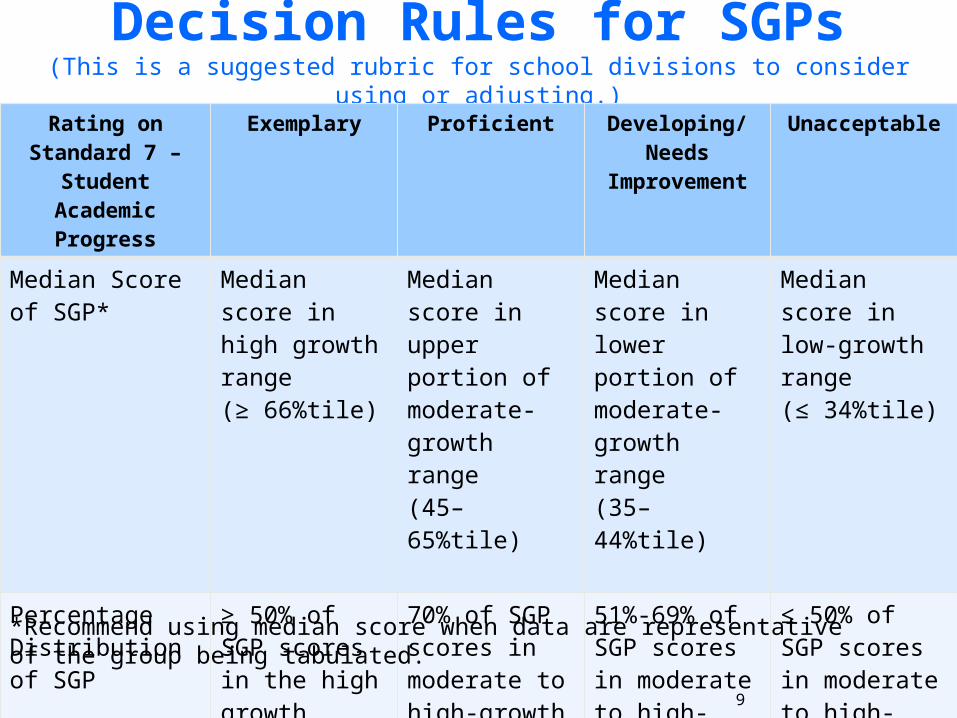
Decision Rules for SGPs(This is a suggested rubric for school divisions to consider using or adjusting.)
Rating on Standard 7 –
Student Academic Progress
Exemplary Proficient Developing/ Needs
Improvement
Unacceptable
Median Score of SGP*
Median score in high growth range(≥ 66%tile)
Median score in upper portion of moderate- growth range(45–65%tile)
Median score in lower portion of moderate- growth range(35–44%tile)
Median score in low-growth range(≤ 34%tile)
Percentage Distribution of SGP
≥ 50% of SGP scores in the high growth range
≤ 15% in low growth range
70% of SGP scores in moderate to high-growth range
51%-69% of SGP scores in moderate to high-growth range
≤ 50% of SGP scores in moderate to high-growth range
*Recommend using median score when data are representative of the group being tabulated.
9
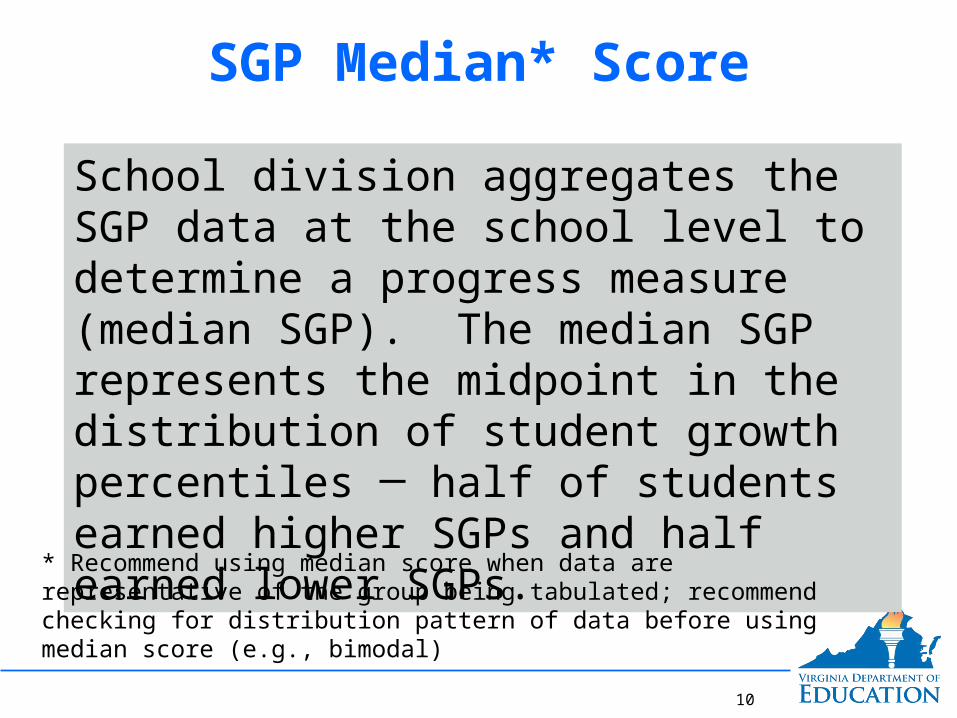
SGP Median* Score
School division aggregates the SGP data at the school level to determine a progress measure (median SGP). The median SGP represents the midpoint in the distribution of student growth percentiles ─ half of students earned higher SGPs and half earned lower SGPs.
* Recommend using median score when data are representative of the group being tabulated; recommend checking for distribution pattern of data before using median score (e.g., bimodal)
10
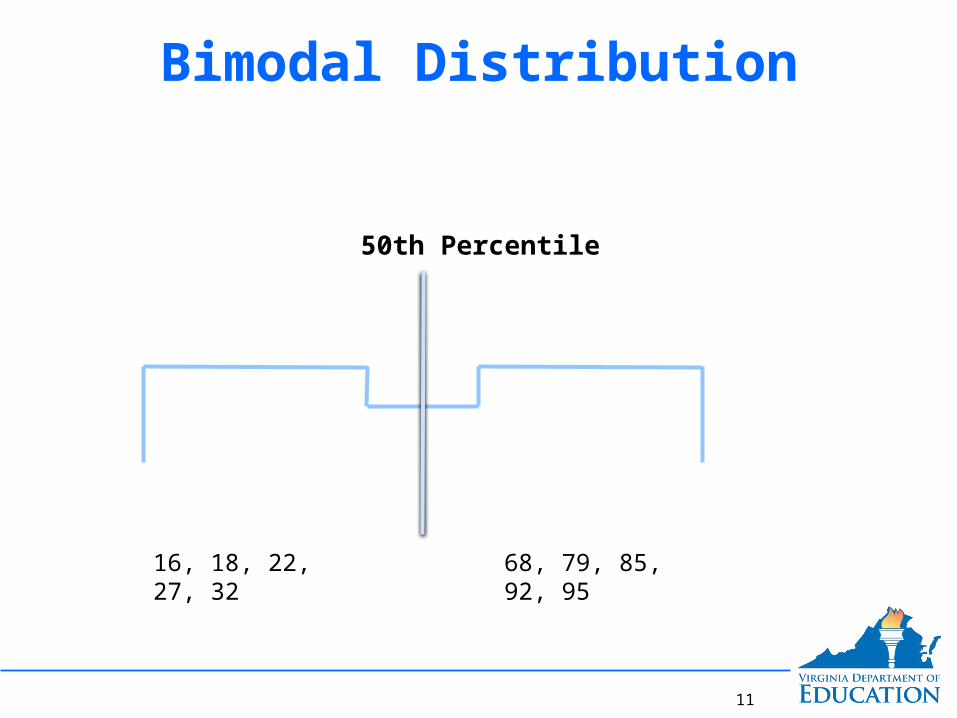
Bimodal Distribution
50th Percentile
16, 18, 22, 27, 32 68, 79, 85, 92, 95
11
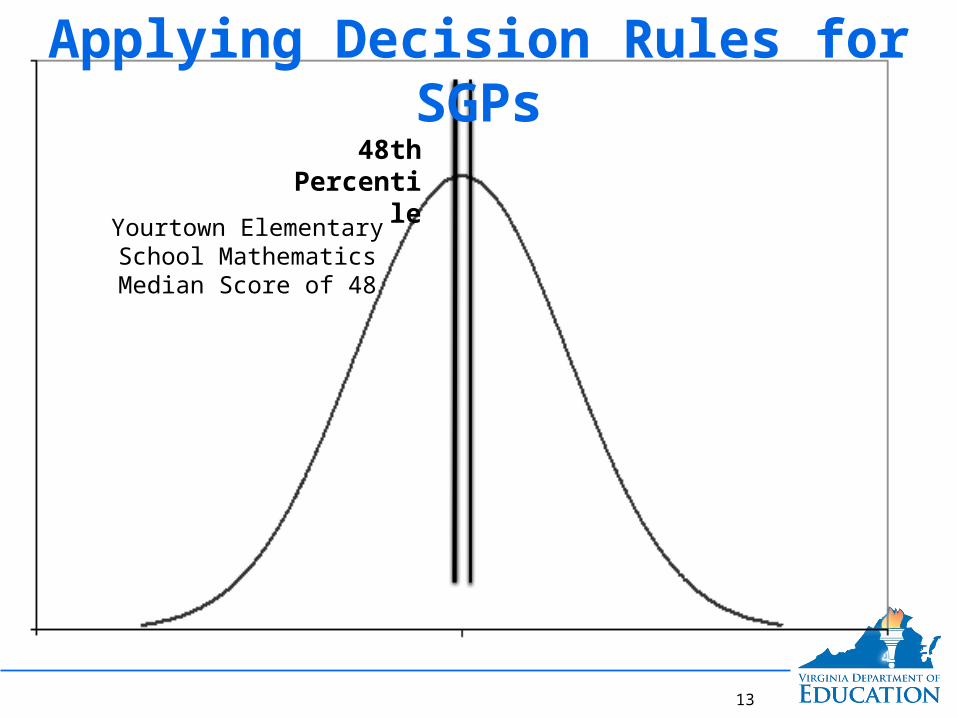
48th Percentile
Yourtown Elementary School Mathematics Median Score of
48
Applying Decision Rules for SGPs
13
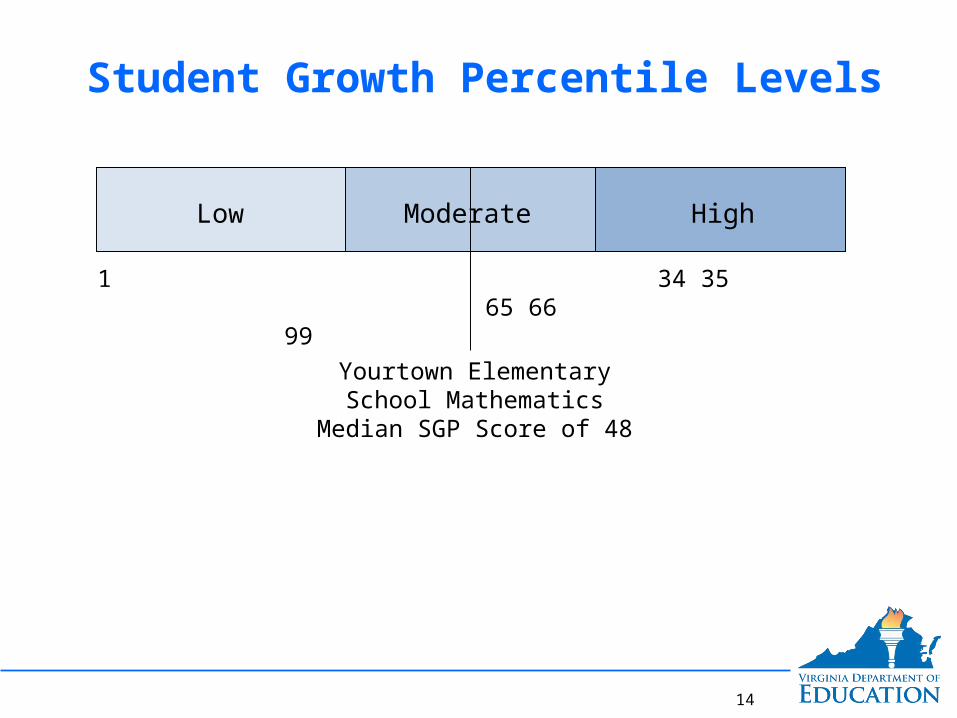
Student Growth Percentile Levels
Yourtown Elementary School Mathematics Median SGP Score
of 48
14
Moderate HighLow
1 34 35 65 66 99
Decision Rules for SGPs(This is a suggested rubric for school divisions to consider using or adjusting.)
Rating on Standard 7 –
Student Academic Progress
Exemplary Proficient Developing/ Needs
Improvement
Unacceptable
Median Score of SGP*
Median score in high growth range(≥ 66%tile)
Median score in upper portion of moderate-growth range(45–65%tile)
Median score in lower portion of moderate-growth range(35–44%tile)
Median score in low-growth range(≤ 34%tile)
* Recommend using median score when data are representative of the group being tabulated; recommend checking for distribution pattern of data before using median
score (e.g., bimodal)
The Yourtown Elementary School mathematics SGP median score is 48 percent. The rating for this data point would therefore be: _____________Proficient
Median Score
15
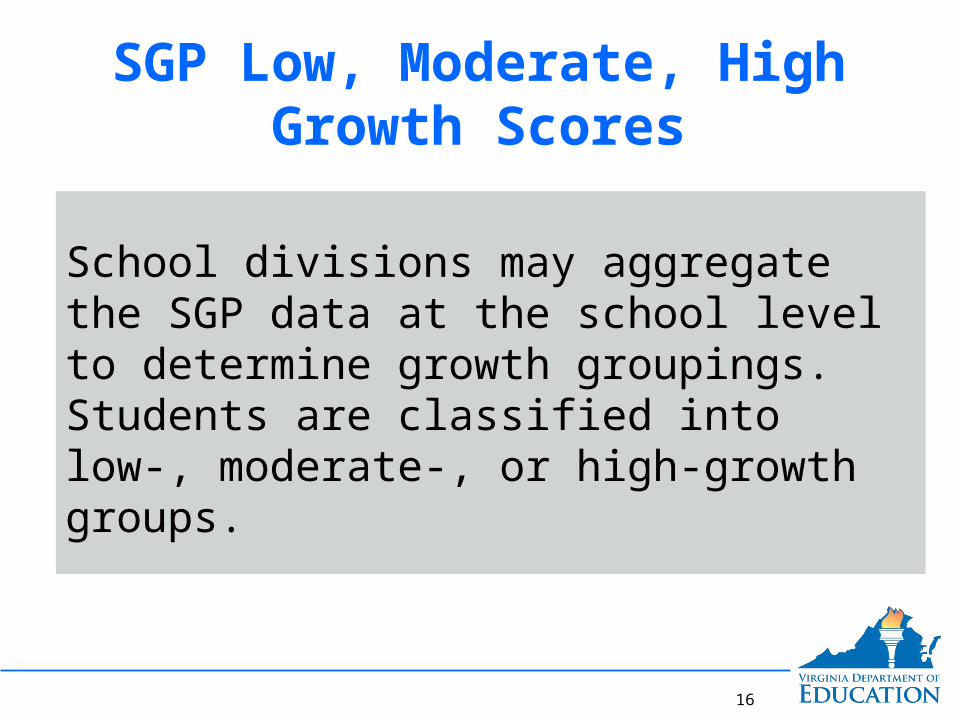
SGP Low, Moderate, High Growth Scores
School divisions may aggregate the SGP data at the school level to determine growth groupings. Students are classified into low-, moderate-, or high-growth groups.
16
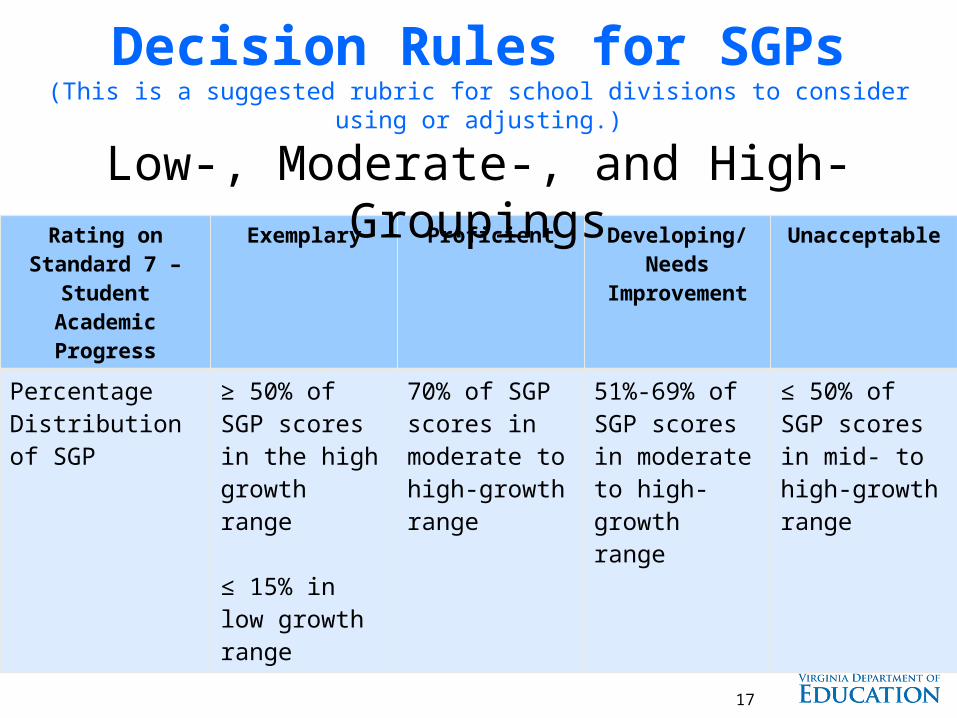
Decision Rules for SGPs(This is a suggested rubric for school divisions to consider using or adjusting.)
Rating on Standard 7 –
Student Academic Progress
Exemplary Proficient Developing/ Needs
Improvement
Unacceptable
Percentage Distribution of SGP
≥ 50% of SGP scores in the high growth range
≤ 15% in low growth range
70% of SGP scores in moderate to high-growth range
51%-69% of SGP scores in moderate to high-growth range
≤ 50% of SGP scores in mid- to high-growth range
Low-, Moderate-, and High-Groupings
17
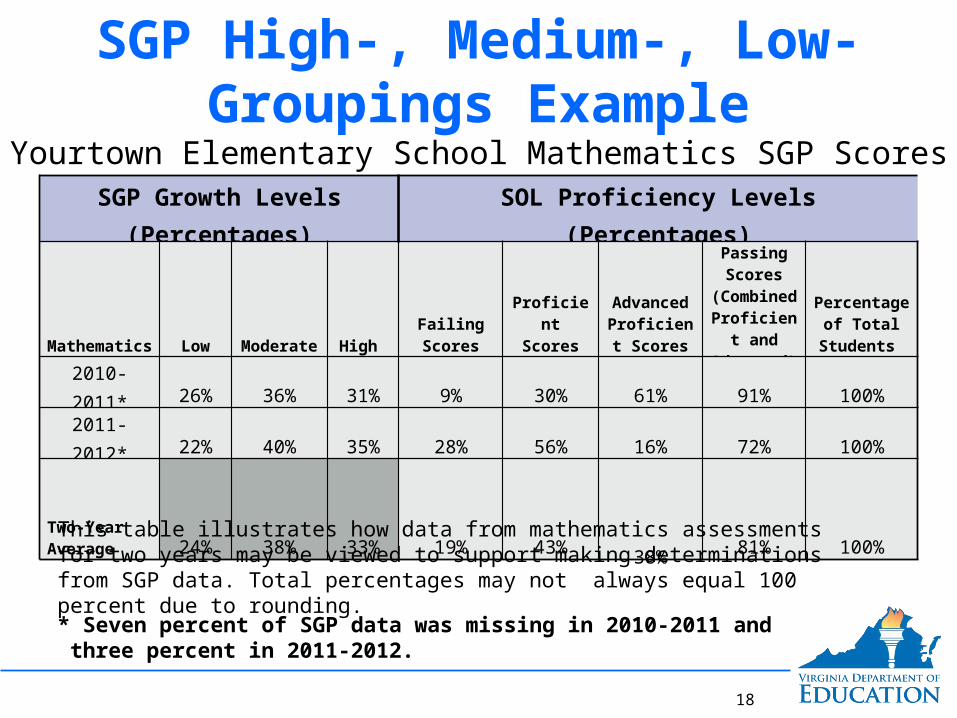
SGP High-, Medium-, Low-Groupings Example
SGP Growth Levels (Percentages) SOL Proficiency Levels (Percentages)
Mathematics Low Moderate High Failing Scores
Proficient Scores
Advanced Proficient
Scores
Passing Scores
(Combined Proficient
and Advanced)
Percentage of Total
Students
2010-2011* 26% 36% 31% 9% 30% 61% 91% 100%2011-2012* 22% 40% 35% 28% 56% 16% 72% 100%
Two-Year Average 24% 38% 33% 19% 43% 38% 81% 100%
This table illustrates how data from mathematics assessments for two years may be viewed to support making determinations from SGP data. Total percentages may not always equal 100 percent due to rounding.
Yourtown Elementary School Mathematics SGP Scores
18
* Seven percent of SGP data was missing in 2010-2011 and three percent in 2011-2012.
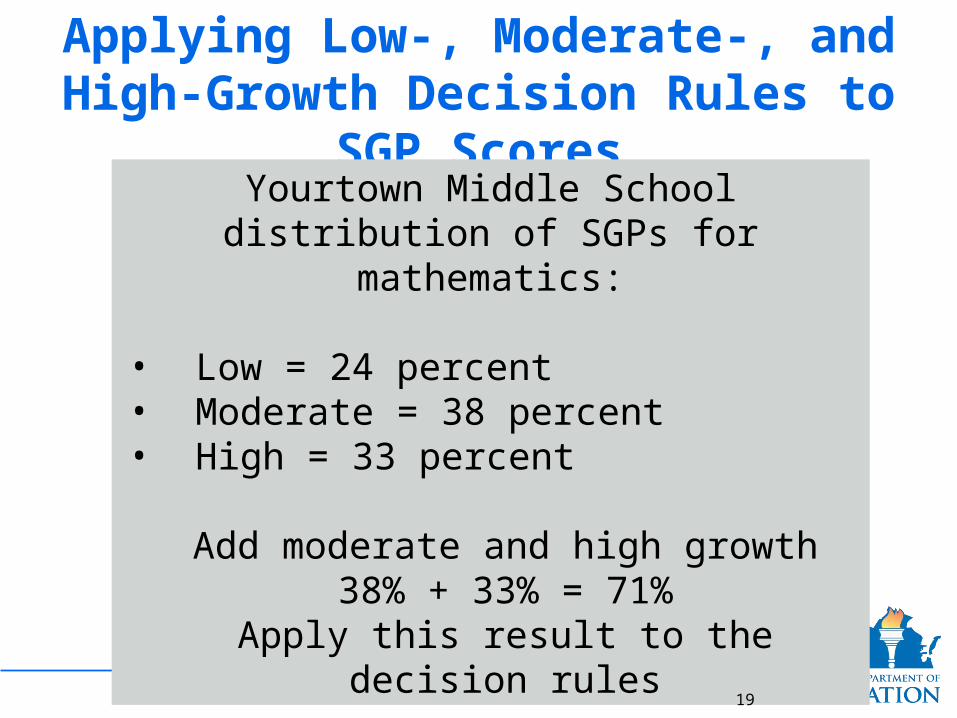
Applying Low-, Moderate-, and High-Growth Decision Rules to SGP Scores
Yourtown Middle School distribution of SGPs for mathematics:
• Low = 24 percent • Moderate = 38 percent • High = 33 percent
Add moderate and high growth38% + 33% = 71%
Apply this result to the decision rules
19
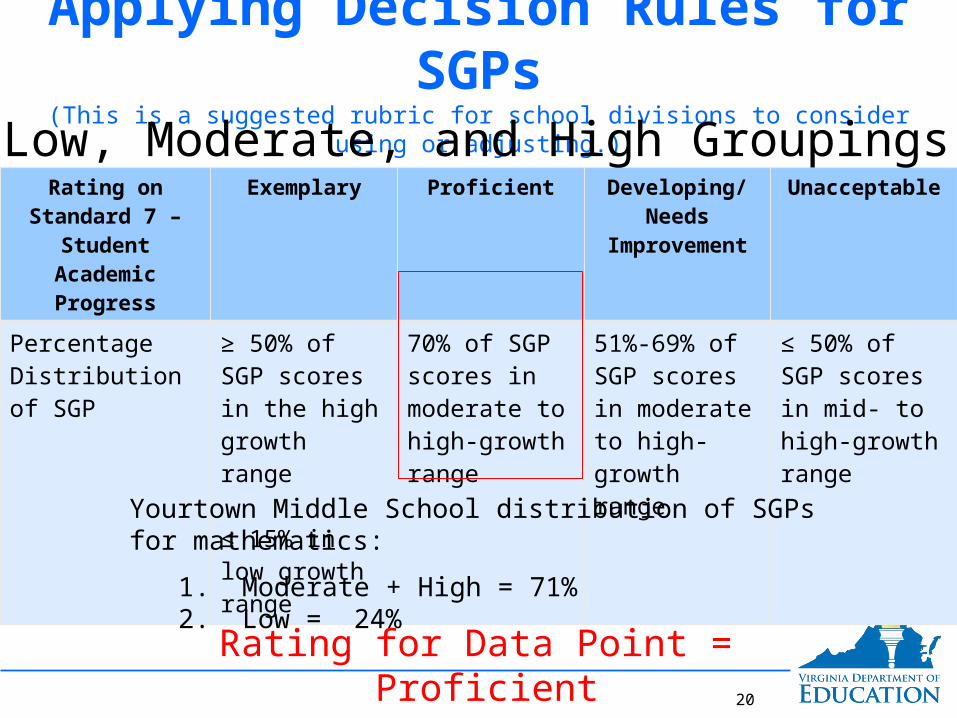
Applying Decision Rules for SGPs(This is a suggested rubric for school divisions to consider using or adjusting.)
Rating on Standard 7 –
Student Academic Progress
Exemplary Proficient Developing/ Needs
Improvement
Unacceptable
Percentage Distribution of SGP
≥ 50% of SGP scores in the high growth range
≤ 15% in low growth range
70% of SGP scores in moderate to high-growth range
51%-69% of SGP scores in moderate to high-growth range
≤ 50% of SGP scores in mid- to high-growth range
Yourtown Middle School distribution of SGPs for mathematics:
1. Moderate + High = 71%2. Low = 24%
Rating for Data Point = Proficient
Low, Moderate, and High Groupings
20
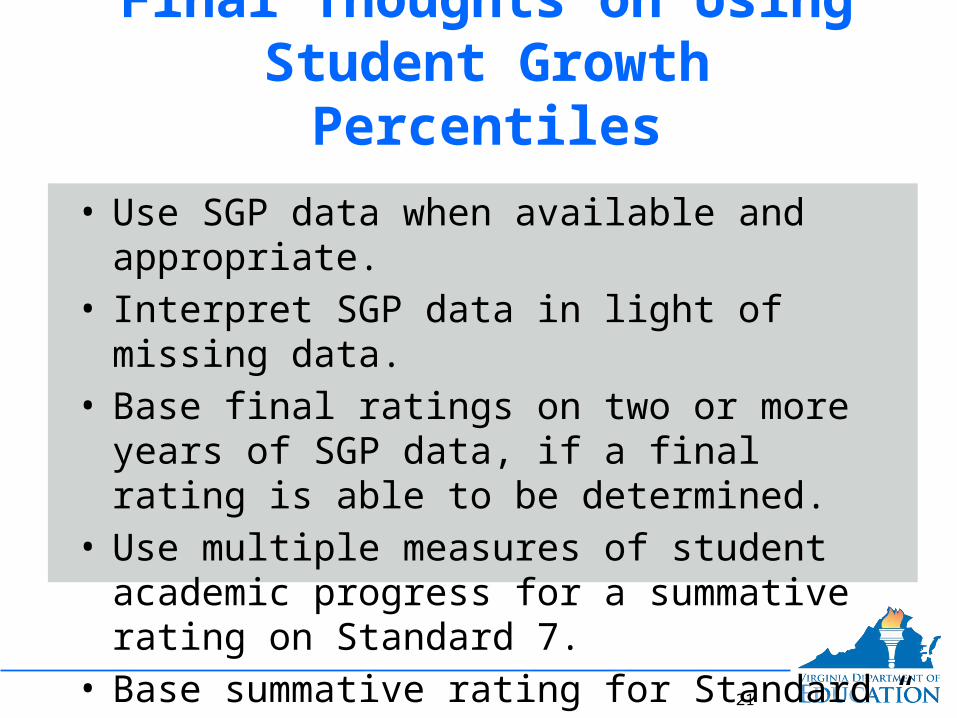
Final Thoughts on Using Student Growth Percentiles
• Use SGP data when available and appropriate.• Interpret SGP data in light of missing data.• Base final ratings on two or more years of SGP
data, if a final rating is able to be determined.• Use multiple measures of student academic
progress for a summative rating on Standard 7.• Base summative rating for Standard 7 upon
“preponderance of evidence.”
21
22
Questions?