confidentialising exploratory data analysis output in ... · confidentialising exploratory data...
TRANSCRIPT
Confidentialising Exploratory Data Analysis Outputin Remote Analysis
Christine M. O’Keefe1
This article is concerned with the problem of balancing the competing objectives of allowingstatistical analysis of confidential data while maintaining privacy and confidentiality.Traditional approaches to reducing the risk of disclosure typically involve modifying orconfidentialising data before releasing it to users. In contrast, remote analysis enables analyststo submit statistical queries and receive output without direct access to data.
In this article we discuss the implementation of remote analysis allowing exploratory dataanalysis on confidential data, where the system outputs are modified to protect confidentiality.To illustrate the effect of the modifications, we provide a comprehensive example comparingtraditional and confidentialised output for a range of common exploratory data analyses ondiscrete and continuous data.
We believe that confidentialised exploratory data analysis output is still useful, providedthe analyst understands the confidentialisation process and its potential impact. Where thepotential impact is judged to be too great, the analyst will need to seek another mode of accessto the data.
Key Words: Confidentiality; privacy; remote access; remote data access; output checking.
1. Introduction
This article addresses the challenge of balancing the competing objectives of allowing
statistical analysis of confidential or private data and maintaining standards of privacy and
confidentiality. Such standards can include those imposed by relevant privacy legislation
and regulation, as well as assurances provided by data custodians to data contributors.
This balance is often characterised as a trade-off between disclosure risk and data utility
(see Duncan et al. 2001). Disclosure risk attempts to capture the probability of a data
release resulting in a disclosure, while data utility attempts to capture some measure of the
usefulness of the released data.
A high-level discussion of the problem of achieving this balance typically covers two
broad approaches, which are often used in combination. The first approach is restricting
access, where access to data is granted under strong controls including researcher training
and registration, supervised secure data laboratories or secure remote access
environments, analysis output checking as well as legal and operational protections and
agreements. Many national statistical agencies allow researcher access to confidential data
in secure, on-site research data centres. Examples include the Australian Bureau of
q Statistics Sweden
1 CSIRO Mathematics, Informatics and Statistics, GPO Box 664, Canberra ACT 2601 Australia.Email: Christine.O’[email protected]: Thanks to Scott Furman for assistance with Figure 7(b).
Journal of Official Statistics, Vol. 28, No. 4, 2012, pp. 591–613
Statistics (ABS) On-site Data Laboratory (Australian Bureau of Statistics n.d.), the
United Kingdom Office For National Statistics (ONS) Virtual Microdata Laboratory
(Office for National Statistics n.d.) and the Census Bureau Research Data Centers (RDC)
(United States Census Bureau n.d.). An example of the remote access approach is the US
NORC Data Enclave, which provides a confidential, protected environment within which
authorised social science researchers can access sensitive microdata remotely (University
of Chicago n.d.). In the NORC Enclave, researchers do not have access to the internet and
cannot move files into or out of the secure environment without review approval. Any
export request from a researcher is scrutinised by a NORC statistician to ensure that it does
not contain disclosive data. If there are any disclosure concerns, the researcher is notified
and the output is not released. If no concerns exist, the output is cleared and uploaded to a
transfer site from where the researchers can download the output. Similar systems include
the UK Secure Data Service, which provides secure remote access to data operated by the
Economic and Social Data Service (UK Data Archive n.d.) and the Australian Bureau of
Statistics (ABS) Remote Access Data Laboratory (RADL) (Australian Bureau of Statistics
n.d). While these systems are very successful, manual output checking is highly context
dependent, requires specialised statistical skills and can be very time consuming.
In particular, it is normally not possible to define common rules for deciding in advance
whether an output can be released or not. In December 2009 the ABS noted that it was
experiencing high user demand for access to more detailed unit record data in a more
flexible way, across a wider array of datasets (such as business data and longitudinal linked
datasets; see Australian Bureau of Statistics 2009). In order to manage the risk of inability
to meet this demand, the ABS is pursuing a strategy of progressive replacement of RADL
with a new system, primarily for table generation and basic statistical analysis. It is
proposed that this new system will enable access to detailed de-identified microdata, and
will make use of automated output confidentialisation routines to ensure that system
outputs meet ABS legislative requirements. The system outputs will be able to be released
as public use outputs, that is, they will be able to be published and shared with others
without restrictions.
The second approach is restricting or altering data, where less than the full dataset is
released or the data are altered in some way before release to analysts, in order to provide
enhanced confidentiality protection. First, identifying attributes such as name and address
are usually removed, as well as other sensitive attributes or observations. Often, this is
followed by the application of statistical disclosure control methods such as aggregation
of geographic classifications, rounding, swapping or deleting values, and adding random
noise to data. The application of statistical disclosure control techniques also requires
specialised statistical skills and is highly context dependent, and it can be extremely
difficult to quantify the level of protection achieved. Unfortunately, statistical disclosure
control methods can also result in information loss and/or biased estimation. For more
information on statistical disclosure control methods, see, for example Adam and
Wortmann 1989; Domingo-Ferrer and Magkos 2010; Domingo-Ferrer and Saygin 2008;
Domingo-Ferrer and Torra 2004; Doyle et al. 2001; Office of Information and Regulatory
Affairs 1994; Willenborg and de Waal 2001). Motivated by the drawbacks associated with
statistical disclosure control, Rubin (1993) suggested the alternative of generating and
releasing synthetic data (see also Little 1993; Reiter 2005). In this approach, the data
Journal of Official Statistics592
custodian fits a model to the original data, then repeatedly draws from the model to
generate multiple synthetic datasets which are released for analysis. The recently-
developed differential privacy approach seeks to formalise the notion of confidentiality in
the context of the output of algorithms performed on confidential databases, which
includes statistical analysis (see Dwork et al. 2006; Dwork and Smith 2009). The most
common method for achieving differential privacy is to add Laplace-distributed noise to
the algorithm output, which unfortunately often results in inaccurate or misleading
analysis results. The alternative approach of remote analysis has also been proposed (see
for example Gomatam et al. 2005; Reiter 2003 and Sparks et al. 2008), and is the approach
under active investigation by the ABS. A remote analysis system accepts a query from an
analyst, runs it on data held in a secure environment, then returns confidentialised results
to the analyst.
From the above discussion it should be clear that there are a number of different
approaches to achieving a balance between allowing statistical analysis of confidential or
private data and maintaining standards of privacy and confidentiality. Each approach has
its own strengths and weaknesses, which means that there is no common approach suitable
for every situation. It is important in any given situation to select the method which is most
suitable for the given dataset, custodian, researcher, research project and regulatory
environment. In this article we are interested in the remote analysis approach, which is
being considered by at least one national statistical agency as a suitable replacement for
remote access with manual output checking. It is our purpose to give an example of the
sort of impact that confidentialisation of remote analysis outputs may have on exploratory
data analysis, in order to better inform future research and choices about which
confidentialisation approach to use in a given situation.
1.1. Remote Analysis
A remote analysis system accepts a query from an analyst, runs it on data held in a secure
environment, then returns results to the analyst. In particular, the analyst does not have
direct access to the data at all. In designing a remote analysis system to deliver useful
results with acceptably low disclosure risk, restrictions can be imposed on the queries, the
analysis itself can be modified and the results can be modified. In addition, the data can be
restricted or altered, though this measure would seem to reduce the benefits of remote
analysis over statistical disclosure control. A remote analysis system could be fully
automated, or could involve some manual checking of queries or outputs. In the fully
automated remote analysis system investigated in this article, we assume that the data are
not restricted or altered, and we only suggest restricting the queries, modifying the analyses
and modifying the results. We will call the modified results confidentialised output.
For reviews of remote analysis systems in use or in development in national statistical
agencies, see (Brandt and Zwick 2010; Lucero and Zayatz 2010; Reuter and Museux 2010).
1.2. Scenarios in Which Remote Analysis May be Useful
It is unlikely in the foreseeable future that remote analysis systems will completely replace
other data access modes such as the release of de-identified data or data which has
undergone a statistical disclosure control process, or indeed remote access with manual
O’Keefe: Confidentialising Exploratory Data Analysis Output 593
output checking. This is largely because remote servers significantly reduce flexibility in
analysis. However, there are some scenarios in which a remote analysis system may
usefully augment these approaches, including:
. A remote analysis system could be used by an analyst as preparation before visiting a
secure data laboratory. This would enable the analyst to learn about the data and
formulate some initial analysis approaches with low disclosure risk. The analyst
would then be able to make efficient, effective and informed use of a later session in a
secure data laboratory. This is important because of the cost of secure data laboratory
access to both the analyst and the administrative organisation.
. Access to confidential data through a remote analysis system may be viewed as “low
risk” and so may require only a lightweight ethics approval process. This would
enable an analyst to have an initial exploration of the data and perhaps find out
whether a full ethics application for access to the data itself would be worthwhile.
. A remote analysis system could be used by an analyst to conduct preliminary
investigations and obtain preliminary results, such as assessment of number of cases
and statistical power through exploratory data analysis. Funding applications can be
more favourably considered if these preliminary results have been obtained.
1.3. Related Work
Early proposals for remote analysis systems combined query restriction with statistical
disclosure control on the source data (Duncan and Mukherjee 1991; Duncan and Pearson
1991; Keller-McNulty and Unger 1998; Schouten and Cigrang 2003). Later, the problem
was considered in the special case of table servers designed to disseminate allowable
marginal subtables of large, high-dimensional contingency tables (Dandekar 2004;
Karr et al. 2003; Karr et al. 2002). An early discussion of remote analysis appeared in
Reiter 2004.
A number of authors have addressed the problem of checking the output from an on-site
data laboratory within a national statistical agency (see Corscadden et al. 2006; Honinger
et al. 2010; Reznek 2003, 2006; Reznek and Riggs 2004, 2005; Ritchie 2006, 2007; and
the summary guidelines in Brandt et al. 2010). In this approach, analysis outputs are
classified as either safe or unsafe. Safe outputs are those which the researcher should
expect to have cleared for release with no or minimal further changes, for example, the
coefficients estimated from a survival analysis. Analytical outputs and estimated
coefficients are usually classified as safe, except for a well-defined and limited number of
exceptions. Unsafe outputs will not be cleared unless the researcher can demonstrate, to
the output checker’s satisfaction, that the particular context and content of the output
makes it nondisclosive. For example, a table will not be released unless it can be
demonstrated that there are enough observations, or the data have been transformed
enough, so that the publication of that table would not lead to identification of outputs.
In this article we will compare our approach with the guidelines for the checking of
output based on microdata research published in Brandt et al. (2010), as they represent the
most recent and comprehensive treatment available. The paper also addresses the
applicability of the guidelines to automatic disclosure control for remote data centres,
and remote execution. The paper is an output of ESSnet SDC, a Network of Excellence in
Journal of Official Statistics594

the European Statistical System in the field of Statistical Disclosure Control (European
Union n.d.).
The differential privacy approach seeks to formalise the notion of privacy in the context
of algorithms performed on confidential information, which includes statistical analysis
(see Dwork et al. 2006; Dwork and Smith 2009). An algorithm is differentially private
essentially if its application to any two datasets that differ in a single element gives similar
answers. Under the most common method for generating differentially private algorithms,
Laplace-distributed noise is added to the algorithm output, which unfortunately often
results in low data utility. Several improvements have been proposed in the literature (see
for example Barak et al. 2007; Dwork and Lei 2009; Dwork et al. 2006 for results relevant
to exploratory data analysis), however the problem of appropriately balancing disclosure
risk and data utility in differentially private algorithms is not completely solved.
In the case of remote analysis for model fitting, most effort to date has been directed at
linear regression. Gomatam et al. (2005) suggested ways to mitigate the effects of attacks
for linear regression on a remote analysis system using transformations of variables
(see Bleninger et al. 2010 for an empirical investigation).The authors also described
disclosure risks associated with multiple, interacting queries to remote analysis systems,
primarily in the context of remote regression analysis, and proposed quantifiable measures
of risk and data utility. The challenge of confidentialising regression diagnostics has been
addressed by Reiter (2003), Reiter and Kohnen (2005) and Sparks et al. (2008); see
O’Keefe and Good (2009) for a detailed discussion and empirical investigation.
Algorithms for obtaining differentially private regression coefficients are provided in
Chaudhuri and Monteleoni 2008 and Smith 2009.
More generally, Sparks et al. (2008) proposed a range of measures for addressing
disclosure risks in exploratory data analysis and model fitting for discrete or continuous
response variables, and provided examples from biostatistics. O’Keefe et al. (2012)
explored disclosure risks associated with survival analysis, and proposed measures to
reduce the disclosure risk. The Privacy-Preserving Analytics (PPA) software
demonstrator, described in Sparks et al. (2008), is an implementation of these measures
for exploratory data analysis, statistical modelling including Generalised Linear
Modelling, survival analysis, time series and clustering. Some of the measures involve
the modification or restriction of standard statistical analyses submitted through a menu-
driven interface, whereas others involve modifications to the output of fitted models.
In particular, they do not involve applying any traditional statistical disclosure techniques
to the underlying microdata (except in the case of using a random 95% sample of the
microdata in some analyses).
The particular case of confidentialising exploratory data analysis output in remote
analysis systems was discussed in Sparks et al. (2005) and later expanded in Sparks et al.
(2008). The generality of the treatment in Sparks et al. (2008) makes it very difficult to see
the range of disclosure risk reduction measures proposed for particular types of analysis.
To address this gap, O’Keefe and Good (2008) and O’Keefe and Good (2009) provided a
detailed discussion of the explicit confidentialisation measures in the case of linear
regression, including a side-by-side comparison of the proposed confidentialised residual
plots (using parallel boxplots) with plots of synthetic residuals. The current paper
addresses the important case of exploratory data analysis in a similar way.
O’Keefe: Confidentialising Exploratory Data Analysis Output 595
Apart from the problem of balancing disclosure risk with data utility, remote analysis
systems present additional technical challenges in addressing, for example, missing data,
outliers, selection bias testing, assumption checking and additional disclosure risks due to
multiple, interacting queries.
1.4. Contents of This Article
As mentioned above, Sparks et al. (2008) have proposed methods by which the outputs
from a range of individual statistical queries can be modified to reduce disclosure risk.
Exploratory data analysis is an important special case, since it would be normal for an
analyst approaching statistical analysis of any dataset to commence with exploratory data
analysis. However, it is not easy to determine the applicable disclosure risk reduction
methods proposed in Sparks et al. (2008), nor to understand their impact.
To address this gap, in this paper we provide a detailed and systematic study of the
confidentialisation of exploratory data analysis output, such as could be implemented on a
remote analysis system. We provide an analysis of relevant disclosure risks, and describe
methods for addressing these risks. We also provide detailed examples which enable
a side-by-side comparison of traditional with confidentialised exploratory data analysis
output. We compare our approach with the guidelines for the checking of output based on
microdata research developed by Brandt et al. (2010).
2. Exploratory Data Analysis in Remote Analysis
In this section we give a brief overview of exploratory data analysis, including some
terminology, and describe the types of exploratory data analysis which will be the focus of
this article.
We also discuss the main disclosure risks and associated confidentiality objectives for
exploratory data analysis output from a remote analysis system.
2.1. Exploratory Data Analysis
Exploratory data analysis is concerned with developing an understanding of data,
including exploring the nature of the distributions of the variables involved, and the
relationships between the variables, (For more information on exploratory data analysis,
see McNeil 1977; Mosteller and Tukey 1977; Tukey 1977; Velleman and Hoaglin
1981).
Velleman and Hoaglin (1981) outline four basic elements of exploratory data analysis,
namely, data visualisation, residual analysis after model fitting, data transformation or re-
expression and resistant procedures. For confidentialising residuals after model fitting and
data transformation or re-expression, see the references in Section 1.3. In Sparks et al.
(2008, Section 1.3) it is recommended that robust statistical methods be used when
confidentialising output from a remote analysis system, and we will not directly address
robust procedures further here.
The focus of this article will therefore be on exploratory data analysis through data
visualisation. Methods for data visualisation commonly include:
Journal of Official Statistics596

Univariate Exploratory Data Analysis
1. Discrete variable
(a) Frequency table
(b) Bar chart or pie chart
2. Continuous variable
(a) Summary statistics such as: number of observations, number of missing
values, mean, median, sample minimum, sample maximum, quantiles such as
quartiles, and standard deviation
(b) Plot, dot chart, histogram or density estimate
(c) Box plot
3. Discrete or continuous variable
(a) Q-Q plots and P-P plots
(b) Corresponding correlation coefficients
Bivariate and Multivariate Exploratory Data Analysis
4. Tabulation of frequencies for two or more discrete variables
5. Scatter plot of two continuous variables or scatter plot matrix for more than two
continuous variables
6. Principal components analysis for two or more continuous variables
7. Parallel box plots or dot charts for a discrete and a continuous variable
8. Correlation coefficient for two variables or correlation matrix for more than two
variables
In practice the analyst will choose which method(s) to use depending on their task at hand.
2.2. Confidentialising Exploratory Data Analysis in Remote Analysis
The key means by which identification of an individual might occur through an
information release are direct identification, spontaneous recognition and matching to an
external dataset. Direct identification occurs when an identifier such as name and address
is read directly from a dataset. Spontaneous recognition occurs when an analyst recognises
a data subject from an unusual combination of characteristics, such as being 105 years old
and living in a certain suburb. Matching to an external dataset uses one or more variables
common to both datasets as a matching key. If a match is found to an external dataset
containing identifying information, then direct identification occurs. Otherwise, a match
may be found to an external dataset with sufficient characteristics that spontaneous
recognition occurs.
As in Sparks et al. (2008), the risk of direct identification can be minimised by ensuring
that the results do not contain any directly identifying information. It is important to
determine which variables are identifying, but examples include name, address and unique
identifiers like government health care number. The risk of spontaneous recognition is
minimised if the exact values of the variables are not disclosed for any individual. It may
be important to know which variables carry the highest risk of spontaneous recognition to
identify those which must be most strongly protected. The risk of matching is minimised if
the exact values of the variables are not disclosed for any individual. Again, it may be
important to know which variables are most useful as matching key variables to identify
O’Keefe: Confidentialising Exploratory Data Analysis Output 597
those that must be most strongly protected. For example, exact dates such as date of
admission are extremely useful as matching keys. Thus, the results of a statistical analysis
are unlikely to lead to identification of an individual if they contain no identifying
information and if the exact values of variables corresponding to an individual (the unit
record) are not disclosed. On the other hand, it is not always problematic to release a data
value; for example if it is impossible to assign the data value to an individual data subject.
In this article we have chosen to take the most conservative position of seeking to release
no exact value of any variable corresponding to an individual, for two reasons. One is that
we are envisaging an automated system which may have difficulty distinguishing risky
from non-risky releases. The other is that we are interested in whether output could be
useful even given this conservative position.
In the following, we consider only disclosure risk from a single exploratory data analysis
request, though this might include a number of different analyses. In order to reduce risks
associated with multiple, interacting queries, it would be necessary to implement a request
tracking system which would identify and alert the system administrator to suspicious
queries or query streams. While a full discussion of the identification of suspicious queries
or query streams is beyond the scope of this article, examples might include a vast number
of similar queries within a very short time frame, or queries for subsets that differ in only
one individual data subject.
One of the main ways that disclosures of information about discrete variables can occur
is through the existence of small numbers of data cases with a given combination of values
(this is the problem of so-called small cells in tabular data). In addition, if a cell has a
dominant observation (contributing more than 90% of the cell value, for example) or if it
contains most (more than, say, 90%) of the observations in one of its variables, then
disclosure risk can be unacceptable. Therefore many of the measures taken to
confidentialise the output of exploratory data analysis simply ensure that each combination
of variable values has sufficient data cases represented, through data winsorising or
aggregation, and by rounding or smoothing of the results. (Under data winsorising, any
observation which is more than 2.6 standard deviations above or below the mean is set to
the mean plus or minus 2.6 standard deviations, respectively.)
The risk that the exact value of a variable is released in exploratory data analysis output
is reduced by the following measures suggested in Sparks et al. (2008):
. Replace each table with a correspondence analysis plot
. Replace each scatter plot with confidentialised parallel box plots, where the
procedure for constructing confidentialised parallel box plots is as follows:
1. Determine which variable will be on the x-axis and which will be on the y-axis
2. Determine the number of box plots to be constructed, by specifying intervals of
the x-axis variable so that each interval has frequency at least at a minimum
threshold value
3. If the difference between the median and either the lower or upper quartile on a
box plot is zero, amalgamate that interval with an adjacent interval and repeat
until all box plots have distinct median, lower and upper quartiles
4. For each interval, draw a confidentialised box plot as follows
(a) Winsorise the data
Journal of Official Statistics598

(b) Compute the new five summary statistics (minimum, lower quartile,
median, upper quartile and maximum)
(c) If the difference between the median and the lower or upper quartile is
zero, then:
(i) If the discrete variable is nominal (that is, categorical in which the
categories have no natural order) then there is no natural way to
amalgamate box plots, so provide no output
(ii) If the discrete variable is ordinal (that is, categorical in which the
categories have a natural order) then merge adjacent box plots
until there is no remaining box plot with zero difference between
the median and the lower or upper quartile
(d) Round the resulting final values of the five summary statistics
(e) Draw the parallel box plots using these final rounded values.
. Replace each plot of the estimate of an underlying probability density function
(density estimate) with a confidentialised version, obtained by winsorising the data
and rounding the sample minimum and maximum
. Replace each Q-Q plot or P-P plot with a confidentialised version, obtained as
follows:
1. Winsorise the data
2. Fit a robust nonparametric regression line to the points (x, y) of the traditional
Q-Q (respectively P-P) plot on the winsorised data.
. Replace each trend line with a confidentialised trend line, obtained as follows:
1. Use Loess or Lowess (locally weighted scatter plot smoothing) to plot a smooth
curve through the set of data points in the scatter plot (see Cleveland 1979;
Cleveland and Devlin 1988)
2. Winsorise or add noise to the end points of the curve to ensure that they do not
reveal exact data values
. Round or otherwise perturb values of statistics such as medians, upper and lower
quartiles, maxima and minima, as well as Pearson x 2 statistics and Pearson product-
moment correlation coefficients, since these are functions of the data values
In replacing a scatter plot with confidentialised parallel box plots, it is desirable that box
plots of constant width be used to represent x variable intervals of the same length. For
example, several different divisions into equal-width intervals could be tried until a division
is found with each frequency at least at the minimum threshold value. However, it may
occur that no such reasonable division can be found, and it is necessary to combine adjacent
box plots to meet the frequency threshold. In this case, using a box plot of double width may
be visually misleading as it tends to suggest double the mass of observations on that interval.
An alternative is to delete one of the two combined box plots, as is in fact done in Figure 7(b).
The suggested treatment of outliers with winsorisation has serious drawbacks. Analysts
are not permitted to view outliers (since these present confidentiality risks) and so cannot
make their own removal or treatment decisions. Instead, the remote analysis system
removes outliers in the presented results, and alerts the analyst to the fact that removal has
occurred. If these disadvantages are judged too serious in a given situation, the analyst
may have to seek access to the unconfidentialised dataset through a different access mode.
O’Keefe: Confidentialising Exploratory Data Analysis Output 599

3. Example of Remote Exploratory Data Analysis Output
In this section we provide a comprehensive example demonstrating the impact of
implementing remote analysis system output confidentialisation measures, including those
described in Section 2.2.
Figure 1 shows an example query input screen for all the exploratory data analyses
conducted. After selecting the dataset from the drop down Dataset: menu, the analyst
manually selects the Discrete Variables. (This should be unnecessary in a production
system which would automate this step.) The analyst selects the desired exploratory data
analyses and clicks the Analyse box. This menu-driven interface restricts the analyst to
standard exploratory data analyses. Also, transformations or re-expressions of variables
can reveal information about outliers, so these are not permitted. This restriction could
potentially be relaxed in a production system after further disclosure risk evaluation.
In Sections 3.1 and 3.2 we provide comprehensive and representative examples of
traditional and confldentialised exploratory data analysis outputs, on a publicly available
dataset. In comparing the outputs, it is important to note differences in the scales because
the removal of dataset outliers in the confidentialised output may cause a compression of
the plot scale in comparison with the traditional output. We do not uncompress the scale,
since the point of the example is to evaluate the information that can be deduced from the
confidentialised output. The unconfidentialised output is provided to assist this evaluation.
If we manipulate the confidentialised output, then it no longer represents the output
Fig. 1. Screen shot of query input interface for Exploratory Data Analysis
Journal of Official Statistics600

available to the analyst. We cross-reference the guidelines for the checking of output based
on microdata research developed by Brandt et al. (2010).
While it would be ideal to use an example dataset from a national statistical agency, the
confidentiality concerns which are the subject of this paper prevent it. Instead, we use a
publicly available dataset with mostly categorical variables and some continuous
variables, which is similar in this respect to many datasets housed in national statistical
agencies. For the examples, we will use an extract of data from a study to test the safety
and efficacy of estrogen plus progestin therapy to prevent recurrent coronary heart disease
in postmenopausal women. The Heart and Estrogen/Progestin Replacement Study
(HERS) data (Grady et al. 1998) contain information on the characteristics of 2763
participants in the HERS study. For our example, we will use the continuous variables: age
in years (age), body mass index (bmi) and systolic blood pressure (sbp), and the discrete
variables: ethnicity (raceth), years of education (educyrs), diabetes comorbidity (diabetes),
insulin used (insulin), previous coronary artery bypass graft surgery (pcabg), at least one
drink per day (drinkany) and attendance at exercise program or walking (exercise).
The data are used for illustrative purposes only.
For the examples, the traditional output was generated within the R environment
(R Development Core Team 2012), while most of the confidentialised output was
generated with the PPA software demonstrator (see Sparks et al. 2008), however some of
the confidentialised output was generated directly within the R environment.
3.1. Univariate Exploratory Data Analysis
3.1.1. Univariate Discrete Variable
Exploratory data analysis output for a discrete variable would normally comprise a
frequency table and bar chart. Confidentialising these outputs involves suppression or
aggregation of categories to ensure that no category has less than a minimum threshold
number of values (which could be set by the custodian) and no category contains more
than, say, 90% of the observations. In this case, there are no small cells, so confidentialised
output coincides with traditional output. An example of this type of output for the discrete
variable ethnicity (raceth) in the HERS data is provided in Figure 2.
In this case there is no difference between traditional and confidentialised output.
However, in general output may be suppressed or categories may be amalgamated in the
confidentialised case.
For comparison, Brandt et al. (2010) also classify frequency tables as unsafe due to
potential issues with small cells and cells which contain more than 90% of the total
number of observations in one of its variables. If a frequency table is classified as unsafe,
then it would either be suppressed or a tabular statistical disclosure limitation procedure
would be applied; see Section 1 for references.
3.1.2. Univariate Continuous Variable
The mean and standard deviation would meet the disclosure risk objectives in Section 2.2
provided that there are sufficiently many observations contributing to their calculation.
The minimum and maximum reveal data values and cannot be released. Similarly, the
O’Keefe: Confidentialising Exploratory Data Analysis Output 601

median and lower and upper quartiles may reveal data values (depending on, for example,
the parity of the number of observations), and are (conservatively) not released. Disclosure
risk is reduced for these quantities through dataset winsorising and/or rounding of the
values. A histogram would meet the disclosure risk objectives in Section 2.2 provided that
there are no low interval frequencies. A density estimate may give information about
outliers and minimum and maximum value in the dataset, and is confidentialised with the
method described in Section 2.2. A plot, a dot chart and a box plot reveal observed data
values, and so would not be permitted in confidentialised output of exploratory data
analysis in a remote analysis system. Each of them can be replaced by a confidentialised
box plot, constructed with the method described in Section 2.2.
In Figure 3 we show examples of traditional and confidentialised output of exploratory
data analysis for the continuous variable age in years (age) in the HERS data. Traditional
output in the form of a histogram and a box plot is shown in Figures 3(a) and 3(c)
respectively, while confidentialised output in the form of a confidentialised density
estimate and a confidentialised box plot is shown in Figures 3(b) and 3(d) respectively. The
traditional histogram has one interval with a very small number of values which would be
suppressed in confidentialised output. The text on Figure 3(b) and the ‘***’ symbol in
Figure 3(d) alert the analyst to the fact that the data in these cases have been winsorised.
The main difference between the traditional and confidentialised output is due to the
data winsorising. Given only the confidentialised output in Figures 3(b) and 3(d),
the analyst would only know that outliers had been removed. The analyst would not know
the number of outliers removed, and would not know whether they were outliers with low
or high age, or both. Despite this difference, the confidentialised density estimate in
Figure 3(b) and the confidentialised box plot in Figure 3(d) both provide good general
information about the shape of the variable distribution.
For comparison, Brandt et al. (2010) also classify mean, maximum, minimum and
percentiles as unsafe due to concerns regarding small cells, dominant observations and
cells which contain more than 90% of the total number of observations in one of its
variables. Mode and standard deviation are classified as safe if there is no cell which
contains more than 90% of the total number of observations in one of its variables. Graphs
are generally classified as unsafe unless the underlying modified information used to
AfricanAmerican
Latina, Asian,other
White0
500
1000
1500
2000
Ethnicity Frequency
African American 218
Latina, Asian, other 94
White 2451
Total 2763
(a) Frequency table for ethnicity Bar Chart for ethnicity(b)
Fig. 2. Traditional/confidentialised exploratory data analysis output for the discrete variable ethnicity (raceth)
in the HERS data
Journal of Official Statistics602

construct the graph has been classified as safe. For example, a safe graph would have no
significant outliers and would not reveal any individual observation value.
3.1.3. Univariate Discrete or Continuous Variable
The confidentialisation of Q-Q plots and P-P plots is discussed in Section 2.2. The Pearson
x 2 statistic corresponding to a P-P plot meets the disclosure risk objectives in Section 2.2.
Figure 4 provides examples of traditional and confidentialised Q-Q plots (in Figures 4(a)
and 4(b) respectively) and traditional and confidentialised P-P plots (in Figures 4(c) and
4(d) respectively). The Q-Q plots provide a comparison of the continuous variable age in
years (age) sample data with the normal distribution. The P-P plots provide a comparison of
the discrete variable years of education (educyrs) sample data with the Poisson distribution.
The rounded value of the Pearson x 2 statistic for comparing the discrete variable years
of education (educyrs) sample data with the Poisson distribution is 0.988, rounded from
the true value of 0.9877984.
The confidentialised Q-Q plot in Figure 4(b) clearly shows the issues at the tails of the
distribution apparent in the traditional Q-Q plot in Figure 4(a). The confidentialised and
traditional P-P plots in Figures 4(c) and 4(d) are also of very similar shape to one another.
Age
Freq
uen
cy
40 50 60 70 80
0
200
400
600
(a) Traditional Histogram for age Confidentialised Density Estimate for age
Traditional Box Plot for age Confidentialised Box Plot for age
(b)
(c) (d)
0.05
0.04
0.03
0.02
Est
imat
ed p
df
0.01
0.00
50 60
Age
70 80
45
50
55
60
65
70
75
80
50
55
60
65
70
75
80 ***
Fig. 3. Traditional and confidentialised exploratory data analysis output for the continuous variable age in
years (age) in the HERS data
O’Keefe: Confidentialising Exploratory Data Analysis Output 603

Although the confidentialised plots indicate that outliers have been deleted, in this case the
confidentialisation procedure has not adversely affected the information provided in the
plots. However, an analyst would need to be aware that in general the deletion of outliers
in the plots may degrade the information presented at the tails of the plots.
For comparison, Brandt et al. (2010) classify plots as unsafe unless the underlying
modified information used to construct the graph has been classified as safe. Test statistics
such as x 2 are classified as safe provided the model has at least ten degrees of freedom and
at least ten units to produce the model.
3.2. Bivariate and Multivariate Exploratory Data Analysis
3.2.1. Two or More Discrete Variables
It has been long recognised that contingency tables in which there are cells with small
counts or dominant observations represent a disclosure risk, since the existence of such
cells increases the risk that individuals can be identified. There are many techniques
proposed in the literature for confidentialising such tables, including rounding and cell
suppression (see for example Domingo-Ferrer and Magkos 2010; Domingo-Ferrer and
Torra 2004; Doyle et al. 2001).
–3 –2 –1 0 1 2 3
45
50
55
60
65
70
75
80
(a) Traditional normal Q-Q Plot for age Confidentialised normal Q-Q Plot for age
Traditional Poisson P-P Plot for education Confidentialised Poisson P-P Plot for education
(b)
(c) (d)
Theoretical quantiles
Sam
ple
qu
anti
les
75
51
–2 0
Theoretical quantiles
Sam
ple
qu
anti
les
0.0 0.2 0.4 0.6 0.8 1.0
1.0
0.8
0.6
0.4
0.2
0.0
Cumulative probabilities for educyrs
Cu
mu
lati
ve p
ois
son
pro
bab
iliti
es
1
0
0 1
Cumulative probabilities for educyrs
Cu
mu
lati
ve p
rob
ailit
ies
for
dis
trib
uti
on
2
Fig. 4. Traditional and confidentialised exploratory data analysis output for the continuous variable age and
discrete variable years of education (educyrs) in the HERS data
Journal of Official Statistics604

Sparks et al. (2008, Section 2.2) propose that a correspondence analysis plot be provided
instead of a confidentialised table. The plot would display the variable names, but
individual data points would not appear on the plot. (The authors also suggest fitting a log-
linear model, but we do not discuss this option here.) Correspondence Analysis (Benzecri
1973; Greenacre 2007) is a multivariate method for transforming a number of possibly
correlated discrete variables into a number of uncorrelated variables (principal
components). A Correspondence Analysis plot of counts is a graphical representation of
the associations between the variables found during the correspondence analysis, see, for
example Figure 5(c). As discussed in Sparks et al. (2008, Appendix A), the marginal totals
of the matrix of counts together with the basic values can reveal information about
the actual counts if the correspondence analysis explains nearly all of the variation. For this
reason, the information is suppressed.
In Figure 5, we show examples of contingency tables and correspondence analysis plots
for subsets of discrete variables in the HERS data. For the purpose of the tables and plots,
the following further variable abbreviations are used: raceth ¼ R, educyrs ¼ Ed,
diabetes ¼ Di, insulin ¼ I, pcabg ¼ P, drinkany ¼ Dr and exercise ¼ Ex. The (partial)
–0.015 –0.010 –0.005 0.000 0.005
–0.005
0.000
0.005
0.010
R.AA
R.LAO
R.W
Di.N
Di.Y
P.N
P.Y
Dr.N
Dr.Y
Ex.N
Ex.Y
I.N
I.Y
0.05
0.00
–0.05
–0.10
–0.15
–0.20
–0.25
–0.2 –0.15 –0.10 –0.05 0.00 0.05 0.10
R.AA
R.LAO
R.W
Ed.1
Ed.2
Ed.3
Ed.4
Ed.5
Ed.6
Ed.7Ed.8
Ed.9Ed.10Ed.11Ed.12Ed.13Ed.14Ed.15Ed.16Ed.17Ed.18
Ed.19Ed.20
(a)
(b)
(c) (d)
Traditional partial contingency table of ethnicity (R) and years of education (Ed)
Traditional partial contingency table of ethnicity (R) and years of education (Ed)
Confidentialised correspondence analysisplot of all variables except years of education
Confidentialised correspondence analysisplot of years of education against ethnicity
Fig. 5. Traditional and confidentialised exploratory data analysis output for two or more discrete variables in
the HERS data
O’Keefe: Confidentialising Exploratory Data Analysis Output 605

contingency table in Figure 5(a) tabulates the values of the educyrs variable (Ed) against
raceth (R), for the values Diabetes ¼ No, pcabg ¼ No, Drinkany ¼ No, Exercise ¼ No
and Insulin ¼ No, while the (partial) contingency table in Figure 5(b) tabulates the values
of the educyrs variable (Ed) against raceth (R), for the values Diabetes Di ¼ Yes,
pcabg ¼ No, Drinkany ¼ No, Exercise ¼ Yes and Insulin ¼ Yes. The confidentialised
correspondence analysis plot in Figure 5(c) shows the relationship between all variables
except educyrs, while the correspondence analysis plot in Figure 5(d) shows the
relationship between the variables educyrs (Ed) and raceth (R), where the number of years
of education is indicated by a number and ethnicity codes are African American ¼ AA,
Latin, Asian or Other ¼ LAO and White ¼ W.
In a correspondence analysis plot, the distance between points indicates association,
with the strength of the relationship indicated by the distance from the origin (0,0). For
example, Figure 5(c) shows a strong relationship between insulin ¼ N and diabetes ¼ N,
as would be expected. Figure 5(d) shows strong relationships between most pairs of values
of educyrs and ethnicity, except, somewhat inexplicably, educyrs ¼ 2.
There is information lost in replacing the contingency tables as in Figures 5(a) and 5(b)
with correspondence analysis plots as in Figures 5(c) and 5(d). However, at least in this
case, the sheer number of contingency tables makes it quite difficult to gain an overall
view of the data. An analyst would be likely to try another exploratory data analysis
approach or even some simple modelling. On the other hand, the correspondence analysis
plots give overall trend information without underlying detailed information.
Brandt et al. (2010) classify frequency tables as as unsafe due to potential issues with
small cells and cells which contain more than 90% of the total number of observations in
one of their variables. If a frequency table is classified as unsafe, then it would either be
suppressed or a tabular statistical disclosure limitation procedure would be applied; see
Section 1 for references.
3.2.2. Two or More Continuous Variables
For several continuous variables, confidentialising a matrix of scatter plots would involve
replacing it with a matrix of confidentialised parallel box plots and a matrix of
confidentialised trend lines, as in Section 2.2. A principal components biplot can also be
provided (Gabriel 1971; Greenacre 2010).
Figure 6 shows traditional output comprising two-dimensional scatter plots in
Figure 6(a) and confidentialised output comprising parallel box plots in Figure 6(b) and
confidentialised trend lines in Figure 6(c). Recall that the procedures for drawing these
confidentialised plots are provided in Section 2.2.
The confidentialised output in Figure 6(b) shows similar information about the spread of
variable values as the traditional output in Figure 6(a), although the analyst does need to
take account of the fact that outliers have been removed.
It is perhaps surprising to note that the confidentialised output in Figures 6(b) and 6(c)
arguably provide more information about variable value trends and the trends of
relationships between variables, in comparison with the traditional output in Figure 6(a),
The applicability of this observation is not restricted to remote analysis, and in fact it may
be that analysts should construct un-confidentialised displays of parallel boxplots and
un-confidentialised trend line matrices as part of routine exploratory data analysis.
Journal of Official Statistics606

79
Age
Bmi
Sbp
Age
Bmi
Sbp
19.59
49.5
49.557.5
60.562.5
6465
66.568
6970
7172
7374.5
77.519.59 24.31 26.18
20Confidentialised Trend Line Matrix(c)
Confidentialised Box Plot Matrix(b)
Traditional Scatter Plot Matrix(a)
30 40 50
28.17 29.62 31.05 34.03 41.62114.5 122 127.5 132 137 153
60.5 64 66.5 69 71 73 77.5 22.8 25.12 27.1 29.01 30.27 32.38 35.38100.5
114.5119.5
122125
127.5129.5
132134.5
137139.5
147.5153
164
24.31 26.18 28.17 29.62 31.05 34.03 41.62 100.5 119.5 125 129.5 134.5 139.5 147.5 164
79
61..5
34.67
15.21
224
153.5
83
8075706560555045
200
160
120
80
44
34.67
15.21
153.5
83
61.5
50
40
30
20
50
40
30
20
45 50 55 60 65 70 75 80 80 100 120 140 160 180 200 220
45 55 65 75 80 120 160 200
200
160
120
80
75
65
55
45
30 40 5020
Age
Bmi
Sbp
Fig. 6. Traditional and confidentialised exploratory data analysis output for pairwise continuous variables age
in years (age), body mass index (bmi) and systolic blood pressure (sbp).
O’Keefe: Confidentialising Exploratory Data Analysis Output 607
As noted in earlier sections, Brandt et al. (2010) classify graphs as unsafe unless the
underlying modified information used to construct the graph has been classified as safe.
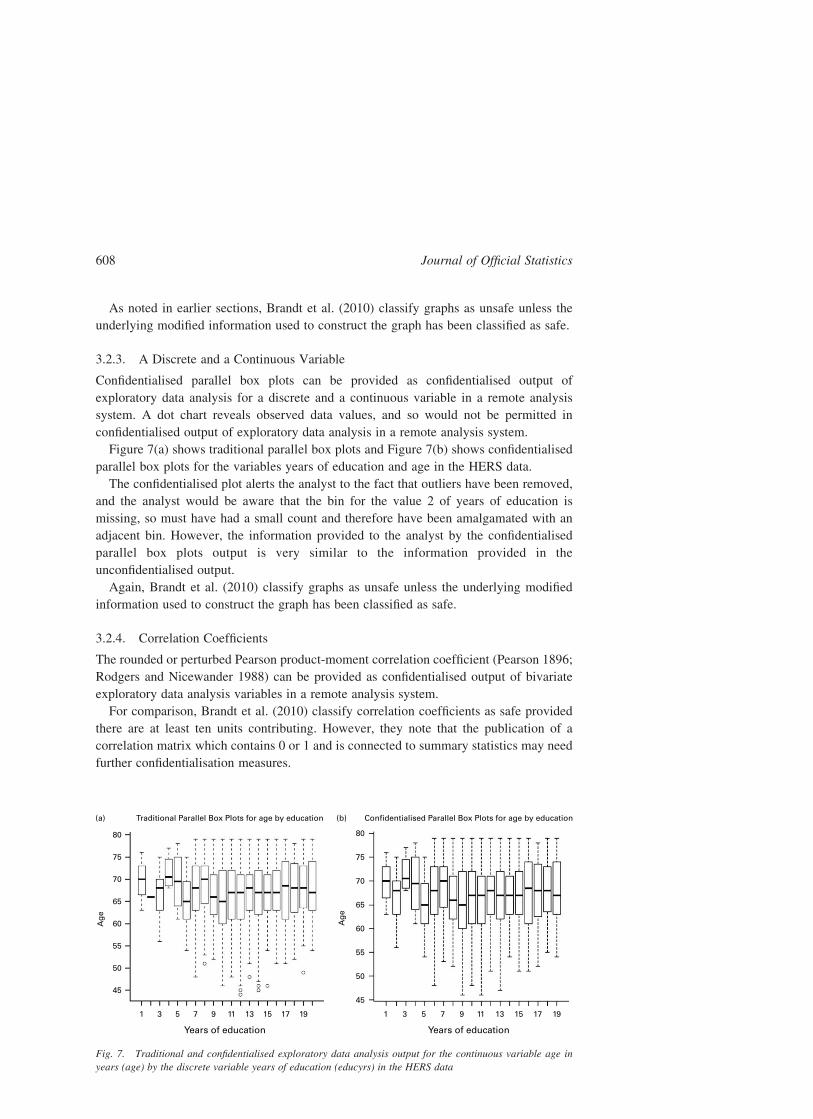
3.2.3. A Discrete and a Continuous Variable
Confidentialised parallel box plots can be provided as confidentialised output of
exploratory data analysis for a discrete and a continuous variable in a remote analysis
system. A dot chart reveals observed data values, and so would not be permitted in
confidentialised output of exploratory data analysis in a remote analysis system.
Figure 7(a) shows traditional parallel box plots and Figure 7(b) shows confidentialised
parallel box plots for the variables years of education and age in the HERS data.
The confidentialised plot alerts the analyst to the fact that outliers have been removed,
and the analyst would be aware that the bin for the value 2 of years of education is
missing, so must have had a small count and therefore have been amalgamated with an
adjacent bin. However, the information provided to the analyst by the confidentialised
parallel box plots output is very similar to the information provided in the
unconfidentialised output.
Again, Brandt et al. (2010) classify graphs as unsafe unless the underlying modified
information used to construct the graph has been classified as safe.
3.2.4. Correlation Coefficients
The rounded or perturbed Pearson product-moment correlation coefficient (Pearson 1896;
Rodgers and Nicewander 1988) can be provided as confidentialised output of bivariate
exploratory data analysis variables in a remote analysis system.
For comparison, Brandt et al. (2010) classify correlation coefficients as safe provided
there are at least ten units contributing. However, they note that the publication of a
correlation matrix which contains 0 or 1 and is connected to summary statistics may need
further confidentialisation measures.
80
(a) (b) Confidentialised Parallel Box Plots for age by educationTraditional Parallel Box Plots for age by education
75
Ag
e
70
65
60
55
50
45
1 3 5 7 9 11 13 15 17 19
80
75
Ag
e
70
65
60
55
50
45
1 3 5 7 9 11 13 15 17 19
Years of educationYears of education
Fig. 7. Traditional and confidentialised exploratory data analysis output for the continuous variable age in
years (age) by the discrete variable years of education (educyrs) in the HERS data
Journal of Official Statistics608

4. Discussion and Conclusions
In this article we have described a remote analysis system allowing exploratory data
analysis on confidential data, including describing a number of scenarios in which this sort
of functionality may be useful.
We provided an overview of disclosure risks and technical challenges in a remote
analysis system. We then gave a detailed description of measures to confidentialise
exploratory data analysis output, designed to achieve the disclosure risk objectives.
The work clarifies and builds on the confidentiality objectives and some of the measures as
discussed in Gomatam et al. (2005), Sparks et al. (2005), and Sparks et al. (2008).
The measures are broadly in agreement with the guidelines for the checking of output
based on microdata research developed by Brandt et al. (2010).
To illustrate the effect of the proposed confidentialisation methods, we provided a
comprehensive example enabling a side-by-side comparison of traditional output and
confidentialised output for a range of common exploratory data analyses.
The main differences between the traditional and confidentialised outputs were:
. Some plots showed differences in the scales because the removal of outliers in
confidentialised plots caused compression of the plot scale.
. Data for some discrete variable categories could be suppressed or aggregated in the
confidentialised output.
. Data winsorisation may mask information about outliers and or behaviour at the
extremes of the dataset. The analyst would be aware that outliers had been removed,
but would have no information about their number or values.
. The remote analysis system would not provide contingency tables, but rather would
provide correspondence analysis plots. The analyst would have to obtain contingency
tables using a different data access method.
. Continuous data are aggregated before presentation, for example as parallel box plots
and trend lines instead of a scatter plot.
. Values of statistics and correlation coefficients would be rounded.
In the example presented, the confidentialised output generally provided good information
about the data, except that outliers were removed and there was a general reduction in the
amount of detail available.
In summary, we believe that the confidentialised output is still useful for exploratory
data analysis, provided the analyst understands the confidentialisation process and its
potential impact. Where the potential impact is judged to be too great, the analyst would
need to seek another mode of access to the data.
It seems to be generally agreed that remote analysis servers will play an important
role in the future of data dissemination (see for example Bleninger et al. 2010; Reiter
2004).
5. References
Adam, N. and Wortmann, J. (1989). Security-control Methods for Statistical Databases:
A Comparative Study. ACM Computing Surveys, 21, 515–556.
Australian Bureau of Statistics (2009). Methodological News.
O’Keefe: Confidentialising Exploratory Data Analysis Output 609

Australian Bureau of Statistics (n.d.). Available at: http://abs.gov.au/websitedbs/
D3310114.nsf/home/CURF:þAboutþ theþABSþDataþLaboratoryþ (ABSDL)
(accessed 20 December 2012).
Australian Bureau of Statistics (n.d.). Remote Access Data Laboratory (RADL). Available
at: http://abs.gov.au/websitedbs/D3310114.nsf/home/CURF:þRemoteþAccessþ
DataþLaboratoryþ (RADL) (accessed 20 December 2012).
Barak, B., Chaudhuri, K., Dwork, C., Kale, S., McSherry, F., and Talwar, K. (2007).
Privacy, Accuracy, and Consistency Too: a Holistic Solution to Contingency Table
Release. In Proceedings of the 26th ACM SIGMOD-SIGACT-SIGART Symposium on
Principles of Database Systems (PODS), 273–282.
Benzecri, J.-P. (1973). L’Analyse des Donnees. Paris: Dunod.
Bleninger, P., Drechsler, J., and Ronning, G. (2010). Remote Data Access and the Risk of
Disclosure from Linear Regression: An Empirical Study. In Privacy in Statistical
Databases, Lecture Notes in Computer Science, J. Domingo-Ferrer and E. Magkos
(eds). Vol. 6344. New York: Springer, 220–233.
Brandt, M., Franconi, L., Gurke, C, Hundepol, A., Lucarelli, M., Mol, J., Ritchie, F.,
Seri, G. and Welpton, R. (2010). Guidelines for the Checking of Outputs Based on
Microdata Research. ESSnet SDC, A Network of Excellence in the European Statistical
System in the Field of Statistical Disclosure Control. Available at neon.vb.cbs.nl/casc/
ESSnet/guidelines_on_outputchecking.pdf.
Brandt, M. and Zwick, M. (2010). Improvement of Data Access. The Long Way to Remote
Data Access in Germany. Privacy in Statistical Databases Conference PSD. Short paper
in CD proceedings.
Chaudhuri, K. and Monteleoni, C. (2008). Privacy-Preserving Logistic Regression.
In Proceedings of the 22nd Annual Conference on Neural Information Processing
Systems (NIPS), 289–296.
Cleveland, W. (1979). Robust Locally Weighted Regression and Smoothing Scatterplots.
Journal of the American Statistical Association, 74, 829–836.
Cleveland, W. and Devlin, S. (1988). Locally-Weighted Regression: An Approach to
Regression Analysis by Local Fitting. Journal of the American Statistical Association,
83, 596–610.
Corscadden, L., Enright, J., Khoo, J., Krsinich, F., McDonald, S. and Zeng, I. (2006).
Disclosure Assessment of Analytical Output. Statistics New Zealand Preprint.
Dandekar, R. (2004). Maximum Utility-Minimum Information Loss Table Server Design
for Statistical Disclosure Control of Tabular Data. In Privacy in Statistical Databases,
Lecture Notes in Computer Science J. Domingo-Ferrer and V. Torra (eds), Vol. 3050.
New York: Springer, 121–135.
Domingo-Ferrer, J. and Magkos, E. (2010). Privacy in Statistical Databases, Lecture Notes
in Computer Science, Vol. 6344. New York: Springer.
Domingo-Ferrer, J. and Saygin, Y. (2008). Privacy in Statistical Databases, Lecture
Notes in Computer Science, Vol. 5262. New York: Springer.
Domingo-Ferrer, J. and Torra, V. (2004). Privacy in Statistical Databases, Lecture Notes
in Computer Science, Vol. 3050. New York: Springer.
Journal of Official Statistics610

Doyle, P., Lane, J., Theeuwes, J., and Zayatz, L. (2001). Confidentiality, Disclosure and
Data Access: Theory and Practical Applications for Statistical Agencies.
Amsterdam: North-Holland.
Duncan, G. and Mukherjee, S. (1991). Microdata Disclosure Limitation in Statistical
Databases: Query Size and Random Sample Query Control. In Proceedings of the 1991
IEEE Symposium on Security and Privacy, 278–287.
Duncan, G. and Pearson, R. (1991). In Enhancing Access to Microdata While Protecting
Confidentiality: Prospects for the Future. Statistical Science, 6, 219–239.
Duncan, G.T., Keller-McNulty, S.A. and Stokes, S.L. (2001). Disclosure Risk vs Data
Utility: The r-u confidentiality Map, Technical Report LA-UR-01-6428, Los Alamos
National Laboratory.
Dwork, C. and Lei, J. (2009). Differential Privacy and Robust Statistics. In Proceedings of
the 41st ACM Symposium on Theory of Computing (STOC), 371–380.
Dwork, C., McSherry, F., Nissim, K., and Smith, A. (2006). Calibrating Noise to Sensitivity
in Private Data Analysis. In 3rd IACR Theory of Cryptography Conference, 265–284.
Dwork, C. and Smith, A. (2009). In Differential Privacy for Statistics: What We Know and
What We Want to Learn. Journal of Privacy and Confidentiality, 1, 135–154.
European Union (n.d.) Essnet project. http://neon.vb.cbs.nl/casc/index.htm (accessed 20
December 2012).
Gabriel, K. (1971). The Biplot Graphic Display of Matrices with Application to Principal
Component Analysis. Biometrika, 58, 453–467.
Gomatam, S., Karr, A., Reiter, J., and Sanil, A. (2005). Data Dissemination and Disclosure
Limitation in a World Without Microdata: A Risk-Utility Framework for Remote
Access Systems. Statisical Science, 20, 163–177.
Grady, D., Applegate, W., Bush, T., Furberg, C., Riggs, B., and Hulley, S. (1998).
Heart and Estrogen/Progestin Replacement Study (hers): Design, Methods, and
Baseline Characteristics. Controlled Clinical Trials, 19, 314–335.
Greenacre, M. (2007). Correspondence Analysis in Practice. London: Academic Press.
Greenacre, M. (2010). Biplots in Practice. Madrid: BBVA Foundation.
Honinger, J., Pattloch, D., and Voshage, R. (2010). On-site Access to Micro Data:
Preserving the Treasure, Preventing Disclosure. Preprint.
Karr, A., Dobra, A., and Sanil, A. (2003). Table Servers Protect Confidentiality in Tabular
Data Releases. Communications of the ACM, 46, 57–58.
Karr, A., Lee, J., Sanil, A., Hernandez, J., Karimi, S., and Litwin, K. (2002). Web-Based
Systems that Disseminate Information but Protect Confidentiality. Advances in Digital
Government: Technology, Human Factors and Public Policy, W. Mclver and
A. Elmagarmid (eds). Kluwer: Amsterdam, 181–196.
Keller-McNulty, S. and Unger, E. (1998). A Database System Prototype for Remote Access
to information Based on Confidential Data. Journal of Official Statistics, 14, 347–360.
Little, R. (1993). Statistical Analysis of Masked Data. Journal of Official Statistics, 9,
407–426.
Lucero, J. and Zayatz, L. (2010). The Microdata Analysis System at the U.S. Census
Bureau. Privacy in Statistical Database, Lecture Notes in Computer Science
J. Domingo-Ferrer and E. Magkos (eds), Vol. 6344. New York: Springer, 234–248.
McNeil, D. (1977). Interactive Data Analysis. Hoboken, NJ: Wiley.
O’Keefe: Confidentialising Exploratory Data Analysis Output 611

Mosteller, F. and Tukey, J. (1977). Data Analysis and Regression. Boston:
Addison-Wesley.
Office for National Statistics (n.d.). Available from: http://www.ons.gov.uk/ons/about-
ons/who-we-are/services/vml/index.html (accessed 20 December 2012).
Office of Information and Regulatory Affairs (1994). Statistical policy working paper
22 – report on statistical disclosure limitation methodology, Subcommittee on
Disclosure Limitation Methodology, Federal Committee on Statistical Methodology,
Statistical Policy Office, Office of Information and Regulatory Affairs, Office of
Management and Budget.
O’Keefe, C.M. and Good, N. (2008). A Remote Analysis System – What Does Regression
Output Look Like? In Privacy in Statistical Databases, number 5262 Lecture Notes in
Computer Science J. Domingo-Ferrer and Y. Saygin (eds). New York: Springer,
270–283.
O’Keefe, C.M. and Good, N. (2009). Regression Output From a Remote Analysis System.
Data & Knowledge Engeneering, 68, 1175–1186.
O’Keefe, C.M., Sparks, R., McAullay, D. and Loong, B. (2012). Confidentialising
Survival Analysis output in a Remote Data Access System. Journal of Privacy and
Confidentiality, 4, 127–154.
Pearson, K. (1896). Mathematical Contributions to the Theory of Evolution, iii.
Regression, Heredity and Panmixia. Philisophical Transactions of the Royal Society A,
187, 253–318.
R Development Core Team (2012). R:A Language and Environment for Statistical
Computing. R Foundation for Statistical Computing. Available from: www.
R-project.org/.
Reiter, J. (2003). Model Diagnostics for Remote-Access Regression System. Statistical
Computing, 13, 371–380.
Reiter, J. (2004). New Approaches to Data Dissemination: A Glimpse into the Future (?).
Chance, 17, 12–16.
Reiter, J. (2005). Using Cart to Generate Partially Synthetic Public Use Microdata. Journal
of Official Statistics, 21, 441–462.
Reiter, J. and Kohnen, C. (2005). Categorical Data Regression Diagnostics for Remote
Systems. Journal of Statistical Computation and Simulation, 75, 889–903.
Reuter, W. and Museux, J.-M. (2010). Establishing an Infrastructure for Remote Access to
Microdata at Eurostat. Privacy in Statistical Databases, Lecture Notes in Computer Science
J. Domingo-Ferrer and E. Magkos (eds), Vol. 6344. New York: Springer, 249–257.
Reznek, A. (2003). Disclosure Risks in Cross-Section Regression Models. American
Statistical Association 2003, Proceedings of the Section on Government Statistics and
Section on Social Statistics, CD, 3444–3451.
Reznek, A. (2006). Recent Confidentiality Research Related to Access to Enterprise
Microdata. Prepared for the Comparative Analysis of Enterprise Microdata (CAED)
Conference, Chicago IL, USA.
Reznek, A. and Riggs, T. (2005). Disclosure Risks in Releasing Output Based on
Regression Residuals. American Statistical Association 2005 Proceedings of the
Section on Government Statistics and Section on Social Statistics (available on CD),
1397–1404.
Journal of Official Statistics612
Reznek, A. and Riggs, T.L. (2004). Disclosure Risks in Regression Models: Some Further
Results. American Statistical Association 2004 Proceedings of the Section on
Government Statistics and Section on Social Statistics, 1701–1708.
Ritchie, F. (2006). Disclosure Controls for Regression Outputs. Mimeo, Office of National
Statistics, London.
Ritchie, F. (2007). Disclosure Detection in Research Environments in Practice. Working
paper 37 in the Joint UNECE/Eurostat work session on statistical data confidentiality.
Topic (iii): Applications; United Nations Statistical Commission and Economic
Commission for Europe Conference of Europe Statisticians, European Commission
Statistical Office of the European Communities (Eurostat), Manchester. Available at:
www.unece.org/stats/documents/2007/12/confidentiality/wp. 37.e.pdf
Rodgers, J. and Nicewander, W. (1988). Thirteen Ways to Look at the Correlation
Coefficient. The American Statistician, 42, 59–66.
Rubin, D. (1993). Discussion: Statistical Disclosure Limitation. Journal of Official
Statistics, 9, 462–468.
Schouten, B. and Cigrang, M. (2003). Remote Access Systems for Statistical Analysis of
Microdata. Statistical Computing, 13, 371–380.
Smith, A. (2009). Asymptotically Optimal and Private Statistical Estimation. Proceeding
of CANS 2009. LNCS 5888, J. Garay, A. Miyaji, and A. Otsuka (eds), Berlin: Springer.
Sparks, R., Carter, C, Donnelly, J., Duncan, J., O’Keefe, C. and Ryan, L. (2005).
A Framework for Performing Statistical Analyses of Unit Record Health Data Without
Violating Either Privacy or Confidentiality of Individuals. In Proceedings of the 55th
Session of the International Statistical Institute, Sydney.
Sparks, R., Carter, C., Donnelly, J., O’Keefe, C., Duncan, J., Keighley, T., and McAullay, D.
(2008). Remote Access Methods for Exploratory Data Analysis and Statistical
Modelling: Privacy-preserving Analyticse, Computer Methods and Programs in
Biomedicine, 91, 208–222.
Tukey, J. (1977). Exploratory Data Analysis: Addison-Wesley.
UK Data Archive (n.d.). Secure data service, Available from: http://securedata.data-
archive.ac.uk/ (accessed 20 December 2012).
United States Census Bureau (n.d.). Available from: http://www.census.gov/ces/rdcre-
search/ (accessed 20 December 2012).
University of Chicago (n.d.). Available at: www.norc.org (accessed 20 December 2012).
Velleman, P. and Hoaglin, D. (1981). The ABC’s of EDA: Applications, Basics and
Computing of Exploratory Data Analysis. Boston, MA: Duxbury Press.
Willenborg, L. and de Waal, T. (2001). Elements of Statistical Disclosure Control, Lecture
Notes in Statistics, Vol. 155: Springer.
Received 2012
Revised November 2012
O’Keefe: Confidentialising Exploratory Data Analysis Output 613