congestion-aware rate adaptation in wireless networks: … · congestion-aware rate adaptation in...
TRANSCRIPT

Congestion-Aware Rate Adaptation in WirelessNetworks: A Measurement-Driven Approach
Prashanth Aravinda Kumar Acharya†, Ashish Sharma†, Elizabeth M. Belding†,Kevin C. Almeroth†, Konstantina Papagiannaki‡
†Department of Computer Science, University of California, Santa Barbara CA 93106‡Intel Research, Pittsburgh PA 15213
{acharya, asharma, ebelding, almeroth}@cs.ucsb.edu, [email protected]
Abstract—Traditional rate adaptation solutions for IEEE802.11 wireless networks perform poorly in congestednetworks. Measurement studies show that congestion ina wireless network leads to the use of lower transmissiondata rates and thus reduces overall network throughputand capacity. The lack of techniques to reliably identify andcharacterize congestion in wireless networks has preventeddevelopment of rate adaptation solutions that incorporatecongestion information in their decision framework. Tothis end, our main contributions in this paper are two-fold.First, we present a technique that identifies and measurescongestion in an 802.11 network in real time. Second, wedesign Wireless cOngestion Optimized Fallback (WOOF),a measurement-driven rate adaptation scheme for 802.11devices that uses the congestion measurement to identifycongestion related packet losses. Through experimentalevaluation, we show that WOOF achieves up to 300%higher throughput in congested networks, compared toother well-known adaptation algorithms.
I. INTRODUCTION
The use of IEEE 802.11 wireless networks is on therise and an increasing number of people depend on awireless connection for their Internet access. A recentsurvey indicated that about one-third of the Internetusers in the USA obtain connectivity through wirelessnetworks1. The proliferation of 802.11 networks andusers, however, brings forth its own set of problems.These are in part due to IEEE 802.11’s use of CSMA/CAbased medium access, wherein all the users share themedium as a common resource.
A large number of users in a network can lead toexcessive load or congestion and impact network perfor-mance. A case study of a large WLAN by Jardosh et al.presented an example of the adverse effects of such con-gestion [1]. In this network, more than 1000 clients at-tempted to use the network simultaneously. The networkcould not sustain this high load: users obtained unaccept-ably low throughput, and many users were unable to evenmaintain association with the APs. Eventually the net-work broke down, causing frustration among the users.
One of the causes of the network meltdown wasIEEE 802.11’s rate adaptation scheme, an importantaspect of the protocol that affects network throughput.In a multi-rate 802.11 network, rate adaptation is
1 http://www.pewinternet.org/pdfs/PIP Wireless.Use.pdf (Feb 2007).
the operation of selecting the best transmission rateand dynamically adapting this selection to variationsin channel quality. Measurement studies have shownthat current rate adaptation solutions do not performwell in congested networks [2], [3]. These solutions,not designed for operation in congested scenarios,unnecessarily switch to a lower transmission rate. Thisrate switch increases the channel occupation time,thereby compounding the congestion.
Our goal is to design a rate adaptation scheme thatprovides high network performance in both congestednetworks and lightly-loaded networks. A preliminarystep required before we can develop a new rateadaptation scheme is to identify and measure networkcongestion levels in real-time. Traditional metrics, suchas network throughput, fail to characterize congestion ina wireless network because of the locally shared natureof the medium and the use of multiple transmission rates.Thus, there is a need for a lightweight measurementsolution that can identify congestion in a wirelessnetwork in real-time. This solution in turn providesinformation to the rate adaptation scheme about thecurrent congestion level and enables an intelligentdecision of what data rate to use for transmission.
In this paper, we present a measurement-driven ap-proach to the characterization of congestion in wire-less networks and incorporate this information in thedesign of a congestion-aware rate adaptation scheme.Our two main contributions are as follows. First, wedevelop a congestion measurement technique for wire-less networks to identify congestion in real-time. Wepassively measure the channel busy time, the fractionof time for which the medium is utilized in some timeinterval. We evaluate the performance of the techniquein a large WLAN with active users connected to theInternet. Second, we employ the channel busy timecongestion metric in the design and implementation ofa new rate-adaptation scheme called Wireless cOnges-tion Optimized Fallback (WOOF). The use of a con-gestion metric enables the rate-adaptation algorithm todifferentiate between packet losses due to congestionand those due to poor link quality. Through experi-mental evaluation in a congested wireless network, weshow that WOOF obtains significantly higher throughput
978-1-4244-1777-3/08/$25.00 © IEEEThis full text paper was peer reviewed at the direction of IEEE Communications Society subject matter experts for publication in the IEEE SECON 2008 proceedings.
1
Authorized licensed use limited to: The University of Edinburgh. Downloaded on October 28, 2008 at 05:32 from IEEE Xplore. Restrictions apply.

(up to a three fold improvement) than current solu-tions.
The remainder of the paper is organized as follows.Section II describes the congestion measurement methodand its performance evaluation. We survey existing rateadaptation schemes in Section III. Section IV presentsa performance analysis of rate adaptation schemesin congested WLANs. Sections V and VI describethe design and evaluation of the WOOF scheme. Weconclude the paper in Section VII. Throughout thepaper, we use the term data rate to refer to the rate oftransmissions in the wireless network as governed bythe physical layer signal modulation scheme.
II. CONGESTION MEASUREMENT
Congestion in IEEE 802.11 wireless networks maybe defined as a state where the shared wireless mediumis close to being fully utilized by the nodes, becauseof given channel conditions and/or external interference,while operating within the constraints of the 802.11protocol [3]. Identification of congestion in wirelessnetworks presents new challenges as compared to wirednetworks.
The shared nature of the wireless medium causes anode to share the transmission channel not just withother nodes in the network, but also with externalinterference sources. Unlike wired networks, wherethroughput degradation on a network link is indicative ofcongestion, in wireless networks throughput degradationcan occur due to a lossy channel, increased packetcollisions during congestion or external interference. Inaddition, throughput of a wireless link is also directlyinfluenced by the rate adaptation algorithm through itschoice of transmission data rate. Clearly, if a lower datarate is in use, the throughput for a given time intervalwill be lower than with a high data rate.
For these reasons, the time available to a nodefor transmission, governed by the current mediumutilization level, characterizes congestion in a wirelessnetwork better than the observed throughput. Severalstudies have proposed the use of medium utilization as ameasure of congestion in the wireless medium [3], [4].Jardosh et al. show that medium utilization can be usedto classify network state as uncongested, moderatelycongested, and highly congested.
In this paper, we implement and evaluate a real-timecongestion measurement technique for wireless net-works. The technique is passive in nature and measureschannel busy time, the fraction of time for which themedium was utilized, during some time interval.
A. Channel Busy Time: A Passive Approach
Channel Busy Time (CBT) refers to the fraction oftime for which the wireless channel is busy within agiven interval. As measured at a wireless device, itincludes the time for transmission of packets from thedevice, reception of packets, packet transmissions from
neighbors, the delays that precede the transmission ofdata and control frames, and environmental noise.
Jardosh et al. outline a method to calculate mediumutilization by adding the transmission duration of alldata, management, and control frames recorded by asniffer [3]. However, one drawback of this approachis that it involves significant processing overhead foreach received packet, as it requires sniffing the networkin monitor mode and accounting for transmissiondelays of data and ACK packets, and the SIFS andDIFS intervals that precede frame transmissions.These complexities make it unsuitable for congestionidentification in real-time. In this paper, we present apractical light-weight implementation of the CBT metricfor 802.11 networks using a feature provided in Atheroschipset-based devices, and compare its performancewith the technique proposed by Jardosh et al. [3].
To measure the channel busy time, we use the reverse-engineered Open HAL [5] implementation of the Mad-Wifi driver for Atheros AR5212 chipset radios. Atherosmaintains 32-bit register counters to track “mediumbusy time” and “cycle time”. The cycle time counter isincremented at every clock tick and the medium busycounter represents the number of clock ticks for whichthe medium was sensed busy. The medium is consideredbusy if the measured signal strength is greater than theClear Channel Assessment (CCA). For Atheros radios,the CCA has been found to be -81dBm [6]. The ratio ofthe “medium busy time” and the “cycle time” countersgives the fraction of time during which the channel wasbusy. In our implementation we expose an interface inthe /proc filesystem to read the counter values fromthe registers periodically at an interval of one second.
Our implementation of channel busy timemeasurement is based on the Atheros chipset. Aswe show later in this paper, this metric can provide veryuseful information for network protocol designers. Webelieve that other hardware vendors should also exposea similar interface and facilitate cross-layered wirelessprotocol designs that maximize network performance.
B. Evaluation of Congestion Metric
To evaluate the performance of the proposedtechnique, we use as a benchmark the mediumutilization as seen by a sniffer operating in monitormode. In order to calculate medium utilization, we usethe methodology proposed by Jardosh et al. to accountfor the transmission duration of all management,control and data frames, along with the SIFS andDIFS durations preceding each transmission [3]. Thishelps determinine the accuracy of our low overheadimplementation of CBT by comparing against a fairlycomprehensive but high overhead mechanism.
Experimental Setup: In our experiments, we use twoLinux laptops equipped with Atheros chipset IEEE802.11a/b/g cards and an access point to evaluate the pas-sive Channel Busy Time congestion measurement tech-
2
Authorized licensed use limited to: The University of Edinburgh. Downloaded on October 28, 2008 at 05:32 from IEEE Xplore. Restrictions apply.

nique. One laptop acts as a wireless sniffer and is placedclose to the AP to perform vicinity sniffing [7]. As part ofvicinity sniffing, the radio on the sniffer laptop operatesin monitor mode and captures all packet transmissionsusing the tethreal utility. This technique allows usto study the wireless network activity in the vicinity ofthe AP. The traffic trace from the sniffer is used for theoffline calculation of medium utilization values duringthe experiment. The second laptop, placed next to thefirst laptop, records the CBT values observed duringthe experiment. The medium utilization calculated withthe help of traffic traces is then compared against CBTduring the corresponding time interval of the experiment.
We calculate the medium utilization value using themethodology proposed by Jardosh et al. [3]. In theinterest of space, we briefly summarize the technique asfollows. The medium utilization for a given time intervalis the sum of the time required for all data, management,and control frames transmitted in the interval and thenecessary MAC delay components for each frame. Thesecond laptop, also placed close to the AP, continuouslymeasures and records the channel busy time as describedin Section II-A. In order to compare CBT values withmedium utilization values during correspondingtime intervals, the laptops are time synchronized tomilliseconds granularity using NTP. Note that bothlaptops are tuned to the same channel as the AP.
Testing Scenarios: We evaluate the congestionmeasurement technique in two different environments.We choose the two environments because of their vastlydifferent characteristics.
Testbed: We conduct the first set of experimentsin an indoor testbed of eight client laptops connectedto an access point. Each client initiates a bidirectionalUDP traffic flow with the AP. The rate of data traffic iscontrolled at each client to generate a range of mediumutilization levels. The controlled environment of thetestbed gives us the flexibility to vary network load togenerate a range of medium utilization values and limitexternal interference. We use UDP traffic as opposedto TCP because TCP’s congestion control and backoffmechanisms prevent us from controlling the rate atwhich data is injected into the network.
IETF Wireless LAN: To verify the performance ofour technique in a real world network characterized bylive Internet traffic, a large number of heterogeneousdevices, dynamic user behavior, and other externalfactors, we conducted experiments at the 67th IETFmeeting held in San Diego in November 2006. Thenetwork at the IETF meeting consisted of a largeWLAN connected to the Internet with 38 physical APdevices that provided connectivity to more than 1000clients. The APs were dual-radio devices with one radiotuned to the 802.11a spectrum and the other to the802.11b/g spectrum. The APs were tuned to orthogonalchannels to enable spatial reuse. We chose to perform our
0
0.2
0.4
0.6
0.8
1
0 0.2 0.4 0.6 0.8 1
Cha
nnel
Bus
y Ti
me
Medium Utilization Fraction
(a) Testbed: CBT vs medium utilization
0
0.2
0.4
0.6
0.8
1
0 0.2 0.4 0.6 0.8 1
Cha
nnel
Bus
y Ti
me
Medium Utilization Fraction
(b) IETF: CBT vs medium utilization
Fig. 1. Correlation between CBT and medium utilization.
experiments with 802.11b/g as there were approximatelythree times as many users on the 2.4GHz spectrum asthe 5GHz spectrum of 802.11a. The APs advertized thefollowing as accepted data rates (Mbps): 11, 12, 18, 24,36, 48 and 54. This restriction on acceptable data ratesenables limiting the cell-size of each AP.
We conducted experiments during several sessions atthe IETF, each characterized by a different number ofclients connected to the AP. For example, a workinggroup meeting is typically attended by about 50-100people on average. On the other hand, a plenary sessionis attended by approximately 1000 people. The roomfor the plenary session at the 67th IETF was servicedby eight dual radio physical AP devices. The 2.4GHzAPs were tuned to the three non-overlapping channelsof the 802.11b/g spectrum. For the evaluation of ourcongestion measurement techniques, we focused on Day3 of the meeting, a day that included a plenary session.
Results: In Figures 1(a) and (b), we plot the CBTmetric against the medium utilization calculated basedon sniffer data for each second, for experiments con-ducted on the testbed and at the IETF meeting, respec-tively. Every point in the graph represents the mea-sured CBT value compared to the calculated mediumutilization value during the corresponding time inter-val. Both Figures 1(a) and (b) show a strong lin-ear correlation between CBT and medium utilization,with a linear correlation coefficient of 0.97 for thetestbed network and 0.925 for the IETF network. Thishigh degree of correlation indicates that channel busytime estimates the medium utilization with high accu-racy.
3
Authorized licensed use limited to: The University of Edinburgh. Downloaded on October 28, 2008 at 05:32 from IEEE Xplore. Restrictions apply.

From the graphs, we observe that the CBT metricsometimes indicates a higher value than mediumutilization. This behavior is because CBT accounts forthe time during which the medium was busy, but apacket was not necessarily received (e.g., channel noise,packet collisions). Therefore CBT represents a moreaccurate picture of the channel in such scenarios. Also,it can be seen from Figure 1(b) that the CBT metricsometimes under-estimates the channel utilization value.The specification for the Atheros chipset quotes theradio sensitivity for some data rates (e.g., -95dBm for1Mbps) to be lower than the CCA threshold. Thus, somelow data rate packets are received correctly at the snifferat a signal strength that is below the CCA threshold.
We now demonstrate the utility of real-timecongestion metrics in improving the performance ofcongested wireless networks. Our focus is on rateadaptation in wireless networks. In the followingsections, we first survey existing rate adaptationalgorithms. We then analyze the performance of rateadaptation schemes in a large WLAN.
III. RELATED WORK IN RATE ADAPTATION
Rate adaptation in a multi-rate IEEE 802.11 networkis the technique of choosing the best data rate for packettransmission under the current channel conditions. TheIEEE 802.11 standard does not specify the details of therate adaptation algorithm to be used. Thus 802.11 cardvendors and researchers have proposed and implementeda variety of rate adaptation algorithms.
The probability of successful transmission of a packetfor a given data rate can be modeled as a functionof Signal-to-Noise Ratio (SNR) of the packet at thereceiver [8]. A packet can be transmitted at a highdata rate if the SNR at the receiver is high and thepacket can be received without errors. On the otherhand, if the SNR is not high, a lower data rate helpsachieve more robust communication. Therefore, one ofthe ideal metrics to base the choice of transmission datarate is the SNR of a packet at the receiver. However,under current IEEE 802.11 implementations, it is nottrivial for the transmitter to accurately estimate theSNR at the receiver because signal strength exhibitssignificant variations on a per-packet basis. This has ledto the development of various solutions that attempt toestimate link quality through other metrics.
Receiver-Based Auto Rate (RBAR) [9] is a schemethat proposes use of the RTS-CTS handshake by areceiver node to communicate the signal strength of re-ceived frames. The receiver measures the signal strengthof the RTS message and uses this information to select anappropriate data rate for transmission of the data frame.The transmitter is informed of the selected data ratethrough the CTS message. A drawback of this schemeis that it cannot be used in modern 802.11 networkswhere the RTS-CTS messaging is generally disabled.
At the transmitter node, the most commonly usedinformation to help in choosing a data rate is the packetloss information (i.e., when an ACK is not received).Auto-Rate Fallback (ARF) interprets patterns of packetloss (e.g., four consecutive losses) as triggers to changethe data rate [10]. Several other rate adaptation schemes,such as AARF [11], also use packet loss patterns for rateadaptation decisions. Most current 802.11 devices imple-ment ARF or variations of ARF [12]. Recent work suchas SampleRate [13] show that ARF and AARF performpoorly for links that are not always 100% reliable. There-fore SampleRate uses a statistical view of packet lossrates over a period of time (e.g., 2s [13]) to choose therate. We describe SampleRate in detail in Section V-B.
A common feature among all the above described rateadaptation schemes is that they consider all packet lossesto be due to poor link quality. They do not distinguishbetween packet losses caused by channel qualityand packet losses caused by either hidden terminaltransmission or congestion. Ideally, the rate adaptationalgorithm should only consider the packet losses dueto poor channel conditions, multipath effects, fading,etc. Packet losses due to hidden terminals or congestionshould not affect the rate adaptation algorithm. Onobserving packet loss, a rate adaptation scheme thatdoes not distinguish the cause of the packet loss reducesthe transmission data rate. In the case of packet lossdue to congestion or hidden terminals, such a reductionof data rate is unnecessary. Even worse, the lowerdata rate increases the duration of packet transmission,thereby increasing congestion and the probability of apacket collision. Additional collisions result in packetloss, which leads to further reduction in data rate.
The challenge for a rate adaptation algorithm is to beable to identify the cause of a packet loss, i.e., whethera packet was lost because of a bad link, hidden terminalor congestion. In the absence of such a distinction,rate adaptation algorithms may actually compoundnetwork congestion [3]. In our work, we attempt toprobabilistically identify congestion-related packetlosses and minimize their impact on rate adaptation.
Two rate adaptation algorithms, namely Robust RateAdaptation Algorithm (RRAA) [14] and Collision-Aware Rate Adaptation (CARA) [12], are designed tominimize the impact of packet losses that are not dueto channel errors. RRAA selectively uses RTS-CTShandshaking to avoid hidden terminal collisions. RRAAwas not designed to handle congestion in the network.On the other hand, CARA builds upon ARF [10] andsuggests the use of an adaptive RTS-CTS mechanismto prevent losses due to contention. However, CARArequires turning on the RTS-CTS mechanism for the firstretransmission of a packet, i.e., upon failure of the firsttransmission attempt. Most current hardware does notsupport this facility and thus may require modification.In contrast, our solution is implemented purely in
4
Authorized licensed use limited to: The University of Edinburgh. Downloaded on October 28, 2008 at 05:32 from IEEE Xplore. Restrictions apply.
software. Moreover, CARA is built upon ARF and thusinherits the problems of ARF, where it uses patternsof packet loss for adaptation decisions. This has beenshown to lead to incorrect rate adaptation decisions [14].
IV. RATE ADAPTATION DURING CONGESTION
We now analyze the behavior of current rateadaptation schemes in a congested network. We focuson the packet loss rates in such networks and theirimpact on rate adaptation. In addition, we explore therelationship between packet loss and congestion levelsin the network. The traffic traces from the 67th IETFare used for this analysis.
We focus on the Wednesday plenary session ofthe IETF meeting. This session had more than 1000attendees in one large room with 16 APs. We choosethis session in order to study the packet loss behaviorin a network with high number of users and a high loadon the network. We assume the original transmissionof a packet to be lost if, in the trace, we observe thepacket transmission with the retry flag set. The fractionof lost packets is calculated as the ratio of the numberof retransmitted packets to the sum of the number ofpackets transmitted and the number of packets lost.
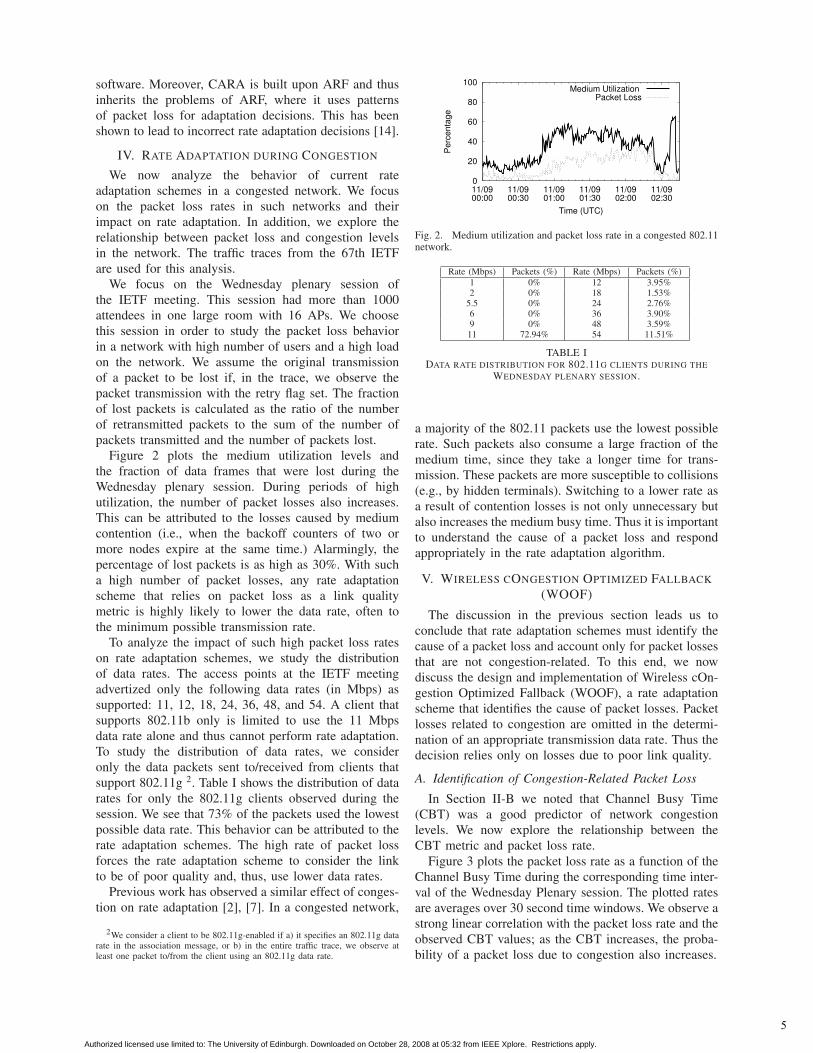
Figure 2 plots the medium utilization levels andthe fraction of data frames that were lost during theWednesday plenary session. During periods of highutilization, the number of packet losses also increases.This can be attributed to the losses caused by mediumcontention (i.e., when the backoff counters of two ormore nodes expire at the same time.) Alarmingly, thepercentage of lost packets is as high as 30%. With sucha high number of packet losses, any rate adaptationscheme that relies on packet loss as a link qualitymetric is highly likely to lower the data rate, often tothe minimum possible transmission rate.
To analyze the impact of such high packet loss rateson rate adaptation schemes, we study the distributionof data rates. The access points at the IETF meetingadvertized only the following data rates (in Mbps) assupported: 11, 12, 18, 24, 36, 48, and 54. A client thatsupports 802.11b only is limited to use the 11 Mbpsdata rate alone and thus cannot perform rate adaptation.To study the distribution of data rates, we consideronly the data packets sent to/received from clients thatsupport 802.11g 2. Table I shows the distribution of datarates for only the 802.11g clients observed during thesession. We see that 73% of the packets used the lowestpossible data rate. This behavior can be attributed to therate adaptation schemes. The high rate of packet lossforces the rate adaptation scheme to consider the linkto be of poor quality and, thus, use lower data rates.
Previous work has observed a similar effect of conges-tion on rate adaptation [2], [7]. In a congested network,
2We consider a client to be 802.11g-enabled if a) it specifies an 802.11g datarate in the association message, or b) in the entire traffic trace, we observe atleast one packet to/from the client using an 802.11g data rate.
0
20
40
60
80
100
11/0900:00
11/0900:30
11/0901:00
11/0901:30
11/0902:00
11/0902:30
Per
cent
age
Time (UTC)
Medium Utilization Packet Loss
Fig. 2. Medium utilization and packet loss rate in a congested 802.11network.
Rate (Mbps) Packets (%) Rate (Mbps) Packets (%)1 0% 12 3.95%2 0% 18 1.53%
5.5 0% 24 2.76%6 0% 36 3.90%9 0% 48 3.59%11 72.94% 54 11.51%
TABLE IDATA RATE DISTRIBUTION FOR 802.11G CLIENTS DURING THE
WEDNESDAY PLENARY SESSION.
a majority of the 802.11 packets use the lowest possiblerate. Such packets also consume a large fraction of themedium time, since they take a longer time for trans-mission. These packets are more susceptible to collisions(e.g., by hidden terminals). Switching to a lower rate asa result of contention losses is not only unnecessary butalso increases the medium busy time. Thus it is importantto understand the cause of a packet loss and respondappropriately in the rate adaptation algorithm.
V. WIRELESS CONGESTION OPTIMIZED FALLBACK
(WOOF)
The discussion in the previous section leads us toconclude that rate adaptation schemes must identify thecause of a packet loss and account only for packet lossesthat are not congestion-related. To this end, we nowdiscuss the design and implementation of Wireless cOn-gestion Optimized Fallback (WOOF), a rate adaptationscheme that identifies the cause of packet losses. Packetlosses related to congestion are omitted in the determi-nation of an appropriate transmission data rate. Thus thedecision relies only on losses due to poor link quality.
A. Identification of Congestion-Related Packet Loss
In Section II-B we noted that Channel Busy Time(CBT) was a good predictor of network congestionlevels. We now explore the relationship between theCBT metric and packet loss rate.
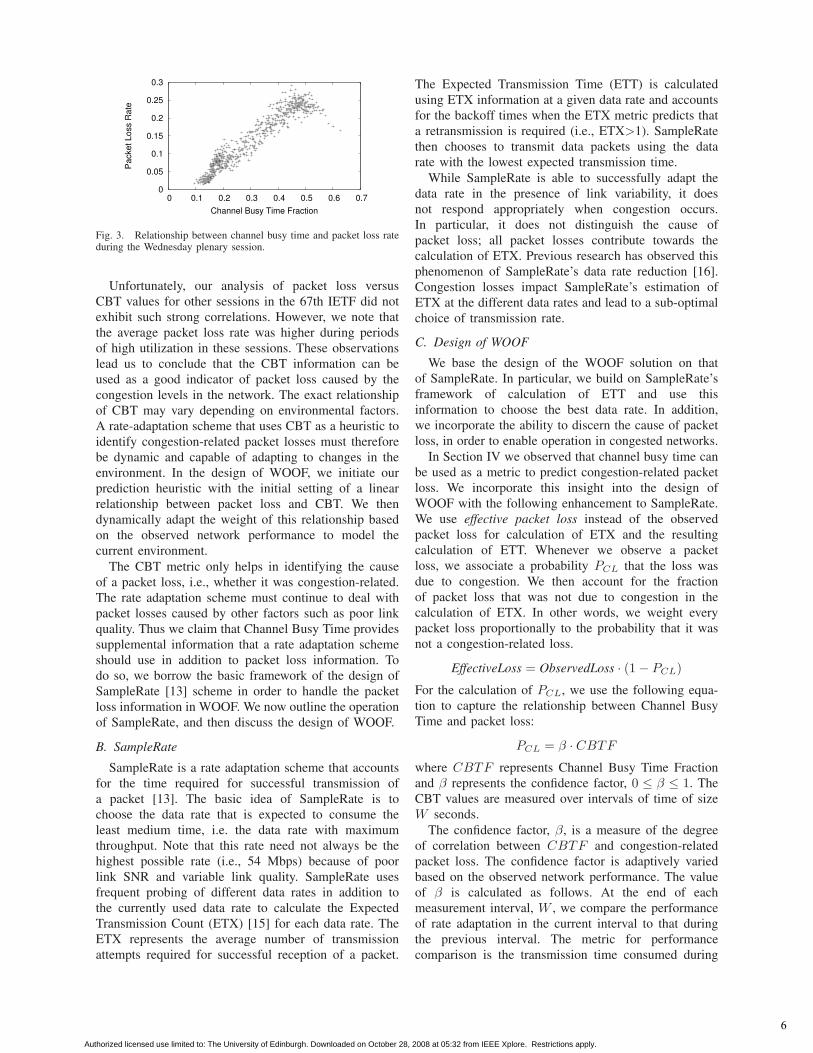
Figure 3 plots the packet loss rate as a function of theChannel Busy Time during the corresponding time inter-val of the Wednesday Plenary session. The plotted ratesare averages over 30 second time windows. We observe astrong linear correlation with the packet loss rate and theobserved CBT values; as the CBT increases, the proba-bility of a packet loss due to congestion also increases.
5
Authorized licensed use limited to: The University of Edinburgh. Downloaded on October 28, 2008 at 05:32 from IEEE Xplore. Restrictions apply.
0
0.05
0.1
0.15
0.2
0.25
0.3
0 0.1 0.2 0.3 0.4 0.5 0.6 0.7
Pac
ket L
oss
Rat
e
Channel Busy Time Fraction
Fig. 3. Relationship between channel busy time and packet loss rateduring the Wednesday plenary session.
Unfortunately, our analysis of packet loss versusCBT values for other sessions in the 67th IETF did notexhibit such strong correlations. However, we note thatthe average packet loss rate was higher during periodsof high utilization in these sessions. These observationslead us to conclude that the CBT information can beused as a good indicator of packet loss caused by thecongestion levels in the network. The exact relationshipof CBT may vary depending on environmental factors.A rate-adaptation scheme that uses CBT as a heuristic toidentify congestion-related packet losses must thereforebe dynamic and capable of adapting to changes in theenvironment. In the design of WOOF, we initiate ourprediction heuristic with the initial setting of a linearrelationship between packet loss and CBT. We thendynamically adapt the weight of this relationship basedon the observed network performance to model thecurrent environment.
The CBT metric only helps in identifying the causeof a packet loss, i.e., whether it was congestion-related.The rate adaptation scheme must continue to deal withpacket losses caused by other factors such as poor linkquality. Thus we claim that Channel Busy Time providessupplemental information that a rate adaptation schemeshould use in addition to packet loss information. Todo so, we borrow the basic framework of the design ofSampleRate [13] scheme in order to handle the packetloss information in WOOF. We now outline the operationof SampleRate, and then discuss the design of WOOF.
B. SampleRate
SampleRate is a rate adaptation scheme that accountsfor the time required for successful transmission ofa packet [13]. The basic idea of SampleRate is tochoose the data rate that is expected to consume theleast medium time, i.e. the data rate with maximumthroughput. Note that this rate need not always be thehighest possible rate (i.e., 54 Mbps) because of poorlink SNR and variable link quality. SampleRate usesfrequent probing of different data rates in addition tothe currently used data rate to calculate the ExpectedTransmission Count (ETX) [15] for each data rate. TheETX represents the average number of transmissionattempts required for successful reception of a packet.
The Expected Transmission Time (ETT) is calculatedusing ETX information at a given data rate and accountsfor the backoff times when the ETX metric predicts thata retransmission is required (i.e., ETX>1). SampleRatethen chooses to transmit data packets using the datarate with the lowest expected transmission time.
While SampleRate is able to successfully adapt thedata rate in the presence of link variability, it doesnot respond appropriately when congestion occurs.In particular, it does not distinguish the cause ofpacket loss; all packet losses contribute towards thecalculation of ETX. Previous research has observed thisphenomenon of SampleRate’s data rate reduction [16].Congestion losses impact SampleRate’s estimation ofETX at the different data rates and lead to a sub-optimalchoice of transmission rate.
C. Design of WOOF
We base the design of the WOOF solution on thatof SampleRate. In particular, we build on SampleRate’sframework of calculation of ETT and use thisinformation to choose the best data rate. In addition,we incorporate the ability to discern the cause of packetloss, in order to enable operation in congested networks.
In Section IV we observed that channel busy time canbe used as a metric to predict congestion-related packetloss. We incorporate this insight into the design ofWOOF with the following enhancement to SampleRate.We use effective packet loss instead of the observedpacket loss for calculation of ETX and the resultingcalculation of ETT. Whenever we observe a packetloss, we associate a probability PCL that the loss wasdue to congestion. We then account for the fractionof packet loss that was not due to congestion in thecalculation of ETX. In other words, we weight everypacket loss proportionally to the probability that it wasnot a congestion-related loss.
EffectiveLoss = ObservedLoss · (1 − PCL)
For the calculation of PCL, we use the following equa-tion to capture the relationship between Channel BusyTime and packet loss:
PCL = β · CBTF
where CBTF represents Channel Busy Time Fractionand β represents the confidence factor, 0 ≤ β ≤ 1. TheCBT values are measured over intervals of time of sizeW seconds.
The confidence factor, β, is a measure of the degreeof correlation between CBTF and congestion-relatedpacket loss. The confidence factor is adaptively variedbased on the observed network performance. The valueof β is calculated as follows. At the end of eachmeasurement interval, W , we compare the performanceof rate adaptation in the current interval to that duringthe previous interval. The metric for performancecomparison is the transmission time consumed during
6
Authorized licensed use limited to: The University of Edinburgh. Downloaded on October 28, 2008 at 05:32 from IEEE Xplore. Restrictions apply.
the interval. To enable comparison of transmissions usinga diverse set of data rates, we normalize the measuredtransmission time with respect to the correspondingtime using a fixed data rate, e.g., 54 Mbps. If the metricindicates an improvement in performance in comparisonwith the previous interval of measurement, the value ofβ is increased in steps of 0.05. This increase in β modelsthe increased confidence in using CBTF to distinguishcongestion-related packet losses. Similarly, when themetric indicates a drop in performance, β is decreasedby 0.05. The confidence factor β enables WOOF toadapt to different network environments. In particular,this enables WOOF to ensure good performance (at leastas good as SampleRate) in situations of low SNR linksand high congestion. In Section VI-D, we examine theimpact of the measurement window, W , and its effecton the convergence time for β values. In Section VI-C,we evaluate the performance of WOOF under differentcombinations of link SNR and congestion levels.
D. Implementation
We implemented WOOF as a rate adaptation modulefor the MadWifi driver v0.9.2. We choose W=1s as thewindow of observation and recalibration. A large valueof W reduces the responsiveness to changes in the en-vironment utilization. Smaller values of W increase theprocessing load due to frequent recalibrations. We set theinitial value of β to 0.5. At each interval W , the drivercalculates the Channel Busy Fraction. In addition, thenormalized network performance, as described in Sec-tion V-C, and the value of β are updated at each interval.
VI. EVALUATION
We evaluate the performance of WOOF in twonetwork scenarios: a WLAN and a multihop meshnetwork. We first describe the experiments in theWLAN environment.
The WLAN scenario allows us to control theexperiment parameters and the environment. TheWLAN consists of one laptop acting as an AP and eightlaptops as client devices. Each laptop is equipped withan IEEE 802.11b/g radio based on the Atheros chipset.The laptops use Linux (kernel version 2.6) as their OSand MadWifi as the driver.
We compare the performance of WOOF against that ofSampleRate. Previous work has shown that SampleRateperforms better than ARF and AARF in most networkscenarios [13], [14]. Thus we expect WOOF to providebetter performance than ARF and AARF in all caseswhere WOOF performs better than SampleRate.In addition, for the WLAN we also compare theperformance against a scenario wherein the data rate ofthe client-AP link is fixed at the best possible rate. Thisscenario, called the StaticBest scenario, gives us anestimate of the upper-bound on the network performance.The best static rate is determined by running a simpleperformance test at each data rate immediately prior tothe corresponding tests with SampleRate and WOOF.
0
10
20
30
40
50
0 10 20 30 40 50 60
Net
wor
k Th
roug
hput
(Mbp
s)
Offerred Load (Mbps)
StaticBestWOOF
SampleRate
(a) Impact of network load.
0
10
20
30
40
50
0 1 2 3 4 5 6 7 8
Net
wor
k Th
roug
hput
(Mbp
s)
Number of Clients
StaticBestWOOF
SampleRate
(b) Impact of number of clients.
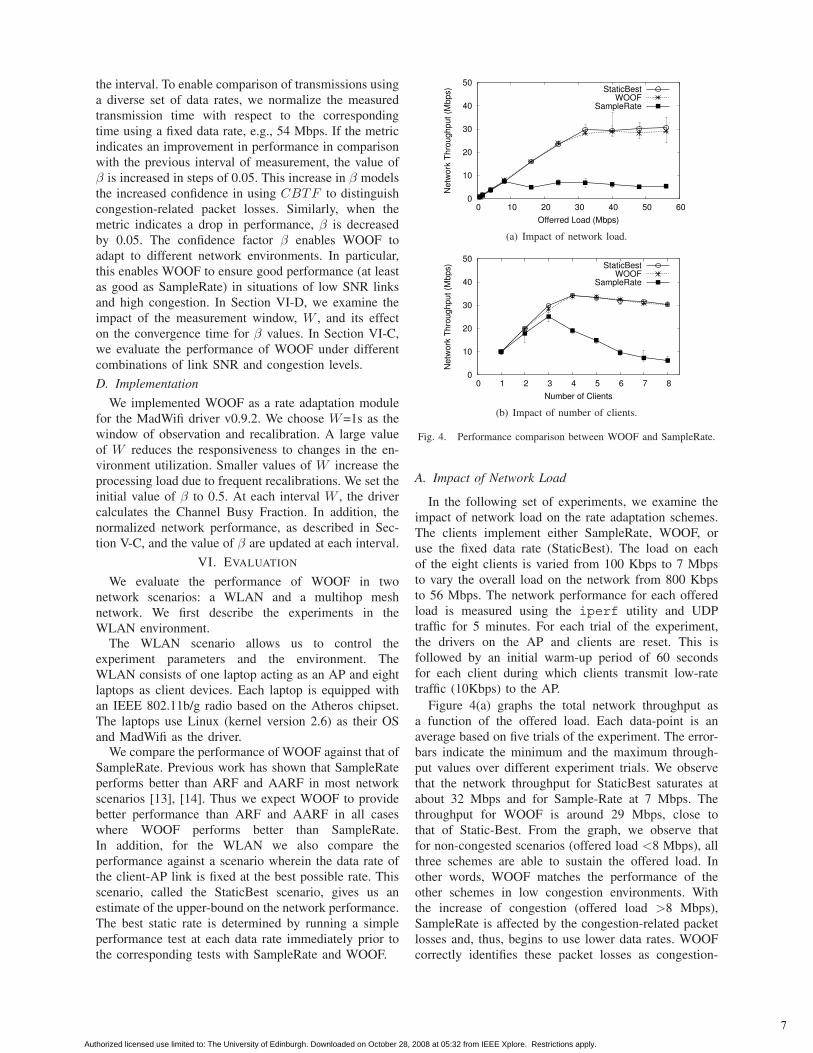
Fig. 4. Performance comparison between WOOF and SampleRate.
A. Impact of Network Load
In the following set of experiments, we examine theimpact of network load on the rate adaptation schemes.The clients implement either SampleRate, WOOF, oruse the fixed data rate (StaticBest). The load on eachof the eight clients is varied from 100 Kbps to 7 Mbpsto vary the overall load on the network from 800 Kbpsto 56 Mbps. The network performance for each offeredload is measured using the iperf utility and UDPtraffic for 5 minutes. For each trial of the experiment,the drivers on the AP and clients are reset. This isfollowed by an initial warm-up period of 60 secondsfor each client during which clients transmit low-ratetraffic (10Kbps) to the AP.
Figure 4(a) graphs the total network throughput asa function of the offered load. Each data-point is anaverage based on five trials of the experiment. The error-bars indicate the minimum and the maximum through-put values over different experiment trials. We observethat the network throughput for StaticBest saturates atabout 32 Mbps and for Sample-Rate at 7 Mbps. Thethroughput for WOOF is around 29 Mbps, close tothat of Static-Best. From the graph, we observe thatfor non-congested scenarios (offered load <8 Mbps), allthree schemes are able to sustain the offered load. Inother words, WOOF matches the performance of theother schemes in low congestion environments. Withthe increase of congestion (offered load >8 Mbps),SampleRate is affected by the congestion-related packetlosses and, thus, begins to use lower data rates. WOOFcorrectly identifies these packet losses as congestion-
7
Authorized licensed use limited to: The University of Edinburgh. Downloaded on October 28, 2008 at 05:32 from IEEE Xplore. Restrictions apply.

related and continues to use high data rates, resultingin better throughput.
B. Impact of the Number of Clients
We now examine the impact of contention in the net-work and study the network performance as the numberof clients increases. The experimental configuration issimilar to the one described in the previous section.In this case, however, we incrementally increase thenumber of clients associated with the AP from one toeight. Each client offers a load of 10 Mbps UDP traffic.
Figure 4(b) plots a graph of the total networkthroughput versus the number of clients in the network.At low contention levels (<4 clients), we observe that thethroughput of SampleRate increases almost linearly toreach a maximum of about 24 Mbps. Once the networkstarts to become congested (≥4 clients), however, theaverage throughput for SampleRate starts to drop. Witheight clients, the throughput for SampleRate is 7 Mbps.This drastic reduction in network throughput, about70%, is because, with increased contention, SampleRatereduces the data rate, adding to the congestion. Incontrast, the drop in throughput for WOOF is from33 Mbps to 30 Mbps, i.e. only a 10% reduction. We ob-serve that the throughput reduction for StaticBest is alsoabout 10%. Therefore, we conclude that the reductionin throughput is primarily due to actual packet losses.
C. Performance in Poor Link Conditions
We now conduct experiments to understand the per-formance of WOOF under different network conditions.In particular, we are interested in the scenarios whereinthe links are weak i.e., the SNR of received packetsis low. We conduct the experiments similar to that inSection VI-B. We consider four different combinationsof link SNR and congestion levels. The good SNR linkscenario has all of the client links with sufficient SNRto operate at 48 and 54Mbps. The low SNR scenariois acheived by increasing the physical distance betweenthe clients and the AP, and decreasing the transmit powerof all the radios. The StaticBest rates for the clients inthis scenario ranges between 2Mbps and 18Mbps. Wechose two congestion levels: low congestion correspondsto two clients with an offered load of 5Mbps each; highcongestion corresponds to eight clients with offered loadof 5Mbps each.
Low SNR High SNR
Low Congestion SampleRate: 0.79 SampleRate: 7.67WOOF: 0.73 WOOF: 7.45
High Congestion SampleRate: 0.55 SampleRate: 10.63WOOF: 0.79 WOOF: 23.04
TABLE IINETWORK THROUGHPUT (IN MBPS) UNDER DIFFERENT
COMBINATIONS OF SNR AND CONGESTION LEVELS.
Table II lists the network throughput in each of thescenarios for both SampleRate and WOOF. We see
that the performance of WOOF under low congestionscenarios are comparable to that of SampleRate. Duringhigh congestion, we observe that WOOF improves thenetwork throughput for both the SNR scenarios. There-fore, we conclude that WOOF provides performancegains in congested networks while having minimal im-pact in uncongested networks. Further, WOOF respondsappropriately when the link quality is poor by decreasingthe data rate to a rate more suitable to the poor linkquality.
D. Choice of Parameter W
We now explore the impact of using different valuesfor W , the interval of recalibration for WOOF. We usethe same experimental configuration as in Section VI-A.Each of the eight clients has an offered load of 10 Mbps.Table III shows the average network throughput fordifferent W values. We observe that for low W values,below 2s, the network throughput remains high and fairlystable. For W > 2s, we see that the throughput valuesdecrease. At high values of W , the throughput is com-parable to those obtained by SampleRate. A low valueof W enables WOOF to adapt to network conditionsquickly and obtain better performance. However, a lowvalue of W also increases the processing load on the rateadaptation algorithm and the device driver. A high valueof W makes WOOF less responsive to the environment.Based on these tradeoffs, we recommend a value ofW = 1s.
W (seconds) Throughput (Mbps)0.25 28.770.5 27.631 28.852 27.724 21.988 16.4416 14.9232 10.30
TABLE IIIIMPACT OF MEASUREMENT INTERVAL W.
Closely related to the choice of value of W is thenumber of recalibration cycles required for the β valueto stabilize in response to a change in the environment. Inour WLAN testbed we found that the median number ofcycles for β to stabilize is six. Similarly, in the MeshNetenvironment that we describe in the next section, themedian number of cycles was five. Together with W , thenumber of cycles for β to stabilize impacts the time delayfor WOOF to respond to a change in the environment(e.g. arrival of a new node in the network).
E. Performance in a Mesh Network
Having obtained insight into the different performanceaspects of WOOF in the WLAN environment, we con-duct a set of experiments in an uncontrolled meshnetwork. The purpose of the experiments is to understandthe performance of WOOF in real network deployments.
8
Authorized licensed use limited to: The University of Edinburgh. Downloaded on October 28, 2008 at 05:32 from IEEE Xplore. Restrictions apply.

0
2
4
6
8
10
12
0 1 2 3 4 5 6 7 8
Net
wor
k Th
roug
hput
(Mbp
s)
Flow Topology
SampleRate-UDPWOOF-UDP
SampleRate - TCPWOOF - TCP
Fig. 5. Network throughput with UDP and TCP for different flowtopologies in the UCSB MeshNet.
We conduct our experiments on the UCSB MeshNettestbed [17]. The MeshNet is an indoor multihop IEEE802.11 network with 25 dual-radio devices. For our ex-periments, we use a subset of these nodes connected to asingle gateway node. We use only one radio of each nodeoperating in the 802.11b/g mode. SRCR [18] is used asthe routing protocol. The physical distance between thenodes and the presence of barriers in the form of wallsand doors result in a majority of the links operating atlow data rates, even in the absence of competing traffic.
We study the performance of the network bymeasuring the sum of throughputs achieved by theindividual nodes in the network. To model the flowbehavior in a mesh network, all the flows originatefrom the gateway node. The number of flows and thedestination node for each flow is chosen randomly, butwe ensure that there are a minimum of three flows inthe network at all times. A combination of the selectednumber of flows and the corresponding destinationnodes constitutes a flow topology. The experiment isconducted for seven different flow topologies, and forboth SampleRate and WOOF. We repeat the experimentfor both TCP and 10 Mbps UDP flows.
Figure 5 compares the throughput of SampleRateand WOOF for these experiments. From the graph wesee that WOOF provides higher network throughput forboth UDP and TCP as compared to SampleRate. Themedian increase in throughput for UDP is 54.49%. Thethroughput gains for TCP, however, are less pronounced,with a median improvement of 20.52%. This behaviorcan be attributed to the dynamics of TCP congestioncontrol mechanisms and its sensitivity to packet loss.
VII. CONCLUSION
Congestion in an IEEE 802.11 network causes adrastic reduction in network performance. Critical totackling this problem is the ability to identify andmeasure congestion. In this paper we have presenteda passive technique that measures the utilization ofthe wireless medium in real-time. We then usedthe congestion measurement technique to develop arate adaptation scheme called WOOF. Performanceevaluation showed up to a three-fold gain in throughput
with the use of WOOF in a congested network. Inaddition to WOOF, we believe that our congestionmeasurement technique can be used to design newsolutions that perform well under congestion scenarios.For example, the CBT metric can be used for bandwidthestimation to facilitate effective flow admission control.
ACKNOWLEDGEMENT
The work in this paper is funded in part by NSF Wire-less Networks award CNS-07220275, NSF NeTS awardCNS-0435527 and a grant from the Intel Corporation.
REFERENCES
[1] A. P. Jardosh, K. Mittal, K. N. Ramachandran, E. M. Belding, andK. C. Almeroth, “IQU: Practical Queue-Based User AssociationManagement for WLANs,” in Proc. of MobiCom, Los Angeles,CA, Sep 2006.
[2] M. Rodrig, C. Reis, R. Mahajan, D. Wetherall, and J. Zahorjan,“Measurement-based Characterization of 802.11 in a HotspotSetting,” in Proc. of EWIND, Philadelphia, PA, Aug 2005.
[3] A. Jardosh, K. Ramachandran, K. Almeroth, and E. Belding-Royer, “Understanding Congestion in IEEE 802.11b WirelessNetworks,” in Proc. of IMC, Berkeley, CA, Oct 2005.
[4] Y. Hu and D. Johnson, “Exploiting Congestion Information inNetwork and Higher Layer Protocols in Multihop Wireless AdHoc Networks,” in Proc. of ICDCS, Tokyo, Japan, Mar 2004.
[5] (2006, Dec) OpenHAL - MadWifi. [Online]. Available: http://madwifi.org/wiki/openHAL
[6] C. Reis, R. Mahajan, M. Rodrig, D. Wetherall, and J. Zahorjan,“Measurement-Based Models of Delivery and Interference inStatic Wireless Networks,” in Proc. of SIGCOMM, Pisa, Italy,Sep 2006.
[7] A. Jardosh, K. Ramachandran, K. Almeroth, and E. Belding-Royer, “Understanding Link-Layer Behavior in Highly Con-gested IEEE 802.11b Wireless Networks,” in Proc. of EWIND,Philadelphia, PA, Aug 2005.
[8] X. Yang and N. Vaidya, “On the Physical Carrier Sense inWireless Ad Hoc Networks,” in Proc. of INFOCOM, Miami, FL,Mar 2005.
[9] G. Holland, N. Vaidya, and P. Bahl, “A Rate-Adaptive MAC Pro-tocol for Multi-Hop Wireless Networks,” in Proc. of MobiCom,Rome, Italy, Jul 2001.
[10] A. Kamerman and L. Monteban, “WaveLAN II: A High-Performance Wireless LAN for the Unlicensed Band,” Bell LabsTechnical Journal, vol. 2, no. 3, pp. 118–133, Aug 1997.
[11] M. Lacage, M. Manshaei, and T. Turletti, “IEEE 802.11 RateAdaptation: A Practical Approach,” in Proc. of ACM MSWiM,Venice, Italy, Oct 2004.
[12] J.Kim, S.Kim, S. Choi, and D.Qiao, “CARA: Collision-awareRate Adaptation for IEEE 802.11 WLANs,” in Proc. of INFO-COM, Barcelona, Spain, Apr 2006.
[13] J. Bicket, “Bit-rate Selection in Wireless Networks,” Master’sthesis, Massachusetts Institute of Technology, 2005.
[14] S. H. Y. Wong, S. Lu, H. Yang, and V. Bharghavan, “Robust RateAdaptation for 802.11 Wireless Networks,” in Proc. of MobiCom,Los Angeles, CA, Sep 2006.
[15] D. S. J. De Couto, D. Aguayo, J. Bicket, and R. Morris, “AHigh-Throughput Path Metric for Multi-hop Wireless Routing,”in Proc. of MobiCom, San Diego, CA, Oct 2003.
[16] K. Ramachandran, H. Kremo, M. Gruteser, P. Spasojevic, andI. Seskar, “Experimental Scalability Analysis of Rate AdaptationTechniques in Congested 802.11 Networks,” in Proc. of WoW-MoM, Helsinki, Finland, Jun 2007.
[17] H. Lundgren, K. Ramachandran, E. Belding-Royer, K. Almeroth,M. Benny, A. Hewatt, A. Touma, and A. Jardosh, “Experiencesfrom the Design, Deployment, and Usage of the UCSB MeshNetTestbed,” IEEE Wireless Communications, vol. 13, no. 2, pp. 18–29, Apr 2006.
[18] J. Bicket, D. Aguayo, S. Biswas, and R. Morris, “Architecture andEvaluation of an Unplanned 802.11b Mesh Network,” in Proc.of MobiCom, Cologne, Germany, Aug 2005.
9
Authorized licensed use limited to: The University of Edinburgh. Downloaded on October 28, 2008 at 05:32 from IEEE Xplore. Restrictions apply.