conference proceedings by track - oakland … jin, valparaiso university sourish sarkar, penn state...
TRANSCRIPT

CONFERENCE PROCEEDINGS BY TRACK
2016 MIDWEST DSI ANNUAL CONFERENCE
VALPARAISO UNIVERSITY, INDIANA
CONFERENCE THEME: BIG DATA ANALYTICS
CONFERENCE CO-CHAIRS:
CEYHUN OZGUR, VALPARAISO UNIVERSITY
SANJAY KUMAR, VALPARAISO UNIVERSITY
LOCAL ARRANGEMENT COORDINATOR
COLEEN WILDER, VALPARAISO UNIVERSITY
PROCEEDINGS COORDINATOR
SANJEEV JHA, VALPARAISO UNIVERSITY

2
2016 MWDSI CONFERENCE – TRACK CHAIRS
Supply Chain Management
Janet Hartley, Bowling Green State University
Operations Management/ Research Eugene Fliedner, Oakland University
Innovative Education and Student papers
Xiaodong Deng, Oakland University
Marketing Sports Management, Business Law, & Ethics
Elizabeth Gingerich, Valparaiso University
Business Analytics
David Booth, Kent State University
Information Systems/Technology
Sanjeev Jha, Valparaiso University
Finance & Accounting
Jiangxia Liu, Valparaiso University
Entrepreneurship & Management
Joseph Trendoski, Valparaiso University
Health Care Management
Jeffrey A Cotto, Valparaiso University

3
BEST PAPER AWARDS
BEST CONFEREENCE PAPER AWARD
On the Discovery and Use of Disease Risk Factors with Logistic Regression: New Prostate
Cancer Risk Factors David E. Booth, Kent State University
Venugopal Gopalakrishna – Remani, University of Texas – Tyler
Matthew Cooper; Washington University School of Medicine
Fiona R. Green, University of Manchester
Margaret P. Rayman, University of Surrey BEST CONFERENCE PAPER AWARD An Analysis of Factors Influencing the Stock Market Impact from Supply Chain Disruptions Sanjay Kumar, Valparaiso University
Jiangxia Liu, Valparaiso University
Zhenhu Jin, Valparaiso University
Sourish Sarkar, Penn State University- Erie
BEST INNOVATIVE EDUCATION PAPER AWARD
MatLab vs. Python vs. R Taylor Colliau, Valparaiso University
Grace Rogers, Valparaiso University
Zachariah Hughes, Valparaiso University
Ceyhun Ozgur, Valparaiso University
BEST STUDENT PAPER AWARD
Evaluating Sepsis Guidelines and Patient Outcomes Grace Rogers, Valparaiso University
Jeffrey A. Coto, Valparaiso University
Ceyhun Ozgur, Valparaiso University
Christine Langellier, Riverside Medical Center
Sarah Kavanaugh, Valparaiso University
STAN HARDY AWARD
Does a Supplier’s Operational Competence Translate into Financial Performance? An Empirical
Analysis of Supplier–Customer Relationships, Decision Sciences Journal, Vol (46), No. 1, 2015
Yoon Hee Kim, Western University, London, ON, Canada
Urban Wemmerlöv, University of Wisconsin-Madison, WI

4

5
TABLE OF CONTENTS BUSINESS ANALYTICS
Variable Selection: A Case of Bank Capital Structure Determinants Nonna Sorokina, Wake Forest University
David Booth, Kent State University …………………………………………………………………………………. 7
On the Discovery and Use of Disease Risk Factors with Logistic Regression: New Prostate
Cancer Risk Factors David E. Booth, Kent State University
Venugopal Gopalakrishna – Remani, University of Texas – Tyler
Matthew Cooper; Washington University School of Medicine
Fiona R. Green, University of Manchester
Margaret P. Rayman, University of Surrey ………………………………………………………………………… 27
An Analysis of Big Review Data and their Usefulness to Viewers In Lee, Western Illinois University ………………………………………………………………………………….45
MatLab vs. Python vs. R, Taylor Colliau, Valparaiso University
Grace Rogers, Valparaiso University
Zachariah Hughes, Valparaiso University
Ceyhun Ozgur, Valparaiso University……………………………………………………………………………….59
HEALTH CARE MANAGEMENT
An Exploratory Study of Patient Falls Jeffrey A. Coto, Valparaiso University
Coleen Wilder, Valparaiso University
Lynn Carlson, OSF Healthcare – Rockford, IL …………………………………………………………………….71
Evaluating Sepsis Guidelines and Patient Outcomes Grace Rogers, Valparaiso University
Jeffrey A. Coto, Valparaiso University
Ceyhun Ozgur, Valparaiso University
Christine Langellier, Riverside Medical Center
Sarah Kavanaugh, Valparaiso University ………………………………………………………………………….88
INFORMATION SYSTEMS/ TECHNOLOGY
An Exploration of Intended Use of Augmented Reality Smart Glasses Philipp A. Rauschnabel, University of Michigan – Dearborn …………………………………………………...98
Jun He, University of Michigan – Dearborn
Young Ro, University of Michigan – Dearborn

6
Social Commerce and Trust in Social Media Hongjiang Xu, Butler University ……………………………………………………………………………….123
ENTREPRENEURSHIP & MANAGEMENT
Narcissism and Decision Making in Organizations Scott David Williams, Wright State University
Jonathan Rountree Williams, Duke Leadership ………………………………………………………………..130
OPERATIONS MANAGEMENT
Applying Decision Utility to Solve Problems with Limited Resources in Parks and Police
Management Ceyhun Ozgur, Valparaiso University ………………………………………………………………………....148
The Emergence of Lean Accounting Gene Fliedner, Oakland University …………………………………………………………………………....160
SUPPLY CHAIN MANAGEMENT
An Analysis of Factors Influencing the Stock Market Impact from Supply Chain Disruptions Sanjay Kumar, Valparaiso University
Jiangxia Liu, Valparaiso University
Zhenhu Jin, Valparaiso University
Sourish Sarkar, Penn State University- Erie …………………………………………………………………..173

7
Variable selection: a case of bank capital structure determinants
Nonna Y. Sorokina
Wake Forest University
383 Farrell Hall, 1834 Wake Forest Rd.
Winston Salem, NC 27106
phone: 336-758-6177
e-mail: [email protected]
David E. Booth
Kent State University
595 Martinique Circle
Stow, OH 44224
phone: 330-945-8306
e-mail: [email protected]
This Draft: February 14, 2016
Keywords: Variable Selection, Adaptive Lasso, Outliers, Robust regression, Fixed Effects, Bank
Capital, Leverage
Abstract
Banks are extremely highly levered due to the nature of their business model and bank capital
serves as a source of stability and protection of the society from abuse of the government support
(aka safety net). As a result, bank capital is heavily regulated. However, there are economic
reasons that prompt banks to hold capital beyond the regulatory requirements. Understanding
those reasons is very important for the efficiency in banking regulation, for the risk management
of the banks, and for investors’ and customers’ assessment of the bank’s soundness. We study
the determinants of bank capital structure using several variable selection methods. We show
how every method is appropriate for the right purpose. However, it is essential to ensure that
assumptions of the methods are satisfied. We use lasso variable selection and estimation method
that is not robust to outliers. To overcome the limitations of this powerful technique, we study
samples of banks with only outliers and samples without outliers separately. We find substantial
differences in the drivers of capital decisions of bank-outliers. The findings uncover moral
hazard effect among Systematically Important Financial Institutions.

8
Variable selection: a case of bank capital structure determinants.
1. Introduction
Empirical researchers in business disciplines often rely on theoretical conjectures and statistical
significance of the independent variables in various regression models as a method of variable
selection. Corporate finance is no exception with recent trend leaning towards variables
significant in models with fixed effects, which are well known as an aid against endogeneity, a
common issue in corporate finance research.
The choice of variable selection method, though, should depend on the purpose of the research.
Shmueli (2010) classifies models into explanatory, predictive and descriptive. An explanatory
model is best for testing causal explanations of a dependent variable; independent variables are
heavily grounded in theory. Predictive models are focused on achieving the practical goal of
reliable new or future observations forecasting. Descriptive models are intended for explaining
an effect in a compact manner. Both predictive and descriptive models disregard the theoretical
basis for independent variables. A model, selected based on contribution to information criterion,
is rather a descriptive model.
We perform the study of bank leverage determinants. Studies of capital structure constitute a
significant part of the corporate finance literature. However, banks are routinely excluded from
such studies, under the assumption that regulatory capital requirements are the most important
determinant of bank leverage. We test empirically the determinants of bank capital structure in a
large sample of the publicly traded U.S. commercial banks and bank holding companies during
the period of 1973-2012 and find that the determinants of bank capital structure are similar to
those identified in prior literature for non-financial firms. However, the determinants vary in
different regulatory capital requirement regimes. Application of the various regression methods
and lasso – a variable selection tool and multicolinearity-robust estimator allows us to test
theoretical propositions and to come up with a compact descriptive model of the strongest
explanatory factors. Interestingly, lasso helps to uncover evidence of moral hazard in the capital
structure of Systematically Important Financial Institutions (SIFIs) demonstrating that their
capital structure is independent of risk and collateral.
2. Literature and Methodology.
This research is largely inspired by the work of Gropp and Heider (2010), which serves as a
starting point for the experimental design development. According to Gropp and Heider,
traditionally, financial firms were excluded from the empirical capital structure literature.
Empirical studies of banks’ capital structure were considered unnecessary, since leverage of all
banks was, supposedly, determined by regulatory capital requirements. Gropp and Heider study
100 largest U.S. and 100 largest E.U. banks empirically and show, in contrast to common belief,
the substantial variation in equity capital ratios of the banks in their sample. Further, they
demonstrate plausibility of some of the leverage determinants, borrowed from the general capital
structure literature for explaining banks’ leverage. Gropp and Heider find that the most reliable
factors of non-financial firms’ leverage, determined by Frank and Goyal (2009), are similarly
significant for the leverage of the banks’ in their sample.

9
We extend Gropp and Heider’s tests to a broader sample of U.S. banks, as described in the
“Data” section. The leverage ratios of banks in our sample vary significantly, as in Gropp and
Heider’s, supporting the potential presence of discretionary capital, which is determined
independently from capital requirements. We also extend the period of study back to 1973, to
include time without uniform capital requirements (Pre-Uniform) with uniform capital
requirements, but no risk-weighting of assets (Pre-Basel), and time since the initial Basel Accord
implementation (Basel). The determinants of leverage are likely not the same across different
bank capital regulation regimes. At the time of Pre-uniform and even Pre-Basel capital
regulation, different categories of banks were treated more or less differently. In the most recent
version of Basel, Basel III, special attention is devoted to SIFIs (Systematically Important
Financial Institutions). We test all banks and SIFIs separately within a framework of three bank
capital regulation regimes.
The original results for all specifications are obtained using Ordinary Least Square (OLS) and
the estimator robust to outliers (M-Estimator) of Huber (1973). The results are further confirmed
by including time and bank fixed effects to mitigate endogeneity issues resulting from the usual
presence of unobserved explanatory variables, correlated with independent variables included in
the model. The outlier analysis and variance inflation factor inspection is performed on all
regressions for the proper treatment of the potential data irregularities and multicollinearity. The
adaptive lasso method of Zou (2006) produces properly estimated coefficients, adjusted for
multicollinearity, and provides the best predictive variables selection.
Frank and Goyal (2009) cite Hastie et al. (2001), as a source of their variable selection method.
Following more recent literature on variable selection methods, we use a similar, yet more
powerful, modern version of the model – adaptive lasso for linear regression models with
weighted approach by Zou (2006). The adaptive lasso combines the benefits of greater variable
selection accuracy and estimation precision. The procedure uses SBC criterion along with other
information criterion measures, such as BIC and AIC, reported in Frank and Goyal. The lasso
method is not robust to outliers; therefore, outliers have to be separated for proper estimation.
When a variable of interests is selected as significant, and estimated with the same sign and
similar size in both datasets, with and without outliers, we can comfortably conclude that a
variable is similarly significant for all observations in our sample. When a variable of interest is
selected as a significant predictor in a dataset without outliers, but not selected in a dataset with
outliers, or vice-versa, or it changes sign, or the size is substantially different then the variable’s
significance is not the same for all banks. Conclusions drawn from results for a dataset without
outliers, apply to the majority of banks in a sample. Conclusions drawn from results for a dataset
with outliers only, apply to selected banks in a study sample. We compare banks’ characteristics
in samples with outliers only and without outliers as a next step. If an obvious pattern can be
inferred from a difference in summary statistics, we learn additional information on a correlation
between a variable of interest and leverage. If both groups carry similar summary statistics of
variables, further analysis of individual observations, identified as outliers, has the potential to
uncover interesting facts about individual banks (see, for example, Booth (1982)).
Many of the independent variables in our models are strongly related economically and
sometimes correlated statistically. We am concerned with the potential multicollinearity issue in
the models. Multicollinearity in a multivariable regression model leads to misattribution of an

10
effect between variables. An entire model may retain its explanatory power, however, as a result
of multicollinearity, size, sign and/or statistical significance of individual estimated coefficients
may not be reliable. Traditionally, variance inflation factors (VIFs) analysis shows how much
coefficients increase as a result of multicollinearity; the VIFs-based adjustments also help in
estimating correct coefficients. The ridge regression method by Hoerl and Kennard (1970) is a
trusted consistent estimator in datasets with multicollinearity. While ridge regression produces
reliable coefficients, a correct selection of independent variables that carry most information
about a dependent variable is also important. Tibshirani (1996) develops lasso, a regression
method that combines both the benefits of information on criterion-based variable selection and
ridge regression. We check VIFs in the estimated models and find that VIFs (not tabulated) in
most cases remain within an acceptable range, below 5. The commonly accepted threshold of
VIF=10 was defined by Marquardt (1970). However, there is a substantial debate in statistical
literature regarding the methodology of multicollinearity diagnostics, mostly between Marquardt
and Belsley - see for example Snee and Marquardt (1984) for details. Although multicollinearity
does not appear to be an issue, per the Marquardt’s rule of thumb, a proper variable selection and
estimation is of most critical importance in our study - an attempt to choose the most reliable
variables among many determinants of capital structure. Lasso, a regression method combining a
well-established variable selection procedure based on information criteria and a robust
coefficient estimation method, appears to be very appropriate and reliable addition to the
methodology.
Based on the underlying empirical and theoretical research on bank leverage determinants, we
develop and test the following hypothesis:
Hypothesis I: Market-to-book, Profit, Size, Tangibility, Dividends and Risk are significant
determinants of leverage in the broad sample of US banks;
Hypothesis II: the size and sign of the corresponding coefficients are similar to the results of
Gropp and Heider (2010) based on their sample of the largest U.S. and European banks;
Hypothesis III: risk is not a significant determinant of leverage for SIFIs due to implied
guarantee; other coefficients in SIFIs’ specifications are different in size and significant when
compared to the results in all-banks’ specifications.
Following Gropp and Heider (2010), we use a core model of leverage determinants with the
addition of risk. We test all banks/SIFIs in three bank capital regulation periods, as previously
defined. Pre-Uniform, all banks (Specification 1) / Pre-Basel regulation, all banks (Specification
2) / Basel regulation, all banks (Specification 3); Pre-Uniform, SIFIs (specification 4) / Pre-Basel
regulation, SIFIs (specification 5) / Basel regulation SIFIs (specification 6).
Leverage = β0+ β1MTB + β2Profit + β3Size + β4Collateral + β5Dividend + β6Risk + u (1-6)
All variables in this and further models are specified in Table 1. Following Frank and Goyal
(2009), the explanatory variables in this and further models are lagged 1 year.
3. Data
We use COMPUSTAT North America and COMPUSTAT Bank as sources of firm-specific
information, CRSP for the stock-related data. The details of the underlying data elements for
each variable are provided in Table 1. The broad sample covers forty years of quarterly data
between 1973 and 2012. The quarterly data since 1962 is available in COMPUSTAT, but market

11
data on NASDAQ firms, including a significant number of banks, is available in CRSP starting
December 1972 only. We include a significant period with no uniform capital requirements for
U.S. banks (prior to 1980), to cover various capital requirements regimes in the U.S. Many data
elements, sourced from COMPUSTAT datasets are available for 81,619 firm-quarter
observations over the full data period 1973-2012. The full dataset includes a significant number
of missing observations. We limit the underlying data for the regressions to the records with non-
missing positive major variables: book (market) total leverage, market total leverage, market-to-
book, log size and collateral, and non-missing, non-zero profitability (including both positive and
negative readings). The resulting dataset consists of 57,583 bank-quarter observations, 1,714
unique banks. The summary statistics of this dataset is presented in Table 2.
4. Results
In Table 3, we present the results of specifications 1-6 (core model with risk) in three periods of
bank capital regulation: no uniform requirements period (specifications 1 for all banks and 4 for
SIFIs), uniform requirements with no risk-weighting (specifications 2 for all banks and 5 for
SIFIs), risk-weighted capital requirements (specifications 3 for all banks and 6 for SIFIs). We
confirm that MTB, profitability, size, collateral, dividends and risk are significant determinants
of leverage for a typical bank in our sample in the Basel regulation period. Collateral and risk are
positively correlated with leverage, while other variables - negatively. There are differences in
estimates of OLS and robust regression. In the book leverage specification, the all banks sample,
profitability and size only gain significance in robust estimates. For SIFIs, in the Pre-Uniform
period, profitability loses significance in robust estimates. In the Pre-Basel period, collateral,
dividend dummy and risk are only significant in robust estimates. In market leverage-based
specifications, the all banks sample in the Pre-Uniform period, size and dividend become
insignificant, while collateral becomes significant in robust regression estimates. In the Pre-
Uniform period, the sample of SIFIs, risk becomes insignificant in robust estimates, but gains
significance in the Basel period.
The results of lasso are presented in Table 4 (book leverage) and Table 5 (market leverage).
Lasso models are sensitive to outliers. Therefore, we separately apply lasso to the samples with
outliers only and samples without outliers. We report multicollinearity-robust coefficients
selected by lasso and the corresponding SBC (Schwarz Bayesian Information Criterion) of the
model, as it increases with the addition of each subsequent variable. The selection process stops
when an information criterion of the model reaches an optimal threshold and the addition of new
variables does not substantially improve the predictive power of a model anymore. Only
variables that contribute most to a model’s predictive power are selected by lasso.
In the Basel regulation period, for the broad sample of banks, all six variables are selected in
both book and market leverage specifications. At the same time, in the sample with outliers, only
market leverage is determined by all six variables. The book leverage only depends on collateral
and risk. In contrast, in the Pre-Basel regulation period, book leverage is determined by
collateral, size, market-to-book and risk for a typical bank, and only by market-to-book for
outliers. In the market leverage-based specification, we observe the opposite – all six variables
are significant in the sample of outliers, and only profit is statistically significant in explaining
the market leverage of a typical bank (sample without outliers). The results are much more

12
uniform for the period before standardized capital regulation: in a broad sample, all variables but
dividend dummy add explanatory power to the model. Market leverage only depends on market-
to-book and profit for all banks. There must be some unobserved time-varying factor responsible
for differences in leverage determinants in the Pre-Basel period. Many variables remain
insignificant in a fixed effects specification when time-specific unobserved components are
isolated. Possibly, an introduction of uniform capital requirements was an overriding factor
itself. The new uniform capital requirements might dominate in banks’ leverage decisions
initially, thus creating a perception of bank capital structure being solely determined by capital
regulation. In that case, introduction of Basel, and risk-weighted capital requirements, may have
relaxed a capital structure decision dependency on regulatory requirements.
The results of lasso selection for the sample of SIFIs are presented in Table 6 (book leverage)
and Table 7 (market leverage). They differ significantly across all regulatory environments. In
the Pre-Basel sample, none of the six variables are selected as a significant determinant of book
leverage. However, market leverage is explained by profit, collateral, market-to-book and risk
for a typical SIFI observation. Only profit and size matter for market leverage of an outlier. In
the earlier period, with no uniform capital regulation, collateral, market-to-book and profit
explain book leverage in the “clean” sample, while only collateral is significant for outliers. In
the Basel capital regulation period, all variables in the specification but dividend dummy,
contribute to explanatory power of the book leverage model for the “clean” sample, while only
size is important for outliers. Profit, market-to book and size contribute most to the explanatory
power of the market leverage model for both outliers and non-outliers. Collateral is somewhat
important for outliers only. Lasso results confirm that leverage decisions neither depend on risk
nor collateral for a typical SIFI in both recent times and in earlier periods. The Pre-Basel period
appears to be transitional for bank leverage determinants, possibly due to the introduction of
uniform capital requirements, as discussed above.
It is now important to understand how outliers and high leverage data points differ from their
majority population counterparts. The comparative summary statistics are presented in Table 8
and Table 9. In the sample of all banks (Table 8), the mean and median values of book leverage
are very similar in both subsamples, with outliers only and without outliers, before the
introduction of risk weighted capital requirements. In the Basel regulation period, outliers are, on
average, less levered; the market leverage mean and median in two samples is similar. The
market-to-book ratio of outliers is, on average, higher in the Basel period. The mean, but not
median, value of profitability of the outliers is higher than profitability of a typical bank in the
Basel regulation period. The banks in the outliers sample were slightly smaller, in terms of assets
size, during the first two regulatory regimes. In the Basel period, banks in the outliers sample are
larger in terms of assets. The outliers possess less collateral in the two recent periods of Pre-
Basel and Basel regulation, in contrast to the period without standard capital requirements, when
outlier banks hold more collateral. There is no striking pattern in the summary statistics of the
outliers that differentiates them from non-outlier observations in the dataset. It means that
different correlations between core factors and leverage for the banks in the outliers sample are
not due to differences in those core factors. More information can be derived from detailed bank-
specific analysis, which can be a great extension to this study. We only focus on patterns,
relevant for a large number of observations.

13
In the sample of SIFIs (Table 9), book and market leverage of outliers is lower across all periods.
The market-to-book value of outliers is only lower in the period before standard capital
regulation; later it gets higher than the MTB of a typical SIFI. Outliers were small in the first two
periods, before Basel when they catch up in size with the majority population. The collateral of
outliers is larger across the first two periods. Some outliers do not pay dividends, with the
number of dividend payers increasing substantially between the period without standard capital
requirements and the pre-Basel period, and coming back down slightly in the Basel period.
Outliers among SIFIs are less risky, especially during the Basel regulation time.
Finally, we estimate the model with bank and year fixed effects. The results are presented in
Table 10. The fixed effects model results strongly support the feasibility of the general core
model of leverage for banks. All six variables, MTB, profit, size, collateral, dividend and risk are
statistically significant determinants of book and market leverage in the most recent period of
risk-weighted capital requirements (Basel) for the broad sample of banks.
5. Conclusions
We use the model of core leverage factors, identified by Frank and Goyal (2009) as the most
reliable determinants of a non-financial firms’ capital structure, adjust the model similarly to
Gropp and Heifer (2010) and apply it to the broad sample of the U.S. banks over the long period
of 1973-2012. The period covers different capital regulation regimes: no uniform capital
requirements, uniform requirements, based on total capital (without risk adjustment), and the
Basel period of risk-adjusted capital requirements. We confirm that the core model is plausible
for this sample and the results are consistent with Gropp and Heider (2010). However, the
results differ across regulatory regimes. The significant differences are observed in the sample of
SIFIs. The risk and collateral factors lost their importance as leverage determinants during the
most recent time period. The results are consistent with the moral hazard concept.
We use various regression methods in our study to emphasize that different variable selection are
available to researchers in the business fields of study and they are all appropriate for their
specific purpose. However, data irregularities must be properly treated for any method to ensure
that assumptions are met and results are valid. We demonstrate, based on the case of bank
leverage determinants, how separating outliers from non-outlier observations help supporting a
significance of theoretically grounded effects for the explanatory models. We also show that
well-known and well-implemented methods, such as panel regression with fixed effects, while
alleviating valid concerns of endogeneity, may simultaneously rob us from the valuable
information that is filtered out along with noisy effects. Lasso, when applied to the datasets with
and without outliers separately, provides parsimonious compact model estimates, and uncovers
interesting economic effects, otherwise hidden in the one-size-fits-all estimates that work for the
whole sample on average.

14
Table 1.Variable definitions.
The letter-coded names in parenthesis, such as (AT), (DLC), etc. in this table are COMPUSTAT
field names.
Name Description Source
Leverage
Market leverage
The ratio of total debt (debt in current
liabilities (DLC) + long-term debt
(DLTT)), to market value of assets (MVA).
MVA is the sum of the market value of
equity (price-close (PRCC) × shares
outstanding (CSHPRI)) + debt in current
liabilities (DLC) + long-term debt (DLTT)
+ preferred-liquidation value (PSTKL) –
deferred taxes and investment tax credit
(TXDITC)
Frank, Goyal (2009)
Book leverage
The ratio of total debt (debt in current
liabilities (DLC) + long-term debt (DLTT))
to assets (ATQ).
Short Term Leverage
The ratio of short-term borrowing = Total
Assets (ATQ) – Shareholder’s Equity
(SEQQ) - Long-Term Debt (DLTTQ)–
Deposits (DPTCQ) to assets (ATQ)
MTB Market-to-Book ratio. MVA to Compustat
item 6, assets. MVA is obtained as the sum
of the market value of price-close (PRCC)
× shares outstanding (CSHPRI))+ short-
term debt (DLC) + long-term debt (DLTT)
+ preferred-liquidation value (PSTKL) −
deferred taxes and investment tax credit
(TXDITC)
Frank, Goyal (2009)
Profit Profitability, the ratio of operating income
before depreciation(OIBDP) and assets
(AT)
Frank, Goyal (2009)
Ln (Size) Log of assets log of assets (ATQ) Frank, Goyal (2009)
Collateral (Banks) (total securities + treasury bills + other
bills + bonds + CDs + cash and due from
banks + land and buildings + other tangible
assets)/book value
of assets
Gropp, Heider (2010)

15
Dividend Dummy variable, equal to 1 when firm
pays dividends and 0 otherwise. (based on
COMPUSTAT item cash dividends
declared on common stock DVCY for
banks or CDVCY for all firms)
Frank, Goyal (2009)
Risk (LogRiskM) Annual variance of stock returns (based on
CRSP stock returns)
Frank, Goyal (2009)

16
Table 2.Summary statistics of the sample
Variable Mean Median Std Dev Minimum Maximum
BookLevTotalLead1Y 0.8901787 0.8998736 0.0955702 0.000116949 20.0833333
MktLevTotalLead1Y 0.8814244 0.8885571 0.0680097 0.000858277 1
MTB 0.2625157 0.2441232 0.123442 0.000610571 2.5271803
Profit 0.0058798 0.0055938 0.0046373 -0.1050478 0.1215623
LogSize 7.4261925 7.1961434 1.7391131 1.9273097 15.1711322
Collateral 1.061523 1.0581828 0.1919135 0.0292476 2.4840293
Dividend 0.7353559 1 0.4411473 0 1
LogRiskM -5.2995653 -5.3284475 1.0169245 -12.1732848 0.2413316

17
Table 3. Classic determinants of capital structure in various regulatory environments, all banks
and SIFIs.
Panel A: All banks, Book leverage (Spec 1-3)
Pre-Uniform
Pre-Uniform
Robust M
Pre-
Basel
Pre-Basel
Robust M Basel
Basel
Robust M
Intercept 0.91095 *** 0.9276 *** 0.94357 *** 0.9671 *** 0.89596 *** 0.9103 ***
MTB 0.00837
-
0.0054
-0.16884 ***
-
0.0181 ***
-
0.01844 ***
-
0.0107 ***
Profit
-
3.39786 ***
-
3.4393 *** 0.05909
-
0.7317 ***
-
1.61548 ***
-
1.0103 ***
LogSize
-
0.00598 ***
-
0.0064 *** 0.000608
-
0.0052 ***
-
0.00367 ***
-
0.0012 ***
Collateral 0.05841 *** 0.0504 *** 0.01758 *** 0.0218 *** 0.04504 *** 0.0192 ***
Dividend 0.00167 ** 0.0017 ** -0.00398 ** -0.007 *** 0.00762 ***
-
0.0017 ***
LogRiskM 0.00177 *** 0.0018 *** 0.00437 *** 0.0046 *** 0.00379 *** 0.0028 ***
R2 0.2203
0.2233
0.1533
0.1363
0.0234
0.0404
Adj R2 0.2192
0.1523
0.0233
N obs 4280
4280
4782
4782
48355
48355
Panel B: SIFIs, Book leverage (Spec 4-6)
Pre-Uniform
Pre-Uniform
Robust M
Pre-
Basel
Pre-Basel
Robust M Basel
Basel
Robust M
Intercept 0.86791 *** 0.8604 *** 0.76011 *** 0.7499 *** 1.11745 *** 1.0556 ***
MTB
-
0.04159 ***
-
0.0459 *** -0.05634 ***
-
0.0587 *** 0.06049 *** 0.027 ***
Profit -1.2858 **
-
0.6974
-1.61401 ***
-
1.6366 *** -1.2287 ***
-
0.8189 ***
LogSize
-
0.00099
-
0.0003
0.00693 *** 0.0076 ***
-
0.02518 ***
-
0.0184 ***
Collateral 0.05472 *** 0.0555 *** 0.06422 *** 0.0659 *** 0.00901
0.0142 ***
Dividend 0.00132
0.0014
-0.00068
-
0.0005
-0.0066
-
0.0128 ***
LogRiskM 0.00101
0.0012
-0.00469 **
-
0.0053 ***
-
0.00161
-
0.0023 ***
R2 0.3067
0.2964
0.2324
0.2313
0.4535
0.3499
Adj R2 0.2932 0.2165 0.4507
N obs 315 315 298 298 1149 1149

18
Table 3. Continued
Panel C: All banks, Market leverage (Spec 1-3)
Pre-Uniform
Pre-Uniform
Robust M Pre-Basel
Pre-Basel
Robust M Basel
Basel
Robust M
Intercept 0.97946 *** 0.9996 *** 1.02043 *** 1.0399 *** 1.03694 *** 1.0538 ***
MTB -0.04333 ***
-
0.0273 ***
-
0.29221 ***
-
0.1458 *** -0.22222 ***
-
0.1962 ***
Profit -5.48682 ***
-
7.7471 ***
-
2.03499 ***
-
5.9047 *** -3.21735 ***
-
4.3656 ***
LogSize 0.000972 *** 0.0003
0.00906 *** 0.0039 *** 0.0018 *** 0.0013 ***
Collateral -0.00143
-
0.0047 **
-
0.06768 ***
-
0.0581 *** -0.05834 ***
-
0.0606 ***
Dividend 0.00213 ***
-
0.0001
-
0.00266 *
-
0.0029 ** 0.00215 ***
-
0.0018 ***
LogRiskM 0.000364
0.0004
0.00349 *** 0.0026 *** 0.00735 *** 0.0083 ***
R2 0.2658
0.2779
0.4285
0.2762
0.25
0.228
Adj R2 0.2647
0.4278
0.2499
N obs 4280
4280
4782
4782
48355
48355
Panel D: SIFIs, Market leverage (Spec 4-6)
Pre-Uniform
Pre-Uniform
Robust M Pre-Basel
Pre-Basel
Robust M Basel
Basel
Robust M
Intercept 0.96651 *** 0.9666 *** 1.05404 *** 1.0978 *** 0.89237 *** 0.9199 ***
MTB -0.02931 *
-
0.0283 ** -0.2068 *** -0.145 ***
-
0.33801 ***
-
0.2987 ***
Profit -9.7194 ***
-
9.5259 ***
-
7.76607 *** -13.6275 ***
-
5.26382 ***
-
6.4273 ***
LogSize 0.00303 *** 0.0032 *** 0.00628 *** 0.002
0.01146 *** 0.0092 ***
Collateral -0.00865
-
0.0054
-
0.07653 *** -0.0617 *** 0.00343
0.0045
Dividend 0.00138
0.0021
0.03332 *** 0.031 ***
-
0.00993
-
0.0088
LogRiskM -0.00273 ***
-
0.0016
0.00896 *** 0.009 *** 0.00156
0.0029 **
R2 0.4813 0.4743 0.5615 0.49 0.5465 0.4061
Adj R2 0.4711 0.5524 0.5441
N obs 315 315 298 298 1149 1149

19
Table 4. Determinants of book leverage in broad sample of banks: lasso selection
Pre-Unifrom Pre-Basel Basel
Variable estimate SBC variable Estimate SBC variable estimate SBC
Panel A: excluding outliers and high leverage data points
Intercept 0.933243 -26193.229 Intercept 0.920082 -27566.671 Intercept 0.895879 -286441.38
Collateral 0.051746 -26502.101 Collateral 0.039737 -27755.699 Profit -1.682741 -286491.75
LogSize -0.007101 -26676.383 LogSize -0.004554 -28361.005 Collateral 0.020012 -286585
Profit -4.451077 -27106.327 MTB -0.018453 -28399.301 LogRiskM 0.002396 -286713.46
MTB -0.014979 -27307.242 LogRiskM 0.00264 -28448.678 MTB -0.010922 -287939.09
LogRiskM 0.000749 -27325.803 Dividend -0.002213 -288059.49
LogSize 0.000871 -288259.32
Panel B: outliers and high leverage data points only
Intercept 0.87306 -7201.0776 Intercept 0.942954 -6352.685 Intercept 0.819195 -26934.085
Collateral 0.042474 -7209.4523 MTB -0.17338 -6570.7851 Collateral 0.045698 -26995.799
Dividend -0.010475 -7213.2865 LogRiskM 0.003508 -27042.370
Profit -1.547112 -7331.7532
LogRiskM 0.001415 -7375.3222

20
Table 5. Determinants of market leverage in broad sample of banks: lasso selection
Pre-Uniform Pre-Basel Basel
Variable estimate SBC variable Estimate SBC variable estimate SBC
Panel A: excluding outliers and high leverage data points
Intercept 0.995468 -26346.04 Intercept 0.983276 -25279.388 Intercept 1.064598 -236117.18
Profit -8.592902 -27922.719 Profit
-
10.175776 -26669.761 Profit -11.984389 -243397.3
MTB -0.018166 -27979.864 MTB -0.190018 -248882.69
LogRiskM 0.006299 -251362.44
Collateral -0.057433 -253433.95
LogSize 0.003069 -254694.05
Dividend 0.001849 -254743.68
Panel B: outliers and high leverage data points only
Intercept 0.974934 -7461.354 Intercept 1.018476 -6597.9892 Intercept 0.986706 -36187.562
Profit -3.335635 -7578.5206 MTB -0.329417 -6948.5492 MTB -0.252184 -37285.989
MTB -0.052637 -7658.1006 LogSize 0.010918 -7194.7991 Profit -1.897223 -37847.825
Profit -1.233128 -7272.2974 LogRiskM 0.006764 -38014.101
LogRiskM 0.005079 -7324.686 LogSize 0.003502 -38220.599
Collateral -0.068586 -7326.8918 Collateral -0.031134 -38451.171
Dividend -0.007812 -7500.5550 Dividend 0.009415 -38487.993
Panel A: excluding outliers and high leverage data points
Pre-Uniform Pre-Basel Basel
variable estimate SBC variable Estimate SBC variable estimate SBC
Intercept 0.856729 -2252.8316 Intercept 0.895157 -1982.8342 Intercept 1.022207 -5540.8726
Collateral 0.052813 -2273.9501 LogSize -0.018943 -6119.9398
MTB -0.051199 -2334.9616 Collateral 0.044661 -6174.3727
Profit -0.617565 -2339.2315 MTB 0.076802 -6177.9509
Profit -3.363618 -6183.519
LogRiskM -0.001987 -6198.6102

21
Table 6. Determinants of book leverage in sample of SIFIs: lasso selection
Panel B: outliers and high leverage data points only
Intercept 0.866845 -429.7238 Intercept 0.884881 -392.6988 Intercept 1.184775 -1517.8747
Collateral 0.034717 -440.7109 LogSize -0.030633 -1696.2202

22
Table 7. Determinants of market leverage in sample of SIFIs: lasso selection
Panel A: excluding outliers and high leverage data points
Pre-Unifrom Pre-Basel Basel
variable Estimate SBC variable Estimate SBC variable estimate SBC
Intercept 0.996678 -2035.9632 Intercept 1.137411 -1705.523 Intercept 0.976597 -5038.4796
Profit -10.366876 -2251.1758 Profit -14.965526 -1868.7793 Profit -15.807996 -5370.2464
Collateral -0.076093 -1908.4651 MTB -0.195204 -5699.2166
MTB -0.113952 -1929.6929 LogSize 0.005228 -5737.5009
LogRiskM 0.004257 -1931.7085
Panel B: outliers and high leverage data points only
Intercept 0.974873 -373.0157 Intercept 0.850045 -284.747 Intercept 0.873542 -1216.0414
Profit -5.628036 -374.5119 Profit -4.143059 -289.0001 MTB -0.367448 -1360.2944
MTB -0.065653 -381.2698 LogSize 0.007234 -294.7847 Profit -2.550129 -1409.6552
LogSize 0.008614 -1426.1777
Collateral 0.021643 -1432.3031

23
Table 8. Comparative analysis of the characteristics of outliers and high leverage data points in the broad sample of banks
Panel A: No outliers or high leverage data points
Pre-Uniform Pre-Basel Basel
Variable Minimum Maximum Mean Median Minimum Maximum Mean Median Minimum Maximum Mean Median
BookLev 0.851619 0.961599 0.908639 0.910615 0.837424 0.964204 0.907279 0.912542 0.791045 0.989985 0.895851 0.899481
MktLev 0.887394 1 0.955249 0.95805 0.823831 0.995685 0.93172 0.93472 0.670576 1 0.871968 0.875946
MTB 0.019236 0.361004 0.164626 0.15962 0.056356 0.396398 0.210034 0.206815 0.000611 0.640758 0.266217 0.257354
Profit 0.000715 0.008321 0.004333 0.004311 0.001129 0.008985 0.005084 0.005083 -0.00121 0.013139 0.005863 0.005833
LogSize 6.373697 11.0845 8.007839 7.758603 5.667132 11.88263 8.544173 8.313039 3.452461 12.63716 7.107843 6.83366
Collateral 0.815667 1.46042 1.121922 1.116333 0.700378 1.53419 1.099044 1.093302 0.529065 1.659841 1.058009 1.050978
Dividend 1 1 1 1 1 1 1 1 0 1 0.749453 1
LogRiskM -7.95951 -3.18149 -5.39377 -5.36648 -6.90216 -3.69429 -5.18577 -5.17667 -8.5767 -2.15853 -5.41687 -5.43389
Panel B: Outliers and high leverage data points only
Pre-Uniform Pre-Basel Basel
Variable Minimum Maximum Mean Median Minimum Maximum Mean Median Minimum Maximum Mean Median
BookLev 0.699146 0.973812 0.903236 0.909697 0.261507 2.678213 0.904267 0.914295 0.000117 20.08333 0.849295 0.874779
MktLev 0.821227 1 0.951764 0.956448 0.30564 1 0.929217 0.944376 0.000858 1 0.860786 0.885389
MTB 0.011095 0.406677 0.152336 0.139569 0.004254 1.275056 0.223133 0.190829 0.002863 2.52718 0.320053 0.278614
Profit -0.01311 0.024661 0.004525 0.004383 -0.07328 0.060105 0.004983 0.004844 -0.10505 0.121562 0.007031 0.005754
LogSize 6.317652 11.65199 7.859875 7.513354 3.455875 12.22308 8.124664 8.027489 2.1045 15.17113 8.036444 7.397726
Collateral 0.696882 1.509546 1.13072 1.114024 0.044955 1.645189 1.03172 1.066662 0.029248 2.484029 1.036808 1.005467
Dividend 0 1 0.335583 0 0 1 0.409019 0 0 1 0.575454 1
LogRiskM -8.61468 -1.82533 -5.18184 -5.09808 -8.5206 0.241332 -4.71997 -4.66616 -12.1733 -0.21273 -4.92666 -4.96692
*summary statistics of the independent variables presented for outliers and high leverage data points as identified in book leverage-
based regressions; analogous statistics from the market leverage-based regressions is the same or very similar and it is not reported

24
Table 9. Comparative analysis of the characteristics of outliers and high leverage data points in the sample of SIFIs
Panel A: No outliers or high leverage data points
Pre-Uniform Pre-Basel Basel
Variable Minimum Maximum Mean Median Minimum Maximum Mean Median Minimum Maximum Mean Median
BookLev 0.869538 0.933071 0.904016 0.903962 0.851276 0.937236 0.895157 0.895628 0.724616 0.933312 0.864756 0.869639
MktLev 0.899572 0.98538 0.950858 0.952911 0.829328 0.983515 0.926767 0.929831 0.656982 1 0.851073 0.85858
MTB 0.03125 0.352165 0.182186 0.183872 0.123945 0.386092 0.242384 0.244051 0.112117 0.644254 0.354462 0.365956
Profit 0.001853 0.007265 0.004428 0.004516 0.002332 0.008466 0.005268 0.005196 0.001074 0.011977 0.007377 0.007306
LogSize 6.868375 10.62294 8.316457 8.146197 7.578308 11.26475 9.210994 9.342403 7.779939 14.67581 11.266 11.30663
Collateral 0.877941 1.434326 1.123744 1.111161 0.761285 1.366581 1.079521 1.085071 0.585376 1.40714 0.95626 0.936701
Dividend 1 1 1 1 1 1 1 1 1 1 1 1
LogRiskM -7.33487 -3.44696 -5.33569 -5.26304 -6.41755 -4.2054 -5.17791 -5.15755 -7.80267 -2.84639 -5.45786 -5.54932
Panel B: Outliers and high leverage data points only
Pre-Uniform Pre-Basel Basel
Variable Minimum Maximum Mean Median Minimum Maximum Mean Median Minimum Maximum Mean Median
BookLev 0.865891 0.929478 0.907047 0.911363 0.85792 0.922013 0.884881 0.880317 0.614689 0.926586 0.836581 0.858233
MktLev 0.852804 0.978297 0.940973 0.944438 0.798771 0.975028 0.884942 0.884076 0.56539 0.979117 0.816105 0.842478
MTB 0.045035 0.391258 0.143796 0.120141 0.142587 0.411683 0.291982 0.297081 0.132146 0.864979 0.414006 0.394081
Profit 0.000568 0.007162 0.004287 0.0042 -0.01058 0.012164 0.006455 0.008018 -0.01429 0.0533 0.007699 0.007266
LogSize 6.829135 8.782234 7.536271 7.467638 7.437679 11.26971 8.520831 8.22131 7.887646 14.65792 11.36673 11.30062
Collateral 0.958379 1.480666 1.158002 1.116962 0.894597 1.412134 1.103692 1.063544 0.548786 1.638329 1.069262 1.026108
Dividend 0 1 0.34 0 0 1 0.833333 1 0 1 0.77551 1
LogRiskM -7.33487 -3.44696 -4.91167 -4.79013 -7.02339 -3.65458 -5.24035 -5.05653 -6.82453 -2.07719 -4.87469 -4.93539
*summary statistics of the independent variables presented for outliers and high leverage data points as identified in book leverage-
based regressions; analogous statistics from the market leverage-based regressions is the same or very similar and it is not reported
Table 10. Classic determinants of capital structure of banks with bank and year fixed effects
Panel A: book leverage
All banks SIFIs

25
Pre-Uniform Pre-Basel Basel Pre-Uniform Pre-Basel Basel
MTB -0.01607 ***
-
0.116627 ***
0.00004275
7 -0.067192 *** 0.008493 0.0287 **
Profit -1.598981 *** 0.695756 *** -0.837162 *** -1.17915 * -1.024739 ** -0.839838 ***
LogSize -0.003292 * 0.014854 *** 0.000269
0.00000733
9 -0.001567 0.012155 ***
Collateral 0.032476 ***
-
0.012609 0.030141 *** -0.02642 *** -0.003531 -0.003568
Dividend 0.001421 ** 0.000552 0.006606 *** 0.007178 *** -0.000895 0.003423
LogRisk
M 0.00106 *** 0.001527 0.001167 * 0.001402 -0.002238 -0.000058212
R2 0.7015 0.4501 0.2072 0.6847 0.7317 0.7789
Adj R2 0.69 0.4164 0.1788 0.661 0.7102 0.7709
N obs 4280 4782 48355 315 298 1149
Panel B: market leverage
All banks SIFIs
Pre-Uniform Pre-Basel Basel Pre-Uniform Pre-Basel Basel
MTB -0.05047 ***
-
0.231884 *** -0.156227 *** -0.125212 *** -0.033992 -0.22784 ***
Profit -1.996959 ***
-
0.505177 *** -1.382051 *** -2.982945 *** -0.718975 -2.258115 ***
LogSize 0.015005 *** 0.008466 *** 0.01509 *** 0.026754 *** -0.007984 ** 0.015118 ***
Collateral -0.001988
-
0.037437 *** -0.017306 *** -0.040418 *** -0.052719 *** -0.072554 ***
Dividend 0.000174 0.000399 0.004937 *** -0.007316 *** 0.00786 -0.004866
LogRisk
M -0.000535 * 0.002584 *** 0.000961 *** 0.003933 *** -0.002723 0.003568 *
R2 0.7661 0.7679 0.6624 0.8222 0.9072 0.8107
Adj R2 0.757 0.7537 0.6503 0.8089 0.8998 0.8039
N obs 4280 4782 48355 315 298 1149

26
References
Frank, Murray Z., and Vidhan K.Goyal, 2003. Testing the pecking order theory of capital
structure. Journal of Financial Economics Vol. 67, Iss. 2 pp. 217–248
Gropp, Reint, and Florian Heider, 2010. The Determinants of Bank Capital Structure.
Review of Finance, Vol. 14, Iss. 4, pp.587-622
Hastie, T., R. Tibshirani, and J. Friedman, 2001, The Elements of Statistical Learning:
Data Mining, Inference, and Prediction, New York, Springer-Verlag
Hoerl, A. E. and Kennard, R. W. (1970). Ridge Regression. Applications to non-
orthogonal problems. Technometrics, 12, pp.55-67
Huber, Peter J.. 1973. “Robust Regression: Asymptotics, Conjectures and Monte Carlo”
The Annals of Statistics. Vol. 1, No. 5 (Sep., 1973), pp. 799-821
Marquardt, D. W., 1970. Generalized inverses, ridge regression, biased linear estimation,
and nonlinear estimation. Technometrics Vol. 12, pp. 591–256
Shmueli, Galit, 2010. To Explain or to Predict? Statistical Science. Vol. 25 No. 3,
pp.289-310
Snee, Ronald D., and Donald W. Marquardt,1984. "Comment: Collinearity diagnostics
depend on the domain of prediction, the model, and the data."The American
Statistician 38.2 pp. 83-87.
Tibshirani, R. (1996). Regression Shrinkage and Selection via the Lasso. Journal of the
Royal Statistical Society. Series B (Methodological), 58, 267-288
Zou, H., 2006. The adaptive lasso and its oracle properties. Journal of the American
Statistical Association, 101, 1418–1429

27
On the Discovery and Use of Disease Risk Factors with Logistic
Regression: New Prostate Cancer Risk Factors
David E. Booth
M&IS Dept.
Kent State University
Kent, OH 44240
USA
Venugopal Gopalakrishna – Remani
Dept. of Management
University of Texas – Tyler
Tyler, TX 75799
USA
Matthew Cooper
Dept. of Internal Medicine
Washington University School of Medicine
St. Louis, MO 63110
USA
Fiona R. Green
University of Manchester
Margaret P. Rayman
Dept. of Nutritional Sciences
Faculty of Health and Medical Sciences
University of Surrey
Guildford GU27XH UK
Draft Date: 3/21/15
Draft in Revision: 3/18/16
Not for Quotation. For submission to the Journal of Biomedical Informatics
Abstract
We begin by arguing that the often used algorithm for the discovery and use of disease
risk factors, stepwise logistic regression, is unstable. We then argue that there are other
algorithms available that are much more stable and reliable (e.g. the lasso). We then
propose a protocol for the discovery and use of risk factors using lasso variable selection
with logistic regression. We then illustrate the use of the protocol with a set of prostate
cancer data and show that it recovers known risk factors. Finally we use the protocol to
identify new risk factors for prostate cancer.

28
On the Discovery and Use of Disease Risk Factors with Logistic
Regression: New Prostate Cancer Risk Factors
1. Introduction
As Austin and Tu (2004) remark, researchers as well as physicians are often
interested in determining the independent predictors of a disease state. These
predictors, often called risk factors, are important in disease diagnosis, prognosis and
general patient management as the attending physician tries to optimize patient care.
In addition, knowledge of these risk factors help researchers evaluate new treatment
modalities and therapies as well as help make comparisons across different hospitals
(Austin and Tu, 2004). Because risk factors are so important in patient care it
behooves us to do the best job possible in the discovery and use of disease risk
factors. Because new statistical methods (Ayers and Cordell (2010), Yuan and Liu
(2006), Steyerberg et al (2000), Wiegand (2009), Breiman (1995), Tibshirani (1996))
have been and are being developed, it is important for risk factor researchers to be
aware of these new methods and to adjust their discovery and use of risk factor
protocols as is necessary. In this paper, we argue that now is such a time. For a
number of years in risk factor research a method of automatic variable selection
called stepwise regression and its variants forward selection and backward
elimination (Chatterjee and Price 1977 (chapter 9)) have been used even as new
methods have become available (see Neter, Wasserman and Kutner, 1983, Chapter
12, Kutner et al 5th ed. 2005 P 364ff, Labidi et al 2009, Queiroz et al 2010, Qui et al
2013, and many others). The last three cited are risk factor studies. We do not argue
for a change of protocols in risk factor discovery and use simply because newer
methods are available. As we will show the older methods are often unreliable and
the newer methods are much less so. We point out that the purpose of this paper is
the following:
1. To summarize some of the studies that show that stepwise regression
and its variants as now used more often than they should be in risk
factor studies are unreliable and in fact may cause some of the
irreproducibility of life sciences research as discussed by Arnaud
(2014) as we shall discuss later.
2. To argue on the basis of current research that there are methods
available that are considerably more reliable.
3. To propose a modern statistical protocol for the discovery and use of
risk factors when using logistic regression as is commonly done.
4. To illustrate the use of the protocol developed in 3 using a set of
prostate cancer data (Cooper et al 2008).
5. To report the finding of new prostate cancer risk factors using the
modern procedures.
We further note that nothing in the way of statistical methods is new in this paper. What
is new is the introduction of a clear protocol to identify and use disease risk factors that

29
involve much less problematic methods than stepwise regression. We then use the
proposed methodology to identify a known prostate cancer risk factor and then discover
two new prostate cancer risk factors.
2. The problems with stepwise regression and an introduction to current variable
selection methods.
We first assert that we have not set up a straw man. Stepwise regression is being used at
the present time as the above cites show. We list a few modern citations above to make
that point and a short session on Google will find many more. In addition, to show that
stepwise regression is alive and well, we did a search of Researchgate questions on
March 16, 2016 and found about 3,000 questions soliciting help on using stepwise
regression. Having made our point that stepwise logistic regression is still commonly
used, we now point out the problems. We begin by considering Breiman (1995), who
compared 2 shrinkage estimators (of which much more will be said later) with a
commonly used alternative to stepwise, the all possible regressions model approach using
the Mallows Cp criterion (Neter et al 1983 p 426ff). We first note that Dahlgren (2010)
reports that Murtaugh showed that all subsets variable selection is very similar to
stepwise regression. What then did Breiman find? Breiman tested all methods (the
shrinkage methods were ridge regression and the nonnegative garrote (Breiman (1995))
in two cases which he called x-controlled and x-random which he tested by simulation.
We suppose that there are M subset regressions and M regressions for each of the
shrinkage estimators. Let’s now look at Breiman’s results. Let ME stand for model error
as defined by Breiman. Breiman says:
1. “The ME estimates for subset selection are considerably worse than those for
nn-garrote or ridge regression.” We remember that Murtaugh showed that
subset selection (all subsets) is a commonly used alternative to stepwise.
2. “In the x-random simulation, the nn-garrote uses almost twice the number of
variables as subset selection.” Remember from 1 the nn-garrote had
considerably better ME than all subsets. It seems it takes more variables to be
selected to get the better ME. This argues that the all subsets model selection
is not very good.
3. “Stepwise variable deletion or addition procedures nested subsets of variables.
But the sequence of best best…subsets…are generally not nested.” Breiman
notes that in this simulation the nn-garotte is “almost always but not always”
nested. Remember the nn-garotte had the better ME. Breiman defines
instability with respect to small perturbations in the data in the following way.
Suppose a subset of predictors has been selected. “Now remove a single data
case (Yn, Xn) and use the same selection procedure getting a sequence of
subsets.” If the two subsets are vastly different (i.e. unstable selection) then
the resulting two prediction equations are vastly different and we would
observe the risk factors for one prediction equation are not the risk factors for
the other. Which set then would be the best risk factors if the selection
procedure is unstable? In section 5,5,2,7 of his paper Breiman reports that the
all subsets method is unstable. This along with Murtaugh’s results suggest

30
that the current methods, all subsets and stepwise are poor performers for
selecting risk factors if we are using a standard linear regression model as
considered in Neter et al (1983).
However, a standard linear regression model is not usually the case in risk factor
studies of disease. Here the most common case is a dichotomous dependent
variable e.g. patient has disease, patient does not have the disease and hence a
logistic regression model is appropriate (Harrell (2001), Chapt. 10-11). We now
must consider the same issues as before but now in the case of logistic regression.
We begin by considering Steyerberg et al (2000). Here, in the context of logistic
regression, they compared backward stepwise selection and several shrinkage
estimators including the lasso (Tibshirani 1996). We note in passing that
Tibshirani gives us an example of a risk factor type study. The lasso will be
important to us later. Now let ∝ be the significance level for backward stepwise
selection. Studies much like those of Breiman were conducted except with
logistic regression. Steyerberg et al say: “We found that stepwise selection with
low α (for example 0.05) led to a relatively poor model performance, when
evaluated on independent data, substantially better performance was obtained
with full models with a limited number of important predictors, where regression
coefficients were reduced with any of the shrinkage methods…we therefore
recommend shrinkage methods in full models including prespecified
predictors…when prognostic models are constructed…”
We now briefly consider the work of Wiegand (2010) who looked at using
multiple stepwise algorithms for variable selection in linear, logistic and Cox
regression models. He says: “To conclude, stepwise agreement is often a poor
strategy that gives misleading results and researchers should avoid using SVS
algorithms to build multivariable models.”
We now come to the work of Austin and Tu (2004) which drives the nail into the
coffin of stepwise selection methods in logistic regression. The entire paper
should be read by all those that are using stepwise methods in risk factor studies
with logistic regression. We quote from the Abstract, “The objective of this study
was to determine the reproducibility of logistic regression models developed
using automated variable selection methods.” The abstract continues: “Results:
Using 1,000 bootstrap samples, backward elimination identified 940 unique
models for predicting mortality. Similar results were obtained for forward and
stepwise selection. Three variables were identified as independent predictors of
mortality among all bootstrap samples. Over half the candidate prognostic
variables were identified as independent predictors in less than half of the
bootstrap samples. Conclusion: Automated variable selection methods result in
models that are unstable and not reproducible. The variables selected as
independent predictors are sensitive to random fluctuation in the data.” At this
point it is clear that the time of stepwise and all subsets regression has passed in
risk factor studies. Arnaud (2014) reports that a related problem occurs in the

31
case of finding biomarkers in disease. While the stepwise regression problem is
not mentioned in this paper, one might suspect that it lurks there as well and we
would suggest studies similar to those we report here be conducted in order to
possibly remove an additional source of irreproducibility in these types of studies.
3.What then should replace these automatic variable selection methods?
We have seen so far that shrinkage methods have done well when compared to the
current stepwise and all subsets methods and thus we follow the suggestion of Steyerburg
et al and look at shrinkage methods. The question then becomes what shrinkage method
might we choose as the next variable selection method: we are impressed by the work of
Ayers and Cordell (2010) in this regard. First we note that shrinkage estimators are also
called penalized estimators. In particular the lasso (Tibshirani 1996) as defined by Zou
(2006) can be considered. We note that the factor lambda is said to be the penalty.
Now Ayers and Cordell (2010) studied “the performance of penalizations in selecting
SNPs as predictors in genetic association studies.” Their conclusion is: “Results show
that penalized methods outperform single marker analysis, with the main difference being
that penalized methods allow the simultaneous inclusion of a number of markers, and
generally do not allow correlated variables to enter the model in which most of the
identified explanatory markers are accounted for.” At this point, penalty estimators (i.e.
shrinkage) look very attractive in risk factor type studies.
Another paper (Zou 2006) helps us make our final decision. Zou (2006) considers a
procedure called adaptive lasso in which different values of the parameter λ are allowed
for each of the regression coefficients. Furthermore, Zou shows that an adaptive lasso
procedure is an oracle procedure such that β(Ϩ) (asymptotically) has the following
properties
a) It identifies the right subset model and
b) It has the optimal estimated rate.
Zou then extends these results to the adaptive lasso for logistic regression.
Wang and Leng (2007) developed an approximate adaptive lasso (i.e. a
different λ for each β is allowed) by least squares approximation for many
types of regression. Boos (2014) shows how easy it is to implement this
software in the statistical language R for logistic regression. Thus, we choose
to use the least squares approximation to their adaptive lasso logistic
regression in the next section. We note here that a special variant of lasso,
group lasso (Meier et al (2008)) is needed for categorical predictor variables.
In the next section, we propose and discuss a protocol for the discovery and use of
risk factors in logistic regression models. In the following section we illustrate
the use of the protocol using the data of Cooper et al (2008) to look at some risk
factors for prostate cancer. We will show that currently known risk factors can be
identified as well as new risk factors discovered using these methods.
4. A suggested protocol for using logistic regression to discover and use disease
risk factors.

32
Our suggested protocol is shown below. We discuss the protocol in this section
and illustrate its use with prostate cancer risk factors in the following section.
This protocol uses the R statistical language.
The Logistic Regression
Protocol for use with Risk Factors
1. Ready data for analysis.
2. Input to R.
3. Regress a suitable dependent variable ((say) 0- Control, 1 – Has disease) on X
(a potential risk factor) as described by Harrell(2001 Chapter 10) for logistic
regression.
4. If the regression coefficient of X is significant (we suggest a p-value of 0.25
or less – see Hosmer and Lemeshow (1989), p 86), it identifies a potential
risk factor. If an X variable is continuous, we suggest use of the Bianco-
Yohai robust (outlier resistant, see Hauser and Booth (2011)) estimator and
further suggest putting outliers aside for further analysis as they may give rise
to extra information.
5. Now build a full risk factor prediction model.
6. Use potential risk factors (Xs) to form a full model with the appropriate
dependent variable (as in 3).
7. If any variables are continuous repeat 4 using the entire potential full model.
8. With any outliers set aside for further study, regress the dependent variable on
the logistic regression full model using the adaptive lasso method, least
squares approximation, as described by Boos (2014) which is easiest in R.
9. Using a Bayesian Information Criterion (BIC) select variables without zero
lasso regression coefficients to be predictors in a risk factor based reduced
model. If categorical risk factors are present use group lasso regression
(Meier et al (2008)). Use graphs like Fig. 1 in Meier et al (2008) to identify
the zero lasso regression coefficients that may exist for the categorical
variables.
10. Validate the reduced model, with the similar validation of the full model of
step 6, if there is any doubt about variables discarded from the full model
using bootstrap cross validation (Harrell, 2001) and then check the usual
model diagnostics (Pregibon, 1981).
11. Predict with the reduced model containing the appropriate risk factors as
described in Harrell (2001), Chapter 11 and Ryan (2009), Chapter 9.
Notes to the protocol.
A. We note that for the genome wide case of predictors one should refer to Li et
al (2011) and Wu et al (2009).
B. All logistic regression assumptions should be checked and satisfied as in
Pregibon (1981).

33
5.The prostate cancer example including new risk factors
This example is taken from Cooper et al (2008) where the data and biological system are
described. The data set used in this paper is a subset of the Cooper et al data set with all
observations containing missing values removed. We note that all potential predictor
variables are categorical so no imputation was performed. The coding assignments and
the variable definitions are given in the Appendix. The simple and multiple logistic
regressions are carried out as described in Harrell (2001). Robust logistic regressions,
when needed, are carried out as described in Hauser and Booth (2011). Variable
selection is carried out using the adaptive lasso (Zou, 2006) with the least squares
approximation of Wang and Leng (2007) for continuous independent variables and by
group lasso (Meier et al (2008)) for categorical independent variables. All computations
are carried out using the R statistical language. The R functions for variable selection
(adaptive lasso and group lasso) along with the papers are available from Boos (2014),
and used as described there. The use of the group lasso R function is covered in R help
for package grplasso and grpreg. The data sets and R programs are available from the
authors (DEB). The variables studied as potential risk factors are listed in the X column
of Table 1.
We now follow the protocol and explain each step in detail. We begin by considering the
one predictor logistic regressions in Table 1. First note that all potential risk factors in
this data set are categorical (factors) so we do not have to consider the Bianco-Yohai
(Bianco and Martinez (2009)) estimator of protocol Step 4 for this data. By observing the
Table 1 p-values, we note that only smoke-ever fails to meet the Hosmer and Lemeshow
criterion and thus smoke_ever is eliminated as a possible risk factor for this data set at
this point. Cooper et al (2008) hypothesize a SNP-SNP interaction as a risk factor for
prostate cancer. We now test this hypothesis and attempt to answer the question is there
such an interaction? In order to answer this question, we first note that the answer is not
completely contained in Table 1. Second, we recall that we have a gene-gene interaction
of two genes if both affect the final phenotype of the individual together. Thus to show
gene-gene interaction we must have two things. To be specific, we now consider the two
genes representing the relevant alleles of the SEPP1 and SOD2 genes. If there is a gene-
gene interaction, we must see two things statistically. First, the relevant alleles of the
SEPP1 and SOD2 genes must both be predictors of the disease state (See Table 1) and, in
addition must be selected to be in a reasonable prediction equation for the disease state by
the appropriate lasso algorithm (See Figures 1 and 2). The appropriate lasso algorithm
here is the group lasso for logistic regression because the predictor variables are
categorical. We now note that in our data set we have four candidate predictor variables
from which to search for our gene-gene interaction MnSOD_DOM_Final, SeP_Ad_Final,
MnSOD_AD_Final and SeP_DOM_Final. Either observation of the Variable Values or a
simple trial shows that we cannot include all four variables in the model at once because
they are pairwise collinear. Hence we have to separate the variables into the two cases,
the models of Figure 1 and Figure 2. We also note that lasso generally does not allow
correlated variables to enter the model (Ayers and Cordell(2010)).

34
We now begin our search with the model of Figure 1. By Table 1 we find that both
alleles of MnSOD_DOM_Final are predictors but only SeP_Ad_Final0 is a predictor
with p-value 0.039557. This gives us a candidate for an interaction. We then perform
the group lasso analysis of Figure 1. Here we must determine if the relevant alleles are
included in the group lasso selected prediction equation. Roughly this is the case if the
lasso regression coefficients are not zero at the end of the algorithm’s execution as shown
on the coefficient path plot of Figure 1. By looking at equation (2.2) of Meier et al
(2008) we see that 0≤λ<∞ hence as λ→∞, sλ(β)→0 and thus βi →0 but not uniformly.
Hence the question is what value of λ do we choose to determine if the coefficients are
close enough to zero to discard that term from the model as a zero coefficient. Based on
Table 2 where we compute the
Table 1 Simple Logistic Regression Results
Dependent variable CURRENTSTATUS Intercepts are not listed
X Coeff. SE P
X_STRATUM -.055132 .005646 <2x10-16
MnSOD_AD_Final 0
1
2
-0.4334
-0.2478
-0.3140
.1241
.1157
.1233
0.000477
0.032196
0.010879
SeP_Ad_Final 0
1
2
0.21219
0.12890
0.23484
0.10309
0.10754
0.15797
0.039557
0.230675
0.137117
MnSOD_DOM_Final0
1
0.4334
0.2704
0.1241
0.1126
0.000477
0.016369
SeP_DOM_Final 0
1
0.21219
0.14445
0.10309
0.10568
0.039557
0.171679
Smoke_ever 0
1
-.00339
-.03791
.08161
.07016
0.967
0.589
Alco_ever 0
1
-0.428943
0.002951
0.142425
0.062317
0.0026
0.9622
FAMHIST 0.84619 0.09497 <2x10-16
Table 2
Optimal λs Computed from R Packages
grplasso and grpreg for Indicated Models
Predictors in Model λmin λmax λopt
MnSOD_AD_Final
SeP_DOM_Final
.009 70.55 .635
MnSOD_DOM_Final
SeP_Ad_Final
.017 83.99 1.428

35
Note: λmin computed by package grpreg using a Bayesian Information Criterion λmax
was computed by package grplasso.

36
Figure 1 – The Group Lasso Coefficient plot for the logistic regression –
Containing MnSOD_DOM_FINAL and SeP_Ad_Final
We note that for lambda=λopt none of the paths shrink to zero suggesting that when the
p-values of Table 1 are significant, a SNP-SNP interaction, as reported in Cooper et al
(2008) exists.

37
Figure 2 – Grouplasso Coefficient Plot for Model Containing MnSOD_AD_Final and
SeP_SOM_Final

38
optimal λ to use we choose λ=1.428 to be the cutoff point. Hence we can now apply the
two conditions of the previous paragraph. Condition 1 was that both candidate alleles be
significant predictors in Table 1. We see that MnSOD_DOM_Final0 and
MnSOD_DOM_Final1 both meet this criterion but only SeP_Ad_Final0 meets the
criterion. We now must check Figure 1 to see which if any of these candidate alleles are
selected for the group lasso prediction equation which was our second criterion. We now
examine the Figure 1 plot at λopt=1.428. We note that at this λ none of the candidate
alleles have coefficients of zero. Hence using our two criteria we can summarize as
follows:
1. We need both Table 1 significance and Figure 1 selection to show interaction.
SeP_Ad_Final0 was Ala/Ala so this is one allele that qualifies.
2. Both MnSOD_DOM_Final0 and MnSOD_DOM_Final1 (i.e. Ala/Ala and +/Ala)
satisfy so this shows that for MnSOD the result is +/Ala. Hence the identified
interaction alleles are
SEPP1 SOD2
Ala/Ala +/Ala
which agrees with the Cooper et al (2008) finding on a gene-gene interaction risk
factor.
We now repeat this analysis for the model which contains the other possible candidate
alleles. By the first criterion and Table 1 all three of the MnSOD_AD_Final values are
significant while only SeP_DOM_Final0 is significant. By criterion 2 for gene-gene
interaction we also need βi≠0 for λopt=0.635, from observing Table 2. Now by observing
Figure 2 we see that for MnSOD_AD_
Final the 0, 1 and 2 values meet the criteria while for SeP_DOM_Final only the 0 allele
does because of lack of significance for SeP_DOM_Final1. By consulting the Appendix
we see that
SeP_DOM_Final0 is Ala/Ala
MnSOD_AD_Final0 is Val/Val
1 is Val/Ala
2 is Ala/Ala
and all of these were significant in the Table 1 regressions. Hence we conclude that we
have an additional two gene-gene interactions that are risk factors, since one combination
was identified using the first model.
SEPP1 SOD2
Ala/Ala Val/Val
Ala/Ala Val/Ala
Neither of these has been reported in the prior literature as far as we can determine.
We can now make prediction equations using our now known risk factors which will give
our predicted diagnosis of whether or not a patient is at risk for prostate cancer based on
our variable values assuming that we use a new observation not one which is included in
our current data set.. We recommend the use of bootstrap cross validation to validate this
equation and full details are included in (Harrell, 2001). As a final reminder, all of the
other assumptions of logistic regression need to be checked each and every time. The

39
reader is referred to Pregibon (1981) for further details. These new risk factor results are
particularly important since the SEPP1 gene product is in the same metabolic path as a
tumor suppressor for prostate cancer (Ansong et al 2015).
6.Limitations of the proposed Protocol and Future Research
As much as we would like this to be the last word on the discovery and use of disease
risk factors with logistic regression, it is not. We will mention a few possible limitations
and our hope for some future work perhaps by us or others that we would like to see.
First, Ayers and Cordell (2010) mention a limitation of this suggestion, the fact that there
is no known way to get confidence intervals and p-values for lasso estimates. Fortunately
this is changing. Currently, there is a paper by Lockhart et al (2012) entitled “A
significance test for the lasso”. While this is a complicated paper that doesn’t solve all
problems a strong beachhead has been established.
Next, we discussed the advantages of adaptive lasso earlier (esp. the oracle property) but
no algorithm currently exists to solve the adaptive group lasso problem in the case of
logistic regression. We conjecture based on the results of the linear regression case
extended to the logistic case that if we could extend adaptive lasso to the group lasso for
logistic regression cases that the same desirable properties of adaptive lasso would hold,
especially the oracle property.
Finally the usual problems of outliers, etc., as always, raise their head. The Bianco-Yohai
algorithm (Bianco and Martinez (2011) ) is a start but this hasn’t been extended to any
penalized shrinkage regression method. We conclude that there is much work to be done
and fully expect to see other papers like this one in the future and hopefully statistical
practice can continue to evolve and even better solutions can be applied to these
interesting and important problems.
7. Conclusion
We have attempted in this paper to bring up to date statistical thinking to the problem of
the identification and use of disease risk factors, where stepwise regression is still too
often used. Much remains to be done, but we hope that the ideas presented here will
improve statistical practice in this very important area. In the process of bringing this
thinking up to date, we have shown that we recover a currently known risk factor and
identify two new risk factors which suggest the value of our approach. These new risk
factor results are particularly important since the SEPP1 gene product has recently been
shown to be in the same metabolic pathway as a tumor suppressor for prostate cancer
(Ansong et al 2015)

40
Appendi
x Data
Set
Variable
Appendi
x Data
Set
Variable

41
Cases were classified as either non-aggressive at diagnosis (tumor stage 1 and 2, Gleason
score < 8, Differentiation G1-G2, NP/NX, MO/MX, PSA < 100 μg/L; NPC) or
aggressive at diagnosis (tumor stage 3-4, Gleason score ≥ 8, Differentiation G3-G4, N+,
M+, PSA ≥ 100 μg/L;APC).

42
References
Ansong, E., Ying, Q., Ekoue, D. N., Deaton, R., Hall, A. R., Kajdacsy-Galla, A., Yang,
W., Gann, P. H., Diamond, A. M. (2015) Evidence that Selenium Binding Protein 1 is a
Tumor Suppressor in Prostate Cancer. PLoS ONE 10(5); e0127295.
doi:10.1371/jouenal.pone.0127295
Arnaud, D. H. (2014), Confronting Irreproducibility, Chemical and Engineering News 92
(50), 28-30..
Austin, P. and Tu, J (2004), Automated Variable Selection Methods for logistic
regression produced unstable models for predicting acute myocardial infarction mortality,
J. Clinical Epidemiology 57, 1138-1146.
Ayers, K and Cordell, H (2010), SNP Selection in Genome-Wide and Candidate Gene
Studies via Penalized Logistic Regression, Genetic Epidemiology 34: 879-891.
Bianco, A and Martinez, E. (2009), Robust testing in the logistic regression model,
Computational Statistics and Data Analysis 53, 4095-4105.
Boos, D. (2014) au., Adaptive Lasso in R, 2/9/2014,
http://www.stat.ncsu.edu/~boos/var.select/lasso.adaptive.html
Breiman, L (1995), Better Subset Regression Using the Nonnegative garrote,
Technometrics 37 (4), 373-384
Chatterjee, S and Price B, (1977), Regression Analysis by Example, New York: John
Wiley and Sons.
Cooper, M., Adami, H., Gronberg, H., Wiklund, F., Green, F., Rayman, M. (2008),
Interaction between Single Nucleotide Polymorphisms in Selenoprotein P and
Mitochondrial Superoxide Dismutase Determines Prostate Cancer Risk, Cancer Res
2008: 68: (24), 10171-10177
Dahlgren, J (2010), Alternative Regression Methods are not considered in Murtaugh
(2009) or by ecologists in general, Ecology Letters (2010) 13: E7-E9.
Ekoue, D. N., Gann, P., Yang, W., Diamond, A.M. (2015),
Harrell, Jr., F., (2001) Regression Modeling Strategies; New York: Springer.
Hauser, R. and Booth, D (2011), Predicting Bankruptcy with robust logistic regression, J.
Data Sci 9(4), 585-605.
Hosmer, DW and Lemeshow, S (1989), Applied Logistic Regression, NY: Wiley-
Interscience.

43
Kutner, M, Nachtsheim, Neter, j, Li, W, (2005) Applied Linear Statistical Models, 5th ed.,
New York; McGraw-Hill Irwin.
Labidi, M, Baillot, R, Dionne, B, LaCasse, Y, Maltais, F and Boulet, L (2009), Pleural
Effusions following Cardiac Surgery, Chest 2009: I 36 : 1604-1611
Li, H, Das, K, Fu, G, Li, R, Wu, R (2011), The Bayesian lasso for genome-wide
association studies, Bioinformatics (2011) 27 (4), 516-523
Lockhart, R, Taylor, J, Tibshirani, R. J, Tibshirani, R, A significance test for the lasso
(2012), Department of Statistics, paper 131, http://repository.cmu.edu/statistics/131
Meier, L, Van der Geer, S, Buhlmann, P (2008), The group lasso for logistic regression
J.R. Statist, Soc B, 70, part 1, 53-71
Neter J, Wasserman, W and Kutner, M (1983) Applied Linear Regression Models,
Homewood: Richard D. Irwin
Pregibon, D (1981), Logistic Regression Diagnostics, Annals of Statistics 9: 705-721
Qiu, l, Cheng, X, Wu, J, Liu, J, Xu, T, Ding, H, Liu, Y, Ge, Z, Wang, Y, Han, H, Liu, J,
Zhu, G, 2013, Prevalence of hyperuricemia and its related risk factors in healthy adults
from Northern and Northeastern Chinese Provinces, BMC Public Health, 2013, 13:664
Queiroz, N, Sampaio, D, Santos, E, Bezerra, A. 2012, Logistic model for determining
factors, associated with HIV infection among blood donor candidates at the Fundacao
HEMOPE
Rev Bras Hematologia Hemoterapia, 2012; 34(3): 217-21
Ryan, T (2009), Modern Regression Methods 2nd Ed, Hoboken, NJ: Wiley
Steyerberg, E, Eijkemans, M, Harrell, Jr, F, Habbema, J. (2000), Prognostic Modeling
with logistic regression analysis: a comparison of selection and estimation methods in
small data sets, Statist. Med. 2000 : 19 : 1059-1079
Tibshirani, R(1996), Regression Shrinkage and Selection via the lasso, Journal of the
Royal Statistical Society: series B58 (1), 267-288
Wang, H and Leng, C. (2008), A note on adaptive group lasso, Computational Statistics
and Data Analysis 52 (2008), 5277-5286
Wiegand, R (2009), Performance of Using Multiple Stepwise algorithms for variable
selection Statist. Med. 2010, 29, 1647-1659
Wu, T, Chen, Y F, Hastie T, Sobel, E, Lange, K, 2009 Genome wide association
analysis by lasso penalized logistic regression, Bioinformatics 25: 714-721

44
Yuan, M. and Lin, Y (2006), Model Selection and Estimation in Regression with
Grouped Variables, J. Royal Statistical Society: Series B 68(1), 49-67
Zou, H. (2006) The Adaptive lasso and its Oracle Properties, Journal of the American
Statistical Association 101:476, 1418-1429

45
An Analysis of Big Review Data and their Usefulness to Viewers
In Lee, Ph.D.
School of Computer Sciences
Western Illinois University, Macomb, IL USA
ABSTRACT
As the global data explosion is driven in part by the social media phenomenon, every
enterprise needs to build capabilities to leverage the explosion of data and data analytics
to stay competitive. Merchant review sites are one of social media’s big data sources.
Merchant review sites such as Yelp and Angie’s List create value by allowing consumers
to easily post their reviews on merchants and helping merchants promote their
businesses. Currently, a large amount of merchant review data are available at these
merchant review sites, and more and more consumers are using other consumers’ reviews
for their purchasing decisions. A big data analysis of these merchant review data is
challenging, since they are large, complex, and unstructured. In light of this phenomenon,
this paper reviews big data and data analytics, and develops a research model for
analyzing the relationship between WOM factors of Groupon users’ review and the
usefulness of the review to viewers.
INTRODUCTION
The technological developments in big data-related infrastructure, software, and services
allow enterprises to transform themselves into data-driven companies which leverage
tremendous amount of data about their business activities to make timely informed
decisions. Statistics shows that big data has the potential to become a game changer in the
near future. The International Data Corporation (IDC) (2015) forecasts that big data
technology and services market will grow at a compound annual growth rate (CAGR) of
23.1% over the 2014-2019 period with annual spending reaching $48.6 billion in 2019.
As one of the more promising big data sources, various social media platforms have
creates a paradigm shift in the way organizations operate and collaborate. User-generated
content has flooded social media sites to share ideas and exchange information. A variety
of big data created at social media sites, such as Facebook and LinkedIn, have created
new business opportunities and revenue models. Consumer review is one of the big data
sources. Consumer review became an integral marketing source that led to high
involvement and attention from consumers, especially in an online retailing context
(Petrescu, 2016). Reviews written by consumers are perceived to be less biased than the
information provided by advertisers or product experts and can provide impartial
information for viewers to make purchasing decisions. The review credibility can be
further enhanced by providing a feedback function for other consumers to rate the

46
usefulness of the particular reviews. With the explosive growth of consumer reviews at
various merchant/product review sites and social media sites, electronic Word-of-Mouth
(eWOM) as a contributor of social media has drawn much attention from researchers and
practitioners. eWOM is referred to as the spreading of online reviews, arguments, and
recommendations to potential customers concerning personal experiences with specific
products or service providers (Hennig-Thurau, Gwinner, Walsh, & Gremler, 2004).
eWOM proved to have a significant impact on consumers’ product selection (Casaló,
Flavián, & Guinalíu, 2010).
Compared with online advertisement, positive eWOM is more effective for building
reputation and credibility that can increase consumer acquisition and brand loyalty
(Dellarocas, 2003). On the other hand, consumers have more concerns on negative
eWOM than on positive eWOM (Shih, 2016). Yelp, TripAdvisor, and Angie’s List are
specialized merchant review sites that enable consumers to generate eWOM in the form
of online product reviews, merchant reviews, blogs, and social tagging. Consumers’
reviews are written comments that are qualitative and review scores are quantitative in
nature. These two pieces of information put together facilitate the decision making
process for viewers. For example, Yelp enables a consumer to rate a particular merchant
based on a numerical scale of 1 to 5. Yelp provides viewers with reputation information
including an aggregated score for positive, negative, and neutral review scores, along
with the facility to read related comments.
Merchant review data is part of big data. Big data is an all-encompassing term for any
collection of data sets which are so large, complex and unstructured, that it becomes
difficult to process using traditional data processing applications (Chen, Tao, Wang, &
Chen, 2015). Big data is collected for many different purposes such as fraud detection,
web content analysis, and national security. Before the advent of cloud computing,
traditional information systems were hardly able to handle big data. The big data
analytics involves analytical methods for traditional data and big data, big data storage
technologies, data processing optimization technologies, and software tools used for
mining and analysis of big data. Data analysis is the final and most important phase in the
value chain of big data, with the purpose of extracting useful values, providing
suggestions or decisions (Chen, Mao, Zhang, & Leung, 2014). It is challenging to analyze
merchant review data since merchant data are large, complex and unstructured with texts,
images, and videos.
With the widespread adoption of merchant reviews and e-WOM, merchants must find
ways to capitalize on consumer reviews to improve their products and services. An in-
depth understanding of eWOM factors of consumer reviews on its usefulness for viewers
will help merchants make timely and effective responses to customers’ needs and
concerns. However, there are a paucity of eWOM studies on the merchant review, and
many merchants are in need of practical guides in managing their review data. In light of
the current gap in theories and practices in this area, this study will review big data and
data analytics, and investigate the eWOM factors that affect the usefulness of the
merchant reviews posted by Groupon users. This study uses select review data posted at
Yelp.
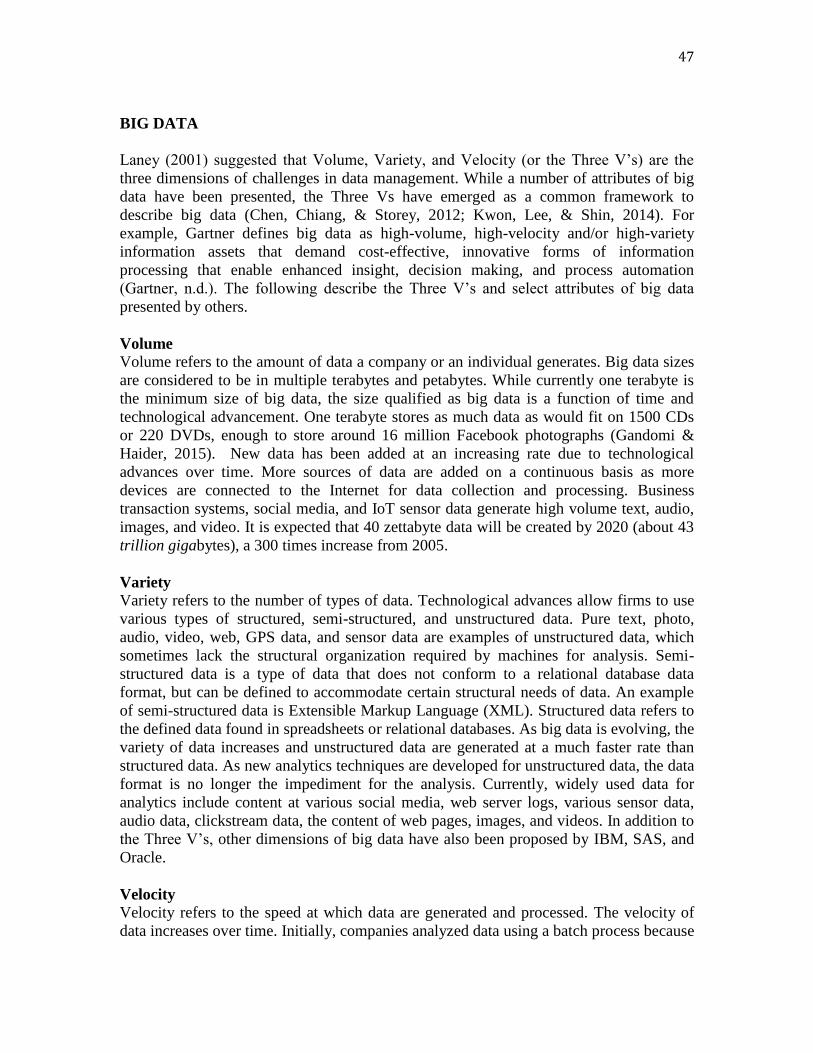
47
BIG DATA
Laney (2001) suggested that Volume, Variety, and Velocity (or the Three V’s) are the
three dimensions of challenges in data management. While a number of attributes of big
data have been presented, the Three Vs have emerged as a common framework to
describe big data (Chen, Chiang, & Storey, 2012; Kwon, Lee, & Shin, 2014). For
example, Gartner defines big data as high-volume, high-velocity and/or high-variety
information assets that demand cost-effective, innovative forms of information
processing that enable enhanced insight, decision making, and process automation
(Gartner, n.d.). The following describe the Three V’s and select attributes of big data
presented by others.
Volume
Volume refers to the amount of data a company or an individual generates. Big data sizes
are considered to be in multiple terabytes and petabytes. While currently one terabyte is
the minimum size of big data, the size qualified as big data is a function of time and
technological advancement. One terabyte stores as much data as would fit on 1500 CDs
or 220 DVDs, enough to store around 16 million Facebook photographs (Gandomi &
Haider, 2015). New data has been added at an increasing rate due to technological
advances over time. More sources of data are added on a continuous basis as more
devices are connected to the Internet for data collection and processing. Business
transaction systems, social media, and IoT sensor data generate high volume text, audio,
images, and video. It is expected that 40 zettabyte data will be created by 2020 (about 43
trillion gigabytes), a 300 times increase from 2005.
Variety
Variety refers to the number of types of data. Technological advances allow firms to use
various types of structured, semi-structured, and unstructured data. Pure text, photo,
audio, video, web, GPS data, and sensor data are examples of unstructured data, which
sometimes lack the structural organization required by machines for analysis. Semi-
structured data is a type of data that does not conform to a relational database data
format, but can be defined to accommodate certain structural needs of data. An example
of semi-structured data is Extensible Markup Language (XML). Structured data refers to
the defined data found in spreadsheets or relational databases. As big data is evolving, the
variety of data increases and unstructured data are generated at a much faster rate than
structured data. As new analytics techniques are developed for unstructured data, the data
format is no longer the impediment for the analysis. Currently, widely used data for
analytics include content at various social media, web server logs, various sensor data,
audio data, clickstream data, the content of web pages, images, and videos. In addition to
the Three V’s, other dimensions of big data have also been proposed by IBM, SAS, and
Oracle.
Velocity
Velocity refers to the speed at which data are generated and processed. The velocity of
data increases over time. Initially, companies analyzed data using a batch process because

48
the speed of data collection was slower than the processing. With real-time collection of
data from social media, mobile devices and sensors, the batch process breaks down due to
unacceptably delayed responses to events. In 2015, Facebook users sent on average 31.25
million messages and view 2.77 million videos every minute. Passenger airplanes are
generating half a terabyte of data per flight. While data can be streamed into the server
for a batch processing, many business situations demand real-time or near real-time
responses. Data streams at this unprecedented speed must be dealt with in a timely
manner for the result to be useful. Gartner (2015) forecasts that 6.4 billion connected
things will be in use worldwide in 2016, up 30 percent from 2015, and will reach 20.8
billion by 2020. In 2016, 5.5 million new things will get connected every day, all
developed to collect, analyze, and share data. The enhanced real-time processing
capability for steaming data will continue to accelerate the velocity.
IBM added Veracity as the fourth V, which represents the unreliability and uncertainty
inherent in some sources of data. IBM states that one third of business leaders do not trust
data they use for their decision makings. Poor data quality costs the US economy $3.1
trillion per year. Customer sentiments in social media are uncertain in nature due to
subjective human opinions. Yet they carry valuable information about customers’
preferences and behaviors. The imprecise and uncertain data is analyzed using tools and
techniques developed for processing uncertain data. SAS added two additional
dimensions to big data: Variability and Complexity. Variability refers to the variation in
the data flow rates. In addition to the increasing velocities and varieties of data, data
flows can be highly inconsistent with periodic peaks and troughs. Event-triggered peak
data are challenging to manage effectively with limited resources. On the other hand,
investment in resources based on the peak-level computing demand will be highly costly
due to overall low utilization of the resources given the investment. Complexity refers the
number of data sources. Big data comes from numerous sources, which makes it difficult
to collect, cleanse, store, and process heterogeneous data across different systems. It is
necessary to reduce the impact of the complexity with open sources, standard platforms,
real-time analysis of streaming data, high-performance storage systems, and high-
performance data analytics. Finally, Oracle introduced Value as a defining attribute of big
data. Enterprises need to understand the strategic importance of using big data to their
competitive advantage, but at the same time the cost aspect of big data. Data itself
without analysis would be low value. Data analytics will transform low value data into
high value information. Explosive amounts of data will be generated in the near future
and IT professionals need to assess the value and cost of running data analytics on big
data and minimize the analytics for analytics activities, and provide value-added
information to make critical, data-driven decisions.
This paper proposes one additional attribute, decay of data, to the big data community.
Decay of data refers to the declining value of data over time. In times of high velocity of
data generation, the timely processing and acting on the analysis is all the more
important. Social media is generating large amounts of data real-time, so more and more
data analytics require continuous real time processing. Negative comments about
merchants’ service will spread quickly through social networking sites and the comments
may have a devastating effect on the reputation of the merchants, if not responded to

49
quickly. The relevance and usefulness of information collected from social media will
decline quickly after the creation of the contents. In general, the value of user-generated
contents will depend on the timeliness of the data processing and responses.
SOCIAL MEDIA ANALYTICS
Social media analytics supports content mining, usage mining, and structure mining
activities in various social media settings. Social media analytics analyzes and interprets
human behaviors at social media sites, providing insights and drawing conclusions from a
consumer’s interests, web browsing patterns, friend lists, sentiments, profession, and
opinions. By understanding customers better with social media analytics, companies can
develop more tailored marketing campaigns to target customer segments and improve
customer relationships. For example, large insurance companies are analyzing clients’
comments about their service experiences and satisfaction and examining clients’ online
social networks to find key influencers using social media analytics. Unlike online
analytical processing for structured data, social media analytics is challenging in that
social media data are heterogeneous and unstructured and is comprised of natural
language that is heavily context dependent (Hu & Liu, 2012). The worldwide social
media analytics market is growing rapidly from $1.60 billion in 2015 to $5.40 billion by
2020, at a compound annual growth rate of 27.6%. This growth is attributable to the
technological changes from traditional business intelligence (BI) to advanced analytics
and the increase in the number of social media users (PRNewswire, 2106). Some of the
social media analytics software is provided as a cloud-based service with flexible fee
options such as monthly subscription or pay-as-you-go payment.
Sentiment Analysis
Sentiment analysis is one of the major techniques used by social media analytics. It uses
text analysis, natural language processing, and computational linguistics to identify and
extract user sentiments or opinions from various source materials. Sentiment analysis can
be done on an entity level, sentence level, and document level. An entity level analysis
identifies and examines individual entity’s opinions reported in one document. A
sentence level analysis identifies and examines each sentiment expressed in sentences. A
document level analysis identifies a single top-level sentiment expressed in the while
document. While deeper understanding of sentiment and more accuracy of analysis
remain to be seen, subjective information extracted about various topics has been used
successfully for real world tasks including predicting stock market movements,
determining market trends, analyzing product defects, and managing crises (Fan &
Gordon, 2014).
Lexical-based methods and machine learning methods are two widely used methods for
sentiment analysis. Lexical-based methods use a predefined set of words where each
word carries a specific sentiment. They include simple word (phrase) counts; the use of
emoticons to detect the polarity (i.e., positive and negative emoticons used in a message)
(Park, Barash, Fink, & Cha, 2013); sentiment lexicons (based on the words in the lexicon
that have received specific features marking the positive or negative terms in a message)
(Gayo-Avello, 2011); the use of psychometric scales to identify mood-based sentiments.

50
One of the challenges of the lexical-based methods is to create a lexical-based dictionary
to be used for different contexts.
Machine learning methods often rely on the use of supervised and unsupervised machine
learning methods. While one advantage of learning-based methods is their ability to adapt
and create trained models for specific purposes and contexts, their drawback is the
availability of labeled data and hence the low applicability of the method on new data
(Gonçalves, Araújo, Benevenuto, & Cha, 2013). In addition, labeling data might be costly
or even prohibitive for some tasks. While machine learning methods are reported to
perform better than lexical methods, it is hard to conclude whether a single machine
learning method is better than all lexical methods across different tasks. In addition, both
simple and sophisticated methods of sentiment analysis can be effective or flawed.
Sampling biases in the data can badly skew results as in situations where satisfied
customers remain silent while those with more extreme positions incessantly voice their
opinions (Fan & Gordon, 2014).
Social Network Analysis
Social network analysis is the process of analyzing structures of social networks through
the use of network and standard graph theories. Social network analysis was originally
developed before the advent of social media to study patterns of relationships that
connect social actors in modern sociology. A social network analysis focuses on
measuring the network structure, connections, the importance of nodes, and other
properties. A social network consists of actors and associated relationships among actors.
The relationships are typically identified from user links directly connecting two actors or
inferred indirectly from tagging, social-oriented interactions, content sharing, and voting.
Marlow (2004) employs social network analysis to describe the social structure of blogs.
He has explored two metrics of authority: popularity measured by bloggers’ public
affiliations and influence measured by citation of the writing. Social networking sites
such as Facebook, Twitter, and LinkedIn have provided fertile grounds for advancing
online social network theories and practices. Although these sites feature much of the
same content that appears on personal web pages, social network sites provide a central
point of access and bring structure in the process of personal information sharing and
online socialization (Jamali & Abolhassani, 2006).
Social network analysis provides both a visual and a mathematical analysis of actor
relationships within a network by modeling social network dynamics and growth
(network density, network centrality, network flows, etc.). It is used to identify
substructure within a superstructure in terms of groupings or cliques. The number, size,
and connections among the sub-groupings within a network can shed useful insights on
the likely behavior of the network as a whole, allowing for greater effectiveness in
segmented marketing efforts. Social network analysis uses a variety of techniques
pertinent to understanding the structure of the network (Scott, 2012). These range from
simpler methods (such as counting the number of edges a node has or computing path
lengths) to more sophisticated methods that compute eigenvectors to determine key nodes
in a network (Fan & Gordon, 2014).

51
ELECTRONIC WORD OF MOUTH (eWOM)
Word-of-mouth (WOM) occurs when consumers in a network generate a message or
trend through conversations (Bass, 1969). WOM is one of the factors that shape
consumers’ attitudes and behaviors in their purchasing decisions. In the travel industry,
WOM is one of the most often sought information sources by travelers (Yoon & Uysal,
2005). Many travelers are adventure-seekers and plan to visit new areas. They heavily
rely on other travelers’ experiences for their decision making. Electronic word-of-mouth
(EWOM) refers to WOM taking place over the Internet in the form of online reviews,
online recommendations, or online opinions. While WOM usually occurs on a one-on-
one basis without much interference from marketers (Kozinets, Valck, Wojnicki, &
Wilner, 2010), eWOM takes advantage of various social media and product/merchant
review sites. Social media serve as a fertile ground for marketers’ and advertisers’
intervention in the formation and diffusion of eWOM. Realizing that online reviews can
affect a company’s performance, companies are increasingly seeking to understand the
factors that influence the use of eWOM by viewers (Cantallops, Salvi, & Cardona, 2016).
Previous studies encompass determinants of eWOM adoption (Cheung, Luo, Sia, & Chen,
2009), motives for eWOM (Brown, Barry, & Dacin, 2005; Hennig-Thurau and Walsh,
2003-4; Shih, Lai, & Cheng, 2013), and the eWOM on sales (Amblee & Bui, 2011-12;
Chevalier & Mayzlin, 2006). eWOM is created not only for an information exchange
(Cheung et al., 2009; Shih et al., 2013), but also for a social exchange driven by social
influence (Aral, 2014). Various types of eWOM can be identified with a two-dimensional
scheme: a) communication scope: from one-to-one (emails), one-to-many (review sites)
or many-to-many (virtual communities); and b) level of interactivity: from asynchronous
(emails, review sites, blogs) to synchronous (chatrooms, newsgroups, instant messaging)
(Cantallops, Salvi, & Cardona, 2016). Companies which manage eWOM effectively will
have a competitive advantage, directing their resources to target customer groups,
acquiring new customers who could be potentially loyal to their products, and
maintaining existing customers (Loureiro & Kastenholz, 2011). Positive eWOM can
enhance the market reputation of the company as well as the possibility of raising price
premiums (Yacouel & Fleischer, 2011). On the other hand, negative eWOM can reduce
consumer interest in the products/services and damage the brand image.
MERCHANT REVIEW
Social media is one of the big data sources and has drawn significant attention from
researchers and practitioners. Users of social media create big data. For example,
Facebook users send on average 31.25 million messages and view 2.77 million videos
every minute. Companies use data analytics to process the massive amount of user-
generated content and to tailor products and services to customers’ needs and interests.
Merchant review sites are one of the big data sources where users post experiences about
products and services of merchants.
Papathanassis and Knolle (2011) suggest that consumers engage in information-seeking
activities to minimize the risk related to the purchase of an intangible and inseparable

52
service bundle. A key actor/friend plays a major role in the information dissemination
within, between, and among social network members (Katona, Zubcsek, & Sarvary,
2011) and is a nexus for information-seeking consumers. Review helpfulness is one of
the metrics used to measure the value of peer-generated evaluations (Mudambi & Schuff,
2010). Baek, Ahn, and Choi (2012-13) define review helpfulness as the degree to which
other consumers believe the review is helpful in making a purchase decision. Factors for
review helpfulness include content or target of reviews, the overall tone or valence of the
reviews (as a collection), the framing of the review set (what is read first), and easy-to-
process peripheral information such as consumer generated numerical ratings (Cantallops
et al., 2016).
Peer-to-peer communication is valuable when consumers need to choose among similar
products and brands. Peer-to-peer communication is also useful for promoting credence
and experience goods (Datta, Chowdhury, & Chakraborty, 2005; Derbaix & Vanhamme
2003). Peer-to-peer communication is in general considered more credible than
commercial communication because peers are people who usually have a better image
and higher trust potential than an advertiser (Allsop, Bassett, & Hoskins, 2007). Chiu,
Hsieh, Kao, and Lee (2007) suggest that consumers trust their strong ties in their social
networks more than their weak ties, and are more influenced by strong ties in their
purchasing decisions. Cheung and Ho (2015) find that consumers are more likely to trust
a reviewer who has a higher number of followers and higher word count. Product rating
made by peers in online forums has a great viral effect on a purchasing decision (Moe
and Trusov, 2011).
Merchant review sites such as Yelp, TripAdvisor, and Angie’s List enable consumers to
generate online product reviews, merchant reviews, blogs, and social tagging. Many
review sites provide metrics such as number of “likes”, the number of “useful” or number
of “cool” and “funny.” It is still the case that merchants fail to fully exploit and translate
product reviews into business values, when these reviews can be used to improve their
service. In this light, it would be interesting to understand the relationship between the
eWOM characteristics of merchant reviews and the viewers’ responses to these
characteristics. Against the backdrop of the previous studies, this study attempts to
understand the relationship between eWOM factors and the usefulness of product reviews
in the context of Groupon users’ merchant reviews.
THE ANALYSIS OF GROUPON USERS’ MERCHANT REVIEWS AND
PERCEIVED USEFULNESS
Based on the literature review in the previous section, five factors of merchant reviews
were identified that may influence the usefulness of the review. The five factors include
the review score of a reviewer, the number of friends of a reviewer, the cumulative
number of reviews made by a reviewer, the number of words in a review, and the
existence of images/photos. The dependent variable is the number of usefulness votes.
The number of usefulness votes is used to measure the usefulness of the review.

53
A multiple regression model is used to identify the factors that are strongly associated
with the number of usefulness votes. Multiple Regression (v1.0.32) from Free Statistics
Software is used for the analysis (http://www.wessa.net/rwasp_multipleregression.wasp/).
108 healthcare merchants launched Groupon promotions from the fifty largest U.S. cities
between June and July of 2011. Healthcare refers to anything from a haircut salon and
spa to a fitness or yoga training. We visited Yelp in July 2015 to collect Groupon users’
review data. Groupon users were identified at the Yelp’s web pages of the 108 healthcare
merchants, and their reviews were transcribed for further analysis. Out of 589 reviews,
we removed 189 reviews which do not have any response from viewers. 400 reviews
were analyzed using a multiple regression model. The descriptive statistics are shown in
Table 1 below.
Table 1. Descriptive Statistics of Merchant Review
Mean Standard Deviation n
Review Score 3.365 1.5705 400
Number of Friends 72.0675 165.3403 400
Number of Reviews 96.37 168.382 400
Number of Words 221.96250 163.2673 400
Image/Photo 0.0375 0.1899 400
The Number of
Usefulness Vote
4.0525
4.9091 400
Data Analysis on Healthcare Services
A regression was run on the six variables. Table 2 shows the beta coefficients of these
variables as well as their p-values. The regression was run with a 5% level of
significance.
Table 2. Results of the Regression
Multiple Linear Regression - Estimated Regression Equation
useful[t] = + 3.18935 -0.632662score[t] + 0.00557255friend[t] + 0.00135261review[t] +
0.00921948word[t] + 0.717262image[t] + 0.00192933t + e[t]
Multiple Linear Regression - Ordinary Least Squares
Variable Parameter S.D. T-STAT
H0: parameter = 0 2-tail p-value 1-tail p-value
(Intercept) +3.189 0.8144 +3.9160e+00 0.0001061 5.306e-05
score -0.6327 0.1469 -4.3080e+00 2.083e-05 1.041e-05
friend +0.005573 0.001739 +3.2050e+00 0.001461 0.0007305
review +0.001353 0.001692 +7.9920e-01 0.4247 0.2123
word +0.00922 0.001384 +6.6610e+00 9.169e-11 4.585e-11
image +0.7173 1.203 +5.9620e-01 0.5514 0.2757
t +0.001929 0.001976 +9.7620e-01 0.3296 0.1648

54
Multiple Linear Regression - Regression Statistics
Multiple R 0.4443
R-squared 0.1974
Adjusted R-squared 0.1852
F-TEST (value) 16.11
F-TEST (DF numerator) 6
F-TEST (DF denominator) 393
p-value 1.11e-16
Multiple Linear Regression - Residual Statistics
Residual Standard Deviation 4.437
Sum Squared Residuals 7737
The results show that the review score, the number of friends of a reviewer, and the
number of words in a review are significant predictors of the number of usefulness votes.
The cumulative number of reviews made by a reviewer and the existence of
images/photos do not have impact on the number of usefulness votes. It is noted that as
the review score increases, the number of usefulness votes decreases. The review score’s
inverse relationship the number of usefulness votes indicates when review scores are low,
viewers are more interested in the review. Viewers give more credibility to reviewers
who have more friends in their network. Therefore, merchants need to pay more attention
to a strong network leader in terms of the number of friends than a weak network leader.
This result is consistent with a finding that consumers are more likely to trust a reviewer
who has a higher number of followers (Cheung & Ho, 2015). Finally, the number of
words has a significant positive effect on the number of usefulness votes. This variable
plays a significant role, since the higher number of words indicates that more information
is available to viewers and leads to the reduced information asymmetry between the
merchant and the potential customers. This result is also consistent with the previous
findings (Baek et al., 2012-13; Cheung & Ho, 2015).
CONCLUSION
The main purposes of this study are to review big data and data analytics, and to
understand Groupon users’ merchant reviews and their usefulness to viewers. This study
attempts to answer an important question in the context of a big data setting - “What are
the factors that affect the usefulness of merchant reviews made by Groupon users?” We
collected the review data four years after the initial Groupon promotions were launched
by the healthcare merchants and were able to answer the above-mentioned question.
Our analysis shows that the number of usefulness votes has a high correlation with (1) the
review score, (2) the number of friends of a reviewer, and (3) the number of words in a
review. Based on the analysis, we recommend merchants to develop online review
metrics and analyze the metrics to improve services and product performances. Key

55
metrics may include the number of social connections and followers, the number of
reviews and review scores, the number of comments, and response time to comments.
This study is the first research attempt in understanding Groupon users’ reviews and their
usefulness to viewers, and therefore makes significant contributions to research and
practice. However, as is typical in many empirical studies, this study is not without
limitations. First, while we limited the analysis of merchant review to the six factors,
additional variables may exist. These additional variables may also influence the number
of usefulness votes. Therefore, future research needs to identify such variables to build a
comprehensive model while maintaining the conciseness of the model. Second, this study
focused mainly on healthcare services. Future research needs to address other types of
businesses, such as restaurants and entertainment, and compare differences between
them.
REFERENCES
Allsop, D.T., Bassett, B.R., & Hoskins, J.A. (2007). Word of mouth research: principles
and applications. Journal of Advertising Research, 47(4), 398-411.
Amblee, N., & Bui, T. (2011-12). Harnessing the influence of social proof in online
shopping: The effect of electronic word of mouth on sales of digital microproducts.
International Journal of Electronic Commerce, 16(2), 91-113.
Aral, S. (2014). The problem with online ratings. Sloan Management Review, 55(2), 47-
52.
Baek, H., Ahn, J.H., & Choi, Y. (2012-13). Helpfulness of online reviews: Readers’
objectives and review cues. International Journal of Electronic Commerce, 17(2), 99-126.
Bass, F.M. (1969). A new product growth model for consumer durables. Management
Science, 15(5), 215-227.
Brown, T.J., Barry, T.E, & Dacin, P.A. (2005). Spreading the word: Investigating
antecedents of consumers’ positive word-of-mouth intentions and behaviors in a retailing
context. Journal of the Academy of Marketing Science, 33(2), 123-138.
Cantallops, A.S., Salvi, F., & Cardona, J.R. (2016). Impacts of eWOM on Hotels from
the Consumer and Company Perspective. Encyclopedia of E-Commerce Development,
Implementation, and Management, Edited by In Lee, IGI Global.
Casaló, L., Flavián, C., & Guinalíu, M. (2010). Determinants of the intention to
participate in firm-hosted online travel communities and effects on consumer behavioral
intentions. Tourism Management, 31(6), 898-911.
Chen, J., Tao, Y., Wang, H., & Chen, T. (2015). Big data based fraud risk management at
Alibaba. The Journal of Finance and Data Science, 1(1), 1-10.

56
Chen, M., Mao, S., Zhang, Y., & Leung, V.C.M. (2014). Big Data Analysis, Big Data
(Part of the series SpringerBriefs in Computer Science), 51-58
Cheung, Y., & Ho, H. (2015). Social influence's impact on reader perceptions of online
reviews. Journal of Business Research, 68(4), 883-887.
Cheung, M.Y., Luo, C., Sia, C.L., & Chen, H. (2009). Credibility of electronic word-of-
mouth: Information and normative determinants of online consumer recommendations.
International Journal of Electronic Commerce, 13(4), 9-38.
Chevalier, J.A., & Mayzlin, D. (2006). The effect of electronic word of mouth on sales:
Online book reviews. Journal of Marketing Research, 43(3), 345-354.
Chiu, H.-C., Hsieh, Y.-C., Kao, Y.-H., & Lee, M. (2007). The determinants of email
receivers' disseminating behaviors on the Internet. Journal of Advertising Research,
47(4), 524-534.
Datta, P.R., Chowdhury, D.N., & Chakraborty, B. R. (2005). Viral marketing: new form
of word-of-mouth through internet. The Business Review, 3(2), 69-75.
Dellarocas, C. (2003). The digitization of word of mouth: Promise and challenges of
online feedback mechanisms. Management Science, 49(10), 1407-1424.
Derbaix, C., & Vanhamme, J. (2003). Inducing word-of-mouth by eliciting surprise – a
pilot investigation. Journal of Economic Psychology, 24, 99-116.
Fan, W., & Gordon, M.D. (2014). Unveiling the power of social media analytics.
Communications of the ACM, 57(6), 74-81.
Gartner. (2015). http://www.gartner.com/newsroom/id/3165317
Gayo-Avello, D. (2011). Don’t turn social media into another ‘Literary Digest’ poll.
Communications of the ACM, 54(10), 121-128.
Gonçalves, P., Araújo, M., Benevenuto, F., & Cha, M. (2013). Comparing and combining
sentiment analysis methods. In Proceedings of the first ACM conference on Online social
networks, 27-38
Hennig-Thurau, T., Gwinner, K.P., Walsh, G., & Gremler, D.D. (2004). Electronic word-
of-mouth via consumer-opinion platforms: What motivates consumers to articulate
themselves on the internet? Journal of Interactive Marketing, 18(1), 38-52.
Hennig-Thurau, T., & Walsh, G. (2003-4). Electronic word of mouth: Motives for and
consequences of reading customer articulations on the Internet. International Journal of
Electronic Commerce, 8(2), 51–74.

57
Hu, X., & Liu, H. (2012). Text analytics in social media. In Mining Text Data (Aggarwal,
C.C. and Zhai, C. Eds), Springer, 385-414.
IDC. (2015). http://www.idc.com/getdoc.jsp?containerId=prUS40560115
Jamali, M., & Abolhassani, H. (2006). Different aspects of social network analysis. Web
Intelligence, WI 2006. IEEE/WIC/ACM International Conference on, 66-72.
Katona, Z., Zubcsek, P. P., & Sarvary, M. (2011). Network effects and personal
influences: The diffusion of an online social network. Journal of Marketing Research,
48(3), 425-443.
Kozinets, R.V., Valck, K., Wojnicki, A.C., & Wilner, S.J.S. (2010). Networked
Narratives: Understanding Word-of –Mouth Marketing in Online Communities. Journal
of Marketing, 74(2), 71-89.
Litvin, S.W., Goldsmith, R.E., & Pan, B. (2008). Electronic word-of-mouth in hospitality
and tourism management. Tourism Management, 29(3), 458–468.
Loureiro, S.M.C., & Kastenholz, E. (2011). Corporate reputation, satisfaction, delight,
and loyalty towards rural lodging units in Portugal. International Journal of Hospitality
Management, 30(3), 575-583.
Marlow, C. (2004). Audience, structure and authority in the weblog community. In
Proceedings of the 54th Annual Conference of the International Communication
Association, New Orleans, USA.
Moe, W.W., & Michael Trusov, M. (2011). The value of social dynamics in online
product ratings forums. Journal of Marketing Research, 48(3), 444-456.
Mudambi, S.M., & Schuff, D. (2010). What makes a helpful online review? A study of
customer reviews on Amazon.com. MIS Quarterly, 34(1), 185-200.
Park, J., Barash, V., Fink, C., & Cha, M. (2013). Emoticon style: Interpreting differences
in emoticons across cultures. In International AAAI Conference on Weblogs and Social
Media (ICWSM).
Papathanassis, A., & Knolle, F. (2011). Exploring the adoption and processing of online
holiday reviews: A grounded theory approach. Tourism Management, 32(2), 215-224.
Petrescu, M. (2016). Viral Marketing and Its Implications for E-commerce. Encyclopedia
of E-Commerce Development, Implementation, and Management, Edited by In Lee, IGI
Global.

58
PRNewswire. (2106). http://www.prnewswire.com/news-releases/social-media-analytics-
market-to-rise-at-276-cagr-to-2020-568584751.html
Scott, J. (2012). Social Network Analysis. Thousand Oaks, CA: SAGE Publications
Limited.
Shih, H.P. (2016). Electronic Word-of-Mouth Communication. Encyclopedia of E-
Commerce Development, Implementation, and Management, Edited by In Lee, IGI
Global.
Shih, H.P., Lai, K.H., & Cheng, T.C.E. (2013) Informational and relational influences on
electronic word-of-mouth: An empirical study of an online consumer discussion forum.
International Journal of Electronic Commerce, 17(4), 137-166.
Yacouel, N., & Fleischer, A. (2011). The Role of Cybermediaries in Reputation Building
and Price Premiums in the Online Hotel Market. Journal of Travel Research, 50(1), 1-8.
Yoon, Y., & Uysal, M. (2005). An examination of the effects of motivation and
satisfaction on destination loyalty: a structural model. Tourism Management, 26(1), 45-
56.

59
MatLab vs. Python vs. R
Taylor Colliau
Undergraduate Research Assistant
Valparaiso University
International Business – College of Business
Finance – College of Business
Grace Rogers
Undergraduate Research Assistant
Valparaiso University
Actuarial Science - College of Arts and Sciences
Business Analytics - College of Business
Zachariah Hughes
Undergraduate Research Assistant
Valparaiso University
Finance – College of Business
Economics – College of Arts and Sciences
Ceyhun Ozgur, Ph.D., CPIM
Professor, Valparaiso University
College of Business
Information & Decision Sciences
Urschel Hall 223 – Valparaiso University
Valparaiso, IN 46383
ABSTRACT Matlab, Python and R have all been used successfully in teaching college students
fundamentals of mathematics & statistics. In today’s data driven environment, the study
of data through big data analytics is very powerful, especially for the purpose of decision
making and using data statistically in this data rich environment. Matlab can be used to
teach introductory mathematics such as calculus and statistics. Both Python and R can be
used to make decisions involving big data. On the one hand, Python is perfect for
teaching introductory statistics in a data rich environment. On the other hand, while R is a
little more involved, there are many customizable programs that can make somewhat
involved decisions in the context of prepackaged, preprogrammed statistical analysis

60
MatLab vs. Python vs. R
INTRODUCTION
This paper compares the effectiveness of MatLab, Python (Numpy, SciPy) and R in a
teaching environment. In this paper we have tried to establish which programming
language is best to teach operations research and statistics to students in a college setting.
We have also attempted to determine which skill is most desirable to have knowledge
about in the workplace.
To begin, Python is a type of programming language. The most common implementation
to this programing language is that in C (also known as CPython). Not only is Python a
programming language, but it consists of a large standard library. This library is
structured to focus on general programming and contain modules for os specific,
threading, networking, and databases.
Next, Matlab is most highly regarded as not only a commercial numerical computing
environment, but also as a programming language. Matlab similarly has a standard
library, but its uses include matrix algebra and a large network for data processing and
plotting. It also contains toolkits for the avid learner, but these will cost the user extra.
Lastly, R is a free, open-source statistical software. Colleagues at the University of
Auckland in New Zealand, Robert Gentleman and Ross Ihaka, created the software in
1993 because they mutually saw a need for a better software environment for their
classes. R has certainly outgrown its origins, now boasting more than two million users
according to an R Community website (“What is R?” 2014).
Although both Python and R are open source programming languages, you do not have to
be a programmer to utilize them. While programs such as Excel and SPSS may be
simpler and faster to learn, their computational abilities are far inferior to those of
Python, R, and Matlab, which require only basic programming knowledge. Between
these three programs, when it comes to usability, Python may be a better choice because
the syntax it uses compares more similarly to other languages. However, many
programmers believe the syntax used by R to be easily learned and understood without
explicit instruction. Kevin Markham, a data scientist and teacher, suggested in his article
on software learnability that Python and R have comparable learning curves for students
without any prior programming experience. Despite this similarity, there is an argument
that Python can be easier to learn because its code is read more like regular human
language (Markham). There is a tradeoff between the simplicity of closed-source
preprogrammed software and the more complicated yet empowering open-source
software. If all you require is straightforward, small data analysis, you may not need to
look any further than Excel and SPSS. The extent of Python, Matlab, and R, however,
reaches numerous additional dimensions of big data analysis capability. Universities may
wish to pursue offering instruction on these programs as they are better suited for
working with big data and more widely used in the workplace.

61
MATLAB VS. PYTHON
Figure 1: MatLab vs. Python
Basics of Matlab
Matlab is a programming language used mostly by engineers and data analysts for
numerical computations. There are a variety of toolboxes available when first purchasing
Matlab to further enhance the basic functions that are already available upon purchase.
Matlab is available on Unix, Macintosh, and Windows environments, but is also available
for student usage on personal computers.
Advantages of Matlab
Matlab has a large number of committed users which include many universities and a few
companies who have the budget to buy a license for the program. Even though it is used
in many universities, Matlab is easy for beginners who are just starting to learn about
programming language because the package, when purchased, includes all that you will
need. When using Python you are required to install extra packages. One part of Matlab
is a product called Simulink, which is a core part of the Matlab package for which there
does not yet exist a good alternative in other programming languages.
Basics of Python
Python is another available programming language that can be accessed and used easily
by the most experienced programmers, but also by novice students. Python is a
programming language that can be used for both major and smaller projects. This is due
to its adaptable and being a well-developed programming language. It is a widely used
program due to its efficient nature of programming features. Python has also simplified
debugging for the programmer due to its built-in debugging feature. Python has

62
ultimately helped programmers become more productive and efficient with their time and
has made their developments better.
Advantages of Python
Using Python has many advantages to the programmers. The first is that Python is free to
the public and to anyone who wants to use the program. This gives an advantage because
it allows anyone who has the motivation to learn the program to use it as they please. It is
also an easy program to learn and to read. It is much more generic than Matlab which
originally started as a matrix manipulation package that later added a programming
language to it. Python is also much easier to make your original ideas into a coding
language. With this free program it comes with libraries, lists, and dictionaries that will
help the programmer achieve their ultimate goal in a well-organized way. It is used by
working with a variety of modules, which allows it to start up very quickly. When using
Python it is soon realized that everything is an object, so each object has a namespace
itself. This helps give the program structure while keeping it clean and simple. This is
why Python excels at introspection. Introspection is what comes from the object nature
of Python. Due to Python’s easy and clear structure mentioned earlier, introspection is
easy to do on this program. This is key in being able to access any part of the program,
including Python’s internal structures. String manipulation is also simple, easy, and
efficient when using Python. Due to Python being virtually available to everyone because
of its free of cost nature, it can run on any type of system. These include: Windows,
Linux, and OS X. On Python functions and classes can be defined and used wherever the
user would like and programmers can design as many as they deem necessary. With
Python a user can personally create an application that they think looks good and works
well for them. A programmer can choose from a variety of the available GUI (graphical
user interface) toolkits.
Advantages of Python over Matlab
As one who has become thoroughly familiar with the range of both Matlab’s and
Python’s capabilities through years of use, Phillip Feldman offers the following reasons
as to why the qualities of Python are advantageous to those of Matlab despite the their
numerous comparable qualities.
1. Python code is more compact and easier to read than Matlab code.
a. Unlike Matlab, which uses end statement to indicate the end of a block,
Python determines block size based on indentation.
b. Python uses square brackets for indexing and parentheses for functions
and methods, whereas Matlab uses parentheses for both, making Matlab
more difficult to differentiate and understand.
c. Python’s better readability leads to fewer bugs and faster debugging.
2. While most programming languages, including Python, use zero-based indexing,
Matlab uses one-based indexing making it more confusing for users to translate.
3. The object-oriented programming (OOP) in Python is simple flexibility while
Matlab's OOP scheme is complex and confusing.
4. Python is free and open.
a. While Python is open source programming, much of Matlab is closed

63
b. The developers of Python encourage users to input suggestions for the
software, while the developers of Matlab offer no such interaction.
5. There is no Matlab counterpart to Python’s import statement.
6. Python offers a wider set of choices in graphics package and toolsets
Utilization of Python
Python has been gaining momentum as being the programming language for novice
users. Highly ranked Computer Science departments at MIT and UC Berkeley use Python
to teach their novice programming language students. The three largest Massive Open
Online Course (MOOC) providers (edX, Coursera, and Udacity) all use Python as their
programming language for their beginning courses in programming. A variety of
professors in other disciplines now utilize the need for novice students to understand
Python and its key features.
Analysis for Python vs. Matlab
The graph below (Figure 2) accurately shows the top 39 computer science departments
that use introductory languages in their curriculum. The seven introductory languages
evaluated were Python, Java, Matlab, C, C++, Scheme, and Scratch. The two that we will
be concentrating on are Python and Matlab.
Figure 2:
Comparison of Python to other programming languages
Python is clearly the most popular introductory language that was being taught, from the
selection on this list. It surpassed Java, that was until recently the most used introductory
teaching language over the past decade. Python has been added to most schools teaching

64
curriculum due to its easy to learn and use programs and features. With Python,
beginning students do not have to focus their energies on details like types, compilers,
and writing boilerplate code, and other algorithms. Python allows the students to easily
code the and make the program accomplish the tasks that they want to see achieved.
Matlab was the next most popular programming language after Python and Java. It was
mostly entered into the curriculum for science and engineering. This is due to its more
advanced features and language characteristics.
R VS. PYTHON
When beginning to use R the programmer reads their data into a data frame, used a built-
in model by using R’s formula language, and then can later look back at the model
summary output. When getting started with Python, the programmer has many more
choices to make. These can include choosing how they would like to read their data, what
kind of structure they should use to store their data in, what machine learning package
they should use, and what type of objects does the package even allow to be in the input.
Other concerns for the programmer when starting Python could include what shape
should the previous talked about objects be in, how does the programmer include
categorical variables, and how does the user even access the model’s output? There are
many beginning questions for Python because it is a general purpose programming
language, On the other hand, R specializes in a smaller subset of statistical data and tasks
so it is much easier for a programmer to get started.

65
R VS. MATLAB
Figure 3: 2010 Analytics Survey Results of Analytic Tools (Muenchen, 2014)
As seen above, data miners use R, SAS, and SPSS the most. Because 47%, 32%, and
32% percent of respondents use R, SAS, and SPSS, respectively, it can be inferred that
these are the software skills that the greatest proportion of employers will continue to
look for (Ozgur, 2015). Surprisingly, schools do not teach students the same software
that businesses look for. In his article that measures the popularity of many data analysis
software, Robert Muenchen notes that discovering the software skills that employers are
seeking would “require a time consuming content analysis of job descriptions”
(Muenchen, 2014). However, he finds other ways to figure out the statistical software
skills that employers seek. One of these methods is to examine which software they
currently use. Muenchen includes a survey conducted by Rexer Analytics, a data mining
consulting firm, about the relative popularity of various data analysis software in 2010.
The results of the survey are pictured in Figure 1. As seen, data miners use R, SAS, and
SPSS the most. Because 47%, 32%, and 32% percent of respondents use R, SAS, and
SPSS, respectively, it can be inferred that these are the software skills that the greatest

66
proportion of employers will continue to look for. However, this method only examines
the software that employers might seek if they are hiring, so it does not accurately
measure the software that they currently look for. Muenchen’s other method does this,
studying software skills that employers currently seek as they try to fill open positions. In
this approach, Muenchen puts together a rough sketch of statistical software capabilities
sought by employers by perusing the job advertising site, Indeed.com, a search site the
comprises the major job boards—Monster, Careerbuilder, Hotjobs, Craigslist—as well as
many newspapers, associations, and company websites (Muenchen, 2014). He
summarized his discovery in Figure 2.
Figure 4: Jobs requiring various software (Muenchen, 2014)
As seen—in contrast to R’s greater usage by companies over SAS, illustrated in Figure
3—job openings in SAS substantially lead open positions that require any other data
analysis software. For employers, SPSS and R skills finish in second and third place. This
second estimation method of Muenchen measures the software skill deficits in the job
market. It seems that the demand for people with SAS skills outweighs the number of
individuals with this capability. One reason for this disconnect could be that colleges and
universities are not teaching SAS skills in proportion to the demand for these skills.
PERSONAL EXPERIENCE
One of the authors has had experience with each program (MatLab, Python, and R)
within a business class setting. In the next few paragraphs he will be talking about his
experiences in each of these programs in addition to a brief discussion of SPSS, SAS, and
Excel. The pros and cons of all the various applications will be discussed from a
student’s perspective including a description of how the programs are being used in
today’s classrooms to enhance the overall educational experience. Although SPSS, SAS,
and Excel are not the major software applications being discussed in this paper, it is
necessary to briefly discuss them since they are also major competitors that students may
encounter after graduation.

67
Microsoft Excel was probably the most commonplace software that was used in all of my
business classes to prepare students for performing everyday analytics in their future
career. Excel specifically can be used by small businesses to perform data mining for
smaller data sets that consist of up to a few thousand rows. Excel is extremely easy to
use and since students are often times introduced to the software in elementary school, it
becomes second nature to go to the program for everyday needs. Excel is so widely used
that during an internship with a Fortune 50 company, I used Excel daily to help me with
basic analytics. Another pro of Excel is that in later versions, you can use add-ins such as
MegaStat that help with data analytics. Microsoft has since decided to incorporate many
analytical tools such as regression analysis, time-series, and descriptive statistics into its
Microsoft 2016 software. The major con of Excel is that it cannot be used with big
datasets and therefore is not a viable option when working with big data.
SPSS is considered a medium sized analytical tool since it can be used with bigger
datasets up to 2 billion cases. Although, SPSS is used for larger projects, it is still very
easy to use since it is menu driven. These menu options makes SPSS a software that is
quick to learn and since it has many similarities to Excel, there is hardly any learning
curve. This makes it a very good option for business analytics classes since professors
will not be required to spend copious amounts of time acquainting students to a new
program. I used SPSS in an Econometrics course while handling an Enterprise Survey
Dataset that contained approximately 12 million cases. A con of SPSS that might not
make it extremely attractive to be taught is that it can be difficult to perform data
cleansing. Unlike using a programming language like R, SAS, or Python, the user has to
manually clean the dataset.
SAS is an extremely popular analytics software that has been around for numerous years
(first limited release was in 1971). My experience with SAS in the classroom
environment was in an introduction to data analytics course and during a SAS Shootout
Competition with other schools nationwide. The biggest pro of SAS is that it can handle
as many cases as your computer has memory to process. This makes it an extremely
useful analytical tool because essentially no data set can be too big. I once asked a SAS
representative how many cases SAS could handle and their response was to ask me how
many I needed. If your computer cannot handle the billions of cases in a dataset then you
can use SAS Cloud Analytics and have near unlimited amounts of space. SAS was also
the major analytical tool that my Fortune 50 employer used during my internship, and
certification in the program was greatly desired. As a student the biggest con of SAS is
that you need to understand the programming language. This creates a learning curve
and unless a student is committed to the software it can take several weeks to begin to
understand how to even import a dataset and perform basic analytics or data cleaning on
a dataset.
R is a major analytical tool that I believe directly competes with SAS. My experience
using R was during my internship for the Fortune 50 corporation, where R was the
second largest widely used analytical tool for mining big data. I notice that the most
difficult part of using R is the natural programming syntax. When teaching to students
this would need to be kept in mind because it can be difficult to learn and use. On the

68
contrary, R has a massive amount of open source coding available online that can help
users get started. This is useful for those who have difficulty understanding the language
because it offers a stepping stone into the use of the program. Although R might be
difficult to understand, once the user has a grasp on the software, the computing
capabilities allow the program to process billions of cases quickly.
MatLab is an interesting program that I used in both calculus and differential equations
courses. My main usage of MatLab was for basic computations and for graphing
equations in three dimensions. These are probably the biggest pros of MatLab in my
opinion. It can be used as a sophisticated calculator while also offering the user
aesthetically pleasing graphical representations of data. As a student I can say that the
biggest downfall of MatLab is the lack of open source code online for the program.
Since the usage of the software requires a license to operate the amount of code online is
scarce. This means that you have to learn the coding for every use of MatLab on your
own without being able to use others preexisting code. Although this could be seen as a
pro since it forces the user to emerge themselves in learning syntax, it can become
cumbersome if a specific command is not working.
Python was the first programming language that I ever learned and the program was
actually taught to me during a computer software course in high school. I later used the
program in an Economic Development Council Internship to perform basic analytics.
This brings up one of the biggest pros of Python, in my opinion, and that is that it is fairly
easy to learn and offers many add-on programs. For example, I have used Pandas, which
is an open source analytical tool that runs through Python. When you combine this ease
of use with wide-sweeping applications, that makes Python extremely attractive both in
classrooms and in work environments. You do not have to be a programmer to program
in python. The commands are extremely simple and you can run commands in Python to
read datasets in other statistical software such as SAS. Cons of the Python software
include speed and the program’s inability to identify and fix semantic errors which could
be extremely frustrating when dealing with large quantities of code to perform numerous
actions. From a classroom perspective, the major con of Python would be that although it
is considered an introductory programming language, this might turn away students who
struggle to grasp syntax. However, I would like to note that learning Python is much
easier than learning SAS or R, but more difficult to learn than SPSS or Excel.
CONCLUSION
In this paper we have discussed the pros and cons of Python, MatLab, and R. We have
compared and contrasted each of the languages to one another, while also talking about
the educational value of each program in a teaching environment. After reviewing all
three of the programs in depth, we have reached the conclusion that Python is the best
language to be taught in a classroom environment. This is because it is easy to use and
will allow students access to open source coding that can be found online when
performing more difficult analysis. However, we would like to note that R might be a
better program to teach to students since it is widely used in corporations around the
nation for data mining. Having knowledge of a program like R could provide students

69
with a competitive advantage while looking for a job upon graduation. In addition to R,
SPSS or SAS could also be viable alternatives which should be considered when teaching
big data analytics to students.
REFERENCES C. Ozgur, M. Kleckner & Y. Li “Selection of Software for University Courses & for
Firms that Use Business Analytics” SAGE Open Journal April-June 2015 pp. 1-
12.
Eglen, S. J. (2009, August 28). A Quick Guide to Teaching R Programming to
Computational Biology Students. Retrieved February 20, 2016, from
http://journals.plos.org/ploscompbiol/article?id=10.1371/journal.pcbi.1000482
Feldman, Phillip M. (2015, Sept. 18). Eight Advantages of Python Over Matlab.
Retrieved from
http://phillipmfeldman.org/Python/Advantages_of_Python_Over_Matlab.html
Guo, Philip. (2014, July 7). Python is Now the Most Popular Introductory Teaching
Language at Top U.S. Universities. Retrieved from:
http://cacm.acm.org/blogs/blog-cacm/176450-python-is-now-the-most-popular-
introductory-teaching-language-at-top-us-universities/fulltext
Guo, Philip. (2007, May). Why Python is a great language for teaching beginners in
introductory programming classes. Retrieved from: http://pgbovine.net/python-
teaching.htm
Hughes, Zachariah. (2015, March). Personal Experience Section in MatLab vs. Python vs.
R.
Markham, Kevin. (2016, February 2). Should you teach Python or R for data science?
Retrieved February 18, 2016, from: http://www.dataschool.io/python-or-r-for-
data-science/
MATLAB Basic Tutorials. Retrieved February 18, 2016, from:
http://ctms.engin.umich.edu/CTMS/index.php?aux=Basics_Matlab
M. Kleckner, C.Ozgur & C. Wilder “Choice of Software for Business Analytics
Courses” 2014 Annual Meeting of the Midwest Decision Sciences Institute, April
2014 pp.69-87
Muenchen, R. A. (2014, February). “The Popularity of Data Analysis Software.”
Retrieved from http://r4stats.com/articles/popularity/.
Python for Beginners - Python Training Course - Udemy. Retrieved from:
https://www.udemy.com/python-for-beginners/?siteID=oCUR7eOwwME-
8mj81nbpWjfGzuuaYiVpTg&LSNPUBID=oCUR7eOwwME

70
Pyzo. Python vs. Matlab. Retrieved February 21, 2016 from:
http://www.pyzo.org/python_vs_matlab.html
Revolution Analytics. (2014, February 20). What is R? Retreived February 21, 2016,
from: http://www.inside-r.org/what-is-r, February 20, 2014.

71
An Exploratory Study of Patient Falls
Jeffrey A. Coto, DNP, MS, RN, CNS, CCRN
Assistant Professor, Valparaiso University
College of Nursing and Health Professions
LeBien Hall 103 - Valparaiso University
Valparaiso, IN 46383
Phone (219) 309-5842(Anytime)
Office (219) 464-5289
Fax (219) 464-5425
Coleen Wilder, Ph.D.
Assistant Professor, Valparaiso University
College of Business
Information & Decision Sciences
Urschel Hall 225 – Valparaiso University
Valparaiso, IN 46383
Office (219) 464-5188
Lynn Carlson MSN RN ONC
RN Clinical Coordinator-Orthopedics
Professional Development Department
OSF Healthcare – Rockford, IL
Abstract Debate continues between the contribution of education level and clinical expertise in the
nursing practice environment. Research suggests a link between Baccalaureate of
Science in Nursing (BSN) nurses and positive patient outcomes such as lower mortality,
decreased falls, and fewer medication errors. Purpose: To examine if there a negative
correlation between patient falls and the level of nurse education at an urban hospital
located in Midwest Illinois during the years 2010-2014? Methods: A retrospective cross-
sectional cohort analysis was conducted using data from the National Database of
Nursing Quality Indicators (NDNQI) from the years 2010-2014. Sample: Inpatients aged
≥ 18 years who experienced a unintentional sudden descent, with or without injury that
resulted in the patient striking the floor or object and occurred on inpatient nursing units.
Results: The regression model was constructed with annual patient falls as the
dependent variable and formal education and a log transformed variable for percentage of
certified nurses as the independent variables. The model overall is a good fit, F (2,22) =
9.014, p = .001, adj. R2 = .40. Conclusion: Annual patient falls will decrease by
increasing the number of nurses with baccalaureate degrees and/or certifications from a
professional nursing board-governing body.
Key Words: Falls, Inpatient, Nursing Education, Nursing Degrees, Quality

72
An Exploratory Study of Patient Falls
Research Problem
Clinical nursing expertise is essential to quality patient care. Debate continues between
contribution of education level and years of experience to clinical expertise in the nursing
practice environment (McHugh & Lake, 2010). Current research suggests a link between
BSN (Baccalaureate of Science in Nursing) nurses and positive patient outcomes as
demonstrated with decreased mortality, decreased falls, and fewer medication errors.
Advanced education enhances both the quality of patient care delivery and clinical
competency (American Association of Colleges of Nursing [AACN], 2014). In 2010, the
Institute of Medicine (IOM) released the Future of Nursing: Leading Change, Advancing
Health, which proposed an 80% baccalaureate-prepared nursing workforce by 2020
(Haverkamp & Ball, 2013). Currently, the percentage of BSN nurses in the U.S. ranges
between 55%-61% (AACN, 2014). One area that nursing impacts is patient fall
outcomes, as suggested by the growing body of research, reveals that education has a
strong impact on a nurse’s ability to practice effectively. Evidence implies there is a
connection between improved patient outcomes, such as lower levels of falls, when
compared to non-BSN nurses.
One of the most widespread and serious threats to the safety of hospitalized patients is
falls. Within the U.S., the ratio of patient falls in relation to patient days is 3.3 to 11.5
(Bouldin et al., 2013). Accidental patient falls comprise approximately 2% of hospital
stays and are reported to be most common form of falls. The National Quality Forum
(NQF) adopted patient falls as one of the eight patient outcomes to be included in the
measures of nursing care performance (Lake, Shang, Klaus, & Dunton, 2010). There are
many interventions in place to keep patients safe from falling during their hospital stay,
but despite this endeavor patients remain at risk (Lake et al., 2010).
There are many variables that contribute to patient falls such as lack of adequate staffing,
staff inexperience and knowledge, and sudden patient health events (National Database of
Nursing Quality Indicators [NDNQI], 2013). A systematic review of literature was
performed to collect data relating to nurse education level including BSN, patient falls,
patient outcomes, the Iowa model, and ethical issues. Numerous studies have been
conducted which demonstrate how nursing impacts patient safety and outcomes (Kalisch,
Landstrom, & Williams, 2009).
Study Purpose
With the demands of an evolving healthcare environment and to meet the changing needs
of patients, nurses must achieve higher education levels (AACN, 2014). Research
indicates that many of today’s nurses are undereducated and underprepared to deal with
the complexities of a changing health care environment (McHugh & Lake, 2010). The
nursing profession has an obligation to society to provide quality patient care, but needs
to change with the times and support baccalaureate education for nurses (AACN, 2014).

73
Magnet designated organizations have successful programs in place that contribute to a
strong culture of patient safety. These programs have education initiatives that increase
the number of nurses with BSN degrees, as well as, patient-focused initiatives such as
reductions in patient falls and central line infection rates (Swanson, & Tidwell, 2011).
Magnet hospitals typically employ a higher proportion of BSN nurses, 59%, compared to
34% at other hospitals (AACN, 2014). The purpose of this proposed study is to determine
if there a negative correlation between patient falls and the level of nurse education at an
urban hospital located in Midwest Illinois during the years 2010-2014?
Literature Review
A systematic literature review was performed searching electronic databases for
potentially relevant articles published from January 2009 through May 2014. The search
criteria contained the following keywords and subject headings in electronic databases:
nurse education levels and falls or nurse education and patient safety or nurse education
and patient outcomes, BSN and falls, BSN and patient outcomes or BSN and patient
safety, Iowa Model, and moral and ethics in research. Eligible articles included original
publications, in addition, to utilizing information from reputable nursing websites such
as: AACN, ANA, and NDNQI.
Kalisch et al. (2009) conducted a qualitative study to determine which nursing care is
regularly missed on medical-surgical and intensive care units (ICUs) and the reasons
nursing staff imparted for missing care. One-way Analysis of Variance (ANOVA) was
used to examine differences by hospitals, years of experience, education, and full-time or
part-time status. Results concluded that associate degree nurses (ADN) had higher rates
of missed care as opposed to BSN or greater nurses (p =0.023). This study has
implications for nurse leaders who can use this information to focus interventions on
patient areas to impact the amount of nursing care being missed to improve patient
outcomes.
Wynn, Engelke, and Swanson (2009) performed a descriptive, cross-sectional,
correlational study to examine relationships between nurse characteristics and rapid
response team (RRT) calls. The study found that educational preparation was a strongest
predictor of calling the RRT and that BSN nurses were five times more likely to call an
RRT than ADN nurses (p =0.03). The relevance of this article is useful in validating the
evidence that indicates nurse education background enhances both patient care delivery
and clinical competency (AACN, 2013). This study has implications for clinicians and
managers in health care facilities that rely on RRTs.
Lake, Shang, Klaus, and Dunton (2010) performed a retrospective cross-sectional
observational study to determine the relationships between Magnet hospitals, nursing unit
staffing, and patient falls. The authors theorized that adequate support, evaluation, and
patient supervision to prevent falls depend on having a sufficient amount of well-
educated and prepared registered nurses (RNs) and other nursing staff such as licensed

74
practical nurses (LPNs), nursing assistants, and unlicensed assistive personnel.
Multivariate results indicate that Magnet hospitals had a 5% (3.75/1000 patient days [pd])
lower patient fall rate than non-Magnet hospitals (3.92/1000 pd). This study has
implications for research, policy, and management. Healthcare facilities can improve
patient safety by creating environments that are consistent with Magnet standards, which
can yield cost savings. Nursing unit managers can use the fall and staffing statistics to
support their staffing decisions.
Bouldin et al. (2013) explored the prevalence and trends of adult patient falls in medical,
surgical, and medical-surgical nursing units to determine fall trends in hospitals before
the implementation of the rule that hospitals will not be reimbursed for care by the
Centers for Disease Control and Prevention (CDC) relating to hospital fall injuries. The
study revealed that the lowest rate of falls occurred in surgical units (fall rate=2.76/1000
pd) and the highest fall rates occurred in medical units (fall rate=4.03/1000 pd ).
Akien et al. (2011), investigated how patient outcomes are associated with nurse
education level, nurse-to-patient staffing, and nurse work environment. The results
indicated that better patient outcomes, like lower patient mortality, are associated with
higher nurse education levels (p < 0.01).
Schreuders, Bremner, Geelhoed, and Finn (2012) investigated registered nurses’
perceptions of the relationship between nursing care and clinical outcomes based on
nurse education levels. The results of this study suggest nurses’ educational background
and work role may influence their perception of the impact of nursing care on patient
outcomes. Postgraduate degree nurses had significantly higher mean scores compared
with nurses who had not completed postgraduate degrees on the effect of nursing care on
patient outcome (median=3.0, mean=3.6, SD=0.53; p =0.0005).
Research Question
The research question for this study investigates: Is there a negative correlation between
patient falls and the level of nurse education at an urban hospital during the years 2010-
2014? The null hypothesis being tested is that increasing the number of BSN nurses
and/or the percentage of certified nurses in the patient care units lead to improved patient
outcomes as measured by the number of falls reported by the inpatient units. Nurses at an
urban health care facility were assessed along with the fall rates of patients that qualified
for the NDNQI definition of a fall. The type of nursing degree and the percentage of
certified nurses are the independent variables and the fall rate is the dependent variable.
Extraneous variables to be identified and considered would include nurse patient ratio,
patient acuity and case mix index. Other variables to consider would be day of the week
and even month of the year as these can be associated with census and staffing.
Methodology
This retrospective cohort study utilized cross-sectional data (2010-2014) from the
National Database of Nursing Quality Indicators (NDNQI), which represents both the

75
nursing population and the patient fall population of an acute care hospital in the
Midwest. The NDNQI established a measurement for falls that is endorsed by the
National Quality Forum (NQF) as the national standard. According to NDNQI (2013),
the definition of a patient fall “is a sudden, unintentional descent, with or without injury
to the patient, that results in the patient coming to rest on the floor, on or against some
other surface (e.g., a counter), on another person, or on an object (e.g., trash can)”. Only
patient falls on eligible nursing units are counted by NDNQI. There were five eligible
adult care units that qualified for the study.
The defined unit(s) consisted of: medical unit, surgical unit, critical care unit,
rehabilitation unit and medical-surgical unit. These units were selected based on the
availability of complete data. Fall rates and data analysis from the intensive care unit
were excluded from this study to limit statistical variance and to control extraneous
variables such as high patient acuity i.e. patients on ventilators and patients on PCA
(patient controlled anesthesia) pumps. The focus of this study was to examine the
relationship between the number of patient falls and the education level of nurses. The
level of education was considered from two perspectives.
The first perspective was a traditional view measured by the highest degree obtained for a
nurse from an academic institution. Four different degrees were used in the study as
follows: Diploma Nurse, Associate Degree, Bachelor Degree, and Master Degree;
although PhD was originally included as a fifth level of degree, it yielded zero responses.
Since the dependent variable (number of patient falls) was recorded at the medical unit
level, the two independent variables (degree and certification) also needed to be
consistently recorded. Unit calculations included the percentage of nurses with each
degree for every year of the study; these numbers were not prorated to show mid-year
transfers but represent a snapshot of each unit at a given point in time. The four degrees
were then assigned nominal values of 0,1,2,3 respectively and weighted by their
corresponding percentages to yield a level of degree for each unit by year.
The second perspective of education level was a functional view determined by whether
or not a nurse was certified. Certification is defined as one that sat for and passed an
exam from a professional nursing, governing body. A medical unit’s certification level
was simply the percentage of nurses in the unit that were certified. As with the level of
degree previously described, these numbers were not prorated to show mid-year transfers
but represent a snapshot of each unit at a given point in time.
Moral and Ethical Issues
The Code of Ethics for Nurses Provision 3.3 was established and the sponsoring
organizational institutional review board approval was obtained for this study protocol
(protocol FWA#00000521). In this retrospective cross-sectional study, possible moral
and ethical issues were considered and addressed. No potential breaks in personal
integrity were uncovered since data did not involve the use of any personal information
from the nursing sample or from patient’s medical records. The primary investigator is
CITI trained as an investigator (CITI ID 2920984) in research with exemption status and

76
has CITI report number 8217284 (Exp. 07/09/2017) as well as Physical Science Research
CITI report number 8217285, exam date 07/10/2012.
Analysis
Primary analysis of descriptive statistics was obtained as well as the relationship between
the dependent variable (annual number of patient falls, labeled as FALLS) with the two
independent variables (DEGREE, CERTIFICATE) using multiple regression. The
statistical program SPSS version 22 was used to conduct all analyses.
Descriptive Statistics
The total number of patient falls is a right skewed distribution (skewness = .932);
skewness values with a magnitude less than one are generally considered to be very good.
The mean number of patient falls is 25 with a median of 21. Individual values range
from a minimum of 2 to a maximum of 64. A histogram for the total number of falls is
provided in figure 1.
Figure 1: Total Patient Falls
The independent variable, DEGREE, which is a weighted average of the highest degree
obtained for nurses in a given medical unit, is a near normal distribution (skewness = -
0.179) with a mean of 1.39 and a median of 1.41; a value of 1.41 indicates that on
average the highest degree obtained for a medical unit is between that of an associate’s
and a bachelor’s degree. Individual values range from a minimum of 1.00 to a maximum
of 1.74. A histogram for the variable DEGREE is provided in figure 2.

77
Figure 2: Degree level for a Medical Unit
The independent variable, CERTIFICATE, which is the percentage of nurses in a medical
unit with a certification, is a right-skewed distribution (skewness = 1.581); although the
skewness value exceeds one, some practitioners believe magnitudes less than two are still
acceptable. The mean percentage of nurses with a certificate is 9.3% with a median value
of 8.3%. Individual values range from a minimum of zero to a maximum of 30.8%. A
histogram for the variable CERTIFICATE is provided in figure 3. The observed
departure from normalcy along with a skewness value significantly different from zero,
surfaced as a problem with heteroskedacity in the subsequent regression analysis. This
problem was remedied with a logarithmic transformation of the variable CERTIFICATE.
The new variable, LNCERT, formed a near normal distribution (skewness = -0.100) with
a mean of 2.29 and a median of 2.40. Individual values range from a minimum of 1.00
and a maximum of 3.51. A histogram for the variable LNCERT is provided in figure 3.

78
Figure 3: Percent Certification for a Medical Unit
Regression Analysis
Multiple regression is commonly used as a tool for predictive purposes but the goal
herein is not to predict rather to gain a better understanding of the impact that a nurse’s
education has on patient falls. In fact, the hope was to gain an understanding of how
much of the variance in patient falls can be explained by the two measures of education
level (DEGREE, LNCERT). In order to have confidence in the results, it is important
that the underlying assumptions of a regression analysis are validated and adjustments
made where necessary. A discussion of this task follows in the next few paragraphs.
The first validation focused on the relationship between the variables of interest in the
study. To test that the study satisfied the assumption of a linear relationship between the
dependent variable (FALLS) with each of the independent variables (DEGREE,
LNCERT), partial regression plots and Pearson correlation coefficients were examined.
Partial regression plots are provided in figure 4.

79
Figure 4: Partial Regression Plots
These plots show a reasonable assumption that a linear relationship exists for each of the
independent variables with the dependent variable. A linear relationship between FALLS
and DEGREE appears to be weak whereas a linear relationship between FALLS and
LNCERT is more evident; these observations are confirmed in table 1. Pallant (2013, p.
164) suggests a value of at least r = 0.3 (Pearson Correlation) to justify a linear
relationship; the LNCERT variable met this threshold (r = -0.608) while DEGREE did
not (r = -0.172). To further explore the hypothesis, it was elected to proceed with
DEGREE as a model variable since it did not show any other cause for concern and the
aforementioned threshold is a preference not a constraint. Multicollinearity between the
two independent variables is also not a concern. To avoid multicollinearity problems,
Anderson, Sweeney and Williams (2012, p. 662) caution using independent variables
with correlation coefficient magnitudes greater than 0.7; the relevant value herein is -
0.316 which meets this threshold. The tolerance of the collinearity statistics for the two
independent variables were each reported as Tol = 0.969. Tolerance indicates the amount
of variability not explained by the other independent variable; a value of less than 0.10
suggests the possibility of multicollinearity (Pallant, p. 164). This tolerance value

80
supports the findings from the correlation coefficients that multicollinearity should not be
a concern.
Table 1: Correlation Matrix
Correlations
FALLS
DEGRE
E
LNCER
T
Pearson
Correlation
FALLS 1.000 -.172 -.608
DEGRE
E -.172 1.000 -.175
LNCER
T -.608 -.175 1.000
It is assumed in a linear regression model that each predicted value is independent of the
others. There was no reason to suspect that independence would be a problem since this
was not a time-series study. Nonetheless, independence was easily verified, as assessed
by a Durbin-Watson value of 1.6; a value of 2 indicates the error terms are independent.
It is also assumed in a linear regression model that residuals have equal variance; also
known as homoscedasticity. This assumption is verified with a visual inspection of a
residual plot; see figure 5. The plot on the left is from a regression model that included
the two independent variables: DEGREE and CERTIFICATE. There is a u-shaped
pattern in the left-most scatterplot, which is undesirable. The scatterplot on the right is
from a regression model that used a logarithmic transformation of the variable
CERTIFICATE. As can be seen, the u-shape pattern is removed and the overall plot
appears more random; the effects of heteroskedasticity have therefore been minimized.

81
Figure 5: Residual Plots
A complete residual analysis includes a confirmation that the errors are normally
distributed. A histogram and normal P-Plot of the residuals are provided in figure 6.
These plots show a slight departure from normality but they are not severe given the
small sample size.

82
Figure 6: Residual Distribution
A final analysis before discussing the regression model results is to check for unusual
and/or influential observations. Standardized residual values with a magnitude greater
than three are considered very unusual, there were no observations in this category.
Cook’s distance measure was also used to determine whether or not any observations
carried undue influence; values greater than one are generally considered influential. The
largest value for Cook’s measure was 0.43; there were no influential observations.
Now that the assumptions have been verified and adjustments made where necessary (log
transformation), the regression results may be discussed. The regression model was
constructed with annual patient falls (FALLS) as the dependent variable and formal
education (DEGREE) and a log transformed variable for percentage of certified nurses
(LNCERT) as the independent or explanatory variables. The model overall is a good fit,
F (2,22) = 9.014, p = .001, adj. R2 = .40. The purpose of this effort was to gain
understanding of how much of the variance in patient falls can be explained by the two
measures of education level (DEGREE, LNCERT). The coefficient of variation (R2),
measures the percentage of variation in the number of patient falls (FALLS) that is

83
explained by the explanatory variables (DEGREE, LNCERT). Another measure adjusted
R2, accounts for the number of independent variables in the model and for mathematical
reasons not explained herein, adjusts R2 accordingly. In this case, approximately 40% of
the variation in the number of annual patient falls can be explained by the nursing staff’s
level of education; this number is low for predictive purposes but acceptable to gain an
understanding of the impact the explanatory variables have on the dependent variable.
Both explanatory variables were found to be statistically significant using a 10% level of
significance or better as seen in table 2. A discussion of the regression coefficient for
each explanatory variable follows. Interpretation of the average formal education level
for a medical unit (DEGREE) is straightforward. Annual patient falls will decrease by
approximately 27 falls per year by increasing the level of education by one unit, ceteris
paribus. For example, a medical unit with an average education level of one (Associate’s
degree) could reduce annual falls on average by as much as 27 falls by increasing the
average education level to two (Bachelor’s degree).
Table 2: Summary of Multiple Regression Model
Model
Unstandardized Coefficients
Standardized
Coefficients
t Sig. B Std. Error Beta
1 (Constant) 100.741 24.327 4.141 .000
DEGREE -26.767 14.935 -.288 -1.792 .087
LNCERT -16.873 4.112 -.659 -4.104 .000
The interpretation of the certification component is not as straightforward since the model
includes a logarithmic transformation of the original variable: percentage of certified
nurses (CERTIFICATE). In transformations where the original variable has valid zero
values, a constant is added to avoid undefined transformations. The natural log was used
herein to transform the percentage of certified nurses as follows: LNCERT =
LN(CERTIFICATE + 2.178). The most straight forward method to assess the impact on
the dependent variable when a change is made to an independent variable is simple
substitution into the regression model.
The ceteris paribus assumption must also be considered which requires that all else
remains constant, in other words only one variable may be changed at a time. Since the
average level of formal education was 1.4, an example will be shown holding this
variable (DEGREE) constant. Using algebra, the original regression model is modified
as follows:
FALLS = 100.7 – 26.8DEGREE – 16.9LN(CERTIFICATE + 2.178)
= 100.7 – 26.8(1.4) – 16.9LN(CERTIFICATE + 2.178)
= 64.3 – 16.9 LN(CERTIFICATE + 2.178)
To see the improvement in patient falls by increasing the percentage of nurses with a
certification, one only needs to substitute the values of interest. For example, using the
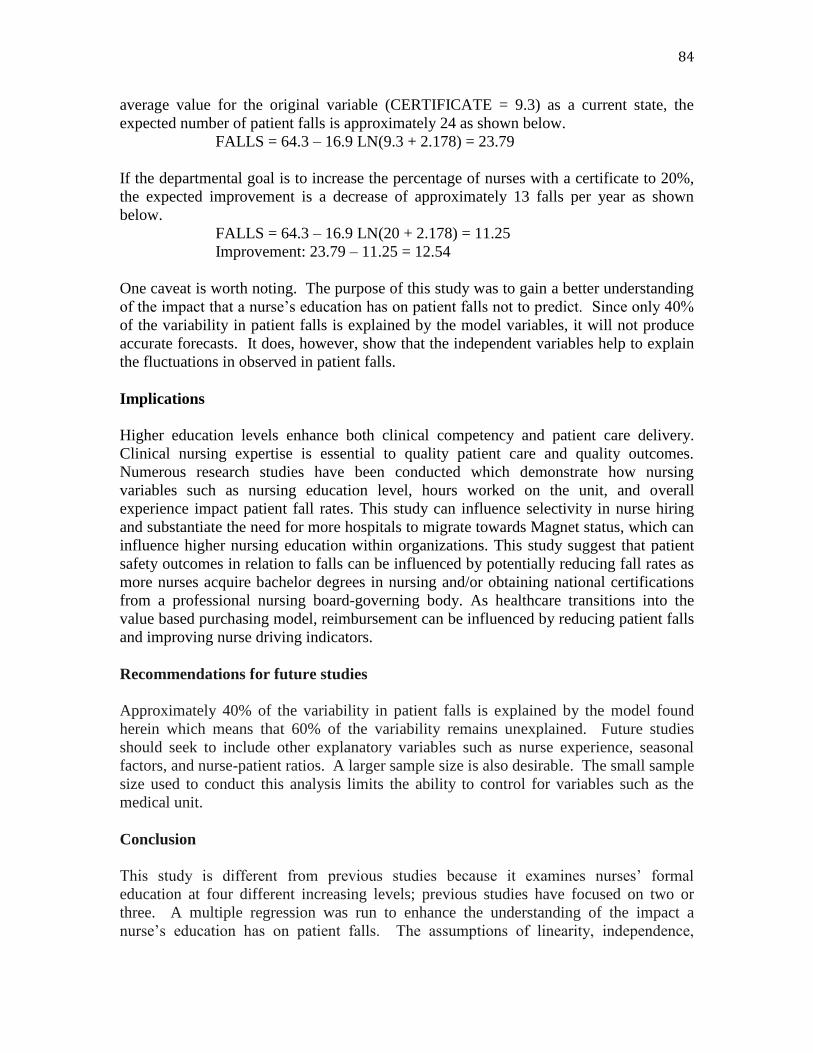
84
average value for the original variable (CERTIFICATE = 9.3) as a current state, the
expected number of patient falls is approximately 24 as shown below.
FALLS = 64.3 – 16.9 LN(9.3 + 2.178) = 23.79
If the departmental goal is to increase the percentage of nurses with a certificate to 20%,
the expected improvement is a decrease of approximately 13 falls per year as shown
below.
FALLS = 64.3 – 16.9 LN(20 + 2.178) = 11.25
Improvement: 23.79 – 11.25 = 12.54
One caveat is worth noting. The purpose of this study was to gain a better understanding
of the impact that a nurse’s education has on patient falls not to predict. Since only 40%
of the variability in patient falls is explained by the model variables, it will not produce
accurate forecasts. It does, however, show that the independent variables help to explain
the fluctuations in observed in patient falls.
Implications
Higher education levels enhance both clinical competency and patient care delivery.
Clinical nursing expertise is essential to quality patient care and quality outcomes.
Numerous research studies have been conducted which demonstrate how nursing
variables such as nursing education level, hours worked on the unit, and overall
experience impact patient fall rates. This study can influence selectivity in nurse hiring
and substantiate the need for more hospitals to migrate towards Magnet status, which can
influence higher nursing education within organizations. This study suggest that patient
safety outcomes in relation to falls can be influenced by potentially reducing fall rates as
more nurses acquire bachelor degrees in nursing and/or obtaining national certifications
from a professional nursing board-governing body. As healthcare transitions into the
value based purchasing model, reimbursement can be influenced by reducing patient falls
and improving nurse driving indicators.
Recommendations for future studies
Approximately 40% of the variability in patient falls is explained by the model found
herein which means that 60% of the variability remains unexplained. Future studies
should seek to include other explanatory variables such as nurse experience, seasonal
factors, and nurse-patient ratios. A larger sample size is also desirable. The small sample
size used to conduct this analysis limits the ability to control for variables such as the
medical unit.
Conclusion
This study is different from previous studies because it examines nurses’ formal
education at four different increasing levels; previous studies have focused on two or
three. A multiple regression was run to enhance the understanding of the impact a
nurse’s education has on patient falls. The assumptions of linearity, independence,

85
homoscedasticity, normality of errors, and unusual observations were met by using a log
transformation on one of the independent variables. The two independent variables, level
of formal education and percentage of nurses with a certification, were shown to be
statistically significant (p = 0.09, p < .005). The model overall was a good fit, F (2,22) =
9.014, p = .001, adj. R2 = .40. A negative correlation between patient falls and the level
of nurse education was validated for a Midwest facility during the years 2010 – 2014. In
conclusion, annual patient falls will decrease by increasing the number of nurses with
baccalaureate degrees and/or certifications from a professional nursing board-governing
body.

86
References
Akien, A., Cimiotti, J., Sloane, D., Smith, H., Flynn, L., and Neff, D. (2011). Effects of
nurse
staffing and nurse education on patient deaths in hospitals with different nurse
work
environments. Medical Care, 49(12), 1047-1053. doi:10.1097
/MLR.0b013e3182330b6e
American Association of Colleges of Nursing. (2014). Creating a more highly qualified
nursing
workforce. [Online] Available:
http://www.aacn.nche.edu/mediarelations/NursingWorkforce.pdf
American Nurses Association. (2011). Code of ethics for nurses with interpretative
statements.
[Online] Available:
http://www.nursingworld.org/MainMenuCategories/EthicsStandards/CodeofEthic
sforNu ses/Cde-of-Ethics.pdf
Anderson, D.R., Sweeney, D.J., Williams, T.A. (2012). Statistics for Business and
Economics
(11th). Mason, OH: South-Western Cengage Learning.
Bouldin, E., Andresen, E., Dunton, N., Simon, M., Waters, T., Liu, M., Daniels, ...
Shorr, R. (2013). Falls among adult patients hospitalized in the United States:
Prevalence and trends. Journal of Patient Safety, 9(1), 13-17.
doi:10.1097/PTS.0b013e3182699b64
Brown, C.G. (2014). The Iowa model of evidence-based practice to promote quality care:
An
illustrated example in oncology nursing. Clinical Journal of Oncology Nursing,
18(2), 157-159.doi:10.1188/14.CJON.157-159
Doody, C., & Doody, O. (2011). Introducing evidence into nursing practice: Using the
Iowa
model. British Journal of Nursing, 20(11), 661-670.
Haverkamp, J., & Ball, K. (2013). BSN in 10: What is your opinion? Association of
Perioperative Registered Nurses Journal, 98(2), 144-152.
doi.org/10.1016/j.aorn.2013.06.006
Kalisch, B., Landstrom, M., & Williams, R. (2009). Missed nursing care: Errors of
omission.
Nursing Outlook, 57, 3-9. doi:10.1016/j.outlook.2008.05.007
Lake, E., Shang, J., Klaus, S., & Dunton, N. (2010). Patient falls: Association with
hospital
Magnet status and nursing unit staffing. Research in Nursing & Health, 33, 413–
425.
doi:10.1002/nur.20399
McHugh, M., & Lake, E. (2010). Understanding clinical expertise: Nurse education,
experience,

87
and the hospital context. Research in Nursing & Health, 33(4), 276-287.
doi:10.1002/nur.20388
National Database of Nursing Quality Indicators. (2013). Guidelines for data collection
and
submission on patient falls. [Online] Available:
http://www.nursingworld.org/MainMenuCategories/ThePracticeofProfessionalNu
rsing/ atientSfetyQuality/Research-Measurement/The-National-Database/Nursing-
Sensitive Indicators_1
O’Brien, M. E. (2011). Servant leadership in nursing: Spirituality and practice in
contemporary
healthcare. Boston : Jones and Bartlett.
Polit, D. F., & Beck, C. T. (2011). Nursing research: Generating and assessing evidence
for
nursing practice (9th). Philadelphia: Lippincott, Williams, & Wilkins.
Pallant, J. (2013). SPSS Survival Manual (5th). New York: McGraw Hill.
Schreuders, L., Bremner, A., Geelhoed, E., & Finn, J. (2012). Nurse perceptions of the
impact of
nursing care on patient outcomes: An exploratory study. Contemporary Nurse: A
Journal for the Australian Nursing Profession, 41(2), 190-197.
Swanson, J. W., & Tidwell, C. A. (2011). Improving the culture of patient safety through
the
magnet journey. Online Journal of Issues in Nursing, 16(3), 1.
doi:10.3912/OJIN.Vol16No03Man01
Wynn, J., Engelke, M., & Swanson, M. (2009). The front line of patient safety: Staff
nurses and
rapid response team calls. Quality Management in Health Care, 18(1), 40-47.
doi:10.1177/1059840511433860

88
Evaluating Sepsis Guidelines and Patient Outcomes
Grace Rogers
Undergraduate Research Assistant
Valparaiso University
Actuarial Science - College of Arts and Sciences
Business Analytics - College of Business
Jeffrey A. Coto, DNP, MS, RN, CNS, CCRN
Assistant Professor, Valparaiso University
College of Nursing and Health Professions
LeBien Hall 103 - Valparaiso University
Valparaiso, IN 46383
Office (219) 464-5289
Fax (219) 464-5425
Ceyhun Ozgur, Ph.D., CPIM
Professor, Valparaiso University
College of Business
Information & Decision Sciences
Urschel Hall 223 – Valparaiso University
Valparaiso, IN 46383
Christine Langellier RN, MSN, CNL, CEN
Nurse Clinician - Emergency Department and Clinical Decision Unit
Riverside Medical Center
Kankakee, IL
Sarah Kavanaugh BSN, RN
Northwestern Memorial Hospital
Chicago, IL
Graduate Research Assistant

89
Abstract
The international society of healthcare developed standardized guidelines for the medical
management of sepsis to help battle this life-threatening healthcare problem that is
directly related to high rates of mortality. The purpose of this study is to evaluate the
relationship of septic patient outcomes when early interventions when instituted within an
emergency department. This retrospective cohort study on adults aged ≥ 18 years who
were hospitalized with sepsis, septicemia or septic shock and had the international
classification of diseases–9 [ICD-9]; 038.0- 038.9, was conducted within an emergency
department of an acute care hospital located in central Illinois. It was found, that for 156
patients, the time from patient arrival to the drawing of a blood culture sample had a
statistically significant effect on the outcome of the patient (p = .0265) and statistically
significant difference between the mean time between patient arrival and antibiotic
infusion start time from the day to the night shift (p=0.0038). Evidence supports that
early recognition and intervention improves patient outcomes and shortens hospital
length of stay.
Key words: Sepsis, guidelines, evidence-based practice, patient outcomes

90
Evaluating Sepsis Guidelines and Patient Outcomes
Introduction
Sepsis is defined as a systemic inflammatory response to a bacterial or viral infection and
is an exceedingly dangerous condition that is non-discriminatory. When sepsis is
inappropriately managed it causes circulatory collapse, which advances to tissue damage,
multi- organ system dysfunction, systemic shock and eventually death. Kleinpell, Aitken,
and Schorr (2013) define septic shock as the continuation of hypotension even after
aggressive fluid resuscitation. Sepsis and Septicemia affects approximately 30 million
people per year worldwide and is the number one cause of death (Rory Staunton
Foundation, 2016). Sepsis accounts for 20% of all intensive care unit admissions and it is
the leading cause of mortality within the medical / non-cardiac intensive care unit (Levy
et al., 2010). Patients who are hospitalized with a diagnosis of septic shock can
experience unplanned medical issues, which may increase length of stays (LOS) when
compared to other medical diagnosis. Hospitalized patients with the diagnosis of sepsis
experience a 75% increase in LOS compared to those patients who were hospitalized
with any other medical condition (Hall, Williams, DeFrances, & Golosinskiy, 2011).
To diagnosis and combat this medical cascade, the international medical society
implemented the Surviving Sepsis Campaign (SSC). Physicians around the globe
developed programs grounded in evidence-based guidelines to enhance the medical
management of sepsis. There are two primary areas within the bundled guidelines that
this research proposal will focus on: Obtaining the appropriate blood cultures before
antimicrobial therapy is initiated (< 45 minutes) and the initiation of intravenous
antimicrobial(s) within 3 hours of diagnosis. This study further looks at whether the time
of day affect the time between hospital arrivals and obtaining first blood cultures within
the 45-minute window?
Literature Review
Levy et al. (2010) explored the Surviving Sepsis Campaign (SSC) guidelines and
evaluated the performance improvement initiative within hospitals in Europe, the United
States, and South America. The focus of their investigation was on changing the clinical
actions of physicians and medical institutions by implementing SSC guidelines. SSC
guidelines were evaluated based on two independent sections. The first section evaluated
the resuscitation bundle. The resuscitation bundle included obtaining serum lactate levels,
blood cultures before administration of antibiotics, and administration of broad-spectrum
antibiotics within three hours of hospital arrival or within one hour to the ICU arrival.
The management bundle is the second section of interest. These are interventions that
needed to be completed within 24 hours of hospital arrival. The management bundle
items include administering low-dose steroids, maintaining glucose levels greater than
the normal low limit but less than 150, and maintaining inspiratory plateau pressures less
than 30cm H20 for patients on a ventilator.

91
Data was submitted (n=15,022) from 165 sites. Levy et al. (2010), reported that early
detection of sepsis and drawing blood cultures on arrival, administration of broad-
spectrum antibiotics, while keeping blood glucose levels under control were specifically
linked to lower hospital mortality. Furthermore, the unadjusted hospital mortality rate
dropped from 37.0% to 30.8% during a two-year period (p = 0.001). Levy et al. (2010)
concluded that during the same time period, the adjusted odds ratio for mortality
significantly improved in relationship to the length of time a site was enrolled in the
Campaign; resulting in an adjusted absolute drop of 0.8% per quarter and a total decrease
of 5.4% over that same 2-year span (95% CI, 2.5–8.4%). This suggested that hospitals
that utilized the SSC guidelines experienced a mortality rate decrease.
Gaieski et al. (2010) evaluated outcomes of patients with severe sepsis and septic shock
in association with the timing of antibiotic therapy. This exploratory study examined
early goal-directed therapy within emergency department patients (n=261). Results
suggested a significant decrease in mortality when door to antibiotics were administrated
in less than 60 minutes. Furthermore, it is suggested that these patients had a 19.5%
mortality rate (CI 0.11-0.83; 95%) as compared to those who received antibiotics greater
than 60 minutes experienced a 33.2% mortality rate (CI 0.29-1.03; 95%). This study
supports that rapid sepsis identification; administration of antibiotics within 60 minutes is
the best treatment strategy.
Zachar et al. (2011) experienced similar findings as Gaieski et al. (2010). Zachar et al.
(2011) state that “early use of appropriate antimicrobials was associated with lower
mortality in the community-acquired (0.64 [0.51– 0.8], p < 0.05), hospital-acquired (0.72
[0.58–0.88], p < 0.05), and ICU acquired (0.79 [0.64—0.97], p = 0.05) categories”
(p.1890).
Burney et al. (2011) identified barriers to early goal directed therapy by surveying nurses
and physicians (n=101) in an emergency department of Columbia University Medical
Center. The goal was to identify knowledge and confidence in identifying sepsis, current
treatment, and problems in managing patients with sepsis. According to the nurses, the
greatest identified barrier to implementing the SSC guidelines includes a delay in
diagnosis of sepsis. For the physicians, nursing delays and waiting to get the patient to
the ICU were the most significant barriers. Even though these barriers were addressed,
the participants stated that having a written protocol would be helpful in improving
treatment of sepsis in their emergency department. In conclusion, more education
regarding sepsis management towards both the nurses and physicians was recommended
along with a written protocol (Burney et al., 2011).
Winterbottom et al. (2011) investigated how implementing standardized order sets to care
for patients with severe sepsis and septic shock affect outcomes of patients. A team of
various healthcare professionals was assembled to help improve the early diagnosis of
sepsis. Over a process of six months, staff was educated and sepsis bundle order sets in
compliance with the SSC guidelines were implemented. There were six hundred
seventy-four patients who were diagnosed with septic shock or severe sepsis in the ICU
or ED of a 563-bed academic medical center in May of 2008 to October of 2010. The

92
results implied that using order sets significantly helped to meet the goals (p<0.001). The
use of order sets helped to provide evidence-based care to patients with sepsis. In
addition, assistance from hospital leadership and using multidisciplinary teams to
implement these changes can help to make the goals more effective.
Within the review of literature, each controlled study emphasized the importance of early
recognition and intervention using evidenced based protocols such as the SSC bundles to
decrease patient mortality and improve the outcomes significantly.
Problem and Purpose
The Surviving Sepsis Campaign (SSC) was created to help educate healthcare providers
and clinicians about the established evidence based guidelines in managing sepsis, septic
shock and septicemia. The campaign’s philosophy provides structured guidelines for the
care of the septic patient starting with the entry to emergency services and then
throughout the hospitalization as well as coping with life after sepsis. The empirical
portion of the SSC was the promotion of early diagnosis and interventions by all team
members involved in the care of the septic patient.
In defining care teams, the nurse is the primary advocate for the patient. Nurses are
generally the first person to communicate with the patient when they enter the ED and
determine the urgency of the patients’ care needs. Through education and knowledge,
nurses must provide a triage assessment and communicate the finding to the physician
promptly so early recognition and management can be initiated. Corfield et al. (2014)
recognized that by using an early warning system in the triage, the physician and nurses
could quickly intervene to reduce the risk of mortality. The purpose of this study is to
evaluate the relationship of septic patient outcomes when early interventions such as
blood cultures drawn within 45 minutes, antibiotics administered within 60 minutes and
what shift did the patient arrive on as defined by day shift (6am to 6pm) and night shift
(6pm to 6am), when instituted within emergency services.
Methodology
This retrospective cohort study was conducted within the ED of an acute care hospital
located in central Illinois. Data were retrieved via secured Health Information
Management Services (HIMS) and the Electronic Medical Record (EMR) via the ED
staff. All data were de-identified by the sponsoring organization. Approval from the
sponsoring organizational institutional review board was obtained for the original version
of the study protocol (protocol RMC 174). As there was no patient contact or patient
personal identification obtained, patient consent was not required, and an expedited
exemption approval was granted. The sample consisted of adult patients who entered the
ED with diagnosis of sepsis, septicemia or septic shock. The sample included men and
women aged ≥ 18-years who were hospitalized with sepsis, septicemia or septic shock
(International Classification of Diseases–9 [ICD-9]; 038.0- 038.9). Patients with the
above ICD-9 codes 038.0- 038.9 as the primary code and had a secondary code
associated with a complication (i.e., chronic renal failure, cerebral vascular accident, end

93
stage renal disease, cardiovascular) were also included to the sample to increase the
amount of subjects entered into the study.
Patients were admitted to the hospital from the ED to the following units; ICU, medical-
surgical unit, and telemetry unit. Any patient admitted to the observation unit or as an
observation (outpatient) patient was excluded from the study to maintain validity between
subjects. Outcomes data was determined based on the disposition post hospitalization.
Each outcome was weighted based on the severity. Outcome criteria were defined as
being discharged to home, nursing home, rehabilitation center, and medical university or
expired (morgue).
Statistical Analysis and Results
Utilizing the capabilities of Excel and the Excel add-in, Minitab, results were obtained
through the use of a t-test and simple regression analysis. The initial research question
asked whether or not the time it took to obtain the appropriate blood cultures had an
effect on the patients’ ultimate outcome. This question was answered using a simple
regression analysis, which describes the relationship between the independent variable
and the dependent variable.
The independent variable in this study was the time taken (in minutes) for a patient’s
blood culture to be drawn, starting from when the patient was admitted to the hospital.
The dependent variable was the outcome of the patient at the end of his or her respective
treatment or stay. Possible outcome in this study included “home,” “inpatient rehab,”
“hospice,” “nursing home,” “transfer,” and “expired.” In table 2, the independent
variable refers to the time between patient arrivals and drawing of the patient’s blood
culture. For the purpose of regression analysis, the hypotheses are as follows;
Null hypothesis (H0) = There is no relationship between the time it took to obtain
the appropriate blood cultures for a patient and the patient’s outcome.
Alternative hypothesis (Ha) = There is a relationship between the time it took to
obtain the appropriate blood cultures for a patient and the patient’s outcome.
This test was conducted at a confidence level of .95, or an alpha level equal to .05. The
output for the regression analysis is shown in table 1, below. It was found, that for 156
patients, the time from patient arrival to the drawing of a blood culture sample had a
statistically significant effect on the outcome of the patient (p = .0265), hence the null
hypothesis was rejected, suggesting that there is a relationship between early blood
culture collection and patient outcomes.
Table 1 - Regression output and analysis of variance table
Source SS df MS F
Residual 680.4095 154 4.4182 154.0015
Total 702.5897 155
Regression output
Variables Coefficient std. error t(df=154) p-value

94
Intercept 3.7873 0.2262 16.744 *1.68E-
36
Independent Variable -0.0061 0.0027 -2.241 *0.0265
*Significant results using alpha .05 in both time of blood cultures drawn and
outcomes utilizing the Student’s t-test and using year as the prime
variable of interest.
The secondary research question compares the time between patient arrival and antibiotic
infusion for day and night shifts. Day shifts at the acute care hospital last from 6am to
6pm, while night shifts last from 6pm to 6am. A t-test is implemented to compare the
means of two shifts. When constructing the t-test to answer the secondary research
question, the hypotheses were defined as follows;
Null hypothesis (H0) = the mean time between patient arrival and antibiotic
infusion start time does not differ from the day to the night shift
Alternative hypothesis (Ha) = there is a difference between the mean time between
patient arrival and antibiotic infusion start time from the day to the night shift.
This test was conducted at a confidence level of .95, or an alpha level equal to .05. The
output for the t-test is recreated in table 2, below. The results suggest that the probability
was observed and significant (p=0.0038), predicting that the difference in the data was
0.38% due to chance. It can be inferred that there must exist some other cause for this
difference, hence the null hypothesis can therefore be rejected, indicating that there is a
statistically significant difference between the mean time between patient arrival and
antibiotic infusion start time from the day to the night shift. It took an average of 184.86
minutes (3.081 hours) to start antibiotic infusion from the time a patient arrived, during
the day, versus, 149.14 minutes (2.486 hours) during the night. It took an average of
35.72 minutes longer during the day shift to administer antibiotics from the time a patient
arrived as compared to the night shift.
Table 2 - Hypothesis Test: Independent Group (t-test, pooled variance)
Day Night
Mean 184.86 149.14
std. dev. 80.33 *66.61
n 92 65
df 155
Difference (day-
night)
*35.72
Pooled Variance 5620.32
t 2.941
p-value (two-
tailed)
.0038
*Time (minutes) from patient arrival to antibiotic infusion
during

95
day shift (6am-6pm) versus night shift (6pm-6am)
Discussion
This retrospective cohort analysis used an EMR database of adult emergency service
patients who were hospitalized with sepsis, septicemia or septic shock with an ICD-9;
038.0- 038.9. The mean age in years for the overall sampled population was 71.2667
(n=157) with the mean age of the patients treated during the day shift versus night shift
was 69.766 (n=92); 74.053 (n=65), respectfully. The length of stay (LOS) also varied
significantly compared to the specific shifts. The overall sampled population had a mean
LOS in days of 7.42, while the patients who were treated and admitted during the day
shift had an increase LOS 7.606 (+0.186) compared to the sampled mean, while the
patients treated and admitted during the night shift had a decrease in LOS 7.107 (-0.313)
compared to the sample mean. In fact, the difference between the means represents
almost a half-day difference in the LOS (0.499). These findings are significant since
evidence supports that early recognition and implementation of sepsis bundles such as
early blood culture drawn and antibiotics administered within 60 minutes of recognition
have been shown to improve sepsis outcomes. Patients for who were identified and
diagnosed with sepsis within the ED experienced improved outcomes as defined by
disposition and also experienced a shorter LOS if arrived and admitted during the night
shift (6pm-6am).
There are several prospective reasons for these finding. First, patients that were
diagnosed promptly in the emergency department during the night shift were perhaps
streamlined through the admission process – either to the hospital units (telemetry,
surgical or medical-surgical) or to the ICU. Early recognition and disposition are key
components of the sepsis treatment protocol. Secondly, when the trained emergency
department nursing staff identify the sepsis patient, pre-set protocols are initiated,
allowing them to active sepsis protocols and quickly progress the patient through the
formalized decisional algorithm. Implementation of the SSC evidence based guidelines
has led tertiary care centers to develop standardized ED protocols, which improve
outcomes of patients experiencing sepsis and sepsis shock. Lastly, the findings suggest
that when patients in the ED are identified as having sepsis during the triage process and
early protocol initiation can improve patient outcomes, while shortening the hospital
LOS.
Limitations
Limitations to this study were identified in two-folds. First the clinical database was
segmented into several sections. First, was the EMR to collect the information of the
prospective sepsis population utilizing the ICD-9 codes. These codes (ICD-9; 038.0-
038.9) were used to identify sepsis cases and are dependent to documentation and
accuracy of physician coding. It is to be noted that only these codes were accepted when
used as the primary diagnosis, which limited the population at hand. Secondly, once the
sepsis patients were identified, the categorical collection of time was gathered by hand
and entered into the excel database for analysis. This is subjected to human error in

96
interpreting the time of arrival to the emergency department, time of blood cultures being
drawn, time of antibiotics initiated and time patient was admitted to the hospital. The
antiquated EMR system did not allow for time downloads between variables gathered.
Conclusion
Sepsis, if not identified nor managed swiftly, can be a primary contributor to a hospitals
morbidity and mortality. It is imperative that sepsis management is at the forefront for a
hospital’s quality improvement initiatives. Evidence supports that early recognition of
sepsis and consistent implementation of sepsis evidence based guidelines; the overall
outcomes of the patient at time of discharge improve and are associated with reduced
LOS during admission. This study adds to the body of knowledge of sepsis management,
supporting the fact that the time from patient arrival to the drawing of a blood culture
sample had a statistically significant effect on the outcome of the patient (p = .0265),
while early antibiotic administration also contributed to the decreased LOS as the results
suggest that the probability was observed and significant (p=0.0038). Lastly, this study
supports the SSC and advocates for hospitals to implement sepsis bundled protocols and
incorporate these protocols with emergency nursing education, enhancing nursing
autonomy and collaboration among emergency physicians.
References
Aitken, L., Williams, G., Harvey, M., Blot, S., Kleinpell, R., Labeau, S.… & Ahrens, T.
(2011). Nursing considerations to complement the Surviving Sepsis Campaign
guidelines. Society of Critical Care Medicine, 39(7), 1800-1818. DOI:
10.1097/CCM.0b013e31821867cc
Burney, M., Underwood, J., McEvoy, S., Nelson, G., Dzierba, A., Kauari, V., & Chong,
D. (2012). Early detection and treatment of severe sepsis in the emergency
department: Identifying barriers to implementation of a protocol-based approach.
Journal of Emergency Nursing, 38(6), 512-517. doi:10.1016/j.jen.2011.08.011
Corfield, A. R., Lees, F., Zealley, I., Houston, G., Dickie, S., Ward, K., & McGuffie, C.
(2014). Utility of a single early warning score in patients with sepsis in the
emergency department. Emergency Medicine Journal, 31(), 482-487.
http://dx.doi.org/10.1136/emermed-2012-202186
Dellinger, R., Levy, M., Rhodes, M., Annane, D., Gerlach, H., Opal, S.…& Moreno, R.
(2013). Surviving Sepsis Campaign: International guidelines for management of
severe sepsis and septic shock, 2012. Intensive Care Medicine, 39, 165-228. DOI
10.1007/s00134-012-2769-8
Gaieski, D., Mikkelsek, M., Band., R., Pines, J., Massone, R., Furia, F.… & Goyal, M.
(2010). Impact of time to antibiotics on survival in patients with severe sepsis or
septic shock in whom early goal-directed therapy was initiated in the emergency
department. Society of Critical Care Medicine, 38(4), 1045-1053. DOI:
10.1097/CCM.0b013e3181cc4824

97
Hall, M., Williams, S., DeFrances, C., & Golosinskiy, A. (2011). Inpatient care for
septicemia or sepsis: A challenge for patients and hospitals. U.S. Department of
Health & Human Services, 62, 1-8.
Kleinpell, R., Aitken, L., & Schorr, C. (2013). Implications of the new internation sepsis
guidelines for nursing care. American Journal of Critical Care, 22(3), 212-222.
doi: 10.4037/ajcc2013158
Levy, M., Dellinger, R., Townsend, S., Linde-Zwirble, W., Marshall, J., Bion, J.… &
Angus, D. (2010). The Surviving Sepsis Campaign: results of an international
guideline-based performance improvement program targeting severe sepsis.
Intensive Care Medicine, 36:222-231. DOI 10.1007/s00134-009-1738-3
Nguyen, H. M., Schiavoni, A., Scott, K. D., & Tanios, M. A. (2012, July).
Implementation of sepsis management guideline in a community-based teaching
hospital - can education be potentially beneficial for septic patients? The
International of Clinical Practice, 66(7), 705-710.
http://dx.doi.org/10.111/j.1742-1241.2012.02939.x
Ospina-Tascon, G., Neves, A., Occhipinti, G., Donadello, K., Buchele, G., Simion, D.…
& Backer, D. (2010). Effects of fluids on microvascular perfusion in patients with
severe sepsis. Intensive Care Medicine, 36(6), 949-955.
Rory Staunton Foundation. (2016). What is Sepsis? Retrieved from
https://rorystauntonfoundationforsepsis.org/what-is-sepsis/
Winterbottom, F., Seone, L., Sundell, E., Niazi, J., & Nash, T. (2011). Improving sepsis
outcomes for acutely ill adults using interdisciplinary order sets. Clinical Nurse
Specialist, 25(4), 180-185. doi: 10.1097/NUR.0b013e318221f2aa
Zachar, J., Timsit, J., Garrouste-Oregeas, M., Francais, A., Vesim, A., Descorps-Declere,
A.… & Adrie, C. (2011). Outcomes in severe sepsis and patients with septic
shock: Pathogen species and infection sites are not associated with mortality.
Society of Critical Care Medicine, 39(8), 1886-1895. DOI:
10.1097/CCM.0b013e31821b827

98
An Exploration of Intended Use of Augmented Reality Smart Glasses
Philipp A. Rauschnabel
University of Michigan – Dearborn
Jun He
University of Michigan – Dearborn
Young Ro
Associate Professor of Operations Management
University of Michigan – Dearborn
Abstract
Numerous market research studies and an inspection of recent press releases among
leading IT companies indicate that a new form of wearable device might soon influence
the technology landscape: Augmented Reality Smart Glasses, that is, digital eye glasses
that integrate virtual information in one’s view-field. Yet, little is known about this
nascent technology. In this research, we draw upon prior technology acceptance research
and present the results of a large-scale cross-sectional study among 1,682 US-consumers.
The study identifies Usefulness, Ease of Use, Entertainment, Design, and Public Privacy
Issues as antecedents to usage intention. However, the strength of these effects differs
between usage contexts (at home, in public, at work). Implications for Scholars,
Managers, and Policy Makers are discussed.
The contribution of this study is as follows:
Identification of yet unknown drivers to smart glasses adoption
Exploring the privacy paradox
Presenting valuable pre-market knowledge of smart glasses for manufacturers,
app developers, and policy makers

99
An Exploration of Intended Use of Augmented Reality Smart
Glasses
Introduction
Recently, Samsung, Facebook, Amazon, Microsoft and many other established and start-
up companies have launched or announced glasses-like devices that offer what is termed
as Augmented Reality (AR) technology to integrate virtual information into a user’s field
of vision. These ‘smart glasses’ offer tremendous opportunities, for example, in
marketing, logistics, product development, manufacturing and production, medical care,
cultural management, and others (Rauschnabel, Brem & Ro, 2015; Muensterer et al.,
2014; Eisenmann et al., 2014). A recent study by Goldman Sachs (2016) concludes that
“as the technology advances, price points decline, and an entire new marketplace of
applications (both business and consumer) hits the market, we believe VR/AR has the
potential to spawn a multi-billion dollar industry, and possibly be as game changing as
the advent of the PC”.
Besides their practical importance, augmented reality smart glasses are also very
interesting from a theoretical perspective: smart glasses are worn like traditional glasses.
Thus, factors that are known from fashion adoption and that are typically not integrated
in technology adoption models might be relevant to smart glasses. Second, smart glasses’
AR component breaks the boundaries between reality and virtuality (Craig, 2013). Except
for a few AR applications for current devices, this is very novel to consumers, especially
since smart glasses integrate various types of information realistically within the
perception of visual reality. Third, in order to integrate virtual information, various
sensors (e.g. cameras) capture and process real world information. Consumers and media
widely criticize privacy concerns (Eisenmann et al., 2014) because smart glasses can
capture the personal aspects of a user as well as others (e.g. identifying other people with
face recognition software). Consequently, as smart glasses differ tremendously from
other mobile and wearable technologies, research is needed to understand consumers’
reactions towards them.
Grounded in the literature on technology acceptance, privacy risks and uses and
gratification theory, we develop a model to tackle the following research question: Which
factors drive the adoption of smart glasses? This model is then tested based on a broad
sample of 1,682 US consumers, and results provide insights into the mechanisms that
relate to smart glasses adoption intention.
The study has several contributions. On the theoretical front, we extent prior technology
acceptance, uses & gratification, and privacy concerns research. For example, while prior
research has studied privacy concerns as a threat to a user, we extent this by also looking
at threatening other peoples’ privacy. Likewise, we show that the design is an important
factor in smart glasses adoption, a factor that has been widely unstudied in related
technologies. Another contribution is that we compare the strength of the proposed
relationships between different usage contexts – at home, in public and at work. Results
show that the strength of our findings different between these contexts. On the

100
managerial front, this study provides valuable insights for manufacturers of smart glasses
by exploring factors that might determine their success. Policy makers can use our
findings to work on for the development of particular laws.
The remainder of this paper is as follows: After defining smart glasses and comparing
them with related technologies, we provide an overview of three relevant research
streams: Technology acceptance, uses & gratifications, and IT privacy. We then combine
these streams to develop a theoretical model consisting of X hypotheses and various
control variables. This model is then testes on a sample of 16XX US consumers. After a
discussion of the findings, we outline the implications for theory and practice as well as
avenues for future research.
Definition of Augmented Reality Smart Glasses
Computer Technologies, in the very early beginning, started as very task oriented and
utilitarian devices to be predominantly used in work-related contexts. Surely, IT
companies and consumers quickly realized the potential of computer applications,
including the Internet, in personal settings (e.g. personal use of office software, gaming,
etc.) and IT diffused to consumer markets. With the raise of mobile technologies (laptops,
cellphones, smartphones, tablets etc.) and mobile Internet, an ‘always and everywhere
online mentality’ has developed. Recently, companies have developed a new generation
of mobile devices that are fixed to a user’s body – wearables. Most wearables imitate the
physical characteristics as existing accessories (e.g. watches or bracelets), and prominent
examples are the Apple Watch (smartwatch) or FitBit (smart bracelet).
Applications on stationary devices typically provided a digital and virtual environment.
For example, while using applications such as Facebook or Instagram, users often
immerse in this virtual world and blind out what happens around them in the real-world.
Virtual Reality devices even go a step further. For example, VR glasses (such as Oculus
Rift) are wearable devices that worn like huge glasses and close-off completely from the
real-world. When using VR glasses, a user is presented as being in a virtual 3D world.
During the recent years, applications were developed that aimed at integrating virtual
elements in the physical environment. According to Craig (2013, p.20), Augmented
Reality (AR) is defined as a “medium in which digital information is overlaid on the
physical world that is in both spatial and temporal registration with the physical world
and that is interactive in time”. For example, smartphone users can use AR smartphone
app Wikitude and look at a famous building. Wikitude can then automatically identify the
building and include Wikipedia information about the building on the screen. Thus, in
contrast to VR, AR is not closed of from reality, but melts the real-world with the virtual
world.
Recent developments in IT aim at combining AR with wearables in glasslike devices.
Microsoft HoloLens, Google Glass (now: project aura), Everysight Raptor, ODG R-7 and
Epson Moverio are prominent examples of these developments, and Samsung, Zeiss,
Google, Amazon and other established and new companies have filed patents for, and
announced the launch of a technology that we term “Augmented Reality Smart Glasses”.
These technologies have gained high attention in the industry (REF), and in the recent

101
academic literature (REFS), and are termed Augmented Reality Smart Glasses:
“Augmented Reality Smart Glasses are defined as wearable Augmented Reality (AR)
devices that are worn like regular glasses and merge virtual information with physical
information in a user’s view field.” (Rauschnabel, Brem & Ro, 2014). Synonyms are AR
glasses, smart glasses, or data glasses.
Theory
Overview of Prior Research
Scholars in other disciplines, including IT and medicine, have studied the technological
aspects of smart glasses, and its applications in various medical settings. However, not
much research has been done to understand the adoption and use of smart glasses from a
business or consumer/user perspective.
These few exceptions include a recent study from Rauschnabel, Brem and Ivens (2015),
which studied the awareness and adoption intention of smart glasses. Using the example
of Google Glass, topenness and conscientiousness were personality traits positively
associated with the level of knowledge consumers have about smart glasses. Furthermore,
the authors showed that functional benefits and descriptive social norms were positively
associated with adoption intention, whereas the strength of these effects differed between
different personality types. Weiz et al (2016) conducted a similar study and showed that
usefulness and social norms influence actual use of Google Glass. Eisenmann et al.
(YEAR) conducted a case study on google glass and discussed various technological and
social factors – such as being insulted as a ‘glass hole’ while wearing them. They also
discussed applications in business. Hein & Rauschnabel (2016) echoed the potentials of
smart glasses in enterprise settings and discussed new opportunities for Enterprise Social
Networks. A core factor of their model was data security – both from a user (privacy) and
from a company perspective, and called for research in this vein. Rauschnabel & Ro
(2016) studied the relationship between Google’s reputation in handling user data, and
consumer’s reaction towards Google Glass. However, no significance was found. This
could either be because the authors measured a very abstract privacy image of the
manufacturer brand, rather than to the risks associated with the specific technology, or
because privacy concerns matter more with regards to other people (i.e., wearing smart
glasses threatens other people’s privacy) rather than to the risk of a user’s privacy.
Usefulness, ease of use, social norms, consumers’ attitude towards the brand Google, and
their level of technology innovativeness were found to be associated with adoption
intention.
However, a lack of research on privacy issues in smart glasses research is not the only
gap the extant literature. Various other antecedents have not yet been studied. For
example, manufacturers advertise that smart glasses could fulfil entertainment needs. For
example, Microsoft (2015) just recently announced the opportunities of fighting against
virtual enemies in one’s home. Likewise, wearables in general (and thus also smart
glasses), are visible worn and thus influence a user’s appearance. However, empirical
examinations of the expected entertainment value and the design remain scarce. Stock

102
and colleagues (2016) found perceived enjoyment as a determinant of intention to use
Google Glass, and that enjoyment is negatively influenced by health risk.
Another stream of research has studied other wearables. For example, Kim & Shin
(YEAR) developed an acceptance model based on a sample of users of wrist-wearable
devices and included design and comfort factors in their model. Chuah and colleagues
(2016) studied smartwatches among non-users and found that people perceive
smartwatches as a technology, fashion, or both. They also found that visibility of the
smartwatch is a core determinant of acceptance and adoption intention of smartwatches.
Summarizing this research, we propose that at least three theoretical streams need to be
incorporated in order to better understand smart glasses adoption: Technology
Acceptance, Privacy Concerns, and uses and Gratification Theory. Before using these
theories to develop and test a conceptual model, we will provide a brief overview in the
following sections.
Technology Acceptance Research
Individuals’ acceptance of information technologies has been subject to research since
the advent of the personal computer. Of the various theories and approaches that have
been put forth to address the issue, Technology Acceptance Model or TAM (Davis 1986,
1989) has received arguably the most research attention in the field of information
systems research (King and He 2006). Meta-analytic studies have concluded that TAM is
a parsimonious and powerful model to explain people’s behavioral intention to adopt and
use a new technology (King and He 2006).
TAM has its theoretical roots in behavioral research about behavior formation (e.g.,
Theory of Reasoned Action) and psychology research about behavior regulation and
change (e.g., Social Cognitive Theory) (Davis 1989, Davis et al. 1989). The core model
of TAM postulates that one’s behavioral intention (BI) to adopt/use a certain technology
is determined jointly by two important perceptions that the person has formed toward the
target technology, i.e., perceived ease of use, defined as ‘the degree to which a person
believes that using a particular system would be free of effort” (Davis et al, 1989, p. 320),
and perceived usefulness, defined as “the degree to which a person thinks that using a
particular system would enhance his or her job performance” (Davis et al, 1989, p. 320);
in addition, perceived usefulness partially mediates the relationship between perceived
ease of use and behavioral intention.
The parsimony of TAM, although a distinguished strength, also represents a common
criticism of the theory that various aspects of decision making across different
technologies are neglected (Bagozzi, 2007). Researchers have attempted to extend TAM
by incorporating other factors such as task (Chau and Lai 2003), social (Venkatesh &
Davis 2000, Lewis et al., 2003), culture (Huang et al 2003), and demographics
(Venkatesh & Morris 2000). A notable example is the proposal of unified theory of
acceptance and use of technology (UTAUT, Venkatesh et al., 2003) in which TAM is
integrated with seven other decision making theories. Empirical testing results conclude a
complex model with the addition of two determinants including social influence and

103
facilitating conditions, and four moderators of key relationships. Venkatesh et al. (2012)
further extend UTAUT in a consumer context by incorporating three constructs of
hedonic motivation, price value, and habit as antecedents of behavioral intention.
Prior research on smart glasses as well as in most technology acceptance research has
treated adoption intention as a single construct. That is, these studies did not distinguish
between the use of a technology (e.g. smart glasses) at home, at work, or even public.
However, one could argue that the likelihood of using a technology differs in different
usage contexts.
Privacy Concerns Research
Business researchers have long noticed that the development of information technology
poses a number of threats to individual privacy (Mason, 1986; Rothfeder, 1992). As
pointed out in Collier (1995), “(privacy concerns) is about the perceived threat to our
individual privacy owing to the staggering and increasing power of information-
processing technology to collect vast amounts of information about us… outside our
knowledge, let alone our control” (p. 41). As technologies become increasingly personal,
ubiquitous, and pervasive (Ackerman, 2004), privacy concerns are often amalgamated
with the design and development of new technologies. “In these highly personalized
technological settings, talking about technology without considering the privacy
implications, and vice versa, will be fruitless” (Junglas et al., 2008; p. 390).
Accordingly, many researchers conceptualize privacy concerns as general concerns that
reflect individuals’ inherent worries about possible loss of personal information from
using a target technology (Lally, 1996; Malhotra, Kim, & Agarwal, 2004). Privacy
concerns affect the perceived trustworthiness of the technology and create a
psychological barrier of risk, which involves both uncertainty (Lewis and Weigert, 1985)
and vulnerability (Barney and Hansen, 1994), and therefore affect one’s willingness of
adopting and using the technology (Connolly and Bannister, 2007).
Centering on personal information in the conceptualization of privacy, however, leaves a
gap in the context of many new technologies that are designed for social interactions
among and beyond users. Users of social network sites often post information about
people they know without asking their permission (Nissenbaum, 2010; Viegas, 2005).
For Tweeter, it is found that any retweeted tweet reaches an average of 1,000 users
regardless of the number of followers of the original message’s creator (Kwak et al.,
2010). The Apple iCloud security incident serves as another example. On August 31,
2014, various celebrity iCloud accounts were compromised. The incident drew public
criticism from both users and non-users of Apple iCloud service. The breach may have
been caused by the exploit of “Find My iPhone” (Engadget, 2016). These examples
demonstrate that people are living in a technology-enabled connected world, where one’s
network serves as a node of another’s network to form a much larger network. The flow
of information is beyond the comprehension and control of any individual, and can be
affected by a technology even if the person does not use the technology. As such, it is
probable that one’s use of a technology leading to privacy concerns of others may affect
the person’s acceptance and use behavior of the technology. This issue, however, has not
been investigated in the existing privacy research literature.

104
Uses and Gratification Theory
Espoused by communications scholars, Uses and Gratification Theory was originally
applied to address how and why people accept new forms of media (e.g. mobile phones,
internet, social media, etc.) but has grown in prevalence among technology adoption
scholars (e.g. Ko, Cho, & Roberts, 2005; Ruggiero, 2000; Stafford, Stafford, & Schkade,
2004; Eighmey & McCord, 1998; Leung & Wei, 2000). Uses and Gratification Theory
concerns itself with an individual’s motivations to use or adopt a particular technology or
media (Ruggiero, 2000; Stafford, Stafford, & Schkade, 2004; Mondi, Woods, & Rafi,
2008) since potential users seek different gratifications from various technologies and
media (Sheldon, 2008). The various categories of needs or gratifications individuals seek
for can be divided into groups such as diversion (release from problems and stress),
personal relationship (social advantage and connection), personal identity (understanding
of self and values), and surveillance (observation and sense-making of the environment)
(McQuail, Blumler, & Brown, 1972). In later years, scholars have even researched and
added a few other categories (Sheldon, 2008). Uses and Gratification Theory has been
questioned for concentrating too restrictively on the individual user (Elliot, 1974) and not
explaining the reasons for which potential users adopt a certain technology or medium, or
even how different types of gratifications result from the adoption of technology or media
(Sheldon, 2008). But in general, Uses and Gratification Theory addresses motivational
drivers for technology and media use, determinants that impact these drivers, and
consequences from technology- and media-related behaviors (Sheldon, 2008).
Model Development
Model overview
To better understand consumers’ adoption of smart glasses, we propose the following
model: For simplicity and as proposed by the latest technology acceptance theories, we
model direct effects from antecedents to usage intention. Furthermore, we look at the
influence on the adoption intention as a whole, as well as in specific contexts, particularly
at home, in public, and at work in post hoc analyses. Finally, we consider various control
variables in the model.
Hypotheses
Usefulness and Ease of Use
Replicating the robust findings of TAM and its extensions, we propose that the degree to
which consumers perceive a technology to be ‘useful’ and ‘easy to use’ should determine
its adoption intention. For the purpose of this context, we define usefulness as the degree
to which a technology helps a consumer to make his/her life more efficient – for example,
by organizing appointments, receiving particular information, and so forth. Thus:
H1: Perceived usefulness is positively related to usage intention.
H2: Perceived ease of use is positively related to usage intention.

105
Privacy Concerns
One of the core criticisms of smart glasses is the potential threat to privacy. We see two
possible threats to privacy: Threatening the privacy of a user (H4) and of people
associated with a user (H5). The former is derived from the existing literature of privacy
research; the latter, as aforementioned in the theory section, comes from our notion of
intensive social interactions among users and non-users of a new technology, a typical
use environment for smart glasses.
A user’s privacy could be threatened if, for example, hackers get access to a device and
see what a user sees. The concern of privacy being threatened thwarts the development of
trust in the technology and results in a perceived risk of losing privacy from using the
technology (Connoly and Bannister 2007). As people generally care about their privacy,
the risk of losing their personal privacy is likely to be barrier to adoption.
As smart glasses automatically screen and process a user’s environment, this does not
only affect a user’s privacy, but also the privacy of the people around them. In decision
making, people often take into account how other people perceive their behavior.
Likewise, most people are generally interested in maintaining their social relationships
and avoiding interpersonal conflicts. In the context of smart glasses, newspapers have
reported various cases where Google Glass users were physically attacked by non-users
who feared their privacy was being threatened (Eisenmann et al., 2014). Thus, the extent
to which a consumer thinks that smart glasses threaten the privacy of other people,
termed as public privacy in our study, is postulated to negatively influence adoption
intention.
H3: The risk of threatening a user’s privacy is negatively related to smart glasses
adoption.
H4: The risk of threatening the privacy of other people is negatively related to
smart glasses adoption.
Perceived Loss of Control
Scholars studying the role of new technologies have studied user’s fear of being
controlled for decades (e.g., Park et al., 2012), often in the context of users’ perceived
autonomy (e.g. Walter & Succi Lopez, 2008). Particularly, users’ fears that a technology
takes control over a user – for example, by leading them to wrong decisions – was found
to be negatively related to technology adoption and use. This perceived loss of control
seems to be plausible among smart glasses, too – especially, as smart glasses integrate
information in one’s view field (Rauschnabel, Brem & Ro, 2015; Eisenmann et al.,
2013). That is, the negative consequences of having ‘wrong’ information realistically
integrated in one’s perception of the reality could be much more likely to lead a user to
make wrong decisions.
H5: Perceived loss of control is negatively related to smart glasses use.

106
Entertainment
With regards to the hedonic notions of entertainment and enjoyment, TAM, in and of
itself, does not strongly account for the potential motivating effect of hedonic factors
(Taylor, Lewin, & Strutton, 2011). However, subsequent extension of the initial TAM
suggests that a factor termed perceived enjoyment (Venkatesh, & Bala, 2008) serves as an
antecedent to technology adoption. Perceived enjoyment describes the extent to which
“the activity of using a specific system is perceived to be enjoyable in its own right, aside
from any performance consequences resulting from system use” (Venkatesh, 2000, p.
351). In addition to this extension of TAM, Uses and Gratification Theory, as an alternate
theory of technology adoption and use, does take the motivating influence of hedonic
factors into account (Taylor, Lewin, & Strutton, 2011). As described previously,
entertainment and enjoyment are non-utilitarian gratifications that motivate potential
users to adopt a new technology (Nysveen, Pedersen, & Thorbjornsen, 2005). Scholars
from communication science have even found that enjoyment is an important
motivational determinant of the use of new technology and media (Igbaria, Parasuraman,
& Baroudi, 1996; Dabholkar & Bagozzi, 2002; Johnson, Zinkhan, & Ayala, 1998).
Likewise, adding virtual information in one’s view-field could offer tremendous
opportunities to entertain - for example, as advertised by Microsoft in their HoloLens
trailer. Thus:
H6: Entertainment Benefits are positively related to smart glasses use.
Negative Influence on Self-Presentation
“Smart glasses are, as any wearable devices, also a new form of fashion accessory for
users.” (Rauschnabel, Brem & Ro, 2015, p. 13). Thus, psychological similarities between
what is known from fashion adoption and smart glasses are very likely. A recent study by
Kim & Shin (2015) on smart watches has shown that subcultural appeal – that is, the
extent to which using a smart watch helps a user differentiate and stand apart from others,
drives user’s intention to reuse their smart watch. Likewise, Chun et al. (2016) support
this view by showing that people tend to evaluate wearables based on the level of
usefulness and visibility. Likewise, we propose that people who think that wearing smart
glasses improves their appearance will be more likely to use them. The theoretical
rationale for this is as follows:
As smart glasses are worn like regular glasses, they are visible to other people, similar to
cloths and other accessories are. Nowadays, social interactions are often very short. Thus,
individuals are forced to make judgements about other people very briefly. In these
situations, fashion aspects, including clothes, cosmetics or trinkets, are of particular
importance (e.g., Douty, 1963; Holman, 1980; Judd, Bull, & Gahagan, 1975; Tunca &
Fueller, 2009). Bierhoff (1989) echoed this view and outlined that initial person
judgements are predominantly driven by visible cures (here: smart glasses in a user’s
face) than less visible cues (e.g., a smartphone). Finally, Belk (1978, p. 39) concludes

107
that “[i]n virtually all cultures, visible products and services are the bases for inferences
about the status, personality, and disposition of the owner or consumer of these goods.”
(Belk 1978, p.39)
While there is agreement that people make use of visible cues to judge other people, there
is also evidence that people intentionally manage visible cues. For example, consumers
tend to buy luxury products that are visible for other for symbolic reasons. These
symbolic reasons include reflecting their actual or desired social status (Wilcox, Kim, &
Sen, 2009) or one’s personality. People also tend to ‘like’ brands on Facebook that reflect
who they are or want to be (REF). Not surprising, research on decision making in fashion
settings found that consumers’ liking of the design plays a crucial role in clothing
adopting (REF). Finally, Kim & Shin argue that people have a more positive attitude
towards their smartwatch if they think it can help them differentiating from others.
Echoing these findings suggests that the evaluation of the design of smart glasses should
be a particular role, especially since influences how other people perceive a user while
wearing smart glasses. Currently, available smart glasses (e.g. ODG R-7 or Microsoft
HoloLens) are still characterized by being somehow ‘technological’ and ‘bulky’
H7: Negative Influence on Self-presentation is negatively related to smart glasses
use.
Control variables:
As smart glasses technology is still relatively new, the degree to which a consumer is
familiar with the technology might influence adoption intentions. Familiarity is defined
as the degree of a person’s direct and indirect experience with smart glasses (Coupey,
Irwin, & Payne, 1998; Kent & Allen, 1994). It represents the mental knowledge structure
consumers have about smart glasses. Thus, consumers with more (versus less) knowledge
might have a better (vs. lower) level about the opportunities and use cases associated with
smart glasses. Including familiarity as a control variable could parcel out this variation.
Likewise, age and gender are included in the model as they represent common control
variables (Chang & Zhu, 2012; Correa, Hinsley, & De Zuniga, 2010).
Methodology and Research Design
In order to cover a broad sample of respondents, we applied an online survey with the
help of a commercial market research institute. A sample consisting of 1,682 respondents
covered a broad range of demographics, as shown in table X. Respondents perceived
financial compensation for participation.
The questionnaire began with a short description and a few example pictures of smart
glasses (see appendix). Then the quantitative measures followed. As length restrictions
limited the amount of questions in the questionnaire, we applied a single-item measure
approach (for a justification of this approach, see Bergkvist & Rossiter, 2007). Although
not without criticism (c.f. Diamantopoulos et al. 2012 for a discussion), using single
items in robust theoretical frameworks, such as TAM (Rossiter & Braithwaite, 2013;
Kang & Kim, 2006), is not new and can be associated with advantages such as reduced
response fatigue and enable larger samples. Additionally, Nunnally (1978) and

108
Venkatraman and Grant (1986) defend the use of single-item measures if constructs, as in
this study, are unidimensional.
Rather than focusing on the respondent (“smart glasses can make my life more
efficient”), we focused neutrally on the technology (“Smart glasses can make a user’s life
more efficient”). This is based on the assumption that the evaluation of a technology in
neutral terms reduces the risks of being biased by one’s overall evaluation. For example,
if a user, for any reason, is totally against the technology, this user’s negative evaluation
might influence his reply on the personal usefulness. By focusing on the technology
(rather than including the user) before measuring the user-specific dependent variables,
we hope to parcel out this variance. In addition, by parceling out this variance, common
method variance might decrease.
To identify appropriate single-item measures, we reviewed the existing technology
acceptance and adoption literature. Based on this, we identified items with either high
factor loadings or items that covered the constructs completely (rather than just one
particular aspect). For example, to measure perceived usefulness, we first identified
related studies in a personal context. For example, in UTAUT2 (Venkatesh, Thong & Xu,
2012) performance expectancy, an equivalent to perceived usefulness, is measured with
three items that cover (1) the usefulness in a user’s daily life, (2) to help a user
accomplish his/her goals, and (3) increases a user’s productivity. In short, all of them
cover the degree to which a technology makes a user’s life more efficient’. Thus, we
proposed a single item “Smart glasses can make a user’s life more efficient”. These steps
were conducted for all constructs.
In the second step, we conducted two pre-studies. In the first pre-study, twenty-seven
undergrad students of a North-American University answered the questionnaire (paper-
pencil) and were asked them to answer the questionnaire and to comment on anything
that was unclear to them. This led to some minor adjustments. Then, this adjusted version
was discussed with three undergrad students who were not involved in pre-study 1. One
of these students had a high level of knowledge on smart glasses from a prior class-
project, whereas the others did not. Respondents were asked to re-write each item using
different words. For example, the responses for usefulness were “These glasses will make
a user’s life easier, tasks will become easier”, “smart glasses can make everyday tasks
easier” and “smart glasses can help people be more productive overall”. A further verbal
discussion with these students and an assessment of the semantic equivalence of their
replies with established TAM items revealed semantical equivalence. These procedures
were conducted for all items.
As in any study with self-reported data, common method variance could threaten the
results. A model (χ2 (54df) = 2031.545; CFI=663; TLI=.589, SRMR=.118, RMSEA
=.148) in which all continuous variables loaded on a single factor had a significantly (Δ
χ2 = 105.484; Δ d.f.=36; p<.001) worse fit than the overall framework (χ2 (18df) =
105.484; CFI=.973; TLI=.954, SRMR=.016, RMSEA=.044; continuous variables
included only) and a very low average variance extracted (AVE = .30). Thus, common
method variance is unlikely to threaten our results.

109
Results
We applied structural equation (SEM) and path modeling in MPlus 7.2 to analyze the
data, applying a Maximum Likelihood Estimator with robust error terms. We first started
with a SEM in which the three usage variables (at home, in public, at work) were
modeled as a reflective latent construct. The evaluation of this overall usage construct
shows adequate psychometric characteristics. Particularly, all standardized path
coefficients of the confirmatory factor analysis were significant (p<.001) and above .8,
exceeding the recommended threshold of .5. Furthermore, with an AVE = .721, the
average variance extracted exceeded .50, indicating that the variance due to measurement
error is lower than the variance due to the usage-construct. Thus, convergent validity is
given. Finally, Cronbach’s Alpha (α=.885) and Composite Reliability (C.R.=.886) exceed
.7, and thus reveal satisfactory reliability and internal consistency.
We then modeled the influence of the proposed independent variables on the usage
construct. Although the χ2 of 107.10 (20df) was significant (p<.001), the evaluation of the
overall model did not indicate any concerns, as reflected by an acceptable model fit
(RMSEA = .051; CFI=.973; TLI = .956; SRMR = .015).
RQ1: Hypotheses Testing
Table 1 presents the standardized coefficient of the structural equation model. The results
support H1, H2 and H3 by showing that both traditional TAM variables, perceived
usefulness (β=.427; p<.001) and perceived ease of use (β=.101; p<.001) positively relate
to overall smart glasses use intention, as well as entertainment value (β=.121; p<.001).
Neither the risks of potential negative consequences of one’s privacy (β=.012; p=.673),
nor the risk that smart glasses take control over a user (β=-.013; p=.551) showed
significant effects, rejecting H4 and H6. However, the fact that smart glasses influence
other people’s privacy (β=-.086; p=.002) showed a significant path coefficient,
supporting H5. All control variables (familiarity with smart glasses technology: β=.268;
p<.001; age: β=-.101; p<.001: gender: .083; p<.001) showed significant effects. All
variables together explained 60.7% of the variance in overall use intention.
Table 1: Structural Equation Model
DV: Overall Use Intention Beta p
H1: Perceived Usefulness .427 <.001
H2: Perceived Ease of Use .101 <.001
H3: Entertainment Value .121 <.001
H4: Personal Privacy Concerns .012 .673
H5: Public Privacy Concerns -.086 .002
H6: Negative Influence on Self-Presentation -.149 <.001
H7: Perceived Loss of Control -.013 .551
Control Variables
Familiarity with Smart Glasses Technology .268 <.001
Age -.101 <.001

110
Gender .083 <.001
R squared .607 <.001
Note: standardized coefficients presented only.
RQ2: Difference in Adoption Contexts
Although the analysis of the use construct shows a high internal consistency, one could
argue that different theoretical mechanisms drive consumers’ intention to use smart
glasses at home, in public, and at work, respectively. Thus, we ran an additional path
model with three independent single item measures. We applied an MLR estimator in
Mplus to estimate the path model (TLI=1.0; CFI=1, SRMR=.0). To account for shared
variance in the three dependent usage-variables, we modeled correlations between their
error variances.
Table 2: Path Model with three dependent variables
In public At home At work
DV: Use Intention β p β p β p
Perceived Usefulness .367 <.001 .344 <.001 .381 <.001
Perceived Ease of Use .089 <.001 .105 <.001 .058 .025
Entertainment Value .111 <.001 .148 <.001 .038 .134
Personal Privacy Concerns -.005 .870 .007 .812 .034 .263
Public Privacy Concerns -.091 .001 -.088 .001 -.033 .259
Negative Influence on Self-
Presentation -.168 <.001 -.116 <.001 -.088 <.001
Perceived Loss of Control .008 .700 -.014 .532 -.031 .159
Control Variables:
Familiarity with Smart Glasses
Technology .231 <.001 .178 <.001 .285 <.001
Age -.046 .015 -.111 <.001 -.107 <.001
Gender .064 .001 .076 <.001 .073 <.001
R squared .468 <.001 .446 <.001 .417 <.001
Note: standardized path coefficients presented only.
The results show some differences and similarities between the three variables. First,
perceived usefulness and perceived ease of use seem to be important for all three
application scenarios; however, the influence of perceived ease of use in work settings is
relatively low and only significant at a 5%-level. Entertainment is important for usage at
home (β=.148, p<.001) and in public (β=.111, p<.001), but not at work (β=.038, p=.134).
The risk of losing one’s privacy or that smart glasses take control over a user were
insignificant in all scenarios. The risk of negatively influencing public privacy, however,
was significantly related to usage intention in public (β=-.091, p<.001) and at home (β=-
.088, p=.001), but not at work (β=-.033, p=.259). Again, all control variables were
significantly related to all three dependent variables. An interesting finding is that
familiarity with smart glasses technology is much stronger related to usage intention at

111
work (β=.285; p<.001) than to usage intention in public or (β=.231; p<.001) at home
(β=.178; p<.001).
Robustness Tests
We conducted several robustness tests to assess the stability of our findings. First, we ran
traditional OLS regression analysis and replicated the basic patterns of all findings.
Second, rather than investigating each of the three use variable in a combined model, we
calculated three independent models in which each independent variable was assessed
independently. The results were quite similar. Third, we replicated the second step, but
included the other dependent variables as control variables. For example, when assessing
usage intention in public, we added usage intention at home and at work as additional
covariates in the model. These results were quite similar, but effect sized decreased. An
alternative approach of this assessment is to estimate the factor score of the overall use
construct and to include this as a control variable in the model. By controlling for this
score, the shared usage variance is parceled out. That is, the remaining variance consists
of the context specific variance and the error variance. Both approaches replicated our
findings. Fourth, we ran the model only with the influence on public privacy, and only
with influence on personal privacy. The results remained stable, indicating that potential
mediating effects of these two variables did not influence our results. Fifth, we excluded
familiarity from the model and ran all analyses independently for high versus low levels
of familiarity. A comparison of these two equally large sub-groups did not indicate any
substantial differences, indicating that the novelty of the technology did not bias our
results noticeably. Sixth, one could argue that respondents who are currently not working
might bias the results for the work related use. Therefore, we re-estimated the effects of
the path-model only for the respondents who are currently fulltime or part-time
employed, or self-employed. The weak effect of perceived ease of use of β=.058 reported
above decreased to β=.038 and became insignificant (p=.244), but all other effects were
very similar. Finally, we re-estimated all analyses and robustness tests using different
estimators, leading to very similar effects. In sum, all robustness tests indicate that the
findings reported above seem to be stable.
Discussion
Summary of the findings
The results show that basic TAM patterns were replicated among smart glasses:
Particularly, the results reported above clearly show that perceived usefulness and
perceive ease of use are stable findings for usage intention. Entertainment value was
found to be important for the intention to use smart glasses at home and in public, but not
in work-related contexts. The fear that smart glasses could threaten a user’s privacy or
even take control over him/her did not significantly relate to any of the dependent
variables. However, influencing other people’s privacy as well as presenting oneself in a
negative way decreased the propensity to adopt smart glasses.
Theoretical Implications

112
Not much research has been done to understand the theoretical mechanisms of smart
glasses adoption. The findings on this study extend our knowledge by shedding
additional light into existing mechanisms, and new ones. These findings are discussed
below.
Perceived ease of use and usefulness
TAM has its roots in work-related environments, and thus, traditionally, perceived
usefulness covered aspects such as getting one’s work accomplished in a more
economical or faster way. In this research, we redefined perceived usefulness to a
personal context. Particularly, we defined PU as the degree to which smart glasses help
making a user’s life more efficient. However, in line with traditional TAM research, PU
was found to be significantly related to usage intention, which is in line with prior smart
glasses research (Rauschnabel & Ro, 2016; Hein & Rauschnabel, 2016; Rauschnabel,
Brem & Ivens, 2015).
Privacy Issues
Privacy issues for a user do not relate to adoption intention. This is in line with
Rauschnabel & Ro (2015) who did not find a relationship between Google’s data privacy
image and consumers’ intention to adopt Google Glass. However, this study extended
these findings by looking at how smart glasses influence the privacy of other people. Our
results indicate that consumers who think that smart glasses influence the privacy of other
people are less likely to use smart glasses, especially at home or in public. A possible
theoretical explanation could be norms. Prior research has shown that social norms play
an important role in predicting technology adoption. That is, if people think other people
expect them to use smart glasses, they are more likely to adopt them. It could be the case
that public privacy concerns negatively influence social norms, and thus lead to a lower
adoption intention. However, testing this mediating role of social norms is up for future
research.
Entertainment
Prior research has not yet looked at how the expected entertainment value of smart
glasses is related to the adoption intention. Our study shows that consumers already
perceive a high entertainment value (as reflected by a mean of 4.70), that also drives
usage intention at home or in public. This finding is in line with smart phone usage,
which shows that consumers use smart phones to organize their life (i.e. perceived
usefulness) and to be entertained. The effects of entertainment value on intention reported
above are much lower than for ease of use; however, this could be due to the novelty of
the technology. For example, when the first cell phones in the 1990s were provided, they
mostly satisfied needs related to perceived usefulness. Not surprisingly, business people
were most likely to adopt cell phones that time. Later, when cell phone technology was
further developed, manufacturers communicated the potential of cell phones to satisfy
entertainment needs to potential customers outside the professional setting.

113
Influence on Appearance
In contrast to most other technologies, smart glasses are extremely visible to other
people. Thus, whereas a smart phone, tablet, or even smart watch can somehow be
‘hidden’, smart glasses – like regular glasses – are worn very central on a user’s face. In
other words, smart glasses are not only a technology, they also represent a fashion
component. This is reflected by the influence of self-presentation. Particularly, those
individuals who think that wearing smart glasses makes them look ‘strange’ are less
likely to use them, especially in public. This is an important finding, as the relatively high
mean (m=4.78) suggest that a majority of people perceive smart glasses as having a
negative influence on their physical appearance.
Managerial contribution
Although building AR technologies, and getting them to a size that fits into glasses-like
devices is a masterly performance of engineers, and developers deserve credit for recent
developments in applications that can be easily used and make user’s lives more efficient,
new challenges arise for smart glasses (and other wearables, too). Whereas traditional
devices have not been ‘used’, smart glasses are also worn. Thus, manufacturers of smart
glasses need to be aware of the design and the (perceived) influence smart glasses have
on other people. Rather than focusing isolated on the technological component, the
fashion component needs to be addressed when developing and managing smart glasses.
We did not find any potential negative consequences of being associated with a risk of
threatening a user’s privacy. However, IT security still remains a challenge to be
addressed by managers. Lacks could lead to negative publicity, an overall negative image
of the technology, and so forth. Finally, the biggest potentials for smart glasses, in the
current stage of development, are in work-related contexts. Here, increased in the
efficiency seems to be the core driver, and aspects such as user-friendliness and design
seem to be at least less important than in public contexts. Thus, similar to laptop
computers, cell-phones and many other technologies, starting in a professional contexts
(for examples, see Hein & Rauschnabel, 2016) seems to be a promising strategy.
Subsequently, manufacturers should focus on improving design and user-friendliness of
smart glasses, and forcing the development of apps that satisfy personal needs – such as
entertainment.
Limitations and Future Research
As any research, this study has some limitations. There has been a huge discussion of
whether single item measures are appropriate or not. Although this approach has been
established in prior TAM studies, and our measures have been developed very carefully
and validated in pre-studies, a risk that some items did not cover the each construct
entirely remains. Furthermore, this study focused on direct effects only, and several
moderating and mediating effects were not studied. Finally, although a large cross-
sectional US-based sample provides a good overview of how Americans think about
smart glasses and what drives their intentions, this cultural focus and the focus on
intentions (rather than actual behavior in the future) remain limitations.

114
Besides addressing these limitation, several other areas for future research arise. For
example, the role of privacy issues. Is privacy really unrelated to adoption or might there
be indirect routes, maybe mediated by perceived risk? And, in line with our theorizing,
are public privacy concerns mediated by social norms? In line with this, groundwork is
needed to better understand the evaluation of smart glasses from the view of non-users
who interact with users. Once more smart glasses will be launched and opportunities will
arise to study these questions in practice. Finally, we have shown that design factors play
an important role. However, what remains unknown is: What does “good design” mean
when it comes to smart glasses? Should it incorporate aspects of a fashion accessory, or a
technology for ‘geeks’ and ‘nerds’, or more commonplace like everyday spectacles?
Further exploratory research is needed to understand this.
Conclusion
To the best of the authors’ knowledge, this is the first large-scale study that explores and
investigated theoretical mechanisms of smart glasses in various usage contexts. The
findings reported in the current research contribute to our understanding of this new type
of devices – however, rather than talking about a technology, the fashion components
suggest to talk about a ‘fashnology’.

115
References
Bergkvist, L., & Rossiter, J. R. (2007). The predictive validity of multiple-item versus
singleitem measures of the same constructs. Journal of Marketing Research, 44(2), 175–
184.
Rossiter, J. R., & Braithwaite, B. (2013). C-OAR-SE-based single-item measures for the
two-stage Technology Acceptance Model. Australasian Marketing Journal (AMJ), 21(1),
30-35.
Bodine & Gemperle 2003
Kang, Y. S., & Kim, Y. J. (2006). Do visitors' interest level and perceived quantity of
web page content matter in shaping the attitude toward a web site?. Decision Support
Systems, 42(2), 1187-1202.
Venkatesh, V. (2000). Determinants of perceived ease of use: Integrating perceived
behavioral control, computer anxiety and enjoyment into the technology acceptance
model. Information Systems Research, 11, 342–365
Venkatesh, V., & Bala, H. (2008). Technology acceptance model 3 and a research agenda
on interventions. Decision sciences, 39(2), 273-315.
Nissenbaum, H. (2010). Privacy in context: Technology, policy, and the integrity of
social life. Stanford, CA: Stanford Law & Politics.
Kwak, H., Lee, C., Park, H., & Moon, S. (2010). What is twitter, a social network or a
news media? The Proceedings of the 19th International Conference on World Wide Web,
Raleigh, NC.
Connolly, R., and Bannister, F. (2007) Consumer trust in Internet shopping in Ireland:
towards the development of a more effective trust measurement instrument. Journal of
Information Technology, 22, 102–118.

116
Appendix
Appendix A: Measures
Construct and Definition Measure
Dependent Variables
Usage Intention
… in public
I could imagine using smart glasses in public.
… at home I could imagine using smart glasses at home.
… at work I could imagine using smart glasses at work.
Independent Variables
Perceived Usefulness
The extent to which smart glasses can increase a
user’s efficiency of daily tasks.
Smart glasses can make a user’s life more efficient.
Entertainment Value Smart glasses can offer new forms of entertainment
to users.
The extent to which smart glasses are associated
with providing an entertainment value to a user.
Perceived Ease of Use Understanding how to use smart glasses is easy.
The amount of cognitive effort that is associated
with using smart glasses.
Personal Privacy Concerns Using smart glasses would threaten a user’s
privacy.
The perceived risk that using smart glasses could
threaten a user’s privacy. Privacy is an established
overall term that covers various aspects to personal
information
Public Privacy Concerns Using smart glasses would threaten other peoples’
privacy.

117
Negative Influence on Self-Presentation Wearing smart glasses makes people look strange.
The extent to which wearing smart glasses
negatively influences how a user is perceived by
other people.
Perceived Loss of Control Smart glasses could take control over a user.
Familiarity with Smart Glasses Technology I am familiar with smart glasses technology.
Seven point Likert scales, anchored from 1=totally disagree,2, 3, 4 = moderately agree, 5, 6, 7 = totally agree

118

119
Descriptive Statistics and Correlations
Mean SD 1 2 3 4 5 6 7 8 9 10 11 12
1: Usage in Public 3.10 1.86
2: Usage at Home 3.44 1.99 .735
3: Usage at Work 2.96 1.91 .712 .717
4: Perceived Usefulness 4.01 1.59 .571 .563 .527
5: Entertainment Value 4.70 1.55 .422 .446 .364 .596
6: Perceived Ease of Use 3.76 1.48 .447 .449 .409 .502 .425
7:
Personal Privacy Concerns 4.26 1.70
-
.157
-
.131
-
.064
-
.063
-
.011
-
.043
8:
Public Privacy Concerns 4.58 1.77
-
.171
-
.146
-
.075
-
.035 .054
-
.039 .686
9: Negative Influence on Self-
Presentation 4.78 1.68
-
.289
-
.232
-
.179 -.18
-
.022
-
.125 .358 .384
10:
Perceived Loss of Control 3.47 1.87
-
.078
-
.087
-
.065 -.02
-
.023 .016 .412 .365 .231
11: Familiarity with SG
Technology 2.75 1.72 .402 .375 .446 .231 .216 .398
-
.011
-
.006
-
.027 .006
12:
Age 46.50 15.78 -.16
-
.218
-
.233
-
.112
-
.099
-
.149
-
.046
-
.010
-
.041 .067
-
.272
13:
Gender .46a) n/a .114 .113 .115 .011 .019 .047
-
.074
-
.069
-
.041
-
.036 .135 .084
a) Value represents percent of males; SD is not applicable for binary variables.

120
Appendix B: Sample Statistics
Gender
Female 53.9%
Male 46.1%
Age
Mean (SD) 46.5
(15.8)
18 to 24 7.3%
25 to 34 19.3%
35 to 44 23.1%
45 to 54 19.2%
55 to 64 13.1%
65 or older 18.0%
Total household income before taxes
Less than 29,999 9.9%
30,000-59,999 18.4%
60,000-84,999 24.6%
85,000-124,999 16.6%
125,000-199,000 17.4%
200,000-499,000 9.6%
500,000 or more 3.2%
n/a .3%
Job Situation
Work full-time for an employer 45.7%
Work part-time for an employer 9.2%
Self-employed 7.5%
Unemployed but desire to work 6.5%
Stay-at-home parent 5.4%
College student - on parent's insurance
policy 2.0%
College student - not on parent's insurance
policy 1.8%
Retired (not working and under age 65) 7.3%
Retired (not working and over age 65) 14.6%
Ethnicity (multiple responses possible)
Caucasian or White 74.1%
African American or Black 13.1%
Asian American 5.0%
Hispanic or Latino 10.6%
Other 1.8%
n/a .8%

121
Marital status
Single 28.5%
Married 50.5%
Domestic partnership 5.9%
Divorced/separated 10.5%
Widowed 3.4%
n/a 1.1%
N=1,682, USA

122
Appendix C
Smart Glasses Survey
Smart glasses are smart, wearable miniature computers that utilize various sensors—such
as cameras, microphones, and GPS to capture a user’s physical environment. This
information can then be processed and understood by the smart glasses and overlaid with
digital information in the user’s view field. This creates an “Augmented Reality
Technology.”
For instance, smart glasses can recognize buildings, landscapes, texts, or human faces.
This physical information can then be augmented by additional virtual information.
Some examples of how this works include:
A user can look at a famous building and receive the corresponding Wikipedia
information about that building
A user can look at another person and receive his/her social media public profile
information
Smart glasses can be used as a navigation system that guides a driver though a
city by showing the driver’s route in their field of view, and warns the driver
about speed limits or dangers
A user looks at a book written in a foreign language and the smart glasses
translate the book into the user’s preferred language within their field of view
The first smart glasses have just recently been launched or announced, and many more
will be launched soon. Famous examples are Google Glass (Project Aura) or Microsoft
HoloLens. These two examples are visualized in the following two pictures.

123
Social Commerce and Trust in Social Media
Hongjian Xu
College of Business
Butler University [email protected]
Abstract
People are using social media for many different purposes, more businesses have noticed
the influence of social media to people’s daily life, and are trying to use social media as
the mean to reach out to potential customers. Trust is important for any type of systems,
and also to social media. This study used a large scaled survey to measure trust in social
media, and the usefulness of social commerce. The research results showed that in
general people do not trust others from the social media communities. However, survey
respondents rated high for all the social commerce measurement, which can be
interpreted the users believe social commerce is useful.

124
Social Commerce and Trust in Social Media
Introduction
Many people use social media one way or another. The usage of the social media
has increased rapidly in the last few years. People are using social media for many
different purposes, from networking, business to lifestyle and personal. More
businesses have also noticed the influence of social media to people’s daily life,
and are trying to use social media as the mean to reach out to potential customers.
Nowadays if you use Internet applications for any purposes, you would see and
experience some kind of e-commerce effort. Such as after you have searched for a
particular type of electronic device online, the similar devices, and similar brands
will show up on your browser’s ad section, while you are checking emails, or
reading news. Whether you like it or not, they are there. Similarly, social
commerce have been used by many companies to promote their products and
services through the use of social media. Although some users might feel unhappy
or uncomfortable being tracked and watched while they using Internet and social
media, some others find it is convenient and useful. In general, there are some
privacy and security concerns from the users of the Internet and social media.
There is also trust issues in relation to the information people are getting from
social media.
Background
Trust
Regardless what type of system or information, it is always difficult to earn trust
from the users. Trust or loose of trust often comes with a big price tag. Trust is an
important factor that could influence user’s perceptions of any systems, and
further impact on their behavior, such as consumer’s trust of an e-commerce
website could lead to intent to purchase. Through its focus on building
relationships and fostering interaction, social media can serve as a channel to help
users and consumers overcome their reluctance (Chaney, 2013). Users of social
media often seek information from trusted sites and other trusted people (Xu,
2015). It would be interesting to study how much people trust recommendations
and advice from other people online, whether it will impact on their behavior. In
the management literature, trust is a set of specific beliefs with the integrity,
benevolence and ability of another party (Gefen, Karahanna, & Straub, 2003;
Mayer, Davis, & Schoorman, 1995). Trust can create and maintain exchange
relationships, which may lead to sharing knowledge of good quality (Blau, 1964).
Trust has been included in many management and information systems studies,
such as organizational value creation (Tsai & Ghoshal, 1998), information
systems group performance (Nelson & Cooprider, 1996), online transactions
(Chang, Cheung, & Lai, 2005; Gefen et al., 2003; Gefen & Straub, 2004; Pavlou
& Gefen, 2004), and knowledge sharing in virtual communities (Ridings, Gefen,
& Arinze, 2002).

125
Social media benefits and barriers / social commerce There are many benefits of social media. Social networking sites (SNS) can help
in carrying out many tasks. It can help improve communication with other people
inside of the organization, and with people outside of the organization. Social
media has been used as a good marketing tool. Social media can also aid
collaboration (sharing knowledge, views) with others.
There are several barriers related to using social networking, they include security
issues, privacy, legal issues, confidentiality. Such as using SNS at work / school
can impact on the security of important data (i.e. user details, other confidential
information); it can interfere in the privacy of both the user and the organization.
Originations may face legal consequences for activities carrier out by students /
employees on social networking sites (eg. Posting comments, videos, pictures in
Facebook, Twitter…).
When looking at the benefits of the social media, there is one particular
perspective that needs individual attention which is from social commerce (also
known as social business) perspective. Social commerce refers to the delivery of
e-commerce activities and transactions via the social media environment, mostly
in social networks and by using Web 2.0 software (Liang & Turban, 2012). It
supports social interactions and user content contributions.
Google research divided the path to consumer purchase into different stages:
awareness, consideration, intent and decision. Assisting channels build awareness,
consideration, and intent earlier in the customer journey or “purchase funnel.”
Last interaction channels act as the last point of contact prior to a purchase. Social
media fall in the assist stages, and rarely directly linked to the last interaction
which lead to consumer purchase decision (Google, 2012).
Figure 1: Different points in the path to purchase [source: (Google, 2012)]
Despite not being a direct sales channel, social media can still support
ecommerce. Benefits gleaned from social media (Chaney, 2013) are:
Promote brand awareness. Due to its viral nature and ability to quickly and easily
spread a message, brands that commit to regular posting of relevant content on
social sites grow their base of fans and followers, and have ongoing interaction
with them should, over time, expect to see an uptick in awareness.
Help overcome customer reluctance to purchase. Customers reliance on word of
mouth, especially when it comes from trusted sources such as family and friends.
Awareness -> consideration -> Intent -> Decision
Assist Last interaction
Awareness -> consideration -> Intent -> Decision
Assist Last interaction
Awareness -> consideration -> Intent -> Decision
Assist Last interaction

126
Improve customer loyalty. By building relationships with new customers and
strengthening relationships with existing ones via social networks, it stands to
reason both will increase.
Provide marketing insights. Even retailers who choose not to pro-actively
participate in social media can benefit by listening to the groundswell of opinion
expressed by consumers on such sites.
Methodology
Large scaled survey was used as method of data collection. People that have had
experience of using any type of social media are the population of the study. The
survey questionnaire were distributed through different social media network by
open invitations. Control variables such as: education level, gender, and
occupation were used in order to distinguish different respondent groups and test
whether there are any differences of the responses among different groups. We
used online survey as platform, as people using social media are highly likely use
internet often and feel convenient to fill out the online survey. In total of 142
questionnaires were completed online. Since the survey link were sent through
open invitations, and people were also encouraged to share the survey link to
others, therefore, we do know how many people it reached, and do not know the
response rate. However, we feel that total of 142 is good enough for the data
analysis purposes.
Results
This section includes the findings from the survey questionnaire. The respondents
of the survey are from wide range of social media users. For gender, table 1
shows that 57% of respondents were female, 43% were male.
Error! Not a valid link.Table 1: Gender of the survey respondents
The education level of the survey respondents were also wide spread. Maybe
because where the researcher chose to post the survey links at, there were large
percentage 48% of respondents have post-graduate degree. We do recognize this
high percentage is not the true representation of the population of the people that
are using social media. Further study with more representation of other education
levels might help to investigate whether the education level would have
signification influence on users’ perceptions. There were 19% of survey
respondents had some college / university education, and 25% have college /
university degree.
Error! Not a valid link.Table 2: What is your highest level of education?
Table 3 shows the primary occupation of the survey respondents. More than half
of the respondents were professional (54%). 16% were students, 8% for non-
management employed and self-employed and 7% retired. The less represented
groups were management 4% and un-employed 2%.
Error! Not a valid link. Table 3: What is your primary occupation?
Trust is a hard intangible thing to measure. We built our measurements of users’
trust based on some traditional fields trust literature and applied them to social

127
media’s special environment. Particularly we are interested in social media users’
trust for other people from the social media communities. The question was on a
5-likery scale, with 1 as strongly disagree, and 5 and strongly agree.
Trust Mean
People in social media communities will not take advantage of others even
when the opportunity arises
2.07
People in social media communities will always keep the promises they
make to one another
2.07
People in social media communities behave in a consistent manner 2.43
People in social media communities are truthful in dealing with one another 2.48
Table 4: trust in social media
It is quite interesting to see the results from Table 4 regarding trust. The Mean for
all the trust measurements are all low, they are all lower then 2.5, which means
that survey respondents in general do NOT trust other people in social media.
Especially, there were two measures had mean close to only 2 very low, they are:
‘people in social media communities will not take advantage of others even when
the opportunity arises,’ and ‘people in social media communities will always keep
the promises they make to one another.’ This is kind of ‘bad news’ for the trust in
social media. As much as people are using social media, they do not seem to trust
each other on social media.
Social Commerce Strongl
y
Disagre
e
Disagre
e
Neither
Agree
nor
Disagre
e
Agree Strongl
y Agree
Mean
Social commerce can help
promote brand awareness
2% 4% 7% 57% 30% 4.11
Social commerce can help
overcome customer
reluctance to purchase
3% 15% 25% 47% 10% 3.46
Social commerce can help
improve customer loyalty
2% 12% 17% 53% 16% 3.71
Social commerce can help
improve customer
satisfaction
3% 17% 23% 49% 8% 3.43
Social commerce can help
provide marketing insights
2% 8% 13% 55% 22% 3.88
Social commerce can help
support search engine
optimization
2% 7% 29% 45% 17% 3.7
Table 5: Social commerce in social media
To the contrary, survey respondents rated all social commerce measurements high
to very high, with mean of 3.43 to 4.11 on the 5-likery scale. The highest rated
was ‘social commerce can help promote brank awareness,’ (4.11). A number of

128
other measurements also had high ratings. They are: ‘Social commerce can help
provide marketing insights,’ (3.88), ‘Social commerce can help improve customer
loyalty,’ (3.71), and ‘Social commerce can help support search engine
optimization,’ (3.7). The survey results showed that the respondents believe social
commerce can be very useful for companies.
Conclusion
Social media has become party of many people’s daily life. It is important to
understand how people fell about using social media and whether people trust
social media, and others on social media. As trust doesn’t come easy, the survey
results confirmed that is true in social media as well. The respondents from our
survey do not trust others from social media, the trust level in social media is
quite low. Maybe because there is an un-known, un-sure of other’s true identities
factor contribute to the low trust, also it seems more difficult to build trust in the
virtual world. The encouraging finding from the study was that the survey
respondents gave high ratings for all the social commerce measures. This
encourages for companies that are doing social commerce to continue, and offer
better services and to give some assurance for companies that are planning or
considering doing social commerce. Social media is a field need many study both
in theory and practice, as the research would benefit both the social media users
and company that is interested in using social media to interact with its users.
References
Chaney, P. (2013). Does social media impact ecommerce sales? Practical Ecommerce -
Insight for Online Merchants. http://www.practicalecommerce.com/ Retrieved
from http://www.practicalecommerce.com/
Chang, M. K., Cheung, W., & Lai, V. S. (2005). Literature derived reference models for
the adoption of online shopping. Information and Management, 42(4), 543-559.
Gefen, D., Karahanna, E., & Straub, D. W. (2003). Trust and TAM in online shopping:
an integrated model. MIS Quarterly, 27(1), 51-90.
Gefen, D., & Straub, D. W. (2004). Consumer trust in B2C e-Commerce and the
importance of social presence: experiments in e-Products and e-Services. Omega,
32(6), 407-424.
Google. (2012). The customer journey to Online purchase. Google Think Insights.
http://www.thinkwithgoogle.com/tools/customer-journey-to-online-purchase.html
Retrieved from http://www.thinkwithgoogle.com/tools/customer-journey-to-
online-purchase.html
Liang, T.-P., & Turban, E. (2012). Introduction to the special issue social commerce: A
research framework for social commerce. International Journal of Electronic
Commerce, 16(2), 5-13.
Mayer, R. C., Davis, J. H., & Schoorman, F. D. (1995). An integrative model of
organizational trust. Academy of Management Review, 20(3), 709-734.
Nelson, K. M., & Cooprider, J. G. (1996). The contribution of shared knowledge to IS
group performance. MIS Quarterly, 21(4), 409-429.

129
Pavlou, P., & Gefen, D. (2004). Building effective online marketplaces with institution-
based trust. Information Systems Research, 15(1), 37-59.
Ridings, C., Gefen, D., & Arinze, B. (2002). Some antecedents and effects of trust in
virtual communities. Journal of Strategic Information Systems, 11(3-4), 271-295.
Tsai, W., & Ghoshal, S. (1998). Social capital and value creation: an empirical study of
intrafirm networks. Academy of Management Journal, 41(4), 464-476.
Xu, H. (2015). Do people trust information from social media? Paper presented at the
MWAIS 2015.

130
NARCISSISM AND DECISION MAKING IN ORGANIZATIONS
Scott David Williams
Professor of Management
Raj Soin College of Business
Wright State University
3640 Colonel Glenn Hwy.
Dayton, OH 45435
Jonathan Rountree Williams
Duke Leadership Consulting & Services, LLC
1136 Mistygate Dr.
Fairborn, OH 45324
Abstract
The management literature reflects a growing interest in narcissism. Narcissists are more
arrogant and greedy, and have lower empathy. However, their drive for attention and
power, and façade of self-confidence allow narcissists to advance. Regarding decision
making, our review finds that narcissists are less likely to recognize the moral content of
decisions. Narcissists are also more likely to accept alternatives that are risky and that
exploit others. We present a framework for narcissism’s influences on decision making in
organizations. Implications for future research on top management team conflict, and on
organizations that tend to attract and retain narcissists, are discussed.

131
NARCISSISM AND DECISION MAKING IN ORGANIZATIONS
Within the last few years, narcissism in organizations has become a growing and
potentially important area of scholarly inquiry. For instance, narcissism has been linked
to workplace deviance, job performance and contextual performance (Judge, LePine &
Rich, 2006). Narcissism has also been linked to exploitative behavior in negotiations
(Jonason, Slomski & Partyka, 2012). CEO narcissism appears to be associated with their
companies’ erratic financial performance (Chatterjee & Hambrick, 2007). The
pervasiveness of destructively narcissistic managers poses a significant and costly
problem (Lubit, 2002).
However, this growing body of research has not yet been integrated into a comprehensive
model of organizational decision-making processes. A comprehensive model of
organizational decision-making processes addresses factors such as needs assessment
(problem recognition and definition), generation of alternatives, evaluation of
alternatives, selection of an alternative, implementation, and post-implementation
evaluation of the decision. In addition, a comprehensive model of organizational decision
making addresses collaboration and moral values.
To fill this void, this literature review presents a model of narcissism’s influences on
decision making in organizations. First, narcissism is defined and contrasted with related
personality traits. The needs, values, information processing patterns and collaboration
patterns associated with narcissism are reviewed. Second, decision making processes in
organizations are framed. Decision making oriented toward utility maximization is
compared and contrasted with ethical decision making. Third, research on narcissism is
integrated with the decision-making framework to generate research propositions. The
paper concludes with theoretical and practical implications.
Narcissistic Personality
Narcissism has been described in a variety of ways. For instance, Judge, LePine and Rich
(2006) emphasize narcissists’ grandiosity and exaggeration of their talents and
accomplishments. Resick and colleagues’ (2009) study of narcissism focused on
arrogance, grandiosity, and self-promotion due to their centrality to the definition of
narcissism and their observability. While narcissism in the business literature focuses on
sub-clinical narcissism, we can draw useful insights from a clinical narcissistic
personality inventory. The Diagnostic and Statistical Manual of Mental Disorders, 4th
ed., Text Revision (2000) lists unrealistic self-perceptions, negative reactions to criticism,
unrealistic expectations of success, lack of empathy, and excessive self-interest as
characteristics of narcissists.
Narcissism is related to but distinct from traits such as psychopathy, Machiavellianism,
extraversion, hostility and self-esteem. Judge and colleagues (2006) note that although
narcissism has a positive relationship to self-esteem, the magnitude of the relationship is
only moderate (Brown & Zeigler-Hill, 2004). Resick and colleagues (2009) point out that
narcissism is distinct from true self-confidence and favorable self-evaluations, which

132
represent the “bright side” of leadership and promote leader effectiveness. Paulhus and
Williams (2002) highlight the distinctiveness of three separate personality traits that all
include a lack of empathy, namely Machiavellianism, psychopathy and narcissism. While
narcissism is related to inflated self-esteem, Machiavellianism is characterized by
disregard for morality and deceptive interactions with others; and psychopathy by
antisocial behaviors, impulsivity and callousness.
Lubit's (2002) treatise on destructive narcissism in managers explains how the condition
is often the result of a traumatic childhood that robs the individual of a true sense of self-
esteem. They have an inner void that leads them to seek excitement despite high risks.
Destructive narcissists also lack commitment to any core values. They lack concern for
the rights of others and drive away the most talented employees.
Measuring narcissism can be quite difficult due to the stigma of the term and the
personality traits of the narcissist, which can make willing participants difficult to secure.
The literature shows several methods of identifying and measuring narcissism. Paulhus
and Williams (2002) used the Narcissistic Personality Inventory (Raskin & Hall, 1979) to
measure narcissism in their participants, while Zhu and Chen (2014) used the prominence
of CEOs in press releases and company publications to generate CEO’s narcissism scores
using an ordinal scale. Brown and colleagues (2010) used the Phares and Erskine
Selfishism Test to gather data from a sample of business students.
The measures used to analyze decision-making behaviors vary between studies as well,
Chatterjee and Hambrick (2011) used an aggregate of three major forms of risky
spending, research and development, acquisitions, and capital expenditures. They
determined that since all three strategies contributed roughly equivalent amounts of
spending that it was not necessary to differentiate them in their results. Brown and
colleagues (2010) used ethical questions from Frank (2004), which address an ethical
dilemma in a business and interpersonal setting.
Some of the methods used in previous studies have had difficulty removing confounding
variables from their measures, Zhu and Chen’s (2014) method of measuring CEO
prominence in company publications could involve more factors than narcissism, such as
appealing to expectations of the company or shareholders, advice from image and
marketing teams, and perception of similar behavior in peers.
Needs, Values and Narcissism
Needs and values determine which alternatives decision makers choose, and narcissism is
associated with distinctive patterns in desires. Narcissists attempt to display their
superiority by succeeding where others fail, by overcoming obstacles and taking risks.
Chatterjee and Hambrick (2007) contend narcissistic CEOs are attracted to making bold
and flashy business decisions, but not necessarily good ones. They found CEO narcissism
was heavily correlated with erratic annual performance.

133
Narcissists have an overwhelming desire to outperform others, often disregarding
difficulty and risk to achieve where others fail. Wallace and Baumeister (2002) found
through a series of experiments that individuals high in narcissism tend to perform highly
when they are told that a task is difficult and perform poorly when they perceive the task
as simple. Low narcissism groups in the same study performed oppositely, with
perceptions of difficulty predicting a more conventional performance. The authors
concluded that this indicates narcissists’ desires to prove their superiority over others,
particularly in the presence of an evaluative audience.
Narcissism is hallmarked by a deep-seated feeling of inferiority, which narcissists mask
with grandiose behaviors and power seeking. Rosenthal and Pittinsky’s (2006) review
found that narcissists use the credit and praise bestowed upon them for their
accomplishments to bolster themselves, while simultaneously shifting responsibility for
failures onto others. They authors state that, although narcissists consume praise and
recognition excessively, a narcissist is never truly satisfied with accomplishments and
will always seek more power and praise. Excessive need for praise and power can lead to
the destruction of an organization, particularly when coupled with the blame-shifting
behaviors that narcissistic leaders exhibit.
Information Processing and Narcissism
Patterns in information processing influence decisions, and narcissism influences
perceptions, judgment and learning. For instance, ignorance to their condition is thought
to be universal in narcissists. However a study performed by Carlson, Vazvire, &
Oltmanns (2011) would seem to differ. Their study revealed that to a degree narcissists
recognize their arrogance or narcissism. This begs the question of how they can maintain
an excessively positive self-perception despite this knowledge. Carlson and colleagues
(2011) suggest that the perception of these traits by the narcissist is different from others,
for instance that a narcissist might view himself as having earned the right to be arrogant,
while others interpret arrogance as being undeserved by definition. In other words,
narcissists have high opinions of their abilities, and they believe those high opinions are
justified.
Perception of success and interpreting cues of success are different for narcissists than the
general population. According to Chatterjee and Hambrick (2011) narcissistic CEOs tend
to be more dismissive of objective measures of performance than their peers. The authors
also note that narcissists tend to respond more to social praise than their less narcissistic
counterparts. This would indicate that objective feedback is not given appropriate weight
in their risk appraisal process, which can lead to inappropriate risk taking.
Narcissists are overly confident in their abilities and maintain this confidence despite any
contrary evidence, but are overly critical of others (Farwell & Wohlwend-Lloyd, 1998).
Narcissists are generally optimistic toward personal performance, but not toward group or
collaborative performance. The authors found a negative correlation between narcissism
and appraisal of partners on tasks, potentially due to a feeling of envy or of being

134
competitive with their task partners. This would suggest an inability of narcissists to work
with a team effectively due to their perception of their team members’ inadequacy.
Collaboration and Narcissism
Decision making in organizations often benefits from some degree of collaboration, and
research shows that narcissism is associated with poor collaboration. Narcissists
disregard authority figures and frequently ignore wisdom offered to them due to their
high opinion of themselves and their degradation of others. According to Campbell and
colleagues (2011), mentoring relationships involving narcissists can be detrimental to the
protégé. Allen et al. (2009) support this with research that indicates narcissistic protégés
can feel less fulfilled by mentoring, often do not perceive the benefits of mentoring, and
disregard advice of their mentors. In response to the mentor-protégé study, Campbell and
colleagues (2011) observed that there appears to be a change in leadership behaviors
when dealing with narcissistic subordinates, which may be detrimental to their leader-
member exchange.
Narcissistic CEOs are careful and biased when selecting advisors. In a study concerning
narcissistic CEOs and selection criteria for board members Zhu and Chen (2015) found
that, narcissistic CEOs were likely to select individuals that they perceived as being
similar to them, had similar levels of narcissism, or had worked with other narcissistic
CEOs. Zhu and Chen (2015) hypothesized that this was due to the perceived willingness
of these three types of individuals to accept and support the risk taking behaviors of the
CEO. Narcissistic CEOs’ tendency to surround themselves with individuals who enable
risky behavior can be quite dangerous for an organization.
Psychological entitlement can interfere with the development of interpersonal
relationships, and entitlement is considered a core component of narcissism (Pryor,
Miller & Gaughan, 2008). Individuals scoring high on the entitlement subscale of the
Narcissism Personality Inventory (NPI) were found to be more interpersonally
antagonistic, less modest, more deceitful, more distrustful, less compliant, more resistant
to authority, and to have colder and more detached views of others. Using a measure of
psychological entitlement closely correlated with the entitlement subscale of NPI,
Campbell et al. (2004) found that psychological entitlement was associated with higher
levels of greed in decision making. Highly entitled individuals displayed more selfish and
less cooperative responses to a commons dilemma involving harvesting trees from a
forest.
Narcissists’ self-aggrandizing tendencies and naturally low opinions of others can make
them unpopular, and they often fail to sustain personal relationships. Carroll and
colleagues (1996) found that individuals who perceived someone as narcissistic were less
interested in interacting with that person. Additionally, participants were likely to rate the
perceived narcissist as being high in social dysfunction. This would indicate that the
narcissistic personality is irksome to others, further impeding their social abilities.

135
Decision Making in Organizations
Utility-Maximizing Decision-Making Processes
Corporate executives are agents employed by the shareholders (the principals) with the
expectation that the executives will make decisions that optimize returns on the
shareholders’ assets (Jensen & Meckling, 1976). A premise of the economics of
organizations is that people seek to maximize utilities (Freeman, 1999). Transaction cost
economists acknowledge decision makers in organizations often operate in circumstances
that place bounds on their ability to maximize utilities (Williamson, 1993). The
assumptions of the classical decision-making model typically do not apply in practice.
But while strict adherence to the prescriptions of the classical decision-making process is
rare, systematic analytical decision making patterned after the classical model can lead to
higher quality decisions than unstructured decision making (Bazerman, 2005).
In the simplest sense, any decision-making process entails a minimum of two parts: (a)
recognition of the situation and (b) the evaluation-choice of a solution (Mintzberg,
Raisinghani & Theoret, 1976). Systematic, analytical decision making is typically
initiated with an explicit needs assessment (Bazerman, 2005; Page, Tootoonchi &
Rahman, 2009). During needs assessment, the objective of the decision-making activity is
identified (Abelson & Levi, 1985). Some information surrounding the decision is selected
and classified as important and worthy of attention; other information is classified as less
important or noise (Simon, 1957). However, as Page and colleagues (2009) note, needs
assessment is often biased by a tendency to escalate commitments to past choices, the
desire to defend past choices, a false sense of control over uncontrollable events, the
discounting of unfavorable possibilities and exaggeration of the likelihood of favorable
possibilities (Abelson & Levi, 1985; Bazerman, 2005). During needs assessment, a
problem is defined and the criteria for identifying a good decision are specified. The
situation as it is understood and diagnosed during needs assessment has a major effect on
the decision that is ultimately selected (Mintzberg, et al., 1976).
With the need for decision making specified, the next step in classical decision making
involves the search for alternatives. The organization and its external environment are
scanned for information on courses of action that if selected might satisfy the criteria
identified during needs assessment. However, searches are constrained by factors such as
the cost of information and the perceived importance of the decision (Page, et al., 2009).
The next step entails evaluation of the alternatives that have been identified relative to the
criteria. Expert advice and forecasts can be used to predict the adequacy of each
alternative (Bazerman, 2005; Harrison, 1999). Evaluation proceeds iteratively as some
alternatives are identified as inferior and others appear sufficiently promising to justify
the cost of additional information and time to evaluate them. When decision making is
formal and thorough, the information used and processing of information are more
complete and less likely to be influenced by the biases of the decision makers. On the
other hand, informal evaluation of alternatives is prone to distortion due to simplistic
information processing, the preferences of the decision makers and political agendas
(Bazerman, 2005; Harrison, 1999; Page, et al., 2009).

136
An alternative is chosen on the basis of its top ranking among alternatives with respect to
the decision criteria and the alternative’s expected outcomes. Effective selection is a
function of the decision makers’ competence and experience (Bazerman, 2005; Harrison,
1999; Page, et al., 2009).
The benefits of effective decision making are realized when the alternative selected is
implemented (Harrison, 1999). Implementation of the selected alternative can be carried
out by the party that made the decision, through collaboration of the decision makers with
others, or delegated by the decision makers to be carried out by other parties. The results
of implementation will reveal the accuracy of the predicted outcomes of the decision.
Evaluation entails comparing the results of implementation of the alternative to the needs
assessment. Needs are reassessed. Following implementation, needs might be fully
satisfied, partially satisfied, unchanged or exacerbated. Needs that are not fully satisfied
can be the impetus for another decision-making process (Harrison, 1999).
Some have advocated techniques and practices to overcome biasing factors in decision
making in order to closely adhere to a process such as the one outlined above and thereby
improve decision quality (e.g., Janis, 1982). To do so is to make decisions in a boundedly
rational way inasmuch as the decision making is intendedly rational but with inevitable
limitations (Williamson, 2010). Bounded rationality is due to inherent limitations in
information availability and cognitive abilities (March & Simon, 1958).
Such contemplative, deliberate decision-making processes may not be optimal for “high
velocity” environments in which rapid and discontinuous change result in information
that is inaccurate, obsolete or unavailable (Bourgeois & Eisenhardt, 1988). Successful
decision making in such environments requires carefulness and quickness; a decisive and
powerful CEO and a powerful top management team; and, pursuit of innovation and
incremental implementation. More deliberative decision making is not as well suited for
high velocity environments.
Satisficing is another decision-making approach that can be quicker than contemplative,
deliberate decision making. March and Simon (1958) posit that by necessity managers
engage in satisficing in that they search for and select acceptable responses to needs they
recognize, and they do so with limited and available information. The assessment of the
need can be implicit or can be articulated in simplistic form. The search for alternatives is
non-exhaustive and may emphasize alternatives selected in response to past needs.
Evaluation of the alternatives can coincide with the search for them. When satisficing, the
decision makers may discontinue search and evaluation of alternatives once an alternative
is identified that is reasonably expected to satisfy the needs that triggered the decision-
making process. While satisficing simplifies decision making, it uses incomplete analyses
of needs, search for alternatives, and evaluation of alternatives. Decisions are expedient
but likely to be inferior to those that would result from systematic, deliberative processes.

137
Ethical Decision-Making Processes
There is a long tradition of treating ethical decision-making processes in organizations as
being different than utility-maximizing decision processes in the scholarly literature (Elm
& Radin, 2012). However, it is not clear that doing so is necessary or useful. Messick and
Bazerman (1996) contend that unethical decisions are merely a type of bad decision. Elm
and Radin’s (2012) study of managerial decision making did not find that ethical
decision-making processes differed from other types of decision making, and they
suggest that progress in the field of ethical decision making may be hampered by not
connecting it with the broader field of research on decision making.
This caution aside, not all decision-making situations involve moral content, and the
decisions that do require moral self-regulation in order to achieve optimal decisions.
Bandura (1986) posits that moral self-regulation requires an individual’s self-monitoring
of their decisions and actions, self-judgment of the goodness or badness of alternatives
relative to underlying values, and self-reactive mechanisms that censure or approve
specific behaviors. These mechanisms, when engaged, prevent individuals from making
and acting on choices that conflict with their values. In order to make decisions that
conflict with one’s values without negative self-evaluation, moral self-regulation must be
disengaged. Moral self-regulation and moral disengagement processes do not pertain to
decisions that are unrelated to ethical values.
Baron and colleagues (2015) found that entrepreneurs’ motivation for financial gains
contributed to their moral disengagement, which in turn increased their tendency to make
unethical decisions. They suggested entrepreneurs’ desires for financial gains can
“lubricate the downward slope toward unethical decisions and behaviors.” Although
decisions that conflict with the decision maker’s values can be defined as failing to
maximize utility, it might be instructive to frame ethical decision making as at least a
special concern with utility maximization. As Baron, et al. (2015) note, decisions with
moral implications may require an additional self-regulatory process of modulating
desires for financial gains in order to avoid incurring contradictory moral costs.
Much attention in ethical decision making inquiry has been devoted to moral reasoning;
reasoning within ethical situations. Rest’s (1986) model is perhaps the most popular. The
four-stage model includes moral awareness, moral evaluation, moral intention and moral
behavior. Further, much attention has been given to individual’s ethical sensitivity, which
is the capacity to recognize that a decision-making situation has moral content. Relatedly,
Kohlberg (1981) found that an individual’s moral reasoning was influenced by their level
of moral development. At the most primitive level of moral development, the pre-
conventional level, moral reasoning is egocentric and focuses on consequences for the
decision maker rather than ethical values. For individuals maturing to the conventional
level, moral reasoning incorporates consideration of the prevailing values of the social
context. Among individuals who achieve the post-conventional level of moral
development, moral reasoning involves the decision maker’s personal moral standards
that can conflict with the prevailing values of the social context.

138
Trevino (1986) proposed a person-situation interactionist model of ethical decision
making. The model proposed that decisions are determined by the moral reasoning level
of the decision maker moderated by the situation and characteristics of the individual.
Presented with an ethical dilemma, the decision maker’s cognitive processes are
determined by their stage of moral development. Decisions made and acted upon are also
influenced by the individual’s ego strength, field dependence, and locus of control.
Choices are also shaped by pressures, reinforcement and norms unique to the job and
organizational context.
Intuitive decision-making processes are also believed to pertain to ethical decision
making (Haidt, 2001). This approach contends that ethical decisions are made primarily
by rapid intuitions rather than by contemplative reasoning through to a solution. After
moral intuitions have made a choice, reasoning about the choice then takes place. Moral
intuition has been presented as an alternative to the more rational, conscious models
favored by Kohlberg, Rest and Bandura.
Gunia, et al. (2012) elaborated on the role of social contemplation prior to making
choices and on social accounts that decision makers provide for their choices. Their
decision-making model included three parts; contemplation, conversation and
explanation. Contemplation was defined as individually conducted moral reasoning.
Conversation involved social contemplation; situation-relevant conversations between
two or more parties. Explanation was the provision of social accounts of decisions.
Contemplation and conversation help individuals construct explanations that are able to
present decisions in socially accepted ways. Their experiment found evidence for both a
priori contemplation, and for rapid decision-making processes like the use of moral
intuition. In addition, their results suggest that contemplation was not merely used by
subjects to construct explanations for unethical choices; contemplation amplified ethical
action.
Narcissistic Decision Making
Recognition of Problems
One way in which narcissists differ from the average person is through their need for
acknowledgement and praise. Consequently, they are more sensitive to and aware of
opportunities to self-promote and gain praise from others. Chatterjee and Hambrick
(2007) concluded that narcissists are prone to flashy and attention-grabbing decisions,
leading to erratic annual performance. According to Wallace and Baumeister (2002),
those high in narcissism may work to achieve a more difficult goal because of the
prestige that difficult tasks entail. The perception that the task is more difficult or
exclusive is enough to elicit this response according to Wallace and Baumeister (2002).
Thus, the following is proposed:
Proposition 1: The higher a person’s narcissism, the more opportunities to
get attention they perceive and the more frequently they initiate problem
solving to exploit such opportunities.

139
Narcissistic CEOs can exhibit what Galvin and colleagues (Galvin, et al., 2015) refer to
as Narcissistic Organizational Identification, a conflation of self and organization.
Narcissistic leaders may envelope the organizations they lead within their own sense of
identity, attributing successes of the organization to their selves and taking personal pride
in achievements of their organization. The authors proposed that this is due to the
narcissistic self-perception that they are the face of the company and that others can only
see the organization in relation to themselves. This outlook can be detrimental to the
organization if the narcissistic leadership begins to exploit the organization for their own
benefit, which Galvin and colleagues conclude to be a natural behavior of the Narcissistic
Organizational Identification relationship.
Proposition 2: The higher a person’s narcissism, the more opportunities to
boost the image of their organization they perceive and the more
frequently they initiate problem solving to exploit such opportunities.
Protecting one's self-esteem is a significant predictor of behavior. The narcissistic
personality trait is positively associated with self-esteem (Nicholls & Stukas, 2011;
Sedikides, Rudich, Gregg, Kumashiro & Rusbult, 2004). However, the self-esteem of a
narcissist tends to be fragile and unstable, requiring constant defense and reinforcement
(Morf & Rhodewalt, 2001). The higher in narcissism a person is, the more likely they are
to perceive a threat to their self-esteem. Accordingly, we propose the following:
Proposition 3: The higher a person’s narcissism, the more likely they are
to perceive threats to their egos and initiate problem solving to address
such threats.
Ethical decision making requires sensitivity to the moral rights of parties (Cavanagh,
Moberg & Velasquez, 1981), and people high in narcissism are less sensitive to such
concerns. Narcissists do not respect other’s rights (Lubit, 2002). Instead, they devalue
and exploit others for support and esteem. Unconcerned with the rights of others, they are
unlikely to notice a rights-related problem to be solved. Moreover, while evaluating
alternatives during decision making, narcissists are less likely to reject an alternative on
the basis of that alternative violating other’s rights. For these reasons, the following are
proposed:
Proposition 4(a): The higher a person’s narcissism, the less likely they are
to initiate problem solving to address violations of other’s rights.
Proposition 4(b): The higher a person’s narcissism, the less likely they are
to consider other’s rights while considering alternative courses of action.
Being cold and detached, individuals high in narcissism are unlikely to notice others'
unhappiness and respond by engaging in problem solving. In personality research,
comparison of the entitlement subscale of the Narcissistic Personality Inventory to the
NEO Personality Inventory (Costa & McCrae, 1992) found negative correlations of
narcissism with warmth, tender-mindedness and altruism (Pryor, et al, 2008). Narcissists
are somewhat oblivious to opportunities to be helpful. This gives rise to the following
proposition:

140
Proposition 5: The higher a person’s narcissism, the less likely they are to
recognize opportunities to improve the well-being of others through
problem solving.
Narcissists are overly confident in their abilities and maintain this confidence despite any
contrary evidence. According to Farwell and Wohlwend-Lloyd (1998) narcissists are
generally optimistic toward personal performance. The authors report that they found a
negative correlation between narcissism and appraisal of partners on tasks, potentially
due to a feeling of envy or of being competitive with their task partners. This would
display an inability of narcissists to work with a team effectively due to their perception
of their own superiority.
Proposition 6: The higher a person’s narcissism, the less likely they are to
recognize problems attributable to their own inadequacies
Moral self-regulation in decision making is unlikely to be a strong suit of narcissists.
Moral self-regulation involves evaluation of the goodness or badness of alternatives
relative to underlying values (Bandura, 1986). Without a strong set of personal values,
narcissists are not prepared to make such assessments. Consequently, narcissists are
expected to be less effective at noticing the moral content of decisions, which gives rise
to the following proposition:
Proposition 7: The higher a person’s narcissism, the less effective they are
at moral self-regulation, and the less likely they are to recognize the moral
content of decision-making situations.
Identification, Evaluation and Selection of Alternatives
Narcissists are less likely to consider and use input from others while evaluating
alternative courses of action. Kausel and colleagues (2015) studied how narcissists
responded to advice and found that narcissists perceive the advice of others as being
useless and inaccurate. They also found that while accountability can increase advice
taking in those with lower narcissism, this same effect does not significantly impact those
with high narcissism. Additionally, Allen and colleagues (Allen, Johnson, Xu, Biga,
Rodopman & Ottinot, 2008) found that narcissistic protégés frequently disregard the
advice of their mentors and perceive fewer benefits from mentoring as a result.
Proposition 8: The higher a person’s narcissism, the less likely they are to
consider and use input from others while evaluating alternatives.
Narcissism is associated with grandiose self-confidence (Lubit, 2002). Narcissists are
overly optimistic about their performance and sustain their confidence despite evidence
of their limitations (Farwell & Wohlwend-Lloyd, 1998). This gives rise to the following
proposition:
Proposition 9: The higher a person’s narcissism, the higher their
propensity to overestimate their abilities to implement solutions and to
favor overly ambitious alternatives.

141
Narcissism has been associated with exploitative behavior in negotiations (Crossley,
Woodworth, Black & Hare, 2016). Organizations may inadvertently reward exploitative
attitudes toward others, as exploitation can provide advantages in negotiations (Jonason,
Slomski & Partyka, 2012). Accordingly, the following is proposed:
Proposition 10: The higher a person’s narcissism, the more likely they are
to consider an alternative that exploits others to be an acceptable
alternative.
A lack of commitment to a set of personal values and an inner emptiness push narcissists
toward risky alternatives. Lubit (2002) described stories of executive decision making in
which due diligence was not conducted. The excitement of high risk shapes narcissists'
choices. Thus, we propose the following:
Proposition 11: The higher a person’s narcissism, the more they favor
overly risky alternatives.
Feeling entitled, people higher in narcissism are especially inclined to favor alternatives
that are beneficial to them. Their decision making is biased by their selfishness and greed
(Campbell, et al., 2004).
Proposition 12: The higher a person’s narcissism, the more heavily they
weight their own personal gains or losses in the evaluation of alternatives.
Narcissists can be hard to get along with, their self-aggrandizing tendencies and naturally
low opinions of others can make them unpopular, and they often do not maintain personal
relationships for very long. Carroll et al. (1996) performed a study that found individuals
who perceived someone as narcissistic were less interested in interacting with that
person. Additionally participants were likely to rate the perceived narcissist as being high
in social dysfunction. This would indicate that the narcissistic personality is irksome to
others, further impeding their social abilities.
Proposition 13: The higher a person’s narcissism, the fewer confidants and
associates they have who provide uncensored input during contemplation
of alternatives.
According to Zhu and Chen (2015), narcissistic CEOs are biased when selecting
collaborators. They found that narcissistic CEOs were likely to appoint and select board
members that had similar levels of narcissism, or who had worked with other narcissistic
CEOs. The authors hypothesized that this was due to the perceived willingness of these
individuals to accept and support the risk-taking behaviors of the CEO. This can be
negative for the organization due to the lack of diverse opinions and viewpoints
appraising the risk in high-level decision making. The potential for amoral and unethical
behaviors is also heightened in this situation, as the narcissist’s biases and lack of
empathy are unchallenged.
Proposition 14: The higher a person’s narcissism, the more likely they are
to have associates who are similar to them and reinforce rather than
correct their biases in alternative evaluation.

142
Decision Implementation and Post-Implementation Evaluation
Narcissists have a drive to prove their superiority and this leads to extra effort and higher
achievement. Wallace and Baumeister (2002) found through a series of experiments that
individuals high in narcissism tend to perform highly when they are told that a task is
difficult or hard to achieve and perform poorly when they perceive the task as simple.
Low narcissism groups in the same study performed differently; perceptions of difficulty
led to a more conventional performance level. The authors conclude that this indicates a
narcissistic desire to prove superiority over others.
Proposition 15: When narcissists perceive decision implementation to be
an opportunity to prove their superiority, narcissism will be positively
associated with high levels of effort and higher achievement.
Overestimating their own capabilities and underestimating those of others (Farwell &
Wohlwend-Lloyd, 1998), people high in narcissism are less likely to use help when
implementing decisions. They are self-aggrandizing and have naturally low opinions of
others (Carroll, et al, 1996; Lubit, 2002). For these reasons, we prose the following:
Proposition 16: The higher a person’s narcissism, the less likely they are
to ask for help when implementing decisions.
According to a literature review by Rosenthal and Pittinsky (2006) narcissists use the
credit and praise bestowed upon them for their accomplishments to bolster themselves,
while simultaneously shifting responsibility for failures onto others. The authors state
that, though narcissists consume praise and recognition excessively, a narcissist is never
truly satisfied with accomplishments and will always seek more power and praise.
Excessive need for praise and power can lead to the destruction of an organization,
particularly when coupled with the blame-shifting behaviors that narcissistic leaders
exhibit.
Proposition 17: The higher a person’s narcissism, the more likely they are
to shift blame for poor results.
Social praise and attention may have a greater impact on narcissists than do objective
measures of success. According to Chatterjee and Hambrick (2011), narcissistic CEOs
tend to be more dismissive of objective measures of performance than their peers. The
authors also note that narcissists tend to be bolstered significantly more by social praise
than their less narcissistic counterparts. In addition, Chatterjee and Hambrick conclude
that narcissistic CEOs who receive praise for their achievements tend to take bold risks
more than their less narcissistic counterparts.
Proposition 18: The higher a person’s narcissism, the more social praise
for decisions matters to them in evaluating the outcomes of decisions, and
the less objective measures of success matter.
Summary and Implications
This literature review provides a framework for advancing inquiry into the effects of
narcissism on decision making in organizations. Furthermore, we answer the call for

143
additional examination of the linkages between narcissism and ethical leadership (e.g.,
Campbell, et al., 2011) by addressing ethical decision-making processes. Our framework
suggests important directions for future research.
The extensive influences of narcissism on decision making have important implications
for strategic decision making by CEOs and their top management teams. Eisenhardt,
Kahwajy and Bourgeois (1997) detailed the importance of effective conflict management
by top management teams in shaping strategic choice. Cohesive and effective top
management teams are critical to the success of firms. Top management team members
shape, articulate and execute the vision of the corporation through ongoing group
interactions and decisions. Discord is natural in such situations as reasonable people are
likely to view an organization's ambiguous and uncertain situation in different ways.
Moreover, top management team members are likely to be passionate about their beliefs.
Furthermore, conflict should be valuable. Issue-oriented conflict leads to the
consideration of more alternatives, better understanding of the alternatives, and better
results. To manage conflict effectively, Eisenhardt and colleagues (1997) recommend the
use of heterogeneous teams, frequent team interactions, the use of distinct roles (e.g.,
devil's advocate, futurist and counselor), and multiple decision-making heuristics. From
the review above of narcissistic decision making in organizations, it would appear that
future research will find that CEO narcissism affects strategic performance of their firms
by ineffectively managing top management team conflict.
One of the first decisions a narcissist makes with regard to their organization is to
become a member of the organization. Future research should also examine what types of
organizations attract, develop and promote narcissism. "The people make the place,"
inasmuch as organizational cultures are substantially shaped by the types of people they
attract, select and retain (Schneider, 1987). Narcissists’ outward self-confidence can help
them gain the confidence of others (Lubit, 2002), which can help them secure job offers
from organizations. Once they are members of an organization, narcissists tend to select
subservient lieutenants. Their drive for power and attention pushes them to attain high
status positions. Additionally, their lack of attachment to values and lack of empathy give
them the guile to aggressively use politics and exploitation to advance. Future research
should determine which organizational cultures narcissists are more attracted to, which
are more likely to select narcissists, which are more likely to promote them, and which
are more likely to halt or expel them.

144
References
Abelson, R., and Levi, A. (1985). Decision making and decision theory. In G. Lindsey
and E. Aronson (Eds.). Handbook of social psychology (3rd ed.). New York:
Random House.
Allen, T. D., Johnson, H. M., Xu, X., Biga, A., Rodopman, O. B., & Ottinot, R. C.
(2008). Mentoring and protégé narcissistic entitlement. Journal of Career
Development, 35(4), 385-405.
Bandura, A. (1986). Social foundations of thought and action: A social cognitive theory.
Englewood Cliffs, N.J: Prentice-Hall.
Baron, R., Zhao, H., & Miao, Q. (2015). Personal motives, moral disengagement, and
unethical decisions by entrepreneurs: Cognitive mechanisms on the 'slippery
slope'. Journal of Business Ethics, 128(1), 107-118. doi:10.1007/s10551-014-
2078-y
Bazerman, M.H. (2005). Judgment in managerial decision making. New York: John
Wiley.
Bourgeois, III, L., & Eisenhardt, K. M. (1988). Strategic decision process in high velocity
environments: Four cases in the microcomputer industry. Management Science,
34(7), 816-835.
Brown, R. P., & Zeigler-Hill, V. (2004). Narcissism and the nonequivalence of self-
esteem measures: A matter of dominance? Journal of Research in Personality, 38,
585–592.
Brown, T. A., Sautter, J. A., Littvay, L., Sautter, A. C., & Bearnes, B. (2010). Ethics and
personality: Empathy and narcissism as moderators of ethical decision making in
business students. Journal of Education for Business, 85(4), 203-208.
doi:10.1080/08832320903449501
Campbell, W. K., Bonacci, A. M., Shelton, J., Exline, J. J., & Bushman, B. J. (2004).
Psychological entitlement: Interpersonal consequences and validation of a self-
report measure. Journal of Personality Assessment, 83(1), 29-45.
Campbell, W. K., Hoffman, B. J., Campbell, S. M., & Marchisio, G. (2011). Narcissism
in organizational contexts. Human Resource Management Review, 21(4), 268-
284. doi:10.1016/j.hrmr.2010.10.007
Carlson, E. N., Vazire, S., & Oltmanns, T. F. (2011). You probably think this paper's
about you: Narcissists' perceptions of their personality and reputation. Journal of
Personality & Social Psychology, 101(1), 185-201.
Carroll, L., Hoenigmann-Stovall, N. & Whitehead, G. I. (1996). Interpersonal
consequences of narcissism. Psychological Reports, 79(3), 1267-1272.
Cavanagh, G. F., Moberg, D. J., & Velasquez, M. (1981). The ethics of organizational
politics. Academy of Management Review, 6(3), 363-374.
doi:10.5465/AMR.1981.4285767
Chatterjee, A., & Hambrick, D. C. (2007). It's all about me: Narcissistic Chief Executive
Officers and their effects on company strategy and performance. Administrative
Science Quarterly, 52(3), 351-386.
Chatterjee, A., & Hambrick, D. C. (2011). Executive personality, capability cues, and
risk taking: How narcissistic CEOs react to their successes and stumbles.
Administrative Science Quarterly, 56(2), 202-237.
doi:10.1177/0001839211427534

145
Crossley, L., Woodworth, M., Black, P. J., & Hare, R. (2016). The dark side of
negotiation: Examining the outcomes of face-to-face and computer-mediated
negotiations among dark personalities. Personality & Individual Differences, 91,
47-51. doi:10.1016/j.paid.2015.11.052
DSM-4-TR: Diagnostic and statistical manual of mental disorders: Text revision. (2000).
Washington: American psychiatric association.
Eisenhardt, K. M., Kahwajy, J. L., & Bourgeois III, L. (1997). Conflict and strategic
choice: How top management teams disagree. California Management Review,
39(2), 42-62.
Elm, D., & Radin, T. (2012). Ethical decision making: Special or no different?. Journal
of Business Ethics, 107(3), 313-329. doi:10.1007/s10551-011-1041-4
Farwell, L., & Wohlwend-Lloyd, R. (1998). Narcissistic processes: Optimistic
expectations, favorable self-evaluations, and self-enhancing attributions. Journal
of Personality, 66(1), 65.
Frank, R. H. (2004). What price the moral high ground?: Ethical dilemmas in
competitive environments. Princeton, N.J. : Princeton University Press, c2004.
Freeman, J. (1999). Efficiency and rationality in organizations. Administrative Science
Quarterly, 44(1), 163-175.
Galvin, B. M., Lange, D., & Ashforth, B. E. (2015). Narcissistic organizational
identification: Seeing oneself as central to the organization’s identity. Academy of
Management Review, 40(2), 163-181. doi:10.5465/amr.2013.0103
Gunia, B. C., Wang, L., Huang, L., Wang, J. & Murninghan, K. J. (2012). Contemplation
and conversation: Subtle influences on moral decision making. Academy of
Management Journal, 55(1), 13-33. doi:10.5465/amj.2009.0873
Haidt, J. (2001). The emotional dog and its rational tail: A social intuitionist approach to
moral judgment. Psychological Review, 108, 814–834.
Harrison, E.F. (1999). The managerial decision making process. Boston: Houghton
Mifflin.
Janis, I. L. (1982). Groupthink: Psychological studies of policy decisions and fiascoes
(2nd ed). New York: Houghton Mifflin.
Jensen, M. C., & Meckling, W. H. (1976). Theory of the firm: Managerial behavior,
agency costs and ownership structure. Journal of Financial Economics, 3(4), 305-
360.
Jonason, P. K., Slomski, S., & Partyka, J. (2012). The Dark Triad at work: How toxic
employees get their way. Personality & Individual Differences, 52(3), 449-453.
doi:10.1016/j.paid.2011.11.008
Jones, T. M. (1991). Ethical decision making by individuals in organizations: An issue-
contingent model. The Academy of Management Review, 16(2), 366-395.
Judge, T. A., LePine, J. A., & Rich, B. L. (2006). Loving yourself abundantly:
Relationship of the narcissistic personality to self- and other perceptions of
workplace deviance, leadership, and task and contextual performance. Journal of
Applied Psychology, 91(4), 762-776.
Kohlberg, L. (1981). The meaning and measurement of moral development. Worcester,
MA: Clark University Press.

146
Lubit, R. (2002). The long-term organizational impact of destructively narcissistic
managers. Academy of Management Executive, 16(1), 127-138.
doi:10.5465/AME.2002.6640218
March, J. G & Simon, H. A. (1958). Organizations. New York: Wiley.
Messick, D. M., & Bazerman, M. H. (1996). Ethical leadership and the psychology of
decision making. Sloan Management Review, 37(2), 9-22.
Mintzberg, H., Raisinghani, D., & Théorêt, A. (1976). The structure of 'unstructured'
decision processes. Administrative Science Quarterly, 21(2), 246-275.
Morf, C. C., & Rhodewalt, F. (2001). Unravelling the paradoxes of narcissism: A
dynamic self-regulatory processing model. Psychological Inquiry, 12, 177–196.
Nicholls, E., & Stukas, A. A. (2011). Narcissism and the self-evaluation maintenance
model: Effects of social comparison threats on relationship closeness. Journal of
Social Psychology, 151(2), 201-212. doi:10.1080/00224540903510852
Page Jr., R. A., Tootoonchi, A., & Rahman, S. (2009). Arational decision stages: The
breakdown of rationality in strategic planning and implementation. Advances in
Competitiveness Research, 17(1/2), 109-120.
Paulhus, D. L., & Williams, K. M. (2002). The Dark Triad of personality: Narcissism,
Machiavellianism, and psychopathy. Journal of Research in Personality, 36(6),
556-563.
Pryor, L. R., Miller, J. D., & Gaughan, E. T. (2008). A comparison of the psychological
entitlement scale and the narcissistic personality inventory's entitlement scale:
Relations with general personality traits and personality disorders. Journal of
Personality Assessment, 90(5), 517-520. doi:10.1080/00223890802248893
Resick, C. J., Weingarden, S. M., Whitman, D. S., & Hiller, N. J. (2009). The bright-side
and the dark-side of CEO personality: Examining core self-evaluations,
narcissism, transformational leadership, and strategic influence. Journal of
Applied Psychology, 94(6), 1365-1381.
Rest, M. (1986). Moral development: Advances in research and theory. New Jersey:
Praeger.
Rosenthal, S. A., & Pittinsky, T. L. (2006). Narcissistic leadership. Leadership Quarterly,
17(6), 617-633. doi:10.1016/j.leaqua.2006.10.005
Schneider, B. (1987). The people make the place. Personnel Psychology, 40(3), 437-453.
Sedikides, C., Gregg, A. P., Rudich, E. A., Kumashiro, M., & Rusbult, C. (2004). Are
normal narcissists psychologically healthy?: Self-esteem matters. Journal of
Personality & Social Psychology, 87(3), 400-416. doi:10.1037/0022!35
14.87.3.400
Simon, H. (1957). Administrative behavior. New York: Free Press.
Simon, H. (1979). Rational decision making in business organizations. American
Economic Review, 69(4), 493-513.
Trevino, L. K. (1986). Ethical decision making in organizations: A person-situation
interactionist model. Academy of Management Review, 11(3), 601-617
Wallace, H. M., & Baumeister, R. F. (2002). The performance of narcissists rises and
falls with perceived opportunity for glory. Journal of Personality & Social
Psychology, 82(5), 819-834. doi:10.1037//0022-3514.82.5.819
Williamson, O. E. (1993). Opportunism and its critics. Managerial & Decision
Economics, 14(2), 97-107.

147
Williamson, O. E. (2010). Transaction cost economics: The natural progression.
American Economic Review, 100(3), 673-690. doi:10.1257/aer.100.3.673
Zhu, D. H., & Chen, G. (2015). Narcissism, director selection, and risk-taking spending.
Strategic Management Journal, 36(13), 2075-2098. doi:10.1002/smj.2322

148
Applying Decision Utility to Solve Problems with Limited Resources in
Parks and Police Management
Ceyhun Ozgur, Ph.D., CPIM
Professor, Valparaiso University
College of Business
Information & Decision Sciences
Urschel Hall 223 – Valparaiso University
Valparaiso, IN 46383
Abstract
For quantitative scheduling techniques found in journals their wider use in applications
has been declining by a variety of obstacles. This article will first list a number of these
obstacles and then suggest ways to overcome them. Parks and Police departments are
government agencies that both have limited and competing resources. In these
circumstances, it is an ideal situation to share the resources as much as possible. In this
paper I will show examples of where the limited resources may occur in both agencies,
and how the manager may overcome these problems by sharing the resources. Examples
of affective and just sharing of resources are given for both parks and police departments.
In Parks Management, affective trade-offs are shown among trim mowing, tractor
mowing, garbage collection and ball-field dragging. In Police departments affective
trade-offs are shown among foot patrol, car patrol, detective analysis and office work.

149
Applying Decision Utility to Solve Problems with Limited Resources in
Parks and Police Management
Introduction
Let us begin with a situation encountered in 1972 by a researcher in devising a
computerized quantitative production scheduling system for a tire production plant. The
schedule produced by the system was constrained by the machines available, the
sequencing of the machines for each type of job, the flow of materials, the demand of
make to order jobs, the demand of make to stock jobs, the job due dates, and the
personnel available. The corporate MIS department commissioned the system which was
designed to be updated on their mainframe computer once a week. After the system was
completed, the MIS department said the system was a success because it demonstrated to
the company that the computer could be used to schedule production which was the entire
purpose of the project. However, the system would not be used to actually schedule
production which was a shock to the author. After much thought, there were many
reasons for the non-implementation. (1) Job control: the production schedulers did not
want the MIS department to take control. Basically, they did not want someone else
doing even part of their job. (2) Efficient schedule: the production schedulers felt that a
computer program could never produce a schedule as efficient as their own and the
company had the potential to lose money. (3) Short term priority changes: the computer
schedule could not respond to short term changes in the priorities such as marketing or
corporate headquarters requesting that a particular customer receive top priority today.
(4) Tradeoffs: Production schedulers did not agree with the suggested schedule and more
importantly did not know how the computer schedule that made the myriad of tradeoffs
necessary to produce a schedule. For example, a production schedule must tradeoff
decreasing total setup time versus increasing the chance that some due dates will not be
met. In addition, if all due dates cannot be met, the computer schedule internally chooses
which jobs are late and the production schedulers may not agree with the tradeoffs used
to make that choice. (5) Preference and knowledge input: the computer schedule did
not reflect the preferences and knowledge of the production schedulers or any other
department such as marketing. (6) Using the computer schedule as a tool: most
production schedulers don’t understand or even want to understand how the quantitative
scheduling algorithm determines the computer schedule. Therefore, any real or perceived
problem with the computer schedule is cited as proof that the quantitative scheduling
algorithm should be scrapped as it is clearly inferior to a schedule produced by a
production scheduler. In other words, a production scheduler is not trained to use the
computer schedule as tools to help them do their job but instead view it as a competitor.
(7) Incomplete information: the data used to produce the computer schedule did not
completely mirror the real world situation and by necessity left out some information
including political nuances. Thus, any computer schedule will usually be seen by
someone as having serious shortcomings.

150
Priority Class Scheduling
Most of the problems listed above are present in all applications of quantitative
scheduling techniques but there has been very little work in literature to try and solve
these problems. One study by (Brown and Ozgur, 1997) suggested using priority class
scheduling to reduce due date conflicts between marketing and the production schedulers
by replacing due dates with production periods and priority classes. The priority classes
are used by the production scheduler as constraints on what can be scheduled in a
production period. If any job in priority class i is started in the production period, then all
jobs in priority class i-1 must be completed within the production period. This is the only
constraint on the production scheduler and allows the scheduler to concentrate on
optimizing manufacturing efficiency within the production period. The constraint is so
simple that its consequences are easily understood by those who assign jobs to priority
classes but at the same time allows manufacturing some flexibility in scheduling. Indeed,
the production scheduler can schedule a priority three job to be completed early in the
production period as long as all priority one and priority two jobs are completed within
the production period. In addition, if only some priority three jobs can be completed in
the production period, the selection of which jobs to produce is made entirely on the basis
of production efficiency. This gives some flexibility to manufacturing to optimize
production efficiency. Indeed, the production scheduler only considers the priority classes
when scheduling and does not even need to know the due dates of the jobs. This means
that marketing alone without any help from the production schedulers could determine
the priority class for each job and let the production schedulers concentrate on increasing
production efficiency. Theoretically, priority class scheduling would greatly reduce the
conflict between marketing and manufacturing. However, getting the production
schedulers to agree to even try priority class scheduling would be very difficult because
of some of the problems listed above. The production schedulers would perceive a loss
of job control because they would feel that marketing would be dictating their jobs to
them. With marketing in control of the “due dates,” manufacturing would think that
getting an efficient schedule would be impossible and the company would lose money.
Short term physical changes could cause the violation of the priority class scheduling
rules. For example, suppose a priority class 3 job was lumped together with a priority
class 1 job early in the production period to reduce setup time and cost. If later in the
production period a machine broke down and caused a priority class 2 job to not be run,
then at the end of the production period, a priority class 3 job was completed while a
priority class 2 job was not completed. This is a clear violation of the idea of priority
classes. The production schedulers would be blamed for the violation and marketing
would be furious.
Scheduling Parks Maintenance
Although many quantitative scheduling techniques are designed for production
scheduling, other types of scheduling problems have been studied but they have some of
the same obstacles listed above for production scheduling. For example, consider the
problem of scheduling jobs in a governmental agency where the amount of work to be
done almost always exceeds the resources available. In this case, the scheduling problem

151
is deciding how much of each job to do and not do given the amount of resources on
hand.Anderson and Brown (1978) devised the Parks Maintenance Management System
(PMMS), a quantitative parks maintenance scheduling system that avoided some but not
all of the obstacles listed above. Using the resources available (mainly personnel and
machines), parks maintenance must determine how much of each job to do to keep the
parks in as good condition as possible. For example, in the summer, a parks maintenance
district must tradeoff how the number of times jobs like tractor mowing (mowing large
open areas), trim mowing (mowing small areas around trees, sidewalks, buildings, etc.),
litter removal, and ball field dragging are done in each park. The main problem is to
determine the correct balance between the jobs given the resources available. This is
clearly a case where a balance is necessary because doing a lot of litter removal and ball
field dragging while doing no mowing would not be acceptable to the tax payers. For
each parks district and scheduling period, the PMMS used as data a list of the parks,
estimates of the time for a parks maintenance crew to complete each job in each park, the
personnel and equipment available, and what personnel and equipment that constituted a
parks maintenance crew for each job. In addition, the model was driven by a maximin
value function collected from the parks maintenance management that showed what they
considered the best balance of the jobs at various levels of resources. For example, they
might feel that for a low level of resources, relatively more mowing should be done while
for a higher level of resources, the amount of litter removal and ball field dragging
relative to mowing should be increased. A computer schedule was run every two weeks
and gave a district maintenance supervisor an amount of each job the district could
accomplish in the next two weeks with the resources predicted to be available. This
computer schedule represented the best balance between the jobs as it maximized the
maximin value function given the resource constraints. A very simple example will be
used to illustrate PMMS. Suppose a parks manager (PM) is trying to decide how many
times the jobs trim mowing, tractor mowing, litter removal, and ball field dragging
should be completed this summer for the parks in his district. First, the PM’s perfect
complements preference structure is determined by having him complete a table. Table 1
contains a completed table where initially the Desirable Quantity column as well as
columns 1, 2, 3, 4, and 6 are empty except for the Totals and UTILITY rows. The PM is
asked to give how many times each job should be done to keep the parks in good
condition (these amounts should represent the upper end of the PM’s range of interest).
The PM’s response is shown in the Desirable Quantity column of Table 1. Next the PM
is asked to complete column 1 with percentages of the corresponding desirable quantity
that sum to 80. The response of 10 for trim mowing corresponds to 10 percent of the
desirable quantity of 20 or 2 trim mowings. These percentages reflect the PM’s tradeoffs
between the four attributes and contain what he considers the best balance between them
given the percentages can only sum to 80. The attribute values corresponding to the
percentages in column 1 are 2 trim mowings, 10 tractor mowings, 2 litter removals, and 0
ball field draggings over the summer. These attribute values are then entered in column 1
of Table 2. In a similar manner, the PM then fills in columns 2, 3, 4, and 6 so the
percentages for each column sum to the amount listed in the Totals row. Finally, the
attribute values corresponding to the percentages are entered in the appropriate columns
in Table 2. This collects data on what the PM thinks is the best balance between the

152
attributes over a range from doing nothing (column 0) to the desirable quantities (column
5) and beyond (column 6).
Table 4: Constrained Choice Table for Parks Maintenance Example
DESIRABLE PERCENT OF DESIRABLE
QUANTITY
ATTRIBUTES QUANTITY 0 1 2 3 4 5 6
1.Trim Mowing 20 Mowings 0 10 40 50 80 100 100
2.Tractor Mowing 20 Mowings 0 50 70 90 100 100 100
3.Litter Removal 10 Removals 0 20 50 80 90 100 120
4.Ballfield
Dragging
100 Draggings 0 0 0 20 50 100 160
Totals 0 80 160 240 320 400 480
UTILITY 0 20 40 60 80 100 120
Table 5: Attribute Value Table for Parks Maintenance Example
LABOR ATTRIBUTE VALUES
ATTRIBUTE HOURS 0 1 2 3 4 5 6
1.Trim Mowing 50 0 2 8 8.8 9.6 10 16 20 20
2.Tractor Mowing 40 0 10 14 15.6 17.2 18 20 20 20
3.Litter Removal 150 0 2 5 6.2 7.4 8 9 10 12
4.Ballfield
Dragging
10 0 0 0 8 16 20 50 100 160
TOTAL LABOR HOURS 0 800 1710 2074 2438 2620 3450 4300 5200
UTILITY 0 20 40 48 56 60 80 100 120
Since each column in Table 2 is a point in the attribute value space, a linear line between
these points approximate what the PM considers the best balance over the entire attribute
value space. To keep it simple, suppose the only limiting resource needed to accomplish
the jobs is labor measured in hours. The PM estimates that one trim mowing requires 50
labor hours, one tractor mowing requires 40 labor hours, one litter removal requires 150
labor hours, and one ball field dragging requires 10 labor hours. These estimates are
entered in the LABOR HOURS column of Table 2. The labor hours needed to
accomplish the attribute values in columns 0, 1, 2, 3, 4, 5, and 6 are computed and
entered in the TOTAL LABOR HOURS row. Suppose the PM has 2074 labor hours
available this summer. Then the amounts of each attribute that provides the best balance
while using no more than 2074 labor hours can be found by linear interpolation in Table
2. From Table 2, the best balance is 8.8 trim mowings, 15.6 tractor mowings, 6.2 liter
removals, and 8 ball field draggings for a utility of 48. Note that a non-integer amount
such as 8.8 trim mowings is acceptable because that means every park would be trim
mowed 8 times and get 80 percent of the way through the ninth trim mowing.

153
This system has many advantages. The PM’s preferences are inputted to the model and
are used to determine the best amounts of each attribute to accomplish given the
resources available. The PM can easily understand how the quantitative scheduling
algorithm determines the schedule. In addition, “what if” questions can now be
answered. Suppose city council asked the Parks Department what it could accomplish if
the labor hours were increased from 2074 to 2438. Using linear interpolation, Table 2
shows that 2438 labor hours would increase the trim mowing from 8.8 to 9.6, increase
tractor mowing from 15.6 to 17.2, increase litter removal from 6.2 to 7.4, and increase
ball field dragging from 8 to 16. PMMS also collected data on how much of each job was
accomplished in the preceding two week period. Although this actual job performance
data was compared to what the computer schedule predicted could be done, it was not
used in a punitive fashion but rather as a starting point for discussion of what changes
would enable the parks department to do a better job of serving the public. The objective
was to instill pride in the parks maintenance personnel and to motivate them into making
continual improvements. By design and by enlightened management, PMMS avoided
many of the obstacles listed above. PMMS avoided the job control obstacle as parks
maintenance management viewed the computer schedule as simply a starting point and
was free to change it as conditions warranted. In addition, the computer schedule only
gave the amounts of each job that could be accomplished and did not tell a manager what
personnel should be assigned to which crew or, like priority class scheduling, when the
jobs should be done within the period. The managers were free to devise their own work
schedule within the computer schedule framework so they were motivated to design an
efficient schedule and could not blame any inefficiencies on the computer schedule. The
managers were also free to respond to both short term physical changes and priority
changes as they saw fit. The preference and knowledge input obstacle and the tradeoffs
obstacle were, for the most part, avoided by using the maximin value function supplied
by the parks maintenance management to drive the determination of the computer
schedule. For the obstacle regarding using the computer schedule as a tool, every effort
was made to enable parks management to accomplish this but was limited by the fact that
the computer schedule was only produced once every two weeks and the parks
maintenance managers could not use it to ask “what if” questions. In addition, although
there was some minimal training on how the quantitative scheduling algorithm worked,
hindsight says that more effort should have been directed into training. Finally, as with
all applications of quantitative scheduling techniques, the incomplete information
obstacle was present. As it was applied to parks management, another example was given
by the author in a separate journal article regarding the scheduling of police work by
using maximin value function, an article written by Ozgur and Brown (2012).
Maximizing Efficiency and Balancing Work Load for Police Station
Although many quantitative scheduling techniques are designed for production
scheduling, other types of scheduling problems have been studied but have some of the
same obstacles listed above for production scheduling. For example, consider the
problem of scheduling police officers in a police department where the amount of work to
be done almost always exceeds the resources available in a given time period such as
summer months. In this case, the scheduling problem is deciding how much of each type

154
of job to do and still protect the public and ensure public safety given the amount of
resources on hand for the entire summer months. For each police scheduling period, the
police chief used as data a list of the police officers, estimates of the time for a police
officer or police car to complete each job in the city, and what additional personnel and
equipment was available and needed by the police department for each police activity. In
addition, the model was driven by a maximin value function collected from the police
department that showed what the police chief considered the best balance of the jobs at
various levels of resources. For example, they might feel that for a low level of
resources, relatively more patrol, either foot or car patrol should be done while for a
higher level of resources, the amount of detective analysis and office work should be
preferred over foot patrol or car patrol. A computer schedule was run every two weeks
and gave the police chief or the police supervisor an amount of each job the city could
accomplish in the next two weeks with the resources predicted to be available. This
computer schedule represented the best balance between the jobs as it maximized the
maximin value function given the resource constraints. A very simple example will be
used to illustrate police scheduling. Suppose the police chief or the police supervisor is
trying to decide how many times the detective analysis or the office work will be done in
lieu of foot patrol or car patrol. The decision should be how much foot or car patrol
should be completed in lieu of office work or detective analysis in a period in his district.
First, the police chief’s perfect complements preference structure is determined by having
him or her complete a table. Table 3 contains a completed table where initially the
Desirable Quantity columns, as well as columns 1, 2, 3, 4, and 6 are empty except for the
Totals and UTILITY rows. The police chief is asked to give how many times each job
should be done to keep the city, and its streets or roads safe in good condition (these
amounts should represent the upper end of the police chief’s range of interest). The
police chief’s response is shown in the Desirable Quantity column of Table 3. Next the
police chief is asked to complete column 1 with percentages of the corresponding
desirable quantity that sum to 80. The response of 10 for foot patrol corresponds to 10
percent of the desirable quantity of 20, or 2 foot patrols. These percentages reflect the
police chief’s tradeoffs between the four attributes and contain what he/she considers the
best balance between them given the percentages can only sum to 80. The attribute
values corresponding to the percentages in column 1 are 2 foot patrols, 10 car patrols, 2
detective analyses, and 0 office work over the entire summer. These attribute values are
then entered in column 1 of Table 4. In a similar manner, the police chief then fills in
columns 2, 3, 4, and 6 so the percentages for each column sum to the amount listed in the
Totals row. Finally, the attribute values corresponding to the percentages are entered in
the appropriate columns in Table 4. This collects data on what the police chief thinks is
the best balance between the attributes over a range from doing nothing (column 0) to the
desirable quantities (column 5) and beyond (column 6).
Table 3: Constrained Choice Table for City Police Departments
DESIRABLE PERCENT OF DESIRABLE
QUANTITY
ATTRIBUTES QUANTITY 0 1 2 3 4 5 6
1.Foot Patrol 20 Officers 0 10 40 50 80 100 100
2.Car Patrol 20 Cars 0 50 70 90 100 100 100

155
3.Detective Analysis 10 Detectives 0 20 50 80 90 100 120
4.Office Work 10 Officers 0 0 0 20 50 100 160
Totals 0 80 160 240 320 400 480
UTILITY 0 20 40 60 80 100 120
Table 4: Attribute Value Table for City Police Departments
LABOR ATTRIBUTE VALUES
ATTRIBUTE HOURS 0 1 2 3 4 5 6
1.Foot Patrol 80 0 2 8 8.53 9.04 10 16 20 20
2.Car Patrol 40 0 10 14 15.05 16.08 18 20 20 20
3.Detective analysis 100 0 2 5 5.79 6.56 8 9 10 12
4.Office Work 40 0 0 0 5.27 10.39 20 50 100 160
TOTAL LABOR HOURS 0 800 1700 2074 2438 3120 4980 7400 10000
UTILITY 0 20 40 46 50 60 80 100 120
Since each column in Table 4 is a point in the attribute value space, a linear line between
these points approximate what the police chief considers the best balance over the entire
attribute value space. To keep it simple, the only limiting resource needed to accomplish
the jobs is labor measured in hours. The police chief estimates that one foot patrol
requires 80 labor hours, one car patrol requires 40 labor hours, one detective analysis
requires 150 hours, and one office work requires 40 labor hours. These estimates are
entered in the LABOR HOURS column of Table 4. The labor hours needed to
accomplish the attribute values in columns 0, 1, 2, 3, 4, 5, and 6 are computed and
entered in the TOTAL LABOR HOURS row. Suppose the police chief has 2074 labor
hours available this summer. Then the amount of each attribute that provides the best
balance while using no more than 2074 labor hours can be found by linear interpolation
in Table 4. From Table 4, the best balance is 8.53 foot patrol, 15.05 car patrol, 5.79
detective analysis, and 5.27 office work for a utility of 46. Note that a non-integer
amount such as 8.53 foot patrol is acceptable because that means every officer would foot
patrol 8 times and 1 officer would get only 53% percent of the way through the ninth
patrol walk.
This system has many advantages. The police chief preferences are inputted to the model
and are used to determine the best amounts of each attribute to accomplish given the
resources available. The police chief can easily understand how the quantitative
scheduling algorithm determines the schedule. In addition, “what if” questions can be
answered in the quantitative algorithm. Suppose the city asked the Police Department
what it could accomplish if the labor hours were increased from 2074 to 2438. Using
linear interpolation, Table 4 shows that 2438 labor hours would increase the detective
analysis from 5.79 to 6.56, increase office work from 5.27 to 10.39, increase foot patrol
from 8.53 to 9.04, and increase car patrol from approximately 15 to 16.The police chief
also collected data on how much of each job was accomplished in the preceding two
week period. Although this actual job performance data could be compared to what the
computer schedule predicted could be done, it was not used in a punitive fashion but
rather as a starting point for discussion of what changes would enable the police

156
department to do a better job of serving the public. The objective was to instill pride in
the police department personnel and to motivate them into making continual
improvements. By design and enlightened management, the police chief avoided many
of the obstacles listed above. The police chief avoided the job control obstacle as the
police department viewed the computer schedule as simply a starting point and was free
to change it as conditions warranted. In addition, the computer schedule only gave the
amounts of each job that could be accomplished and did not tell the chief what personnel
should be assigned to which job or, like priority class scheduling, when the jobs should
be done within the period. The chief was free to devise his/her own work schedule
within the computer schedule framework so he/she was motivated to design an efficient
schedule and could not blame any inefficiencies on the computer schedule. The chief
was also free to respond to both short term physical changes and priority changes as
he/she saw fit.
The preference and knowledge input obstacle and the tradeoffs obstacle were for the most
part avoided by using the maximin value function supplied by the police department to
drive the determination of the computer schedule. For the obstacle of using the computer
schedule as a tool, every effort was made to enable the police department to use the
computer schedule as a tool. This was limited by the fact that the computer schedule was
only produced once every two weeks and the police department chief could not use it to
ask any “what if” questions. In addition, although there was some minimal training on
how the quantitative scheduling algorithm worked, hindsight says that more effort should
have been directed into training. Finally, as with all applications of quantitative
scheduling techniques, the incomplete information obstacle was present. Another model
that was used successfully in scheduling is for sequence-dependent set-up products.
Sequence-Dependent Set-up Scheduling of Production
The setups in a facility or a plant are done for similar products in a sequence. Sequence-
dependent set-up can be symmetric or changing from product A to product B or from B
to product A (Ozgur and Brown, 1995). Sequence dependent set-up times done for
similar products in a sequence can also be made for asymmetric or changing from
product A to product B is different than changing from product B to product A (Ozgur
and Bai, 2010). In the asymmetric sequence-dependent setup case with different setup
from product A to product B than product B to product A is more complicated than if the
sequence-dependent setups were symmetric because even though the set-up time from
switching from product A to product B is different than switching from product B to
product A. The switchover times for asymmetric matrices should be similar to switchover
times had the sequence-dependent set-up times had been symmetric, since we are dealing
with the same products. However even though, the sequence dependent set-ups from
product A to product B will be slightly different than changing from product B to product
A if the sequence-dependent setups are asymmetric. However, it won’t be too different
from each other if the sequence-dependent setups were symmetric, because product A
and product B are going to be similar whether the set-up times are symmetric or
asymmetric, because it is the same product A and same product B. Even though there
might be small difference changing over from product A to product B vs. changing over

157
changing over from product B to product A. Since they are the same product A and
product B, we can expect the differences to be small.
Sometimes to be able to group similar items to groups cluster analysis is used so that we
sequence the products within each group. Once all the groups are sequenced, we have
another procedure that finally sequences all the groups together to come-up with one final
sequence. However the sequence dependent set-up sequencing is a special case of
Traveling Salesmen Problem (TSP). The TSP is non-polynomial (NP) bounded or it is
also referred to as NP- complete. NP- complete problems are well known in the literature
that takes an inordinately long time to complete. As a matter of fact if the problem is too
big, it is unsolvable. That is why we approached the sequence dependent set-up problem
heuristically, using a common sense rules of thumb.
Overcoming Obstacles
Using the discussion above, some strategies and ideas on how to overcome obstacles to
the application of quantitative scheduling techniques can now be stated. Probably the
most important idea is to make the quantitative scheduling technique accessible to the
managers as an integral tool in their day-to-day work. This requires three important
changes in the way quantitative scheduling techniques are designed and implemented.
Managers must understand how the scheduling algorithm works so they know not only its
strengths but its weaknesses. Much more time must be spent in educating the managers
so they view the scheduling algorithm as an important tool that they can use. Managers
must have constant access to the scheduling algorithm so they can run “what if” analyses.
This access was not possible in the 1972 tire production system because only mainframe
computers were available. However, today the power of laptop computers and the
internet make this access possible, but the designers and programmers of the scheduling
system must make this access the top priority in the design and implementation of the
computerized quantitative scheduling system. Ways to measure a manager’s value
function and integrate that value function into their model must be invented. If this is
done, the manager will feel a sense of ownership of the model and will not be afraid to
use its results.

158
Bibliography
Anderson, R.D., & Brown, J.R. (1978). Better parks maintenance. Park Maintenance,
31(10), 10-12.
Brown, J.R., & Israeli, A. (2004). Modeling a decision maker's preferences, Part 2: A tool
for pricing decisions in the hospitality industry. Tourism Economics, 10(1), 5-22.
Brown, J.R., & Israeli, A. (2013). Solving linear design problems using a linear-fractional
value function. Decision Supports System, 55(1), 110-116.
Brown, J.R., Israeli, A., & Mehrez, A. (2002). Tourism Economics, 8(1), 39-57.
Brown, J.R. The Knapsack Sharing Problem. (1979). Operations Research, 27(2), 341.
Brown, J. (1984). The Linear Sharing Problem. Operations Research, 1087-1106.
Brown, J.R., & Ozgur, C. (1997). Priority class scheduling: production scheduling for
Multi-objective Environments. International Journal of Production Planning and
Control, 8(8), 762-770.
Brown J.R., & Ozgur, C. (2011). Utilizing Maximin Value Functions. International
Journal of Operations and Quantitative Management, 16(4), 17-28.
Brown, J.R. (1994). Bounded Knapsack Sharing. Mathematical Programming. 67(1),
343-382.
Brown, J.R. (1979). The Sharing Problem. Operations Research, 27(2), 324-340.
Brown J.R. (1991). Solving Knapsack Sharing Problems with General Tradeoff
Functions. Mathematical Programming, 51(1), 55-73.
Khouja, M., Rajagopalan, H., Zhou, J. (2013). Analysis of the Effectiveness of
Manufacturer-Sponsored Retailer Gift Cards in Supply Chains. European Journal of
Operational Research, 230(2), 333-347.
Mehrez, A., Brown, J.R., Khouja, M. (1992). Aggregate Efficiency Measures and
Simpson’s Paradox. Contemporary Accounting Research, 9(1), 329-342.
Ozgur, C., & Bai, L. (2010). Hierarchical Composition Heuristic for Asymmetric Sequence
Dependent Single Machine Scheduling Problems. Operations Management Research, 3(1),
98-106.
Ozgur, C., & Brown, J.R. (1995). A Two-Stage Traveling Salesman Procedure for the
Single Machine Sequence Dependent Scheduling Problem. OMEGA, International Journal
of Management Science, 23(2), 205-219.

159
Ozgur, C., & Brown, J.R. (2012). Applying Decision Utility to Solve Business Problems with
Limited Resources. International Journal of Manufacturing Excellence, 3(1), 13-19.
Siebert, J., & L., R. (2015). Creating More and Better Alternatives for Decisions Using
Objectives. Operations Research.
Special thanks to Taylor Colliau, Zachariah Hughes, and Grace Rogers for their assistance
with this paper.

160
The Emergence of Lean Accounting
Gene Fliedner
School of Business Administration
Oakland University
Rochester, MI 48309
Abstract
Lean practitioners use a variety of metrics to continually assess and control system
performance. Some of these metrics possess a cost accounting nature. Inherent
characteristics of these cost accounting metrics, including their predefined time horizon,
cost allocation approach, and the potential lack of a customer perspective can confound
process improvement efforts. This recognition has led to the recent emergence of lean
accounting. Lean accounting has emerged in recognition of the potential short comings of
traditional cost accounting methods as a means of promoting continuous improvement
efforts. This paper focuses on the impetus for the emergence of lean accounting.

161
The Emergence of Lean Accounting
Introduction
Transformation system performance metrics are collected and used for three primary
purposes. First, they enable a better understanding or monitoring of the current system
state. Second, they promote control activities, or corrective actions which guide
improvement efforts towards the ideal state. Third, they are used for both internal and
external stakeholder reporting purposes.
Numerous metrics have been devised to assist the lean practitioner over the past three
decades. These metrics capture system performance data to better focus monitoring and
controlling efforts to better assist the attainment of improvements in system objectives.
These metrics are commonly focused on a specific aspect of system performance such as
time (e.g., set up, takt, pitch, or throughput times), costs (e.g., inventory investments and
turnover rates), quality (e.g., number of defects), flexibility (e.g., set up times or the
variety of items produced), sustainability (e.g., reclamation or recycling achievements),
or worker safety and morale (e.g., number of accidents).
This paper focuses on the emergence of lean accounting. Lean accounting does not refer
to an alternative means of accounting. Namely, lean accounting is not well defined to
date. Rather, the emergence of the term lean accounting has occurred in large part due to
limitations of current cost accounting practices which form the basis of numerous
performance metrics used for monitoring and controlling purposes within transformation
systems. This subject is beginning to garner attention as metrics impact operating
practices as well as internal and external reporting practices. This paper identifies and
explains the limitations of current cost accounting practices which have served as the
impetus for the emergence of lean accounting. The contribution of this paper is not to
suggest a better means of accounting, but rather to identify potential shortcomings of
current accounting practices from a lean perspective, which may promote future
improvement efforts. Along these lines, this paper provides guidance relevant towards the
creation of metrics for the lean practitioner.
Lean Performance Metrics
Lean performance metrics, or key performance indicators (KPIs), may be categorized by
the objective they recognize, including time, cost, quality, flexibility, sustainability, or
employee safety and morale. Alternatively, a KPI may be categorized by the portion of
the system it monitors, ranging from a KPI captured for a resource as small as machine,
to a larger process, or to the entire organization itself. Although not meant to be an
exhaustive list, frequently encountered lean metrics categorized by objective are
identified in Table 1.
Table 1: Example Lean Performance Metrics
Metric Nature Lean Performance Metric

162
Time based
Total order throughput time
Average system order throughput time
Process velocity = throughput time/value-added time
Net operating time available = total operating time available −
production and maintenance downtime
Plant availability = total operating time available/net operating
time available
Number of process steps; machine setups; material touches
Cost based
Number of process or system employees
Inventory turnover = cost of goods sold/average inventory
Days of inventory outstanding = 365 days/inventory turnover
Efficiency = actual output/standard output
Utilization = total resource time usage/total resource time
availability
Yield = (units produced−defective units)/units produced
Process step efficiency = (order batch size × takt time)/total
process step operating time
Labor productivity = units of output/units of labor
Quality based
Number of defects (defect rates)
Scrap rates
First time through = (order batch size − number of defects in
order)/order batch size
Flexibility based
Setup times (possibly as a portion of pitch times)
Range of worker task capabilities
Range of machine task capabilities
Routing alternatives
Sustainability
based
Extent of energy requirements supplied by
renewable/alternative energy sources
Waste to landfill (indexed to net sales)
Volatile air emissions (indexed to net sales)
Environmental protection agency toxic release inventory
(indexed to net sales)
Safety and Morale
based
Number of job accidents
Employee satisfaction
Staff retention
The vast majority of research demonstrates that firms commonly rely on numerous KPIs
when employing lean (Kennedy and Widener, 2008). Lean practitioners find it desirable
to rely upon metrics possessing a variety of characteristics. For instance, metrics that are
visual enhance communication and comprehension capabilities. Visual management
techniques have the ability to convey a lot of information quickly. Furthermore, people
seemingly retain information better when it is represented both verbally and visually.
Nonfinancial metrics that relate back to specific products or processes enable system
monitoring and proactive measures to be taken. For example, capturing hourly outputs

163
may promote system adjustment efforts in as much of a real time manner as is possible.
Alternatively, financial metrics that are often well understood as people easily understand
the value of a dollar.
In addition to differing characteristics, the time and location metrics are captured differs
to some extent upon the transformation environment. For example, in low-volume, batch
environments, the examination of connections and flows between resources is critical for
waste reductions. This is true given the impacts varied upstream batch process times have
on downstream arrival times and delays. Therefore, it is important for the system
drumbeat (takt times and pitch times) to be consistent between connecting process
resources. Alternatively, in high-volume, repetitive, line flow processes, it is assumed
that processes are initially designed with a common takt time across system resources.
Therefore, a greater focus on the productivity of the resources themselves is often
pursued. In particular, a measure such as overall equipment effectiveness and the six big
losses of equipment utilization, which focus on equipment availability (equipment failure,
setup, and adjustment), equipment speed loss (idling, minor stoppages, and reduced
speeds), and output loss due to lower quality (defects and reduced yields) is useful
(Nakajima (1988). The point is, not all lean metrics or KPIs are useful for all types of
transformation processes. Given their varied nature, lean practitioners often rely upon a
variety of metrics, both financial and nonfinancial.
Many of the metrics noted in Table 1 lack a direct financial nature. For example, the days
of inventory outstanding expresses the expected time required for demand to consume the
existing inventory. However, a critical element of many business choices relates to the
financial bottom line. Financial implications of strategic choices, tactical, as well as
operational decisions can materially affect lean practices. Simply put, many common lean
performance metrics may be converted into financial terms; however, they are not
directly financially focused.
Lean Accounting
Financial accounting is commonly thought of as having an external reporting focus. As
an integral business function though, accounting serves both internal and external cost-
reporting purposes. Financial accounting measures and records transactions and
contributes to various documents, primarily financial in nature, based upon generally
accepted accounting principles (GAAPs).
Anecdotal evidence suggests financial accounting performance metrics do not always
serve lean practitioners well for several reasons. First, financial accounting performance
metrics provide late information. In particular, measures calculated at the end of a period,
such as a month, may delay or prevent proactive actions. Second, financial accounting
performance metrics may be vague. For example, the allocation of indirect overhead
costs to a line of products does not represent accurate system performance. Third,
measures, which are primarily financial in nature (e.g., standard costs) do not relate to the
customer’s perspective of value-added tasks for specific products. This confounds

164
process improvement activities. Consequently, the term lean accounting has recently
emerged.
The emergence of lean accounting recognizes the potential deficiencies of current
financial accounting practices when attempting to assess system performance. Lean
accounting attempts to rationalize the necessity to track, allocate, and monitor financial
metrics at numerous, pinpoint locations within operation processes. Lean accounting
recognizes that voluminous transaction processing attributable to standard costing and
overhead allocation practices does not add value to well-understood, stable processes.
Rather, some of the financial metrics and processed transactions which focus on tracking,
allocating, and monitoring system performance may be unnecessary and eliminated.
A sound understanding of financial accounting practices and financial metrics is
important for lean practitioners’ comprehension of lean accounting and for choices both
in the boardroom and on the factory floor. These practices and metrics may reflect data
that are financial in nature or they may reflect data that concern defects due to unmet
specifications including length, width, height, weight, or volume. Alternatively, the data
may reflect flow interruptions due to late materials, poor machine reliability, missing
tools, unavailable operators, and so on. The point is lean practitioners benefit from the
knowledge of a broad set of performance assessment tools with the frequency of data
collection being determined by the value of the data itself. Highly stable operations
require less data collection and transaction processing.
Ideally, lean practitioners will rely upon a broad set of performance measures possessing
numerous characteristics. These characteristics can include (1) financial metrics, (2)
current, or real-time system performance, (3) a depiction of the current state of the
process relative to the planned or expected state, (4) engaging the individual(s) close to
the process and those individuals who are responsible for maintaining and correcting the
process, (5) if possible, simultaneously relying upon multiple sensory functions (e.g.,
coupling audio signals with visual signals), (6) utilization of smaller time increments
between data capture points enabling issues being brought to light sooner and more
easily, highlighting the introduction of assignable sources of variation, (7) use for
accountability regarding investigative results, and (8) utilization of various colors in order
to depict multiple-state conditions. Some of the more significant accounting practices and
financial metric topics impacting lean practitioners’ choices both in the boardroom and
on the factory floor are identified in the following sections.
Cost Accounting
Cost accounting provides much of the information used for financial accounting reporting
purposes. Cost accounting typically collects, analyzes, and disseminates financial and
nonfinancial information related to the costs of resource acquisition and consumption
supporting transformation processes for both internal and external decision making.
Cost allocation is used to describe the assignment of indirect costs (e.g., lease, overhead,
insurance, taxes, and quality assurance, and quality control) to particular cost objects

165
(e.g., individual jobs, orders, a product, department, machine, or material). The objective
of allocating indirect costs to an object is to measure the underlying usage of indirect
resources by objects. Cost accounting relies upon individuals within responsibility
centers to provide estimates of resource usage for cost allocation purposes. Resource
usage often cuts across multiple departments making accurate estimates difficult at best.
Indirect costs, which are assumed to be related to an object such as a part, machine, or an
order, cannot be directly or easily traced to an object. Indirect costs are nonetheless
attributed to the object despite the difficulty tracing costs.
Indirect costs can comprise a significant portion of overall costs assigned to objects. The
historical practice of allocating indirect costs in this manner has been done for several
reasons. First, it assumes this information is necessary for economic decision making,
such as determining a selling price for a product. However, in a product’s inception, the
selling price may not sufficiently cover production costs, as production volumes are
commonly low relative to later periods. Leaders should always examine decisions from a
systematic point of view; otherwise, some products assessed as being successful in later
life cycle stages may never initially go into production. Second, full cost disclosure, even
though one may be relying upon inaccurate cost estimates, can be used to motivate
employees to alter designs. Various strategies, including simplicity from fewer parts, the
use of standardized components, or possibly alternative materials or technologies can be
followed to alter designs. Third, estimates for reasonable reimbursement rates may be
required. Fourth, external information reporting is often necessary.
Unfortunately, indirect cost estimates can be wrong to a great extent, leading to poor
decision making. This sometimes occurs because indirect costs are often accounted for
with definitive time periods (e.g., a week or month). However, indirect costs may be
incurred beyond these discreet time periods. Furthermore, indirect costs are often
assumed to be incurred at a linear rate such as the incurrence of monthly rent. Yet not all
months have the same number of working days. And, there may be variable (seasonal)
aspects to some indirect costs, further reducing the effectiveness of estimates.
An additional cost allocation issue is whether indirect costs are controllable, minimally
influenced, or uncontrollable. This issue is similar to non-value-adding activities. Most
would agree that non-value-adding activities should be eliminated, as they are wasteful.
Unfortunately, not all non-value-adding activities can be eliminated, as they may not be
avoidable. Some costs that are allocated to objects are uncontrollable. Examples of
uncontrollable costs include depreciation, workspace charges, general and administrative
overhead allocations, and even direct labor during periods of low demands as the labor
may not be transferred or eliminated. Uncontrollable costs should be recognized so
managers do not pursue matters beyond their immediate, direct control.
Choices about: (1) the degree of detailed estimation, collection, analysis, and reporting of
information, (2) product-costing (service-costing) methods (e.g., variable, absorption, or
throughput costing), (3) product-costing methods using traditional sequential tracking or
backflush tracking, and (4) process costing methods (e.g., weighted average and first in,
first out) can each have profound impacts on costs of goods sold and therefore financial

166
reporting implications. These are but a few of the accounting issues confronting the lean
practitioner. These ideas are discussed in the following four sections.
Activity-Based Accounting Systems
Emerging lean accounting practices seek to reduce non-value-adding transaction
processing, eliminate standard costs in favor of actual costs, and eliminate cost
allocations. Activity-based costing (ABC) represents a step in this direction. ABC
attempts to improve upon traditional estimating approaches of indirect costs by focusing
on less aggregated or more detailed transformation activities, such as actual machine
setup times, design activities, or inspection activities for each specific product in order to
allocate indirect costs to objects on the basis of specific activities undertaken for each
product.
ABC activities may rely upon process flowcharts to more accurately trace and estimate
indirect costs. Process flowcharts may provide a more finely structured mapping of
transformative activities allowing a more accurate cost tracing and subsequent allocation.
ABC systems commonly use utilize a four-part cost hierarchy (Horngren, Foster and
Datar, 2000). The hierarchies are based upon different types of cost drivers or differing
degrees of difficulty in determining cause-and-effect relationships for cost allocations,
which may be estimated based upon a process flowcharting investigation. Four-part
hierarchies, which determine how indirect costs are allocated are typically related to (1)
output unit-level cost measures, (2) order- or batch-level cost measures, (3) product- or
service-sustaining cost measures, and (4) facility-sustaining cost measures. Each of these
hierarchies is defined in the following text.
Output unit-level cost measures assess indirect costs against resources consumed
producing specific products or services. Examples of these activities include electrical
consumption and machine maintenance. Costs associated with these activities are
assumed to be directly proportionate with the output levels for a product or service.
Indirect costs deemed related to unit output levels are allocated directly using a measure
such as unit outputs. For example, assume the monthly electric bill for an organization
producing 500 units of product A and 250 units of product B is $1,000. In this example,
monthly electric costs allocated to product A would be $666.67 (500/750 × $1,000),
while $333.33 (250/750 × $1,000) would be allocated to product B.
Order- or batch-level cost measures assess indirect costs against resources consumed
producing an order or a batch of a product or a service rather than against unit output
levels. Examples of these activities would include item procurement or setup activities.
Costs associated with these activities are assumed to be incurred once per order or batch
for a product or service. Assume the setup costs associated to produce a batch of product
A are estimated to be $250. If five setups are done for product A during the month, the
costs allocated for product A setups would be $1,250 (5 × $250).

167
Product- or service-sustaining cost measures assess indirect costs against resources
consumed producing a specific product or service. This assessment does not occur on the
basis of units or batches, but rather for the product or service itself. Examples of this
would include vendor identification, product design, product engineering, and tooling
costs. Each of these activities incurs costs, which cannot be directly traced to unit or
batch volumes.
Facility-sustaining cost measures assess indirect costs against resources consumed
producing all of the organization’s products and services. Examples of these costs include
lease, custodial, security, information technology, and other costs. Determining cause-
and-effect relationships for these cost allocations are most difficult. Therefore, some
organizations deduct these costs from operating income rather than pursuing a product
cost allocation approach.
Cost hierarchies used within ABC systems promote identification of cost cause-and-
effect relationships. The idea of ABC systems is to promote more accurately tracing and
estimating of indirect costs, which may promote efficiency improvements. The cost
cause-and-effect relationships promote more accurate indirect cost tracing and estimating,
which may allow for waste elimination and efficiency improvements. However, it is
important to understand the effort involved in determining detailed identification of cost
drivers and cost categories. Detailed ABC systems can be costly to initiate, understand,
operate, and maintain. In effect, the lean practitioner must question the value added of
this detailed information.
Product (Job) Costing: Variable, Absorption, and Throughput Costing
Reported income is a key metric in the performance evaluation of all managers. It is
important to understand that the incurrence and reporting or the expensing of costs can
significantly impact short-term performance perceptions. Lower-volume, batch processes
typically rely upon one of three alternative methods of product (job) costing. These
methods recognize that work flows in low volume systems focus upon specific customer
orders often possessing distinctly identifiable (customized) characteristics. These
historical product costing approaches differ largely in their treatment of inventoriable
costs, which refers to the timing of when costs of a product (job) are expensed as cost of
goods sold.
The three alternative lower-volume batch process product-costing methods are variable,
absorption, and throughput costing. These methods differ in the timing in which they
expense “variable” and fixed manufacturing costs. The difference is attributable to the
expensing of these costs to either the period in which the product is made or in which it is
sold. If any costs are expensed in a later period than the product is made, those costs are
inventoried in the earlier period(s) and consequently inflate the earlier period’s operating
income.
Variable costing is an inventory costing method that reports variable manufacturing costs
(both direct and indirect) in the period in which the product is sold, not necessarily in the

168
period in which the product is produced. Variable costing reports both direct and indirect
variable manufacturing costs in the form of stored inventory, allowing for delayed
reporting of these manufacturing costs until the period in which the product is sold.
While the reporting of variable manufacturing costs may be inventoried under variable
costing, fixed manufacturing costs (both direct and indirect) are excluded from
inventoriable costs and therefore are treated as an expense in the period in which they are
incurred.
Absorption costing is a product costing method that treats all manufacturing costs of a
particular product, both variable and fixed manufacturing costs, as inventoriable costs.
Absorption costing uses the total direct costs and indirect overhead costs associated with
manufacturing a product as the cost base. Relative to the variable costing method, use of
absorption costing can encourage managers to produce more inventory than necessary in
order to inflate operating income in the period because absorption-costing inventories not
just variable manufacturing costs but also fixed manufacturing costs. In general, if
inventories increase during an accounting period, more operating income will be reported
under absorption costing than variable costing. All nonmanufacturing costs are expensed
in the period in which they are incurred under both variable- and absorption-costing
approaches.
Contrary to variable and absorption costing, throughput costing treats all costs except
those related to variable direct materials, as expenses of the period in which the product is
made. Namely, only variable direct costs are inventoriable costs. Throughput costing
results in a lesser incentive to increase production in order to artificially inflate operating
income in a specific period. Table 2 compares the cost expensing differences among the
three alternative product-costing methods.
Table 2: Comparison of Product Costing Method Expensing Manner
Inventoriable Costs
Throughput
Costing
Variable Costing
Absorption Costing
1. 1. Variable Direct
Material Costs
Yes
Yes
Yes
2. 2. Variable Direct
Conversion Costs*
No
Yes
Yes
3. 3. Variable Indirect
Manufacturing Costs
No
Yes
Yes
4. 4. Fixed Direct
Manufacturing Costs
No
No
Yes
5. 5. Fixed Indirect
Manufacturing Costs
No
No
Yes
*Variable direct conversion costs refer to all direct manufacturing transformation costs
less direct material costs

169
It should be clear that the three alternative product-costing methods impact reported
income differently. Variable and absorption costing can promote the unnecessary buildup
of inventories which leads to inflated current period performance because they treat some
costs as inventoriable thereby avoiding their immediate incurrence. It should be noted
that among the three product-costing methods, GAAP requires U.S. firms utilize
absorption costing for external financial reporting and is therefore the most commonly
used product costing method.
Although absorption costing is the product costing method most commonly used, there is
disagreement as to the favored inventory costing approach. Lean practitioners might
consider throughput costing to encourage greater efficiencies However, throughput
costing is not allowed for external reporting if its use results in materially different
numbers than those reported by absorption costing. As previously noted, GAAP does not
allow throughput costing to be used for external financial reporting for U.S. firms.
However, GAAP is not followed globally. Furthermore, there is disagreement among
accountants as to a favored product-costing approach. Some accountants suggest variable
costing be used for external reporting because the fixed portion of manufacturing costs is
more closely related to manufacturing capacity than to the actual production of specific
units. Other accountants suggest absorption costing be used for external reporting
because inventories should carry both variable and fixed cost components as both are
necessary for production.
Traditional Product Costing and Backflush Inventory Costing Choices
The product (job) costing methods for lower volume batch process transformation
systems noted above traditionally assume a sequential approach. Specifically, accounting
journal entries occur at sequential process stages such as procurement (raw materials
inventory), fabrication (work-in-process inventory), final assembly (finished goods
inventory), and distribution. Each one of these process stages requires recording journal
entries.
An alternative to traditional product costing is backflush inventory costing. It is
sometimes used in systems with short throughput times that maintain little in-process
inventories or highly stable periodic inventory levels. Although it still reflects a linear
process flow, backflush inventory costing often omits capturing one or more in-process
accounting journal entries, effectively delaying the costing process until final assembly is
completed. Costs are then “flushed” back at the end of the production run and assigned to
the goods. This eliminates some of the detailed tracking of costs at intermediate
production process steps, a feature common to traditional sequential costing systems. The
detailed tracking of traditional sequential costing systems may simply not provide the
value-added information for monitoring and control purposes.
By eliminating work-in-process accounts and journal entries, backflush costing simplifies
the accounting process. However, this simplification and other deviations from traditional
costing systems mean that backflush costing may not always conform to GAAP. For
example, work-in-process inventories may exist but would not be recognized in financial

170
statements. This system also complicates a potential audit trail, as the ability to identify
resource consumption at sequential process stages may be eliminated.
Process Costing: Weighted Average and First In, First Out
Accounting in higher-volume, repetitive, line flow processes often uses a costing
approach which recognizes the higher-volume nature of the process for financial
reporting. Although there may be minor differences, it is often assumed each item is
largely identical, consuming similar production resources. Consequently direct material
costs, direct labor costs, and indirect manufacturing costs are largely indistinguishable
among the mass-produced items. As a result of this uniformity, a process-costing
approach treats all units produced as equivalent through the adoption of an average
production cost per unit to calculate unit costs of products or services.
Given of the wide variety of items produced in lower volume, batch processes, product
costing methods record separate journal entries for each product at each production
process stage (e.g., procurement, fabrication, or assembly stages). As a result of
equivalent products, rather than having separate journal entries at each stage of the high
volume production process for different products, process-costing methods result in a
single journal for each process stage. Process costing relies on two alternative inventory
cost flow assumptions, a weighted average or a first in, first out (FIFO) assumption. Each
of these methods results in different work-in-process and work-completed costs.
The weighted average process-costing method calculates an equivalent unit cost of work
done to date, regardless of the actual period or timing in which the work was completed.
It assigns this cost to both the number of equivalent units completed and transferred
downstream as well as to the equivalent units transferred to work-in-process inventory at
the end of the period. The weighted average cost is the total of all costs entering the
work-in-process journal account (regardless of timing) divided by total equivalent units
of the work done to date.
The FIFO process-costing method may be best explained as a four-step process. First, it
assigns the cost of the previous period’s equivalent unit ending inventory (current
period’s equivalent unit work-in-process beginning inventory) to the first units completed
and transferred downstream during the current period. Second, it assigns the costs of
equivalent units worked on but not finished during the period to the remaining equivalent
unit work-in-process beginning inventory. Third, cost assignment proceeds to equivalent
units arriving, completed, and transferred downstream during the period. Fourth, cost
assignment proceeds to equivalent units arriving and remaining in work-in-process
inventory.
The principal differences between these two process-costing procedures include the
following observations. First, the weighted average process-costing method aggregates
inherited units and costs (work done in prior periods and accounted for as current period
beginning inventory) with units and costs of work done during the current period. As a
result, the weighted average process-costing method tends to smooth (average) equivalent

171
unit costs. Second, the weighted average process-costing method is computationally
simpler than the four-step FIFO process. Third, the FIFO process-costing method for
equivalent unit costs is performed solely for work done during the current period.
Therefore the FIFO method is more transparent with information concerning periodic
cost changes, which may enhance one’s performance-monitoring ability. Fourth, costs of
completed units and therefore, operating income can be materially different under the two
approaches when the direct material or transformation process costs vary greatly from
period to period or when there is a dramatic change in periodic work-in-process inventory
levels relative to work transferred downstream. This can influence one’s understanding of
financial reports. Regardless of the method, process-costing approaches are typically used
exclusively in high-volume process industries that produce similar items, given their need
to determine equivalent units. Otherwise, the average production cost per unit is too
broad.
Conclusions
Beyond specific cost-based accounting metrics, there are additional financial controls and
KPIs that lean practitioners should be aware of as well. For example, in any investment
decision, various financial considerations should be assessed. Among these are example
metrics such as the payback period, return on capital, discounted or net present value, as
well as operating profit.
Needless to say, there is a wide array of important performance metrics. Some focus on
various system objectives (e.g., cost or time), others examine specific system elements
(e.g., machine utilization), some are not directly financial in nature (e.g., inventory turns),
and others are directly financial (e.g., payback period). Emerging lean transformation
system monitoring and control procedures are attempting to focus on recent system or
current state performance, social controls (e.g., encouraging worker cross-training), and
visualization approaches. Technology is facilitating and will continue to facilitate the
identification of more costs as direct rather than as indirect costs. For example, bar code
technology can identify consumption of specific parts within an exact stage of a
transformation process.
Some common performance metrics possess a cost accounting nature. Inherent
characteristics of these cost accounting metrics, including their predefined time horizon,
cost allocation approach, and the potential lack of a customer perspective can confound
process improvement efforts. This recognition has led to the recent emergence of lean
accounting. Although not well defined to date, lean accounting has emerged in
recognition of the potential short comings of traditional cost accounting methods as a
means of promoting continuous improvement efforts. This paper serves to highlight the
reasons for the emergence of lean accounting.
The emergence of lean accounting refers largely to the need to develop metrics that
address system assessment that possess the following desirable characteristics: (1)
financial, (2) current, or real-time relative to the planned or expected state, (3) engaging
the individual(s) close to the process and those individuals who are responsible for

172
maintaining and correcting the process, (5) if possible, simultaneously relying upon
multiple sensory functions (e.g., coupling audio signals with visual signals including
various colors in order to depict multiple-state conditions), (6) utilization of smaller time
increments between data capture points enabling issues being brought to light sooner and
more easily, highlighting the introduction of assignable sources of variation, and (7)
accountability regarding investigative results.
It is important to understand that many variables impact lean performance metrics. The
data characteristics noted above reflect desirable characteristics which expand upon
financial accounting KPI’s. Monitoring, controlling, and improving transformation
processes are data driven. The focus, nature, and limitations of each metric should be
understood. Lean practitioners benefit from the knowledge of a broad set of performance
assessment tools.
References
Horngren, C. T., G. Foster, and S. M. Datar. 2000. Cost Accounting, A Managerial
Emphasis. 10th Edition. Upper Saddle River, NJ: Prentice Hall.
Kennedy, F. A. and S. K. Widener. 2008. “A Control Framework: Insights from Evidence
on Lean Accounting.” Management Accounting Research 19, no. 4, pp. 301-323.
Nakajima, S. 1988. Introduction to TPM: Total Productive Maintenance. Cambridge,
MA: Productivity Press.

173
An Analysis of Factors Influencing the Stock Market Impact from
Supply Chain Disruptions
Sanjay Kumar
College of Business
Valparaiso University,
Valparaiso, IN, USA 46383
Jiangxia Liu
College of Business
Valparaiso University,
Valparaiso, IN, USA 46383
Zhenhu Jin
College of Business
Valparaiso University,
Valparaiso, IN, USA 46383
Sourish Sarkar
Black School of Business
Penn State University- Erie
Erie, PA, USA
Abstract
Prior research has shown that supply chain disruptions cause decline in stockholder
wealth. This paper explores the factors that affect the stock impact of supply chain
disruptions. We use Event Study Methodology and analyze supply chain disruptions data
from the US, India, and Japan to reveal the stockholder wealth impact. The rich
multinational data allows comparison of stock impact between countries considered. We
find that disruptions cause stock decline, however, the magnitude of decline varies
between countries. We also study contagion across competitors. Along with companies
reporting a supply chain disruption, unaffected competitors in the same industry segment
also experience a stock decline following the disruption. We also reveal that stock decline
is significantly higher in recessionary market period. Companies show statistically
insignificant stock decline from disruptions in bear market cycle. Outside the US, we
observe significant stock decline prior to public announcement of disruption. This may
indicate possibility of insider trading. Our results are of importance for supply chain
managers who make decision regarding investments in disruption mitigation. Investor
who take short positions on stocks could use our results to make better investment
decisions.
Keywords: Supply Chain Disruptions, Event Studies, Stock Market Impact.

174
An Analysis of Factors Influencing the Stock Market Impact from
Supply Chain Disruptions
Introduction
Supply chain management has been considered as the next big source of creating
competitive advantage. Operationally and financially, companies benefit from adopting
and improving supply chain management practices. These benefits are, however, difficult
to quantify. Anecdotal and case study based evidence may not be enough to justify
investment in supply chain management. Effective supply chain practices are expected to
make operations reliable and responsive to unexpected events such as supply chain
disruptions. Therefore, one approach to estimating the value of effective supply chain
management is to estimate the value lost when disruptions happen. For publically traded
companies, the diminished value could be estimated with stockholder wealth changes.
Past research has linked supply chain disruptions with the stock performance of affected
companies (Kumar, Liu, and Scutella, 2015; Filbeck, Kumar, Liu, and Zhao, 2015;
Filbeck, Kumar, and Zhao, 2014; Schmitt & Raman, 2012; Hendricks & Singhal, 2003,
2005a, 2005b). The supply chain performance, during disruptions and otherwise, affects
financial performance of a company often measured in terms of cash flow, earnings,
return on assets (ROA), and credit ratings. Disruptions could influence these metrics and
thus the financial outlook of a company. The consequence is expected to be reflected in
stock market outcomes which are efficient to any new information.
A significant amount of research has been devoted to addressing various aspects of
disruptions. The issues addressed include strategic, tactical, and operational. See Ellis et
al. (2011) for a thorough literature review. However, the extant quantitative literature on
disruptions management is almost entirely focused on supply chains in the US. Supply
chains differ between countries (Sahay, Gupta, and Mohan, 2006; Zhao, Flynn, and Roth,
2006, 2007). They may also vary in their disruption mitigation abilities, which are
affected by culture and country (Kumar, Liu, and Caliskan-Demirag, 2015). The
suitability of a disruption management practice or strategy may depend on supply chain
characteristics, which could vary based on economic and other country specific factors.
Therefore, research efforts directed towards managing disruptions in countries other than
the US could be valuable. Besides, in today’s global marketplace, supply chains and
markets span across countries, and the effects of disruptions could cascade between
countries and continents. For example, the Japanese Tsunami of 2011 disrupted supply
chains across the world. Efficient operations require understanding and managing all
echelons of a supply chain, some of which could be located in other countries. Therefore,
we consider data from the US, India, and Japan.
Efficiency inducing practice of decentralization in modern supply chains has resulted in
focused production and operations. Companies and their competitors may share operating
resources. They may also compete for markets and operating resources. Performance of
companies in supply chains is affected by decisions and policies of supply chain partners.
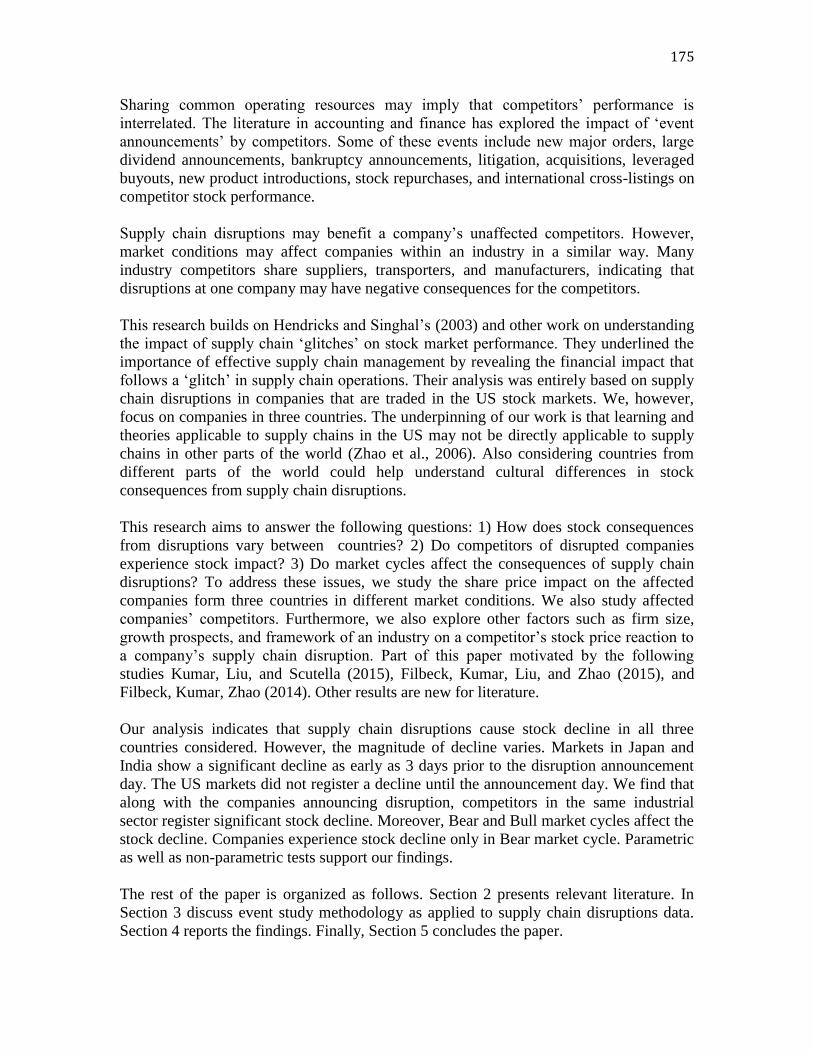
175
Sharing common operating resources may imply that competitors’ performance is
interrelated. The literature in accounting and finance has explored the impact of ‘event
announcements’ by competitors. Some of these events include new major orders, large
dividend announcements, bankruptcy announcements, litigation, acquisitions, leveraged
buyouts, new product introductions, stock repurchases, and international cross-listings on
competitor stock performance.
Supply chain disruptions may benefit a company’s unaffected competitors. However,
market conditions may affect companies within an industry in a similar way. Many
industry competitors share suppliers, transporters, and manufacturers, indicating that
disruptions at one company may have negative consequences for the competitors.
This research builds on Hendricks and Singhal’s (2003) and other work on understanding
the impact of supply chain ‘glitches’ on stock market performance. They underlined the
importance of effective supply chain management by revealing the financial impact that
follows a ‘glitch’ in supply chain operations. Their analysis was entirely based on supply
chain disruptions in companies that are traded in the US stock markets. We, however,
focus on companies in three countries. The underpinning of our work is that learning and
theories applicable to supply chains in the US may not be directly applicable to supply
chains in other parts of the world (Zhao et al., 2006). Also considering countries from
different parts of the world could help understand cultural differences in stock
consequences from supply chain disruptions.
This research aims to answer the following questions: 1) How does stock consequences
from disruptions vary between countries? 2) Do competitors of disrupted companies
experience stock impact? 3) Do market cycles affect the consequences of supply chain
disruptions? To address these issues, we study the share price impact on the affected
companies form three countries in different market conditions. We also study affected
companies’ competitors. Furthermore, we also explore other factors such as firm size,
growth prospects, and framework of an industry on a competitor’s stock price reaction to
a company’s supply chain disruption. Part of this paper motivated by the following
studies Kumar, Liu, and Scutella (2015), Filbeck, Kumar, Liu, and Zhao (2015), and
Filbeck, Kumar, Zhao (2014). Other results are new for literature.
Our analysis indicates that supply chain disruptions cause stock decline in all three
countries considered. However, the magnitude of decline varies. Markets in Japan and
India show a significant decline as early as 3 days prior to the disruption announcement
day. The US markets did not register a decline until the announcement day. We find that
along with the companies announcing disruption, competitors in the same industrial
sector register significant stock decline. Moreover, Bear and Bull market cycles affect the
stock decline. Companies experience stock decline only in Bear market cycle. Parametric
as well as non-parametric tests support our findings.
The rest of the paper is organized as follows. Section 2 presents relevant literature. In
Section 3 discuss event study methodology as applied to supply chain disruptions data.
Section 4 reports the findings. Finally, Section 5 concludes the paper.

176
Literature Review
There is a rich stream of literature dealing with management of supply chain disruptions.
Both analytical and empirical studies have focused on planning, preventing and
mitigating supply chain disruptions. The literature permeates to several academic
research areas. See Ellis, Shockley, and Henry (2011) and Craighead, Blackhurst,
Rungtusanatham, and Handfield (2007) for comprehensive literature reviews. Our
research is in the domain of estimating the value of effective supply chain management
by observing the financial consequences when supply chains experience disruptions.
Within this domain, we focus on exploring country, culture, market cycle, and
competitive differences.
Quantitative indicators to measure the effectiveness of supply chain management
strategies are rare. Extant research relies on a conceptual framework or case studies,
which focuses on establishing a correlation between the effectiveness of supply chain
management and shareholder value (Mentzer, 2001; Chopra & Meindl, 2012). Some
research has shown that supply chain management could lead to enhanced shareholder
wealth. Filbeck, Gorman, Greenlee, and Speh (2005) demonstrate that companies that
announced adoption of supply chain management-enhancement tools experience positive
share price reaction with the magnitude of the reaction positively related to the degree of
certainty regarding the publication date. Other specific supply chain practices such as
just-in-time inventory (Fullerton, McWatters, & Fawson, 2003), responsive inventory
management (Roumiantsev & Netessine, 2007), and inventory turnover (Thomas &
Zhang, 2002; Chen, Frank, & Wu, 2005) have been shown to improve stock performance
of a company.
Another stream of research has taken an indirect approach to demonstrate the financial
benefits of effective supply chain management. This research stream studies the impact
of supply chain disruptions on stockholder value. Our research falls in this category. The
underlying argument is that by estimating the stockholder value diminished because of a
disruption, one could assess the value of effective supply chain management. Using event
study methodology similar to the one applied in this paper, Hendricks and Singhal (2003)
analyze the effect of supply chain glitches on shareholder wealth. Their results show a
marked decrease in shareholder value following announcement of a supply chain glitches.
They also reveal insights such as larger firms experience less negative impact, and firms
with higher growth prospects experience a more negative stock price impact.
Hendricks and Singhal’s (2005a) research shows that in the long term (two years, one
year pre- and post-glitches period) the stock reaction to disruptions is nearly -40%. For
the companies announcing a supply chain disruption the equity risk was higher by 13.5%
in the year following the disruption. Hendricks and Singhal (2005b) compare the
performance of companies that announced disruptions to other companies (who did not
announce a disruption in the event period) and make inferences about operating income,
return on assets (ROA), return on sales, inventory growth, and sales growth. Companies
announcing disruptions experience decreased performance on all these measures.

177
Filbeck, Kumar, Liu, and Zhao (2015) explore the impact of market cycle and company
domicile on stock performance. Using a dataset of automobile companies in the US they
show that stock impact from disruptions is dependent on the market cycles, with bear
cycles resulting in a more negative outcome as compared to bull market cycles. Japanese
companies (that are traded in the US stock market) demonstrate a more robust
performance as compared to American automobile companies. Filbeck, Kumar, and Zhao
(2014) explore contagion across competitors in the event of a supply chain disruption.
Competitors are found to experience negative stock reactions indicating that negative
stock consequences of disruptions are not limited to the companies affected but also
cause losses for competitors. Kumar, Liu, and Scutella (2015) extend the results to Indian
stock market and contrast them with the US market.
All papers discussed until now in this literature review focus exclusively on companies in
the US. However, economic and market conditions affect the applicability of supply
chain practices. Owing to economic and cultural factors, business management practices
and policies deemed effective in one country may not be applicable in supply chains of
other countries. Zhao et al. (2006, 2007) call for research efforts to be directed
specifically towards supply chains in developing countries. They use China as an
example and cite economic, governmental, and cultural differences as motivations for
research specifically focused on China. They also outline the differences in supply chain
in China and that in western countries. Similarly, Sahay and Mohan (2003) and Sahay et
al. (2006) outline supply chain characteristics in India. Jayaram and Avittathur (2012)
outline the challenges that western companies may face in operating under supply chain
structures prevalent in India. They also motivate the need for research specifically
focused on these countries.
Our research has some support from accounting and finance literature. Literature in these
areas have extensively documented the effect of various events on company as well as
competitor stock performance. Some of these events include new major orders (Galy &
Germain, 2007), large dividend announcements (Laux, Starks, & Yoon, 1998),
bankruptcy announcements (Helwege & Zhang, 2013), litigation (Hadlock & Sonti,
2012), acquisitions (Stillman, 1983), leveraged buyouts (Chevalier, 1995), new product
introductions (Chen, et al., 2002), stock repurchases (Hertzel, 1991), and international
cross-listings (Melvin & Valero-Tonone, 2003).
Research in international management is rich in identifying the correlation between
national culture and business practices. Many of these studies use the quantitative
measures of national culture developed by Hofstede. The dimensions developed by
Hofstede (2013) are derived using a factor analysis of a large scale data from 72
countries. The five dimensions thus developed measure the similarities and differences
between national cultures. Subsequent research has reaffirmed the validity of these
measures (Merritt, 2000). Other measures of national culture were developed by GLOBE
project (Javidan and House, 2001), Trompenaars and Hampden-Turner (1998), and
Schwartz (1994). However, despite limitations, Hofstede’s measures are widely accepted
to be valid for business applications (Magnusson et al., 2008). See Wiengarten et al.
(2011) for a description of other measures and applicability of Hofstede’s measures.

178
Studies have shown that national culture impacts business decisions. For example,
decisions in Western companies are sometimes focused on short-term returns, while in
many Asian companies decisions are motivated by long term effects. Other important
differences include short-term employment and individual responsibility and decision-
making in American companies. Many Asian companies have lifetime employment,
consensual decision-making, and collective responsibility (de Koster and Shinohara,
2006). Literature on national culture demonstrates difference between countries and offer
explanations to account for difference in business strategies, such as international
expansion, low cost versus differentiation, compensation schemes, and choice of
financial structure (Pagell et al., 2005). Dunning and Pearce (1982) and Porter (1990)
argue that home country of the company and physical location of facilities and personnel
affect business decisions. So as to understand the business impact of national culture,
Katz et al. (1999) and Nakata and Sivakumar (1996) call for studying the association of
national culture and functional decisions such as in the area of operations management.
Roh et al. (2008) attribute cultural orientations for difference in productivity gap between
American and Japanese companies. Studying manufacturing data from six countries,
Naor et al. (2008) conclude that difference in manufacturing performance across
countries could be explained by the organizational culture. Wiengarten et al. (2011) study
the moderating influence of Hofstede’s national cultural dimensions on investment in
manufacturing facilities and quality practices. They found that Individualism moderates
both facilities and quality investment; while Masculinity and Uncertainty Avoidance
moderate only the quality practices. McGinnis and Spillan (2012) attribute culture for
differences in logistics strategies between the US and Guatemala. Other research has
shown the association between national culture and total quality management (Katz et al.
1998), innovation (Panida et al., 2011), supplier selection (Carter et al., 2010), product
characteristics (Desislava, 2010), and product development (Nakata and Sivakumar,
1996). Kaasa and Vadi (2010) conclude that innovativeness is higher in companies
located in countries with high Power Distance, Uncertainty Avoidance, Collectivism, and
low Masculinity.
Cultural orientation is particularly important when making supply chain disruptions
decisions (Dowty and Wallace, 2010). They use cultural biases to characterize
interactions among organizations during humanitarian supply chain disasters. The four
cultural biases identified by Dowty and Wallace (2010) are hierarchist, individualist,
fatalist, and egalitarian. Management effectiveness and interactions between companies
are found to be influenced by these cultural biases. Jia and Rutherford (2010) address the
issue of supply chain relational risk associated with cultural differences between
companies from China and the West. They suggest that companies must adapt according
to local culture to be successful.
Data and Event Study Methodology Applied to Supply Chain Disruptions
Sample Data
The US, India, and Japan are open market and democratic countries and allow freedom of
press and media. Therefore, we expect the media outlets to report on important events

179
including company related news that are of public interest. Our disruptions data is
derived from Dow Jones News Service (US), Wall Street Journal (US), The Economic
Times (India), The Japan Times (Japan), and Nikkei (Japan).
To compile disruptions data, full text articles were searched in The Economic Times for a
10 year period from January 1, 2003 to December 31, 2012. The keywords searched
include supplier breakdown, design issues, production delays, inventory shortfall, poor
planning, inaccurate forecast, strike, transportation delay, accidents, data breach, fire,
earthquake, and ethical complaints. They keywords were selected to cover disruptions in
operations, supply, demand, production, inventory, distribution, or transportation at one
or more stages of a supply chain. We read the complete text of the articles to identify a
supply chain disruption.
Our initial data included a large number of disruption points. In compiling the final data,
we dropped companies that are not publically traded. We also removed the disruption
data if the company did not have stock information surrounding the date of disruption.
The resulting data is 313 (the US), 301 (India), and 216 (Japan). Stock market data is
obtained for respective countries through Yahoo finance and CRSP database.
Event Study Methodology
Standard event study methodology is applied on disruptions data to estimate its financial
impact on stockholder wealth. The methodology is extensively used in finance and
accounting applications. The method is designed to investigate the impact of an event on
metrics. In our application, the event is announcement of a supply chain disruption while
the abnormal stock returns are used as the metric to assess the impact of the event. Event
study methodology is one of the most frequently used tools in the financial research area
and has been traditionally effective in estimating stock price reaction to events such as
the announcements of earnings, dividends, or mergers. The content in this section has
been adapted from Kumar, Liu, and Scutella (2015). In a common application, standard
event study methodology is designed to examine the stock returns for a set of companies
experiencing a similar event (e.g., a supply chain disruption in our case). The event may
occur at different point in time for a set of companies. However, having a large number
of data points would statistically eliminate the effect of factors other than the disruptions
on stock outcomes. The stock returns are statistically tested for any abnormal or
unexpected returns.
The purpose of most event studies applied in finance and accounting is to assess the stock
reactions from a value-relevant event announcement. Supply chain disruptions are value-
relevant events that could affect the operations and thus the profit potential of a company.
Moreover, efficient market theory suggests that stock markets are efficient and reflect all
value relevant information. At any instant, stock price of a company is affected by the
company specific as well as environmental (business) factors. Stock price also reflect
expectations about future earning prospects of a firm. Therefore, information about a
value relevant event such as a supply chain disruption is expected to affect stock returns
of a company.

180
In analyzing disruptions, from 10 days prior and post disruption announcement, the actual
daily stock returns are compared with expected returns. “Conceptually, event study helps
differentiate between the stock returns that would have been expected if the supply chain
disruption would not have happened (normal returns) and the returns that were observed
(abnormal returns)” (Kumar, Liu, Scutella, 2015). Event study methodology is made
rigorous and relevant by calculating expected returns using historical data while adjusting
for market wide influence and trends. For more details on event studies refer Dodd and
Warner (1983), Cowan (1992).
The announcement/publication day of a disruption is considered the event day (t=0). To
cover for possibilities of insider information we analyze data and abnormal returns from
5 days prior to announcement date. Overall, an 11-day window is considered. For
robustness of results both mean and market models are considered. See Brown and
Warner (1985) for details of the models. The parameters needed to estimate the abnormal
returns were calculated using past 255 trading days (about one year) stock price. The
estimation period is (–300, –46). We follow Dodd and Warner (1983) and use standard
event-study methodology.
In market model an estimation period starting from -300 to -46 prior days to disruption
announcement is used.
where N is the number of disruption points in the sample, jtR is the return on stock j for
day t, mtR is the return on market proxy m for day t, jtu is the random error for stock j for
day t and is normally distributed with 0 = u E jt ][ , j is the estimated intercept term for
stock j, and j is the estimated risk coefficient for stock j. The market model is estimated
using the equally-weighted market returns from SP500, SENSEX, and NIKKEI.
Hendricks and Singhal (2003) use an estimation window of 200 days. Our longer
estimation window of 255 days (-300 to -46) is expected to yield more robust parameter
estimates.
We calculate the abnormal returns for each day in the test period. The market model
abnormal returns (AR) for stock j for day t is defined as
The mean model abnormal returns for stock j for day t is defined as
For both models, 0 = AR E j , i.e., no abnormal return is expected in an efficient market
in equilibrium. If 0 AR E j , i.e., abnormal returns are observed, we infer that
disruptions cause a change in shareholder wealth. The cumulative abnormal returns for
stock j (CAR) over the event window is .i
Tk
jkj ARCAR
1
We follow Patell (1976) to test
the statistical significance of abnormal returns, which are based on standardized normal
distribution. The standardized abnormal returns (SAR) for stock j in day t, is calculated as
,- ..., ,- = t N; ..., 1, =j ,u + R + R jtmtjjjt 46300
,TTT= t ; N ..., 1, =j ,R + - R = AR mtjjjtjt 211 ,...1,
,R - R = AR jjtjt where R j is stock j’s mean return for the estimation period.

181
.S
AR = SAR
t j ,
t j ,
t j , The abnormal return is divided by the standard error from the market
model estimation for stock j. The average standardized abnormal return (ASAR) for day t
is . SAR N
1 = ASAR t j ,
N
1 =j
t Finally for each day, the Z-statistic is calculated as
. ASAR N = Z tt The limiting distribution of Z t is the unit normal, under the null
hypothesis that the mean normalized, standardized abnormal return equals zero. Over the
testing period, which begins with 𝑇1 and ends with 𝑇2 , the cumulative normalized,
average standardized abnormal return (CASAR) is 1
1
12
1
,
,
2
1
21
TT
SAR
NCASAR
T
Tt
N
j
tj
TT.
Then, the Z-statistic is ,CASAR N = Z T ,TT ,T 2121 and has a unit normal limiting
distribution under the null hypothesis that the cumulative normalized, average
standardized prediction error over the period from T 1 through T 2 equals zero. For
robustness we also perform a non-parametric sign test to make inference about the sign
(positive or negative) of abnormal returns in the estimation period.
Empirical Results
We now present the empirical findings of event study methodology applied to the supply
chain disruption data from the US, India, and Japan. Since Hendricks and Singhal (2003)
focused on the data from the US, we refrain from providing extensive results from the US
market but instead use the US stock impact results to contrast the India and Japan results.
As indicated earlier, our study builds on seminal paper by Hendricks and Singhal (2003)
and enriches the literature by focused on multiple countries, competitors, and market
cycles. Some of the results presented here appeared in Filbeck, Kumar, Liu, Zhao (2015),
Kumar, Liu, and Scutella (2015), and Filbeck, Kumar, Zhao (2014). Some other results
are new to the literature.
Table 1 reports event study results for disruptions in Indian companies. The three panels
in the table outline the CAR around, prior, and post disruption announcement day. The
results are obtained using a market model. It is clear that most significant returns are
observed prior or around the announcement day. No significant returns are seen in the
post disruption announcement windows. This may indicate a possibility of prevalence of
insider trading. In an 11-day window of (-5,+5) Indian companies could experience a
statistically significant average stock decline of -2.88%. The sign test support the results
and indicate that statistically higher number of companies face stock decline (negative
stock returns) following a disruption. A mean model for event studies show a similar
significance in the results.
Table 1: Market Model Event Study Results: Cumulative Abnormal Returns for
Disruptions in Indian Companies.
Mean Statistics Sign Statistics

182
Windows
Mean
Abnormal
Returns (%)
Patell Z
Statistics
Positive:
Negative
Returns
Generalized
Sign Z Test
Panel A: CAR around the disruption announcement date
(-1,+1)
-1.17% -2.509**
118:167 -1.696*
(-2,+2)
-1.47% -2.465**
122:163 -1.221
(-3,+3)
-2.25% -4.038***
106:179 -3.121***
(-4,+4)
-2.78% -4.407***
119:166 -1.577$
(-5,+5)
-2.88% -3.993***
112:174 -2.459**
Panel B: CAR pre disruption announcement date
(-5,0)
-2.24% -4.982***
103:182 -3.477***
(-4,0)
-2.37% -5.589***
106:179 -3.121***
(-3,0)
-2.11% -5.652***
99:186 -3.952***
(-2,0)
-1.62% -4.185***
112:172 -2.357**
(-1,0)
-1.24% -4.008***
114:170 -2.119*
Panel C: CAR post disruption announcement date
(0,+1)
-0.51% -0.594
120:164 -1.406$
(0,+2)
-0.43% -0.244
125:159 -0.811
(0,+3)
-0.72% -0.778
129:155 -0.335
(0,+4)
-0.99% -1.296$
119:165 -1.525$
(0,+5) -1.23% -1.310$ 123:162 -1.102
Number of disruptions=301. $, *, **, and *** represent the significance at 0.10, 0.05,
0.01, 0.001 levels, respectively.
Table 2 reports the event study results for Japanese companies. Similar to companies in
India, Japanese stock markets show decline in the windows prior to the disruption
announcement day. However, we also observe declines in the post disruptions window.
Insider trading may be prevalent but not to the extent of Indian markets. Overall, in a 11-
day window Japanese companies register a statistically significant stock decline of -
0.61%. The stock decline is smaller than the Indian market. When compared to Indian
companies, Japanese companies fare better in stock decline following a disruption. Mean
model when applied to Japanese companies support our results.
Table 2: Market Model Event Study Results: Cumulative Abnormal Returns for
Disruptions in Japanese Companies.
Mean Statistics Sign Statistics
Windows
Mean
Abnormal
Returns (%)
Patell Z
Statistics
Positive:
Negative
Returns
Generalized
Sign Z Test
Panel A: CAR around the disruption announcement date
(-1,+1)
-0.43% -2.862**
95:121 -1.094
(-2,+2)
-0.67% -3.813***
94:122 -1.23
(-3,+3)
-0.65% -3.918***
102:114 -0.14
(-4,+4)
-0.25% -3.118***
109:107 0.813
(-5,+5)
-0.61% -3.467***
97:119 -0.821

183
Panel B: CAR pre disruption announcement date
(-5,0)
-0.46% -3.389***
103:112 0.061
(-4,0)
-0.29% -2.938**
115:100> 1.700*
(-3,0)
-0.43% -3.271***
113:102) 1.427$
(-2,0)
-0.47% -3.316***
100:115 -0.349
(-1,0)
-0.21% -2.261*
108:107 0.744
Panel C: CAR post disruption announcement date
(0,+1)
-0.22% -2.433**
96:120 -0.958
(0,+2)
-0.20% -2.579**
97:119 -0.821
(0,+3)
-0.23% -2.753**
102:114 -0.14
(0,+4)
0.04% -1.999*
107:109 0.541
(0,+5) -0.15% -1.994* 101:115 -0.276
We now present the results for the data from the US. Table 3 reports the event study
results for US companies in a short format. Unlike India and Japan, we did not observe
any significant stock decline in the pre announcement period. We observe that the US
companies suffer a stock decline of -1.13% in an 11-day window covering pre and post
announcement day. The stock decline is higher than Japan but lesser than that for India.
A t-test for difference in stock decline shows a statistically more negative decline for
India when compared to the US. Although qualitatively the decline for the US is higher
than that for Japan, the difference in not statistically significant.
Table 3: Market Model Event Study Results: Cumulative Abnormal Returns for
Disruptions in the US Companies.
Mean Statistics Sign Statistics
Window
s
Number of
valid
disruptions
Mean
Abnormal
Return
(%)
Patell Z
Statistics
Positive:
Negative
Returns
Generalize
d Sign Z
Test
(-5,+5) 310
-1.13 -2.922**
130:180 -2.280*
(-1,0) 310 -0.79 -
3.167*** 131:179 -2.167*
$, *, **, and *** represent the significance at 0.10, 0.05, 0.01, 0.001 levels, respectively.
We now present results for competitors of companies announcing disruptions. The results
presented in Table 4 show that along with companies announcing disruptions,
competitors also register stock declines. Perhaps, with the interconnectedness of business
and supply chains, companies in the same industry share consequences of disruptions.
The table shows that competitors on an average register a stock decline of -1.38% when a
competitor in the same industrial segment announces a disruption. The results are
obtained using the dat and companies in the US.
Table 4: Event study results for competitors in the event sample surrounding the
announcement date in the US.
Event window

184
Variable (-5, -2) (-1, 0) (1, 5) (-5, +5)
Panel A. Cumulative abnormal returns for whole event
sample
Whole event sample
CARs Mean (%) -0.38 -0.90 -0.10 -1.38
CARs Median (%) -0.32 -0.40 -0.32 -0.95
t-stat on Mean (-2.02**) (-4.84***) -0.42 (-3.65***)
Wilcoxon signed-rank
test Z-stat (-31.55***) (-33.95***) (-30.59) (-33.55***)
$, *, **, and *** represent the significance at 0.10, 0.05, 0.01, 0.001 levels, respectively.
Finally, we present results for Bear and Bull market. Using the US data we divide the
disruption announcement based on the prevalent market cycle. The underlying idea is that
market movements and investor response to supply chain disruptions may depend on the
market cycle. Table 5 present the findings. We find that investors react negatively to
disruption announcements but only in Bear markets. In Bull market the stock impact from
disruptions announcements is insignificant.
Table 5: Event Study Results for Event Sample surrounding Disruptions Announcements
Considering the Market Cycle.
Whole Sample
(n=408) Bear Market (n=83) Bull Market (n=325)
Interval CAR Z-stat CAR Z-stat CAR Z-stat
(-5, -2) -0.31 -1.36 -1.18 -1.44 -0.09 -0.44
(-1, 0) -0.31 -1.70* -1.14 -1.68* -0.10 -0.65
(1, 1) 0.01 0.13 -0.19 -0.82 0.07 0.63
(-1, 1) -0.30 -1.43 -1.33 -1.73* -0.03 -0.18
(2, 5) -0.39 -2.11** -1.99 -4.27*** 0.02 0.12
(-5, 5) -0.99 -2.61*** -4.48 -3.28*** -0.09 -0.30
***indicates significant at 1% level; **indicates significant at 5% level; *indicates
significant at 10% level.
Conclusions
In this paper we studied supply chain disruptions and their financial impact on
stockholder wealth. Data from three countries was analyzed. Our findings suggest that
companies in all three countries suffer stock decline in the event of a disruption. The
decline is significantly higher for India when compared to Japan and the US. There is no
significant difference in stock outcome for the US and Japan. Companies in India and
Japan register decline prior to the public announcement of disruptions, indicating a
possibility of insider trading. Strong trade and stock market regulations may factor in the
US market as companies do not register a stock decline prior to the announcement date.

185
We also show that competitors of disruptions announcing companies suffer a negative
stock impact following the disruptions. This indicates that companies in same industrial
sector share fortunes when a disruption affect one of them. We also found that the
markets react negatively to disruptions only in Bear market cycle. Investor sentiments
and market direction affect stock impact from supply chain disruptions
Reference
Brown, S. J. and Warner, J. B., (1985). Using Daily Stock Returns: The Case of Event
Studies, Journal of Financial Economics, 14, 3–31.
Carter, J.R., Maltz, A., Maltz, E., Goh, M. and Yan, T. (2010). Impact of Culture on
Supplier Selection Decision Making, The International Journal of Logistics
Management, 21, (3), 353-374.
Chen, H., Frank, M. and Wu. O. (2005), “The JIT revolution: What actually happened in
the inventories of American companies between 1981 and 2000?” Management Science,
Vol. 51 No. 7, pp. 1015-1031.
Chen, T., Liao, H., Kuo, H., and Hsieh, Y. (2013). “Suppliers’ and Customers’
Information Asymmetry and Corporate Bond Yield Spreads,” Journal of Banking &
Finance, Vol. 37 No. 8, pp. 3181–3191.
Chevalier, J. A., (1995). “Capital Structure and Product-market Competition: Empirical
Evidence from the Supermarket Industry.” American Economic Review, Vol. 85 No. 3,
pp. 415-435.
Chopra, S. and Meindl, P. (2012). Supply Chain Management, Prentice Hall, Upper
Saddle River NJ.
Cowan, A.R. (1992), “A Nonparametric Event Study Tests,” Review of Quantitative
Finance and Accounting, Vol. 2, No. 4, pp. 343-358.
Craighead, C.W., Blackhurst, J., Rungtusanatham, J.M. and Handfield, R.B. (2007), “The
Severity of Supply Chain Disruptions: Design Characteristics and Mitigation
Capabilities,” Decision Sciences, Vol. 38 No. 1, pp. 131-156.
de Koster, M.B.M. and Shinohara, M. (2006). Supply-Chain Culture Clashes in Europe,
Pitfalls in Japanese Service Operations, Supply Chain Forum: International Journal, 7,
(1), 60-68.
Desislava, B. (2010) "Cross-cultural differences in evaluating product characteristics:
motion pictures", Management Research Review, 33, (5), 423 – 436.
Dodd, P. and Warner, J. (1983), “On corporate governance,” Journal of Financial
Economics, Vol. 11 No. 1, pp. 401-438.

186
Dowty, R.A. and Wallace, W.A. (2010). Implications of Organizational Culture for
Supply Chain Disruptions and Restoration, International Journal of Production
Economics, 126, 57-65.
Dunning, J. and Pearce, R. (1982). The World’s Largest Enterprise, Grower, London.
Ellis, S.C., Shockley, J. and Henry, R.M. (2011), “Making Sense of Supply Disruptions
Risk Research: A Conceptual Framework Grounded in Enactment Theory,” Journal of
Supply Chain Management, Vol. 47 No. 2, pp. 65-96.
Filbeck, G., Gorman, R., Greenlee, T., and Speh, T. (2005), “The stock market price
reaction to supply chain management advertisements and company value,” Journal of
Supply Chain Management, Vol. 26 No. 4, pp. 199-216.
Filbeck, M.G., Kumar, S., Liu, J. and Zhao, X. (2015), “Shareholder Wealth and
Automobile Industry Supply Chain Disruptions,” Working paper, Valparaiso University.
Filbeck, M.G., Kumar, S. and Zhao, X. (2014), “Effect of Supply Chain Disruptions on
Competitor’s Shareholder Wealth,” Journal of Business and Economic Perspectives, Vol.
41 No. 2, pp. 24-66.
Fullerton, R. R., McWatters, C. S. and Fawson, C. (2003), “An examination of the
relationship between JIT and financial performance,” Journal of Operations
Management, Vol. 21 No. 4, pp. 383-404.
Galy, N. and Germain. L. (2007), “Product Market Competition and Share Value: the
Airbus-Boeing Duopoly.” Working paper, Toulouse Business School.
Hadlock, C. J., and Sonti, R. (2012), “Financial Strength and Product Market
Competition: Evidence from Asbestos Litigation.” Journal of Financial and Quantitative
Analysis, Vol. 47 No. 1, pp. 179-211.
Hofstede, G. (2013). National Culture Dimentions, Available at http://geert-
hofstede.com/national-culture.html, , Accessed July 10, 2013.
Helwege, J., and Zhang, G. (2013), “Financial Firm Bankruptcy and Contagion.”
Working paper University of South Carolina, Available at
http://papers.ssrn.com/sol3/papers.cfm?abstract_id=2136246.
Hendricks, K.B. and Singhal, V.R. (2003), “The Effect of Supply Chain Glitches on
Shareholder Value,” Journal of Operations Management, Vol. 21, No. 5, pp. 501-522.
Hendricks, K.B. and Singhal, V.R. (2005a), “An empirical analysis of the effect of supply
chain disruptions on long-run stock price performance and equity risk of the firm,”
Production and Operations Management, Vol. 14 No.1, pp. 35-52.

187
Hendricks, K.B. and Singhal, V.R. (2005b), “Association between supply chain glitches
and operating performance,” Management Science, Vol. 51 No. 5, pp. 695-711.
Hertzel, M. G. (1991). “The Effects of Stock Repurchases on Rival Firms.” Journal of
Finance, Vol. 46 No. 2, pp. 707-716.
Jayaram, J. and Avittathur, B. (2012). “Insights into India,” Supply Chain Management
Review, July/August, pp. 34-41.
Javidan, M. and House, R. (2001). Cultural Acumen for the Global Manager: Lessons
from Project GLOBE, Organizational Dynamics, 29, (4), 289-305.
Jia. F. and Rutherford, C. (2010). Mitigation of Supply Chain Relational Risk Caused by
Cultural Differences between China and the West, The International Journal of Logistics
Management, 21, (2), 251-270.
Kaasa, A. and Vadi, M. (2010). How Does Culture Contribute to Innovation? Evidence
from European Countries, Economics of Innovation and New Technology, 19, (7), 583-
604.
Katz, J., Werner, S. and Brouthers, L. (1999). Does Willing Mean the Same Thing
Around the World? National Ideology and the Performance of Global Competitors,
Journal of Business Research, 44, (2), 117-126.
Katz, J., Krumwiede, D. and Czege, M. (1998). Total Quality Management in the Global
Marketplace: The Impact of National Culture on TQM Implementation, International
Journal of Management, 15, (3), 349-56.
Kumar, S., Liu, J. and Caliskan, O.D. (2015). “The interaction of culture and supply
chain disruptions management,” Forthcoming in Journal of Applied Business and
Economics.
Kumar, S., Liu, J., and Scutella, J. (2015). Stockholder Wealth and Supply Chain
Disruptions in Indian Companies, International Journal of Physical Distribution &
Logistics Management, Vol. 45, No. (9/10), pp. 938-958.
Laux, P. A., Starks, L. T., and Yoon., P. S. (1998), “The Relative Importance of
Competition and Contagion in Intra-industry Information Transfers: An Investigation of
Dividend Announcements.” Financial Management, Vol. 27 No. 3, pp. 5-16.
Magnusson, P., Wilson, R.T., Zdravkovic, S., Zhou, J.X. and Westjohn, S.A. (2008).
Breaking Through the Cultural Clutter: A Comparative Assessment of Multiple Cultural
and Institutional Frameworks, International Marketing Review, 25, (2), 183-201.

188
McGinnis, M.A. and Spillan, J.E. (2012). An Empirical Study Comparing Guatemalan
and United States Logistics Strategies, The International Journal of Logistics
Management, 23, (1), 77-95.
Melvin, M., and Valero-Tonone, M. (2003), “The Effects of International Cross-listing
on Rival Firms.” Working Paper, Arizona State University.
Merritt, A. (2000). Culture in the Cockpit: Do Hofstede Dimensions Replicate?, Journal
of Cross Cultural Psychology, 33, (3), 283-301.
Nakata, C. and Sivakumar, K. (1996). National Culture and New Product Development:
An Integrative Review, The Journal of Marketing, 60, (1), 61-72.
Naor, M., Goldstein, S.M., Linderman, K.W. and Schroeder, R.G. (2008). The Role of
Culture as Driver of Quality Management and Performance: Infrastructure Versus Core
Quality Practices, Decision Sciences, 39, (4), 671-702.
Metzer, J. T., (2001), Supply Chain Management. Sage: Thousand Oak, California.
Patell, J. M. (1976), “Corporate forecasts of earnings per share and stock price behavior:
Empirical tests,” Journal of Accounting Research, Vol. 14 No. 2, pp. 246–276.
Porter, M. (1990). The Competitive Advantage of Nations, The Free Press, New York,
NY.
Pagell, M., Katz, J.P. and Sheu, C. (2005). The Importance of National Culture in
Operations Management Research, International Journal of Operations & Production
Management, 25, (3/4), 371-394.
Panida, R., Ramzi, A. and Clive, S. (2011) "The effects of cultural factors on innovation
in a Thai SME", Management Research Review, 34, (12), 1264-1279.
Roumiantsev, S. and Netessine, S. (2007), “Should inventory policy be lean or
responsive? Evidence for U.S. public companies,” Working Paper, The Wharton School,
University of Pennsylvania.
Sahay, B.S., Cavale, V. and Mohan, R. (2006), “The “Indian” Supply Chain
Architecture,” Supply Chain Management: An International Journal, Vol. 8, No. 2,
pp.93-106.
Sahay, B.S., Gupta, J.N.D, and Mohan, R. (2006), “Managing Supply Chains for
Competitiveness: The Indian Scenario,” Supply Chain Management: An International
Journal, Vol. 11, No. 1, pp.15-24.

189
Sahay, B.S. and Mohan, R. (2003), “Supply Chain Management Practices in Indian
Industry,” International Journal of Physical Distribution & Logistics Management, Vol.
33, No. 7, pp. 582-606.
Schmitt, W., and Raman, A., (2012) “When Supply-chain Disruptions Matter. Working
paper 13-006, Harvard Business School.
Schwartz, S.H. (1994). Beyond Individualism–Collectivism: New cultural dimensions of
values, In U. Kim, H.C. Triandis, C. Kagitcibasi, S-C. Choi, & G. Yoon (Eds.),
Individualism and collectivism: Theory, method and applications, (85–119). Sage,
London.
Stillman, R., (1983) “Examining Antitrust Policy Towards Horizontal Mergers,” Journal
of Financial Economics, Vol. 11 No. 1-4, pp. 225-240.
Thomas, J. K. and Zhang, H. (2002), “Inventory changes and future returns,” Review of
Accounting Studies, Vol. 7 No. 1, pp. 163–187.
Trompenaars, F. and Hampden-Turner, C. (1998). Riding the Wave of Culture:
Understanding Diversity in Global Business, McGraw Hill, New York, NY.
Wiengarten, F., Fynes, B., Pagell, M. and Burca, S.D. (2011). Exploring the Impact of
National Culture on Investments in Manufacturing Practices and Performance,
International Journal of Operations & Production Management, 31, (5), 554-578.
Zhao, X., Flynn, B.B. and Roth, A. (2006), “Decision Sciences Research in China: A
Critical Review and Research Agenda Foundations and Overview,” Decision Sciences,
Vol. 37, No. 4, pp. 451-496.
Zhao, X., Flynn, B.B. and Roth, A. (2007), “Decision Sciences Research in China:
Current Status, Opportunities, and Propositions for Research in Supply Chain
Management, Logistics, and Quality Management,” Decision Sciences, Vol. 38, No. 1,
pp. 39-80.