conference evaluation report - william james · pdf fileconference evaluation report office of...
TRANSCRIPT
CENTER FOR MULTICULTURAL & GLOBAL MENTAL HEALTH
Conference on Multicultural and Global Mental Health
June 26, 2015
Conference Evaluation Report
Office of Research
Sonia Suri, Ph.D.
Senior Research and Evaluation Specialist
1 Wells Avenue
Newton, MA
This report is a result of the collaborative efforts of the following individuals:
Graduate Students Hillary Scudder, Suji Choe, and Courtney Langenbahn;
and Research Assistants Jordan Lawson and Anneke Johnson.
2
TABLE OF CONTENTS
INTRODUCTION ------------------------------------------------------------------------------------------------------------------ 3
Inaugural Conference------------------------------------------------------------------------------------------------- 3
Center for Multicultural & Global Mental Health-------------------------------------------------------------- 3
SECTION I: CONFERENCE PARTICIPANTS’ PROFILE-------------------------------------------------------------------- 4-7
Participants’ Occupation--------------------------------------------------------------------------------------------- 6
Participants’ Education ---------------------------------------------------------------------------------------------- 7
Publicity Sources ------------------------------------------------------------------------------------------------------- 7
SECTION II: OVERALL CONFERENCE EXPERIENCE ------------------------------------------------------------------------ 8
Overall Conference Experience ------------------------------------------------------------------------------------- 8
SECTION III: PRESENTATION PANELS------------------------------------------------------------------------------------ 9-12
Presentation by Dr. Jill Bloom -------------------------------------------------------------------------------------- 9
Presentation by Dr. Janet E. Helms ------------------------------------------------------------------------------ 10
Presentation by Dr. Richard Mollica -----------------------------------------------------------------------------10
Presentation by Dr. Kelly O’Donnell and Dr. Michèle Lewis O’Donnell ----------------------------------11
Presentation by Dr. David Henderson ---------------------------------------------------------------------------11
Panel Presentation—Moderated by Dr. Martin La Roche-------------------------------------------------- 12
SECTION IV: PLANS TO CHANGE CLINICAL PRACTICE ----------------------------------------------------------------- 13
SECTION V: RECOMMENDATION RATINGS------------------------------------------------------------------------------- 14
SECTION VI: CONCLUSION --------------------------------------------------------------------------------------------------- 15

3
INTRODUCTION
Inaugural Conference
CENTER FOR MULTICULTURAL & GLOBAL MENTAL HEALTH
Friday, June 26, 2016
William James College
Crossing Borders:
Meeting the Needs of Immigrant and Refugee Communities from Across the Globe
The Conference on Multicultural & Global Mental Health, sponsored by the Center for Multicultural &
Global Mental Health at William James College, aims to create a forum for information sharing and
knowledge exchange; increase public awareness of mental health disparities among historically
marginalized groups and underserved communities in the U.S.; promote multicultural and global
perspectives in clinical training, psychosocial research and treatment interventions; and build cultural
bridges among academics, mental health professionals, public health advocates and service providers
with an interest in addressing the diverse mental health needs of immigrant and refugee communities
locally and around the globe.
Center for Multicultural & Global Mental Health
The Center for Multicultural & Global Mental Health (CMGMH) at William James College aims to be a
preeminent academic, clinical training, and research center in promoting social justice and addressing
mental health disparities among disenfranchised populations in the U.S. and abroad. CMGMH is
comprised of academic programs at William James College that focus primarily on historically
marginalized groups and underserved communities. These programs include the Latino Mental Health
Program, the African and Caribbean Mental Health Program, and the Global Mental Health Program.

4
Mission:
To train, educate, mentor, and prepare a cadre of professionals to address mental health disparities, and
serve culturally diverse individuals and communities locally and across the globe.
Vision:
To inspire and empower students, clinicians, educators, and other providers as agents of social justice
with a passion for and commitment to serving historically marginalized populations.
Goals & Objectives:
• Enrich the knowledge of students, mental health professionals, educators, community leaders,
and service providers on topics germane to multicultural and global perspectives on
psychosocial well-being.
• Provide clinical field training and learning opportunities to students to serve historically
marginalized individuals, families, and communities.
• Support the rigorous application of science to examine mental health disparities and the impact
of multicultural and global factors on health and psychosocial functioning through evidence-
based research and practices.
• Offer transformative immersion experiences that will expose, inform, and deepen students’
knowledge, cultural awareness and sensitivity, and cultural fluency.
• Mentor, nurture, and support dynamic and collegial advocates of underserved communities in
order to empower leaders of social change and agents of social justice.
Program Components:
Concentrations offered through the Center for Multicultural & Global Mental Health incorporate the
following five components:
1. Academics – Courses on disparities in mental health (e.g., impact of poverty, class, culture,
and migration on psychosocial well-being), assessments and clinical interventions with
culturally diverse groups, introduction to global mental health, and trauma and recovery
among immigrant and refugee populations.
2. Field Training Experiences – Clinical field training opportunities in schools, clinics, hospitals,
and community health centers that serve immigrant, refugee, and historically disadvantaged
populations.

5
3. Research – Capstones and Doctoral Projects with a focus on ethnic minority, immigrant, and
culturally diverse groups with a local and/or global perspective. Engagement in faculty
research initiatives on multicultural and global mental health.
4. Cultural Immersion & Community Service – Participation in global mental health initiatives
in low-resource countries and active engagement in community service at the local level.
5. Professional Development Activities – Didactic seminars, speakers’ series, workshops,
colloquia, and conferences focusing on culturally diverse populations, immigrants and
refugees.
Contact Information:
For more information about the Center for Multicultural & Global Mental Health and its activities, please
contact:
• Dr. Jill Bloom, Co-Director, CMGMH; Core Faculty, Clinical Psychology Program
• Dr. Gemima St. Louis, Co-Director, CMGMH; Director, PATHWAYS Program
• Center for Multicultural & Global Mental Health (CMGMH)

6
Section I: Conference Participants’ Profile
This section contains information on participants’ occupation, education, and how they learned about
the conference. All the responses are depicted in pie charts that report the percentages for each section
of the pie. The data presented in this Conference Evaluation Report are based on the number of
attendees who completed and returned the evaluation form at the end of the conference.
1. Participants’ Occupations
Figure 1 below illustrates a simple view of conference attendees’ occupational responsibilities. The
participants represented a diverse group of professionals. Psychologists (23%), social workers (18%), and
students (20%) accounted for the majority of the participants. The “Other” category (8%) includes
occupations such as adjustment counselor, guidance counselor, school principal, program coordinator,
and registered nurse.
23%
18%
8%
20%
31%
Figure 1:
Participants' Occupations (N = 40)
Psychologist
Social Worker
Therapist
Student
Other

7
21%
46%
33%Bachelors
Masters
Doctorate
2. Participants’ Educational Background Figure 2 represents the breakdown of the participants’ education. All participants had a minimum of a
Bachelor’s degree. The majority of participants had a Master’s degree (46%) as Clinicians and Social
Workers. Thirty-three percent had Doctoral degrees, which included Ph.D. and Psy.D.
Figure 2:
Participants' Education (N = 40)
3. Publicity Sources
The majority of the participants stated that they heard about the conference via emails (41%) and the
William James College (WJC) Website (23%). Some participants learned about the event from their
colleagues (15%), and a few participants heard about it through their supervisors (6%). Several
participants learned about the event from the WJC Catalogue and local agencies and organizations.
41%
23%
15%
6%15%
Figure 3:
How did you hear about today's conference? (N = 39)
WJC Website
Colleague
Supervisor
Other
8
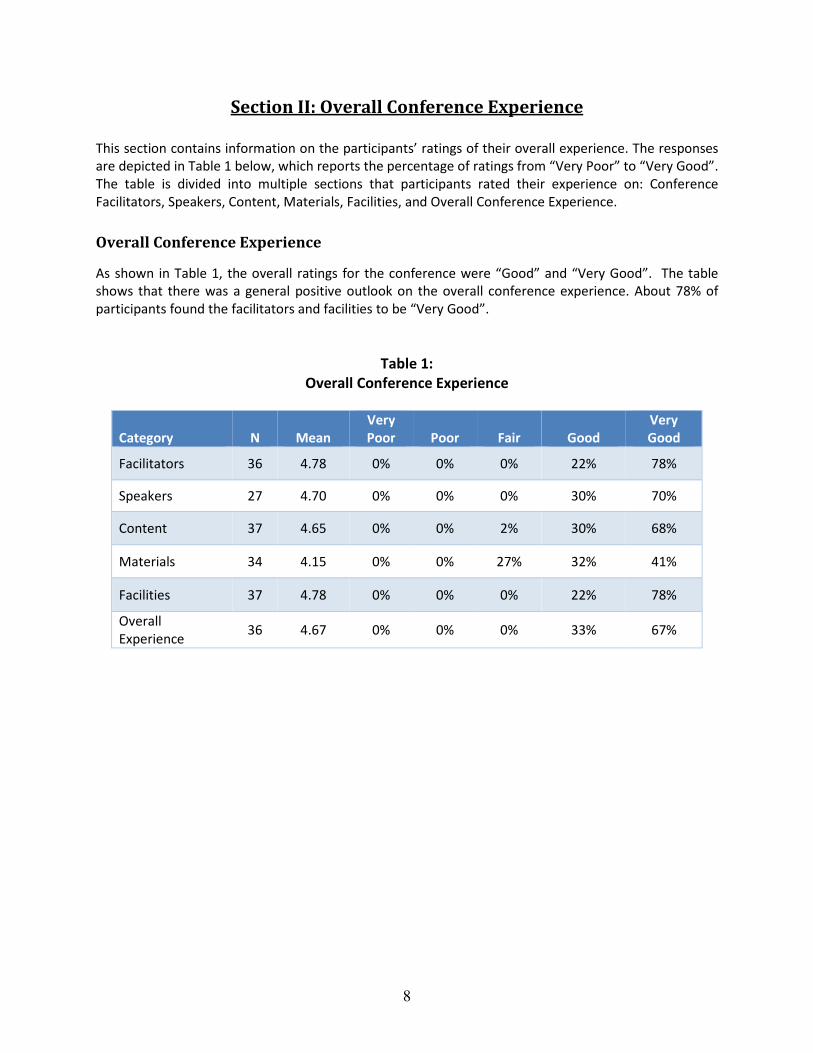
Section II: Overall Conference Experience
This section contains information on the participants’ ratings of their overall experience. The responses
are depicted in Table 1 below, which reports the percentage of ratings from “Very Poor” to “Very Good”.
The table is divided into multiple sections that participants rated their experience on: Conference
Facilitators, Speakers, Content, Materials, Facilities, and Overall Conference Experience.
Overall Conference Experience
As shown in Table 1, the overall ratings for the conference were “Good” and “Very Good”. The table
shows that there was a general positive outlook on the overall conference experience. About 78% of
participants found the facilitators and facilities to be “Very Good”.
Table 1:
Overall Conference Experience
Category N Mean
Very
Poor Poor Fair Good
Very
Good
Facilitators 36 4.78 0% 0% 0% 22% 78%
Speakers 27 4.70 0% 0% 0% 30% 70%
Content 37 4.65 0% 0% 2% 30% 68%
Materials 34 4.15 0% 0% 27% 32% 41%
Facilities 37 4.78 0% 0% 0% 22% 78%
Overall
Experience 36 4.67 0% 0% 0% 33% 67%

9
Section III: Presentation Panels
This section contains information on the participants’ ratings of the presentations. All responses are
depicted in tables that report the percentage of ratings from “Strongly Disagree” to “Strongly Agree”.
Each table is divided into multiple sections that participants rated their experience on: Description of the
Topic Was Accurate, Learning Objectives Were Met, Presenter Was Knowledgeable, Material Was
Presented in a Clear Fashion, Format Was Appropriate for the Audience, and Presentation Was Helpful
for Future Professional Work.
1. Presentation Given by Dr. Jill Bloom: “Addressing Global Mental Health” The presentation by Dr. Jill Bloom received high ratings. The presentation received moderately high
average scores in each specific criterion, averaging an overall average of 4.52 out of 5.0. Approximately
90% of participants approved of the format of the presentation. The detailed scores for each category
can be seen in Table2 below.
Table 2:
Presentation by Dr. Jill Bloom
Category N Mean
Strongly
Disagree Disagree Neutral Agree
Strongly
Agree
Accurate 38 4.50 0% 0% 8% 34% 58%
Learning 37 4.51 0% 0% 8% 32% 60%
Knowledgeable 38 4.68 0% 0% 3% 26% 71%
Material 39 4.56 0% 0% 5% 33% 62%
Format 39 4.49 0% 0% 10% 31% 59%
Helpful 38 4.37 0% 2% 11% 34% 53%

10
2. Presentation Given by Dr. Janet E. Helms: “Challenging Myths When Working in Other
Cultures”
Table 3 represents the overall ratings of the presentation by Dr. Janet E. Helms. Dr. Helms received high
ratings from the participants, receiving a grand mean of 4.76 out of 5, which was the highest rating
received among all the presentations. Ninety percent of the participants strongly viewed Dr. Helms as
being very knowledgeable.
Table 3: Presentation by Dr. Janet E. Helms
Category N Mean
Strongly
Disagree Disagree Neutral Agree
Strongly
Agree
Accurate 39 4.69 0% 3% 0% 23% 74%
Learning 39 4.72 0% 3% 3% 15% 79%
Knowledgeable 39 4.87 0% 0% 2% 8% 90%
Material 39 4.85 0% 0% 0% 15% 85%
Format 39 4.79 0% 0% 3% 15% 82%
Helpful 38 4.63 0% 0% 5% 26% 69%
3. Presentation Given by Dr. Richard Mollica: “The Capacity to Heal: Working with Refugees”
Table 4: Presentation by Dr. Richard Mollica
The presentation by Dr. Richard Mollica received high ratings. Eighty percent of participants agreed that
Dr. Mollica was accurate and knowledgeable in his area of study and presentation. Additionally, 95% of
participants believed that their learning objects were met by this presentation.
Category N Mean
Strongly
Disagree Disagree Neutral Agree
Strongly
Agree
Accurate 39 4.79 0% 0% 0% 20% 80%
Learning 38 4.68 0% 0% 5% 21% 74%
Knowledgeable 39 4.79 0% 0% 0% 20% 80%
Material 39 4.69 0% 0% 2% 26% 72%
Format 38 4.63 0% 0% 5% 26% 69%
Helpful 39 4.56 0% 0% 5% 33% 62%

11
4. Presentation Given by Dr. Kelly O’Donnell and Dr. Michèle Lewis O’Donnell: “Global Mental
Health: Tracking and Trekking across Sectors”
The presentation delivered by Drs. O’Donnell received an overall rating of 4.17 out of 5.0. As shown on
Table 5 below, most participants (94%) perceived Drs. O’Donnell to be knowledgeable. Eighty-seven
percent of the participants indicated that the description of the session was accurate and close to three-
quarters (74%) found the presentation format to be very helpful.
Table 5:
Presentation by Dr. Kelly O'Donnell and Dr. Michèle Lewis O’Donnell
Category N Mean
Strongly
Disagree Disagree Neutral Agree
Strongly
Agree
Accurate 37 4.35 0% 5% 8% 32% 55%
Learning 36 4.11 0% 11% 19% 17% 53%
Knowledgeable 35 4.63 0% 0% 6% 26% 68%
Material 36 4.06 3% 6% 22% 22% 47%
Format 36 4.08 3% 6% 17% 31% 43%
Helpful 36 3.78 3% 14% 25% 19% 39%
5. Presentation Given by Dr. David Henderson: “From Liberia to Lowell: Addressing Unmet
Mental Health Needs”
As illustrated below in Table 6, the presentation given by Dr. David Henderson received high ratings. Dr.
Henderson received an overall average of 4.69 out of 5.0, and about 70% of the participants strongly
agreed that the material and the format of the presentation were helpful. Moreover, 100% of the
participants agreed that Dr. Henderson was accurate and knowledgeable in his area of study.
Table 6: Presentation by Dr. David Henderson
Category N Mean
Strongly
Disagree Disagree Neutral Agree
Strongly
Agree
Accurate 39 4.79 0% 0% 0% 33% 67%
Learning 38 4.68 0% 0% 4% 29% 67%
Knowledgeable 39 4.79 0% 0% 0% 30% 70%
Material 39 4.69 0% 0% 4% 25% 71%
Format 38 4.63 0% 0% 4% 25% 71%
Helpful 39 4.56 0% 4% 0% 33% 63%
12
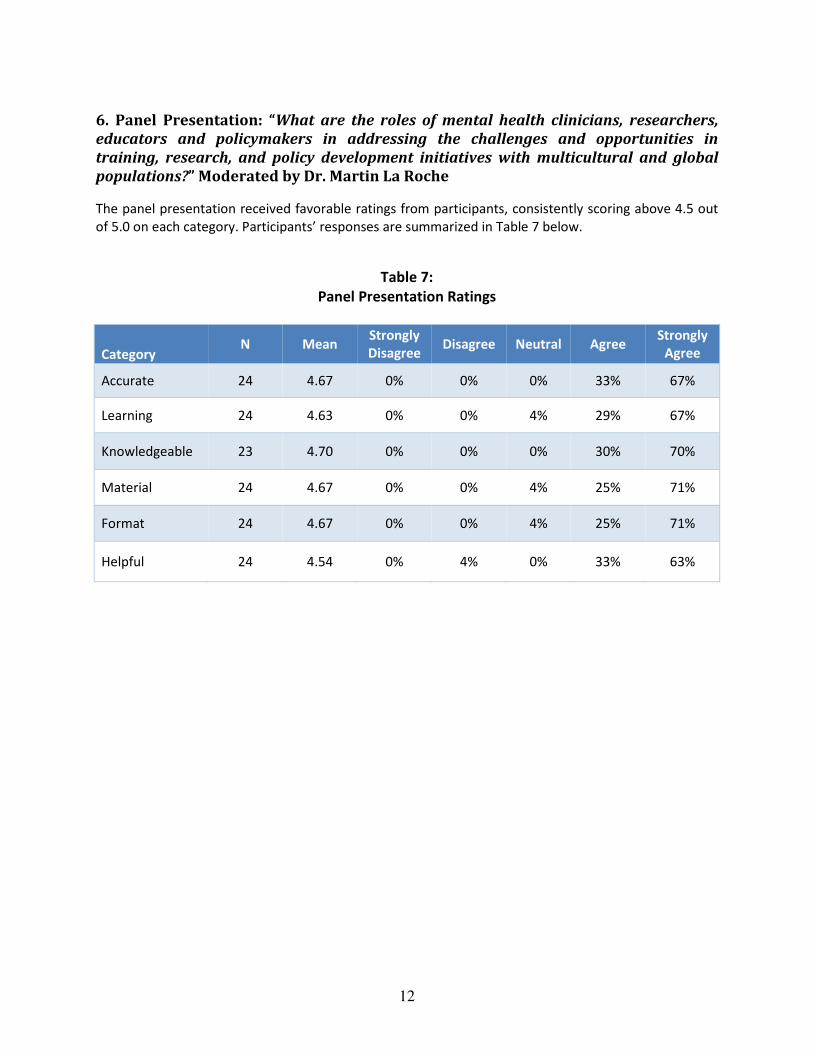
6. Panel Presentation: “What are the roles of mental health clinicians, researchers,
educators and policymakers in addressing the challenges and opportunities in
training, research, and policy development initiatives with multicultural and global
populations?” Moderated by Dr. Martin La Roche
The panel presentation received favorable ratings from participants, consistently scoring above 4.5 out
of 5.0 on each category. Participants’ responses are summarized in Table 7 below.
Table 7:
Panel Presentation Ratings
Category N Mean
Strongly
Disagree Disagree Neutral Agree
Strongly
Agree
Accurate 24 4.67 0% 0% 0% 33% 67%
Learning 24 4.63 0% 0% 4% 29% 67%
Knowledgeable 23 4.70 0% 0% 0% 30% 70%
Material 24 4.67 0% 0% 4% 25% 71%
Format 24 4.67 0% 0% 4% 25% 71%
Helpful 24 4.54 0% 4% 0% 33% 63%
13
54%34%
12%
Yes
No
Maybe
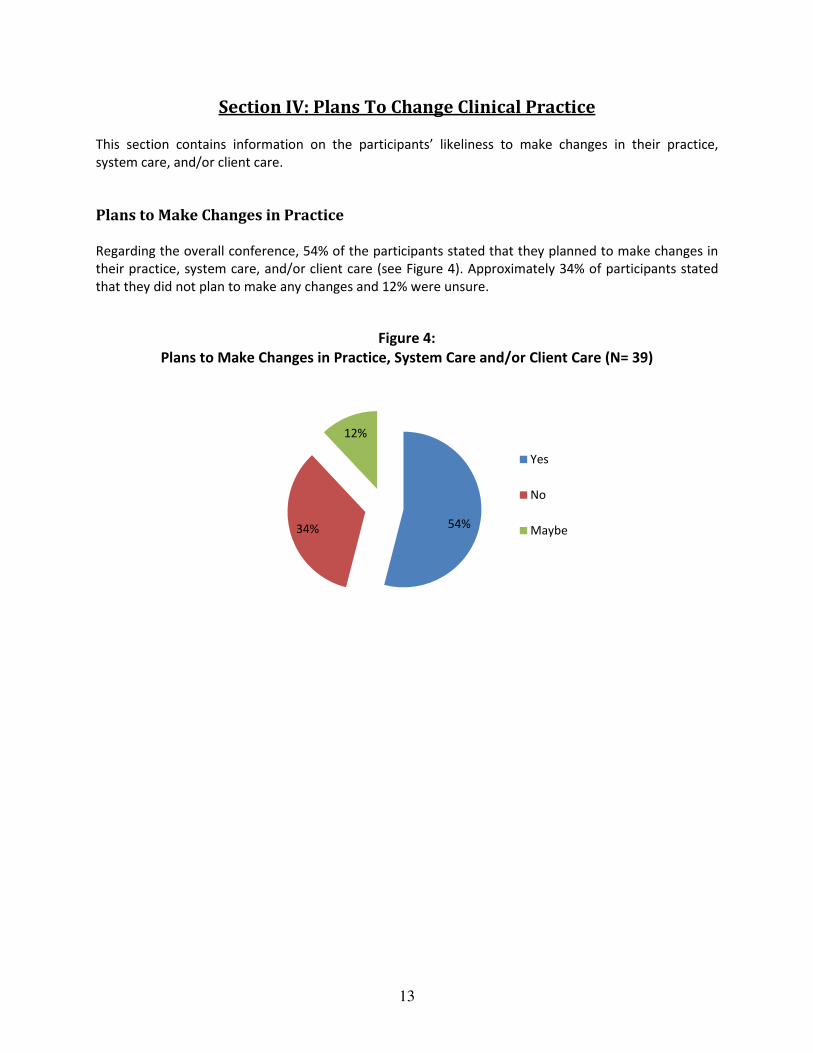
Section IV: Plans To Change Clinical Practice
This section contains information on the participants’ likeliness to make changes in their practice,
system care, and/or client care.
Plans to Make Changes in Practice
Regarding the overall conference, 54% of the participants stated that they planned to make changes in
their practice, system care, and/or client care (see Figure 4). Approximately 34% of participants stated
that they did not plan to make any changes and 12% were unsure.
Figure 4:
Plans to Make Changes in Practice, System Care and/or Client Care (N= 39)

14
0% 10% 20% 30% 40% 50% 60% 70% 80%
One
Two
Three
Four
Five
Six
Seven
Eight
Nine
Ten
Section V: Recommendation Ratings
This section contains information on the participants’ likeliness to recommend this conference to others.
The responses are depicted in a bar graph that reports the percentages for likeliness to recommend.
Likeliness of Recommending the Conference When asked how likely they were to recommend this conference to others, on a scale from one, “Least
Likely”, to ten, “Most Likely”, the most common response was a rating of ten with 18 responses (46%).
The second most common response was eight with seven responses (19%). A rating of nine had six
responses (16%). This indicates that the majority of the participants were inclined to recommend the
conference to others. There were only eight participants who rated their likeliness to recommend as a
rating of seven or less. A breakdown of all ratings can be seen in Figure 5 below.
Figure 5: Likeliness of Recommending the Conference to Others (N =39)
15
Section VI: Conclusion
All evaluated aspects of the conference were rated as highly successful by the attendees. The
participants were a highly educated group of individuals representing diverse professions. All
participants gave positive ratings of their overall conferences experience. Facilitators, speakers, content,
materials, and facilities were also rated highly. The vast majority of participants found the presentations
to be well-put-together and informative. Finally, the majority of participants said that they were likely to
make changes in their professional practice.