conexus110220 - retirement income review submissions · and hennington and langton (2016). to...
TRANSCRIPT
Page 1 of 57
Submission
This represents The Conexus Institute’s submission to the Retirement Income Review.
The Conexus Institute is a not-for-profit entity which strives to improve the retirement
outcomes of Australians through a focus on impactful research.
This submission was prepared by David Bell, Executive Director of The Conexus Institute. We note with
appreciation the voluntary contributions made to this submission by Luke Zhou and Annabelle Tian,
who are both tutored retirement system courses taught at UNSW.
Introduction The Conexus Institute seeks to support the objective of the Retirement Income Review, which is to
develop a fact base of the current retirement income system. A well-compiled fact base has the
opportunity to better inform future policy research.
This submission consists of a summary paper which is supported by ten individual essays. Essays are
designed to provide an informative insight into a topic we believe relevant. Throughout this
submission we are cognisant of the four principles of adequacy (A), equity (E), sustainability (S), and
cohesion (C).
The breadth of the retirement system makes it impossible to consider every issue. Nearly as
important as what we have addressed is what we have not addressed and why:
We do not address the appropriate level of the Superannuation Guarantee. This is an
extremely complex area. To address this question properly requires some important inputs:
(1) an objective (preferably quantifiable) for the retirement system; (2) an assessment of the
integrated role of all components of the retirement system (for instance age pension, taxes
and incentives, the role of housing, and other payments such as rent assistance); and (3) a
strong understanding of consumption needs of Australians through their working lives (to
ensure we are not undermining their working life living standards).
We also placed aside taxation of superannuation. It is often highlighted that Australia runs a
T-T-E style of tax system (or T-t-E, as described by Holzmann and Genser (2019)) while many
other countries run an E-E-T structure. The appropriate taxation system goes well beyond a
global comparison as it needs to consider the structure of the savings pillar and the social
security pillar. There are specialists who can provide better insight than us on this issue.

Page 2 of 57
Essays titles
Essay Essay title Principles addressed
1 Best practice in retirement modelling and assessment A, S, C
2 Illustrating the dangers of deterministic modelling… the case for reduced consumption to achieve a reasonable degree of certainty
A, S, C
3 Consumption in retirement A, S
4 An integrated retirement system focused on household outcomes? A, E, S, C
5 The need for a retirement system objective A, E, S, C
6 The incoherent role of housing in the retirement income system A, E, S, C
7 Does the term ‘retirement income’ mislead? A, E, C
8 ‘Lottery effects’ in the superannuation system A, E, S
9 Exploring market failure in retirement solutions A, E, S, C
10 The critical shortage of quality financial advice and guidance A, E, S
Reflections We share three reflections with the Review:
1. Throughout the production of this submission we found ourselves constantly returning to
the foundational framework of the lifecycle model of consumption, savings and investment.
Starting with this framework, and overlaying it with the idiosyncrasies of Australia’s
retirement system provides great insight into the current design, challenges and potential
improvements to Australia’s retirement system.
2. Australia’s retirement system lacks an objective. Without an objective it is impossible to
optimise outcomes, determine welfare benefits of policy changes, and participants in the
system find it harder to understand their role. The development of a quantifiable objective
for Australia’s retirement system would represent an outstanding achievement.
3. Australia’s retirement system is complex with many components which are intertwined. It is
extremely difficult for consumers to navigate this complexity and have confidence in their
retirement financial position. We believe much more can be done in the area of financial
guidance. This could be achieved without the need for substantial policy change.
We are happy to further discuss our research in these or related areas. We are happy to share our
models.
Sincerely,
David Bell

Page 3 of 57
Essay 1 – Best practice in retirement modelling and assessment
Summary This essay attempts to provide a succinct overview of the retirement outcome challenge,
and how to assess and measure retirement outcomes
The most important concepts covered:
o The need to think and model stochastically (consider the range of outcomes)
o The need to think and model intertemporally (consider outcomes through time
rather than just the average outcome across time)
o Develop a metric based on preferences. Best practice here is the use of utility
functions.
Introduction The lifecycle model of consumption, savings and investment underpins retirement planning,
modelling and assessment. Theoretically straightforward in concept, modelling retirement outcomes
can be highly complex in practice. This creates two challenges:
1. To understand the framework and work out appropriate simplifications so that decisions are
well-considered and outcomes are close to optimal. Oftentimes, simplifying a complex
problem can have a large adverse impact on recommended solutions and associated
outcomes;
2. To determine how best to communicate assessments made in a complex framework,
whether it be communicating with industry or with consumers.
(1) and (2) have an important interaction. There appears a tendency in the superannuation industry
to make simplifying assumptions or develop simple solutions. The cost of any decision to simplify
needs to be explored. Other industries appear to manage these types of trade-offs1.
In this essay we outline the lifecycle model of consumption, savings, and investment, and detail
some important technical areas which are important for the Review to be cognisant of. These
include:
The need to think stochastically
The need to think intertemporally
Integrated decision-making
1 The car industry makes for an interesting comparison. The technologies involved are highly complex – for example, how do you explain a dual clutch or a CVT transmission? But that hasn’t stopped the best technologies being applied. From there the industry has been able to convey key messages: both transmissions are smooth and contribute to good fuel efficiency.

Page 4 of 57
Preferences can also be complex in the respect that there can be multiple components to a
preference and these components can ‘pull’ against each other. It is important to be able to fully
reflect a preference that has multiple components. Further, we seek to be able to quantitatively
measure outcomes relative to preferences. We explore how this can be achieved using techniques
common to academia.
For further references on best practice retirement modelling we recommend Dowd and Blake (2013)
and Hennington and Langton (2016). To understand modelling preferences in more detail we
recommend MDUF (2017).
The lifecycle model of savings, consumption and investment We briefly introduce the theoretical foundation of retirement savings: the lifecycle model of
consumption, savings and investment. The starting point is that people work and consume in the
present, but acknowledge that they would like to consume over their entire lives. In anticipation that
they will not want (not be capable) to work all of their lives, they choose to save a portion out of
present consumption to fund future consumption once retired. Saved funds are invested. Figure 1
provides a basic overview:
Figure 1: Basic lifecycle model. An individual earns constant income (AWOTE) throughout their
unbroken working life. They constantly save (in this case 9.5% of their wage) and then draw down on
these savings in retirement (which begins at 67). The individual is modelled to live for exactly 25
years in retirement. Inflation is assumed to be a constant 2.5%.
In essence Figure 1 reflects the concepts of human capital (the present value of future wages) and
financial capital (current savings). The lifecycle model illustrates how we consume from realised
human capital, and save some, converting it into a pool of financial capital which is drawn down
once we stop working (note that not working results in leisure which has value as well).
A model such as that detailed in Figure 1 would best be enhanced with many additional
considerations to make it more realistic. Of course, each element increases the complexity of the
model. A non-exhaustive list of such considerations includes:

Page 5 of 57
Labour – career path, wage profile of specific industries, retirement intentions, transitioning
to retirement etc.
Savings / consumption – savings vehicle, expenses through different stages of life, buy or
rent considerations etc.
Product choice – super, home, other investments, retirement solutions etc.
Investment decisions – level of risk and underlying asset class selection
Government interventions – taxes applied to different forms of saving and investment,
incentives, social security
Mortality – life expectancy, health status etc.
Household status – single or couple
The need to think stochastically Deterministic modelling means we assume all outcomes are certain. The alternative approach is to
model stochastically, whereby all sources of variability are accounted for. Consider the more
advanced model in Figure 2.
Figure 2: Extended lifecycle model incorporating wage growth (1% real), investment returns (3%
real), taxes (PAYG and contribution tax) and the age pension (means-tested).
Under such a model it appears we have reasonable retirement adequacy (a replacement rate of X%
of consumption in working life). Consider the assumptions underpinning this outcome:
We assume we will earn the same investment returns each year
We will die with certainty at 92, enabling us to fully exhaust our retirement savings
Other assumptions relating to employment, wages etc. which we don’t explore
Each simulation of a stochastic model will produce a unique, but possible outcome. The
consideration of many possible outcomes provides fuller insight into the distribution of possible
outcomes. Four simulations of a model which considers investment returns and mortality outcomes
to be uncertain and variable, are provided in Figure 3.
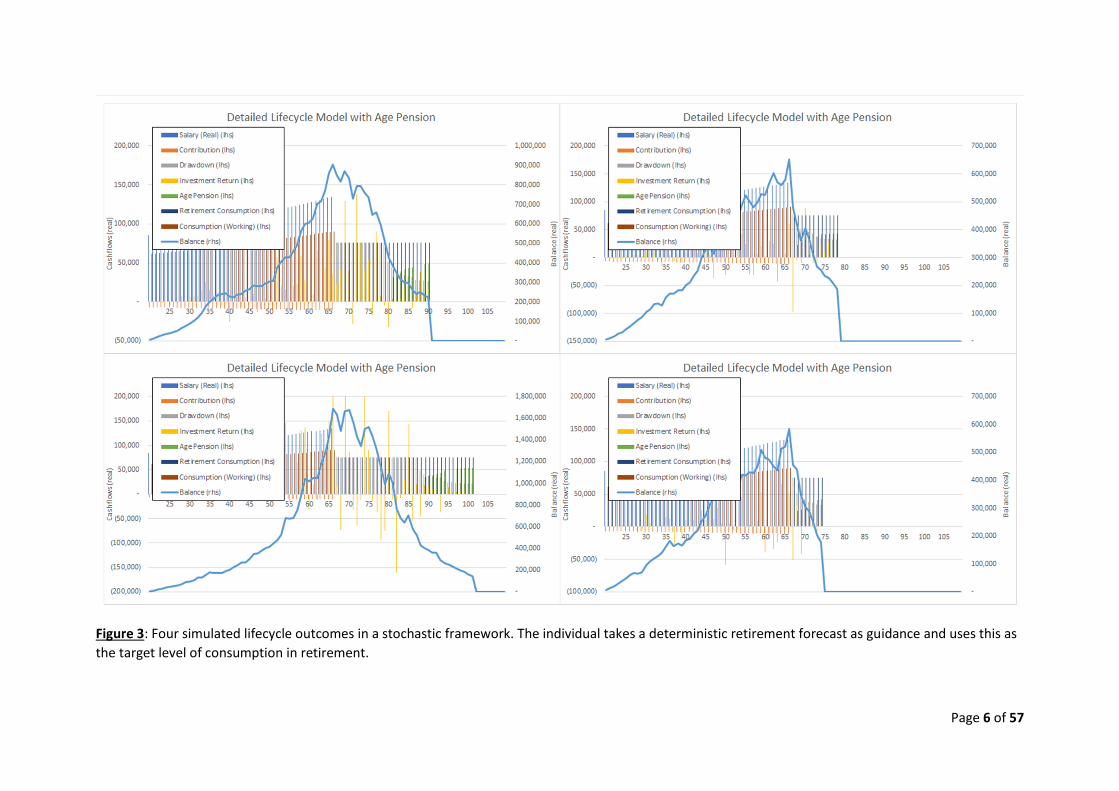
Page 6 of 57
Figure 3: Four simulated lifecycle outcomes in a stochastic framework. The individual takes a deterministic retirement forecast as guidance and uses this as
the target level of consumption in retirement.
Page 7 of 57
What are some of the ramifications of not thinking stochastically? Using retirement projections /
adequacy as a backdrop, there are several important ramifications:
1. A projection established in a deterministic environment is only a median outcome.
Effectively there is a 50% chance of a better retirement outcome and a 50% chance of a
worse retirement outcome.
2. The range of adverse retirement outcomes (those less than the deterministic projection) are
not fully explored. Some possible outcomes may not be acceptable, and this may inform
how the consumption / investment strategy is managed and also policy design.
3. The range of favourable retirement outcomes (those above the deterministic projection) are
not fully explored. Some of these outcomes may create challenges when viewed through the
Review’s principles of equity, sustainability, and cohesion.
Think intertemporally The term ‘intertemporal’ implies across distinct periods of time. To think intertemporally means to
think across multiple periods of time. This creates a range of considerations, including:
1. We would consider the outcome in each period of time rather than the average outcome
across a range of time periods.
2. While we consider the impact of present decisions on future outcomes, we are also
cognisant of the future decisions that will be made.
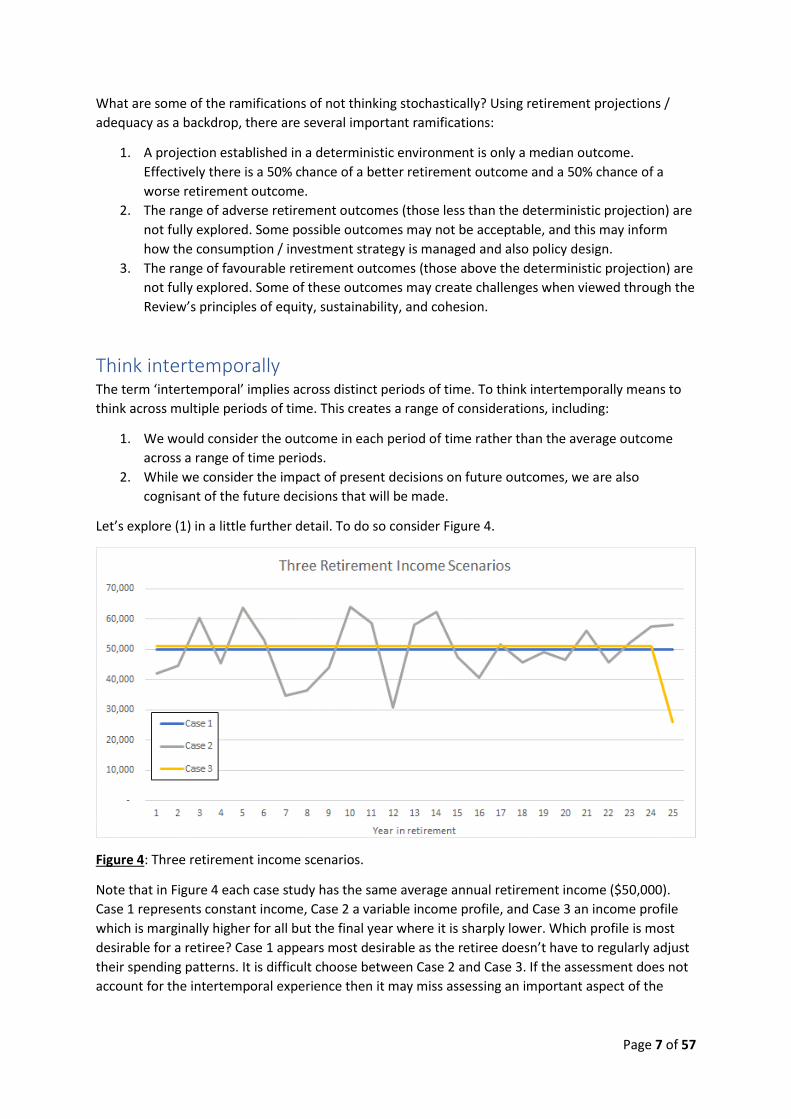
Let’s explore (1) in a little further detail. To do so consider Figure 4.
Figure 4: Three retirement income scenarios.
Note that in Figure 4 each case study has the same average annual retirement income ($50,000).
Case 1 represents constant income, Case 2 a variable income profile, and Case 3 an income profile
which is marginally higher for all but the final year where it is sharply lower. Which profile is most
desirable for a retiree? Case 1 appears most desirable as the retiree doesn’t have to regularly adjust
their spending patterns. It is difficult choose between Case 2 and Case 3. If the assessment does not
account for the intertemporal experience then it may miss assessing an important aspect of the
Page 8 of 57
retirement outcome. Any assessment approach based on an average over time may prove
misleading.
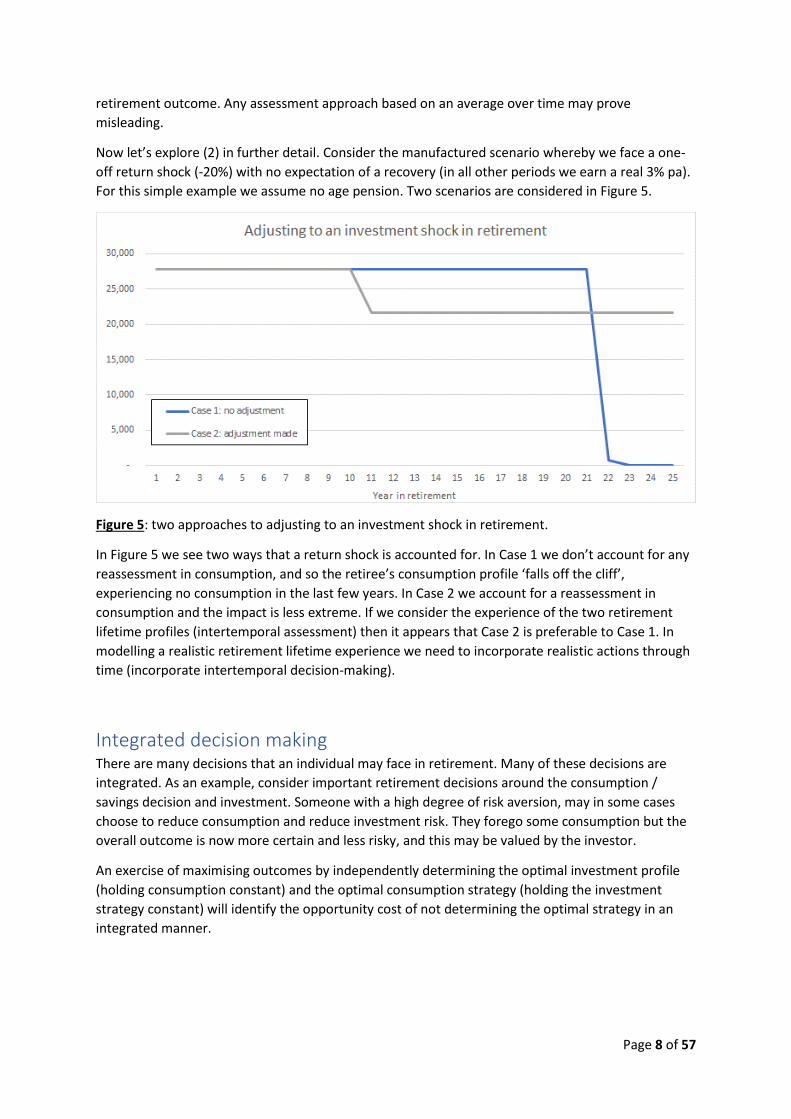
Now let’s explore (2) in further detail. Consider the manufactured scenario whereby we face a one-
off return shock (-20%) with no expectation of a recovery (in all other periods we earn a real 3% pa).
For this simple example we assume no age pension. Two scenarios are considered in Figure 5.
Figure 5: two approaches to adjusting to an investment shock in retirement.
In Figure 5 we see two ways that a return shock is accounted for. In Case 1 we don’t account for any
reassessment in consumption, and so the retiree’s consumption profile ‘falls off the cliff’,
experiencing no consumption in the last few years. In Case 2 we account for a reassessment in
consumption and the impact is less extreme. If we consider the experience of the two retirement
lifetime profiles (intertemporal assessment) then it appears that Case 2 is preferable to Case 1. In
modelling a realistic retirement lifetime experience we need to incorporate realistic actions through
time (incorporate intertemporal decision-making).
Integrated decision making There are many decisions that an individual may face in retirement. Many of these decisions are
integrated. As an example, consider important retirement decisions around the consumption /
savings decision and investment. Someone with a high degree of risk aversion, may in some cases
choose to reduce consumption and reduce investment risk. They forego some consumption but the
overall outcome is now more certain and less risky, and this may be valued by the investor.
An exercise of maximising outcomes by independently determining the optimal investment profile
(holding consumption constant) and the optimal consumption strategy (holding the investment
strategy constant) will identify the opportunity cost of not determining the optimal strategy in an
integrated manner.

Page 9 of 57
Assessing outcomes
Retirement references and retirement objectives are two different things We begin by noting that retirement references are different to retirement objectives, although the
two are often conflated. Consider a retirement reference such as a replacement rate or a
consumption standard. These represent poor objectives on their own. How certain do we need to be
of achieving the reference? Is it achieved throughout the retiree’s lifetime? Are the worse case
scenarios acceptable?
Once we accept that we need to incorporate stochastic and intertemporal considerations when we
model retirement outcomes, how do we best measure retirement outcome adequacy? We require a
metric which can account for the range of through-time outcomes a household may experience in
retirement.
Common metrics used in retirement outcome modelling generally fail to match these requirements,
as summarised in Table 1.
Adequacy measurement
Description Accounts for range of outcomes (i.e. stochastic)?
Accounts for the through-time experience (i.e. intertemporal)?
Replacement rate Average consumption in retirement as a percentage of pre-retirement consumption.
No – just based on median or mean.
No – accounts for average through time.
Shortfall risk The percentage likelihood of exhausting savings in the pursuit of a targeted level of retirement consumption (e.g. an ASFA standard or a replacement rate).
No – considers the likelihood of exhausting funds but doesn’t consider the extent of the shortfall.
No – it doesn’t consider the length of the impaired experience.
Table 1: Overview and assessment of common retirement metrics used to assess adequacy.
Utility functions are best practice The only metric which accounts for the range of outcomes and the through-time experience is a
utility function. Utility functions have been used by academics for hundreds of years and used in the
field of retirement research for over 50 years. A utility function is a mathematical representation of
preferences (in this case retirement preferences). It reflects each individual preference and the
trade-off between these preferences (for instance the trade-off between the preference for higher
consumption versus the preference for greater certainty of consumption).
The first thing a utility function does is to considers the experience of an outcome. A higher
retirement outcome is obviously better, but a lower outcome may be penalised by a larger amount
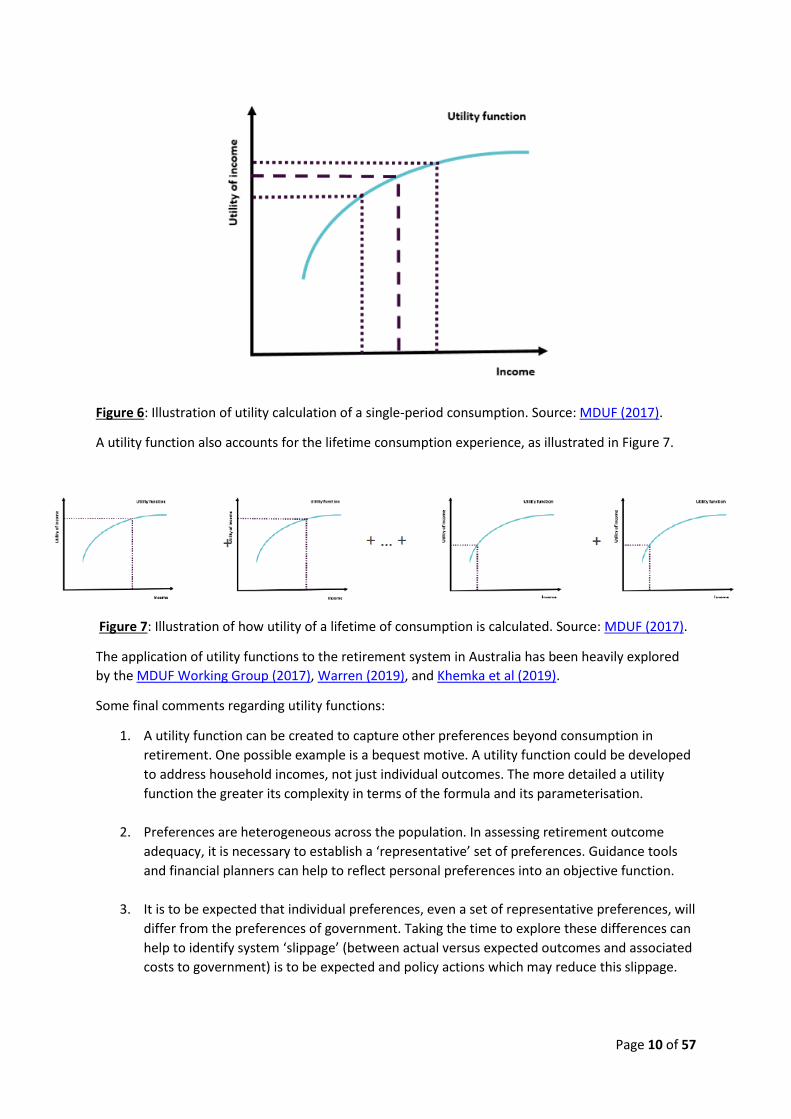
(consider the attainment of luxuries versus the loss of essentials). This is illustrated in Figure 6.
Page 10 of 57
Figure 6: Illustration of utility calculation of a single-period consumption. Source: MDUF (2017).
A utility function also accounts for the lifetime consumption experience, as illustrated in Figure 7.
Figure 7: Illustration of how utility of a lifetime of consumption is calculated. Source: MDUF (2017).
The application of utility functions to the retirement system in Australia has been heavily explored
by the MDUF Working Group (2017), Warren (2019), and Khemka et al (2019).
Some final comments regarding utility functions:
1. A utility function can be created to capture other preferences beyond consumption in
retirement. One possible example is a bequest motive. A utility function could be developed
to address household incomes, not just individual outcomes. The more detailed a utility
function the greater its complexity in terms of the formula and its parameterisation.
2. Preferences are heterogeneous across the population. In assessing retirement outcome
adequacy, it is necessary to establish a ‘representative’ set of preferences. Guidance tools
and financial planners can help to reflect personal preferences into an objective function.
3. It is to be expected that individual preferences, even a set of representative preferences, will
differ from the preferences of government. Taking the time to explore these differences can
help to identify system ‘slippage’ (between actual versus expected outcomes and associated
costs to government) is to be expected and policy actions which may reduce this slippage.

Page 11 of 57
4. While utility functions have great application when it comes to assessing outcomes, they
also help to drive decisions, at the levels of policy, industry and advice / guidance.
Conclusions Best practice assessment of the adequacy, equity, sustainability, and cohesion of Australia’s
retirement system requires the adoption of approaches which account for the range of possible
outcomes (a stochastic approach) and the through-life retirement experience (an intertemporal
approach). It is also important to have clear system objectives / preferences; best practice here
would be to incorporate these objectives / preferences into a utility function.
Any assessment undertaken without incorporating these features may misrepresent the outcomes
of the system, provide a poor assessment of those outcomes, and ultimately mis-inform policy
design.
Page 12 of 57
Essay 2 – Illustrating the dangers of deterministic modelling… the case for
reduced consumption to achieve a reasonable degree of certainty
Summary This paper details a stochastic case study to illustrate the dangers of relying on deterministic
modelling when assessing retirement system adequacy
Maintaining some sort of a consumption buffer to manage risk is rational for individuals and
those providing advice, but will create a greater likelihood of scenarios that frustrate
government (i.e. bequests); this is the frictional cost when individuals are forced to bear
many retirement financial risks
We believe it is important for policymakers to assess the range of outcomes, and target a
degree of certainty for minimum acceptable outcomes
Introduction In Essay 1 we detailed what we consider to be best practice for modelling and assessment of
retirement outcomes. This has importance to the Review, particularly in the area of adequacy. This
essay details a case study whereby we take a deterministic finding and test it in a stochastic
environment.
The purpose of this case study is to highlight the shortcomings of analysis undertaken in a
deterministic environment. A stochastic framework provides far greater insight and provides
policymakers with the platform to be fully accountable for the possible impact of their policies.
It motivates the consideration that, in an environment where investors bear much and many forms
of risk, it may be appropriate and rational to spend cautiously and reserve some funds, relative to
what deterministic models suggest.
Background We use the models developed for Essay 1, both the deterministic and the stochastic models. A short
description of these models:
Both models:
o A single person earns AWOTE through life
o Wage growth is a certain 1% real
o Inflation is a constant 2.5%

Page 13 of 57
o Our individual contributes 9.5% for their working career, which is assumed to be
unbroken
o They retire at the age of 67
o They seek a level of retirement income which is based on guidance they received on
their first day of work, determined in a deterministic framework
o A means-tested age pension is available, the level of which grows with wages
o Superannuation contribution taxes are 15%
o PAYG tax scale is as per 2019 ATO guidelines
o Tax brackets creep at the rate of inflation
In the deterministic setting:
o The individual will live for exactly 25 years in retirement (i.e. die on their 92nd
birthday)
o Investment returns are a constant and certain 3% real
In the stochastic setting:
o The individual faces an uncertain mortality outcome, determined stochastically by
applying ABS life tables
o The individual faces uncertain investment returns. Returns are assumed to be
normally distributed with a real expected return of 3% and volatility of 8%
o The individual draws down their savings at the target rate, accounting for age
pension entitlements. If they exhaust their savings they live solely on the age
pension
o Any account value at death represents a bequest
We acknowledge that this case study could be extended by incorporating minimum drawdown rules.
We briefly consider the impact of this later.
The ‘deterministic’ individual The deterministic outcome is always the same, unless we change underlying assumptions. In Figure 1
we replicate the figure from Essay 1.
Figure 1: Deterministic lifecycle model.
Page 14 of 57
In the deterministic setting, the level of retirement income is a constant $75,729 (today’s dollars),
representing a replacement rate of 83.6%. The individual is assumed to exhaust their retirement
savings instantaneously with their passing.
The ‘stochastic’ individual Each simulated outcome for our individual in the stochastic setting will be unique. We permit
variation in investment returns and mortality outcomes, which creates variation in age pension
entitlements. Four sample simulations are provided in Figure 3 of Essay 1.
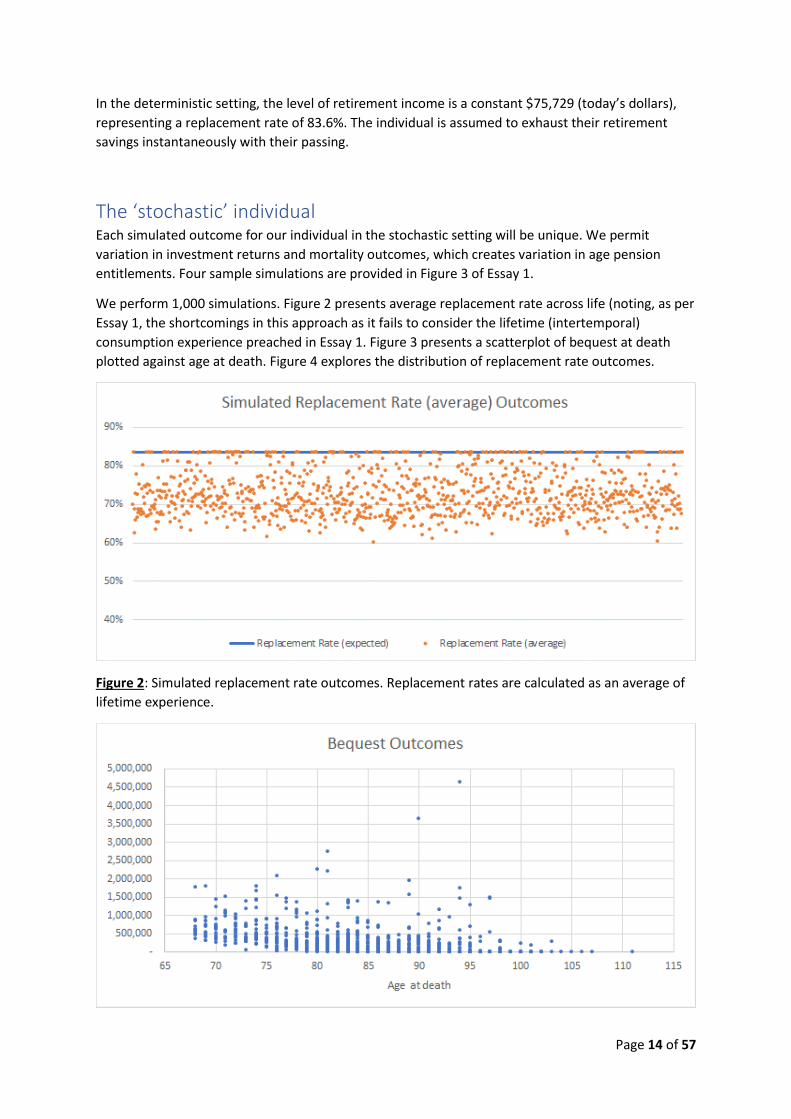
We perform 1,000 simulations. Figure 2 presents average replacement rate across life (noting, as per
Essay 1, the shortcomings in this approach as it fails to consider the lifetime (intertemporal)
consumption experience preached in Essay 1. Figure 3 presents a scatterplot of bequest at death
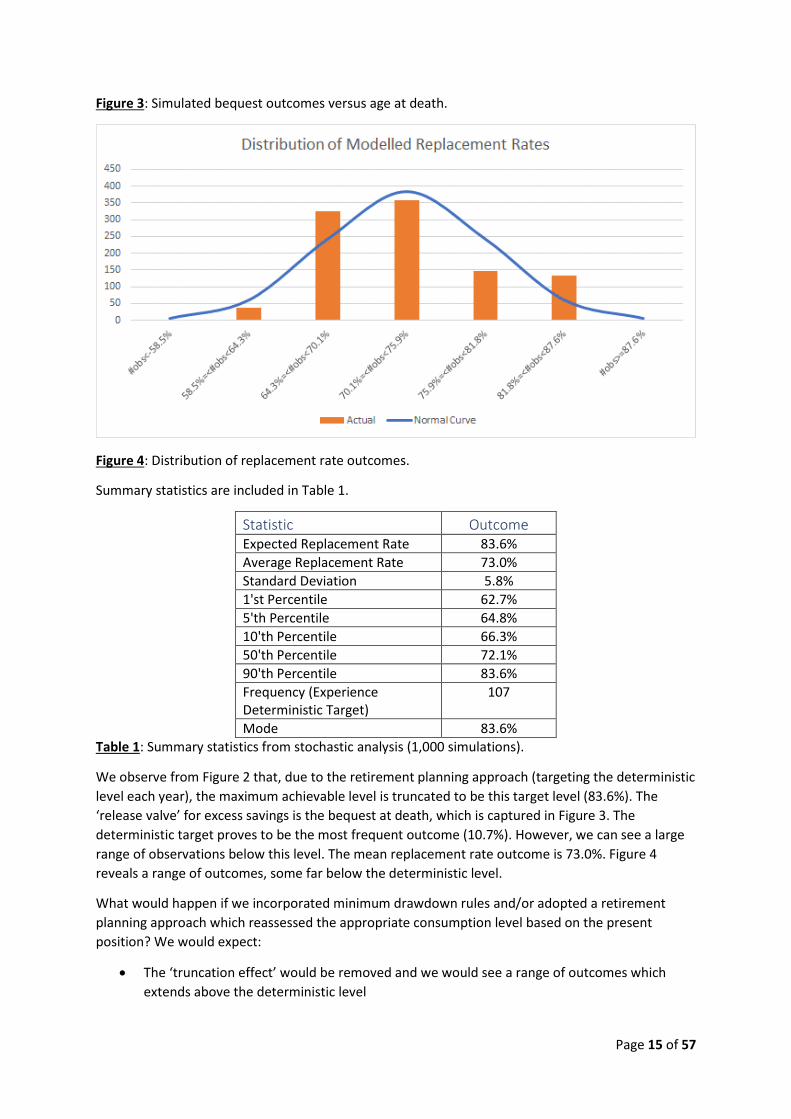
plotted against age at death. Figure 4 explores the distribution of replacement rate outcomes.
Figure 2: Simulated replacement rate outcomes. Replacement rates are calculated as an average of
lifetime experience.
Page 15 of 57
Figure 3: Simulated bequest outcomes versus age at death.
Figure 4: Distribution of replacement rate outcomes.
Summary statistics are included in Table 1.
Statistic Outcome Expected Replacement Rate 83.6%
Average Replacement Rate 73.0%
Standard Deviation 5.8%
1'st Percentile 62.7%
5'th Percentile 64.8%
10'th Percentile 66.3%
50'th Percentile 72.1%
90'th Percentile 83.6%
Frequency (Experience Deterministic Target)
107
Mode 83.6% Table 1: Summary statistics from stochastic analysis (1,000 simulations).
We observe from Figure 2 that, due to the retirement planning approach (targeting the deterministic
level each year), the maximum achievable level is truncated to be this target level (83.6%). The
‘release valve’ for excess savings is the bequest at death, which is captured in Figure 3. The
deterministic target proves to be the most frequent outcome (10.7%). However, we can see a large
range of observations below this level. The mean replacement rate outcome is 73.0%. Figure 4
reveals a range of outcomes, some far below the deterministic level.
What would happen if we incorporated minimum drawdown rules and/or adopted a retirement
planning approach which reassessed the appropriate consumption level based on the present
position? We would expect:
The ‘truncation effect’ would be removed and we would see a range of outcomes which
extends above the deterministic level
Page 16 of 57
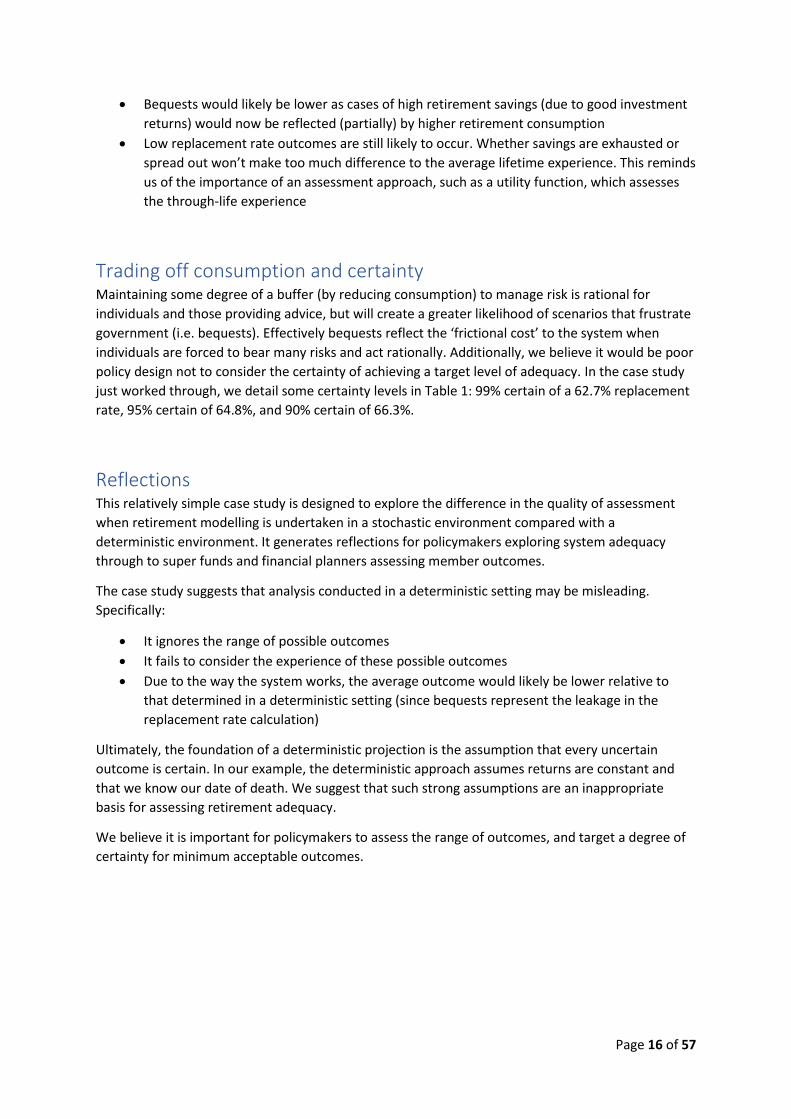
Bequests would likely be lower as cases of high retirement savings (due to good investment
returns) would now be reflected (partially) by higher retirement consumption
Low replacement rate outcomes are still likely to occur. Whether savings are exhausted or
spread out won’t make too much difference to the average lifetime experience. This reminds
us of the importance of an assessment approach, such as a utility function, which assesses
the through-life experience
Trading off consumption and certainty Maintaining some degree of a buffer (by reducing consumption) to manage risk is rational for
individuals and those providing advice, but will create a greater likelihood of scenarios that frustrate
government (i.e. bequests). Effectively bequests reflect the ‘frictional cost’ to the system when
individuals are forced to bear many risks and act rationally. Additionally, we believe it would be poor
policy design not to consider the certainty of achieving a target level of adequacy. In the case study
just worked through, we detail some certainty levels in Table 1: 99% certain of a 62.7% replacement
rate, 95% certain of 64.8%, and 90% certain of 66.3%.
Reflections This relatively simple case study is designed to explore the difference in the quality of assessment
when retirement modelling is undertaken in a stochastic environment compared with a
deterministic environment. It generates reflections for policymakers exploring system adequacy
through to super funds and financial planners assessing member outcomes.
The case study suggests that analysis conducted in a deterministic setting may be misleading.
Specifically:
It ignores the range of possible outcomes
It fails to consider the experience of these possible outcomes
Due to the way the system works, the average outcome would likely be lower relative to
that determined in a deterministic setting (since bequests represent the leakage in the
replacement rate calculation)
Ultimately, the foundation of a deterministic projection is the assumption that every uncertain
outcome is certain. In our example, the deterministic approach assumes returns are constant and
that we know our date of death. We suggest that such strong assumptions are an inappropriate
basis for assessing retirement adequacy.
We believe it is important for policymakers to assess the range of outcomes, and target a degree of
certainty for minimum acceptable outcomes.
Page 17 of 57
Essay 3 – Consumption in retirement
The Conexus Institute would like to acknowledge Luke Zhou and thank him for his
contribution as lead author of this essay. Luke has tutored superannuation-related
subjects at UNSW (where he just completed his Honours degree), and will soon begin
his career at KPMG.
Summary Analysing consumption patterns of retirees is an important part of analysing the adequacy of
the retirement system
Three areas are explored: empirical, theoretical implications, and stated preferences
Theoretical concerns are important to provide a fuller picture which attempts to rationalise
observed behaviour
Consumption in retirement and related questions of adequacy are more complex than a
replacement rate or absolute standard of living measure
The observation that consumption decreases through retirement appears broad-based
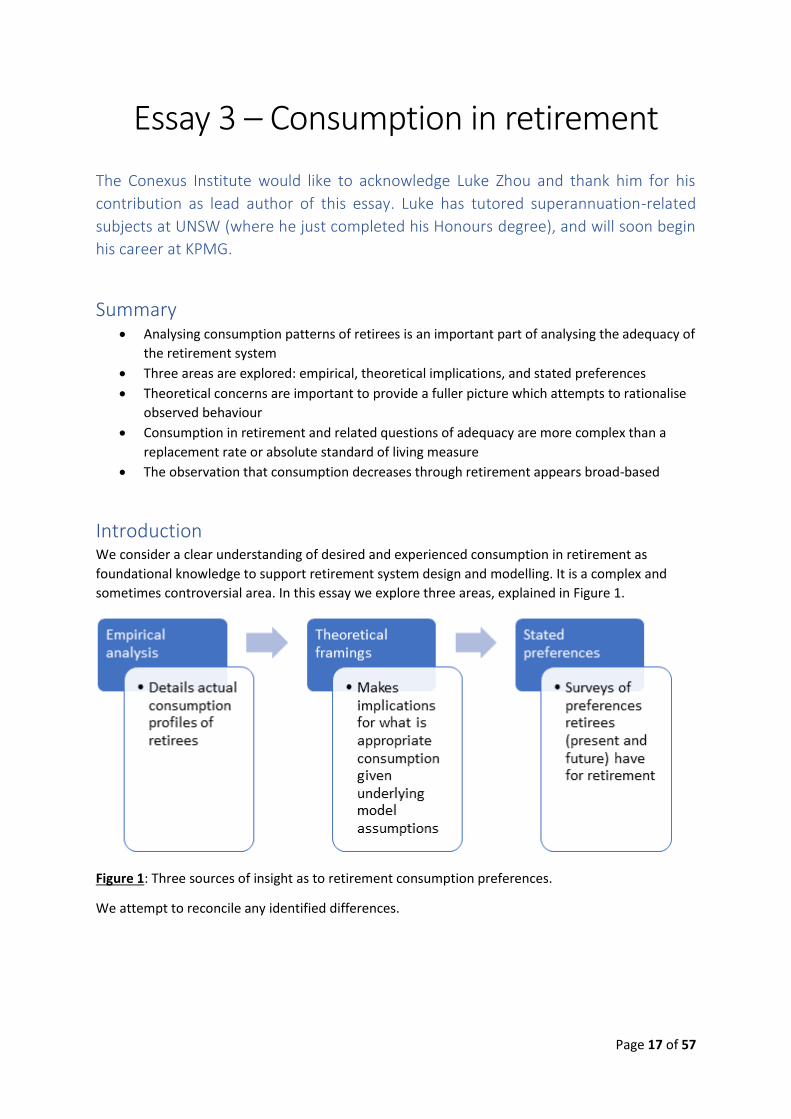
Introduction We consider a clear understanding of desired and experienced consumption in retirement as
foundational knowledge to support retirement system design and modelling. It is a complex and
sometimes controversial area. In this essay we explore three areas, explained in Figure 1.
Figure 1: Three sources of insight as to retirement consumption preferences.
We attempt to reconcile any identified differences.

Page 18 of 57
Empirical analysis - overview of Australian surveys on consumption in
retirement
Evidence in Australia is derived from three main sources, detailed in Table 1.
Household Expenditure Survey (ABS)
Household Income and Labour Dynamics of Australia (HILDA)
Milliman Retirement Expectations and Spending Profile (a, b and c)
Considers most categories of spending, essential and discretionary
Multiple waves of the survey have been run, the two most recent being from 2009-10, and 2015-16
It does not track the same households over time
Only considers essential spending
The survey is run yearly, with the most recent being in 2019 (Wave 18)
It tracks the same households over time, allowing analysis of how households’ consumption change over time
Considers all categories of spending
Considers demographic features such as wealth, geographical location, and age
Conducted in 2017
Table 1: Primary empirical sources of household spending in retirement.
We note that a detailed enumeration of the differences between the HES and HILDA surveys in
relation to consumption and retirement can be found in Grattan (2019).
From the three empirical sources detailed in Table 1 we make the following important observations:
Older retirees spend less than younger retirees
Relatively constant spending on essentials (in real terms)
Health spending moderately increases with retirees’ age
Additionally, we note that:
The ABS survey finds lower discretionary spending for older retirees
The HILDA surveys confirm that retirees’ spending remains relatively constant due to
measuring only essentials, with a small increase for singles over time
The Milliman ESP finds that retirees in all wealth bands save during retirement
The Milliman ESP finds that retirees in urban areas consume more than in rural areas
Many of the findings that we provide can be found in the following references on empirical studies
in retirement: (Daley et al. (2018), Ding (2013) and Minney (2018)). We note that findings in the US
appear similar, (see Hurd and Rohwedder (2011) and Blanchett (2014)). This pattern of reduced
spending through retirement is known amongst academic researchers as the ‘retirement
consumption puzzle’.
There are a range of issues related to empirical data on consumption in retirement. We note two of
these:
So-called ‘cohort effects’, where different generations of retirees have different
consumption patterns, are able to be controlled for. This is done through considering
multiple waves of the HES and HILDA surveys. The HILDA survey is more accurate in this

Page 19 of 57
regard since it tracks the same individuals over time, whereas changes are taken from
population averages in the HES.
Survivorship bias, whereby surveys capture only the (healthier) retirees who are alive
throughout multiple iterations of the survey. These healthier retirees may have very
different consumption patterns to unhealthier retirees who have died early. One hypothesis
is that those who are healthy live longer and consume more (Daley et al. (2018)). Another
hypothesis is that healthier retirees consume less, as they have longer lifetimes and so need
their accumulated assets to last for a longer time. This may also pose a problem with
investigating health costs, as younger retirees who are in poor or declining health are not
captured by the surveys.
Lastly, this section summarises consumption patterns in a descriptive manner. It doesn’t tie this to
potential reasons why retirees have such patterns, which will be examined further in the next
section. We do note that Daley et al. (2018) identify that despite the fall in consumption at and
through retirement, retirees report high levels of happiness.
Theoretical considerations on consumption through the lifetime Theoretically, the foundation of retirement outcome modelling is the lifecycle model of
consumption, savings and investment. The underlying assumption is that people seek to smooth
consumption over their lifecycle. This is reflected as an objective rather than a strict requirement.
The objective is reflected by an objective function (or what is known as a utility function – a
mathematical construct which assess the consumption experience in each period) which is
maximised when consumption is constant through time.
There are a number of assumptions which underlie the use of such functions. Common assumptions
are that retirees are forward-looking, they plan rationally for a high, constant level of consumption
as long as they live (the age of death is uncertain), and they have no bequest motive, which means
that they do not wish to leave an inheritance (Yaari, 1965). This model also assumes that insurance
products are available to hedge the risk of a retiree’s uncertain lifetime. Such products, if priced
efficiently offer higher returns than comparable assets such as bonds due to mortality credits
(Davidoff et al, 2005). Under these assumptions, a retiree will fully annuitise, and therefore consume
a flat amount in retirement throughout their remaining lifetime.
This result, flat consumption, is not always the case, even if we maintain the assumption of
rationality. As we vary our assumptions we observe changes to optimal consumption profiles.
An important case study is to remove the availability of life annuities. The case of no life annuities is
well-researched; we use two papers to illustrate the general finding that it is rational in this
circumstance for consumption to fall through time. Cannon and Tonks (2008) identify that the
existence of a time preference for consumption (people prefer to consume now rather than later,
especially if there is a chance of not living to enjoy future consumption). Milevsky (2011) identifies
that an individual faced with mortality risk (year-to-year mortality rates increase throughout
retirement) is motivated to enjoy more certain consumption early in retirement. An appropriately
designed utility function captures both of these issues.
We now consider the extension that retirees are not necessarily forward-looking. They may set their
present consumption with reference to their past consumption, a phenomenon referred to as habit

Page 20 of 57
formation (first introduced by Constantinides (1990)). Here, investors place higher utility on a
gradually changing consumption pattern over time compared to a consumption pattern with large
fluctuations. Practically, it suggests that people prefer to change their consumption habits gradually
and find large changes difficult to deal with. The academic research shows that in this case some
level of annuitisation is appropriate since it is the financial instrument which can provide consistent
income through life (see Iskhahov (2015) for further insight).
In our final theoretical extension, we consider bequest motives. Evidence of a bequest motive exists
(see, for instance, Lockwood 2014), but the strength of motives is debatable (see Alonso-Garcia
(2017)). A bequest motive reduces rational demand for life annuities, since they provide no bequest.
Where life annuities are unavailable, MDUF (2017) identified a moderate hump-shaped consumption
profile whereby a retiree may initially forego a small amount of consumption in the hope of growing
their overall retirement account (which benefits future consumption and also bequest motivations).
Best practice modelling would be to separate out other planning issues such as liquidity
requirements and reversionary benefits rather than wrap them into a bequest motive; the trade-off
here is model complexity.
In summary, the classic theoretical framework used in the academic literature sheds light on
consumption patterns by linking these to assumptions of retirees’ motives and behaviour. We see
that the assumption of constant consumption through retired life only applies in very restricted
circumstances (no bequest motives and fairly priced annuities). Otherwise a downwards sloping
consumption profile represents a rational decision.
Retirees’ stated preferences with respect to consumption In an experiment conducted in the US, retirees were found to prefer flat real income streams as
opposed to flat nominal income streams (Beshears et al 2014). This is consistent with the empirical
evidence of flat consumption in real terms in earlier years in retirement (Minney 2018).
In contrast, Beshears et al (2014) also found a greater preference for rising real income (50% of
respondents), as opposed to flat real income (32% of respondents). This contradicts the empirical
evidence of consumption in Australian and US surveys. One possible reason for this difference is that
retirees overestimate their consumption needs in old age, possibly because of the lack of long-term-
care insurance to hedge uncertain, large, health expenses.
Beshears et al (2014) found that providing retirees with information about the effects of inflation led
to an increase in the number of retirees wanting a COLA (cost of living adjusted) annuity. Beshears et
al (2014) identify that retirees have preferences for flexibility in consumption throughout time
(retirees prefer large bonus payments at particular points in the year).
A final reflection on Beshears et al (2014) is that it focuses on income preferences in retirement, not
consumption. Constant income in retirement may be a convenient preference, and perhaps one
which defers having to acknowledge a lifestyle which will become less active.
Conclusion: reconciling the evidence There is strong empirical evidence that household consumption falls through retirement. This is
despite stated preferences for increasing income in retirement. Perhaps the reality is different to the

Page 21 of 57
expectation – lifestyles change and people have more time for leisure. There is little evidence that
Australian retirees are less happy in retirement; indeed, it appears the opposite. The theoretical
foundation is consumption smoothing across lifetime, so a flat consumption profile through
retirement. However, more detailed models reveal a range of reasons for why it may be rational to
consume less through retirement.
We express caution that the theoretical reasoning matches the empirical observations by
coincidence. Perhaps the empirical observations are more about lifestyle changes than rational
decision-making. What is important is that we do not find any evidence that the profile of falling
consumption through retirement is driven by financial constraints.
Overall, we find that retirement consumption and related questions of adequacy are more complex
than a constant replacement rate or a fixed absolute standard of living measure. An assumption of
declining consumption in retirement appears defensible, but one of constant real consumption feels
more appropriate for adequacy assessment.
Page 22 of 57
Essay 4 – An integrated retirement system focused on household outcomes?
The Conexus Institute would like to acknowledge Annabelle Tian and thank her for co-
authoring this essay. Annabelle has tutored superannuation-related subjects at UNSW,
and will soon begin her career at IAG.
Summary Most parts of the retirement system focus on individual outcomes rather than household
outcomes. Superannuation is the exception, being a system largely based around individuals
It is difficult for uninformed households to make informed decisions in a complex system,
and to have confidence in those decisions
Present solutions such as retirement income estimates, guidance and financial advice are
challenged from the perspective of provision and dealing with the complexity of the
challenge
Improving the provision of, and quality of retirement income estimates, guidance and advice
is essential for improving outcomes and confidence in the retirement system
Components of the retirement system – individual or household
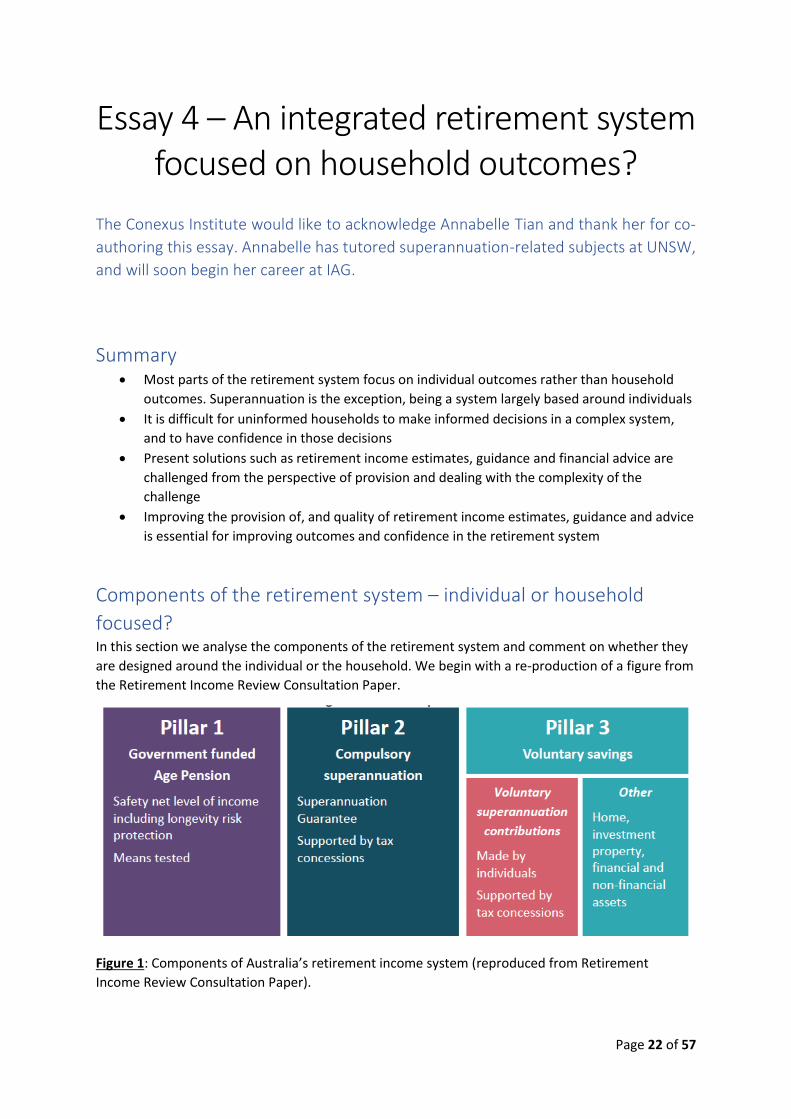
focused? In this section we analyse the components of the retirement system and comment on whether they
are designed around the individual or the household. We begin with a re-production of a figure from
the Retirement Income Review Consultation Paper.
Figure 1: Components of Australia’s retirement income system (reproduced from Retirement
Income Review Consultation Paper).

Page 23 of 57
We now consider each component in Figure 1 and whether it is focused on the individual or the
household.
The age pension system is focused on the household. Means testing and the level of payment are
based on a household assessment.
Superannuation, by comparison, is largely focused on the individual. From an operational
perspective superannuation is based on individual accounts. Taxation and contribution rules tend to
apply at an individual level with the notable exception of spouse contributions. During the
retirement phase the most common structure is the account-based pension, which is an individual
account. SMSF’s represent a partial exception, as the assets of both members of a couple can be
combined into a coordinated investment strategy.
Voluntary savings through superannuation is captured through the same individual account
structure. There is an opportunity to optimise the tax effectiveness of voluntary contributions across
a household.
The home is treated as a household asset through principal place of residence rules. Investment
properties, financial and non-financial investments are all household decisions and taxed
accordingly.
Superannuation is distinguishable as the only form of retirement savings which is not structured
around the household.
Household considerations There exists a range of considerations for a household during accumulation and drawdown stages, as
outlined in Table 1. It is also important to be cognisant of integrated decision-making; ideally all
these decisions would be made in consideration of each other. The non-exhaustive list of
considerations highlights the complexity faced by households.

Page 24 of 57
Labour decisions Savings / spending decisions
Investment decisions
Working (accumulation)
Labour provision (full or part-time)
Career breaks
Education
Trade-off between savings and consumption
Additional savings (above SG)
Home purchase
Savings optimisation: tax, liquidity
Super (default or choice)
Other forms of savings
Retired (drawdown)
Part-time work Consumption versus retirement certainty
Existing debt (e.g. mortgage)
Role of age pension
Preferences including reversionary benefits and bequest motives
Health status
Specific rules such as minimum drawdown rules
Choice of retirement products
Investment decision (if using an ABP)
Other forms of savings
Table 1: Household financial considerations
Problems created Adverse outcomes are represented by the opportunity cost of sub-optimal consumption and
investment decision-making at a household level. The primary driver of such sub-optimal decision-
making is the inability to incorporate a range of complex information into an aggregated household
decision. The constraints imposed by tax and product rules will have some adverse impact, but we
consider this impact small. We believe that most problems evolve in the drawdown phase as this is
where the decisions are complex and multi-faceted, where guidance is modest and where default
solutions fail to deal with the issues faced by heterogeneous households. When we refer back to
Table 1, we can see that:
1. Default arrangements (namely the SG and default options) provide strong foundations
during the accumulation phase
2. The range of decisions faced in retirement are more complex, affected by personal
preferences, and are supported by foundations which have been subject to less policy
review (account-based pension (ABP) and minimum drawdown rules)

Page 25 of 57
Guidance and advice Guidance and advice have the potential to assist households navigate the complex decisions they
face. Consider the current guidance and advice available to individuals and households:
Retirement income estimates (RIE’s): provided by 42% of super funds, entails a basic
retirement income projection. RIE’s are usually based on Class Order [CO 11/1227] Relief for
providers of retirement. The required assumptions produce forecasts which may be quite
different to an estimate based on the true position of the household. The projections of two
individuals of a household will likely never (even if household asset assumptions prove
correct) be the same as the aggregated household forecast (see Liu et al (2016)).
Unfortunately, if two members of a household are in the same super fund, the super fund
cannot provide a household forecast within the class order.
Guidance tools: around two-thirds of super funds provide calculators which allow for user
input around assumptions (exemption from licensing requirements and conditions by ASIC
Corporations (Generic Calculators) Instrument 2016/207). Our anecdotal review of these
calculators identifies ASIC’s MoneySmart Retirement Planner as one of the more detailed
calculators. All calculators appear to be deterministic and fail to account for all assets of the
household.
Financial advice: the current structure of the advice industry means that advice is largely
only accessed by higher wealth households. Comprehensive financial advice should capture
the complete household financial position. However, the financial planning tools used by
planners are often deterministic (not stochastic) and hence are not well equipped to assess
the certainty of an outcome and incorporate a household’s specific profile around objectives
and certainty into a plan. One example of advanced household modelling is joint mortality
modelling (again, Liu et al (2016)). This example highlights both the complexity and the
importance of accurate modelling.
These areas of advice and guidance are explored further in Essay 10. Our observations are that
presently quality cost-effective financial advice is not accessible to all households. Meanwhile there
is a large dispersion in the financial guidance provided to fund members, and on average this
guidance is weak.
Financial guidance the most realistic solution Is it possible to alter the retirement system architecture to generate a system which is far less
complex? The changes required would be significant and would need to:
Remove all interactions between system components (e.g. age pension means testing)
Generate a level field of tax and incentive effects across system components
Remove all uncertainties faced by households (e.g. investment risk and mortality outcomes)
Otherwise they would fail to be effective i.e. there would be residual complexities for consumers to
deal with. Ultimately the combination of a DC superannuation system and a means-tested pension
means that complexity will be a permanent feature of the system.

Page 26 of 57
A realistic solution is to focus on assisting consumers to navigate the system complexity through the
provision of improved guidance and advice. We believe that the potential to significantly improve
household decision-making is significant. There are many ways that changes could be implemented
to improve guidance, such as (the below is not an exhaustive list):
Through policy, such as making it a requirement for MySuper licensees to provide a RIE
Through regulatory encouragement. For example, the quality of guidance could be included
as part of APRA’s outcomes assessment and heatmap reviews
Through industry competition, with active assessment by superannuation research houses
Conclusion Most major parts of the retirement system focus on the household. The exception is
superannuation, which is based on individual accounts. This impairs effective household decision-
making. However, we assess the impact to be modest and the change required to address the
problem is significant.
Through this initial lens we identify the complex array of decisions faced by households, particularly
in retirement. Given the structural shortages in the advice industry, guidance provided by funds has
an important role to play. However, there exists a large dispersion in the quality of guidance
provided by super funds; overall the average quality of guidance is weak. We think there are many
mechanisms through which to encourage an improvement in financial guidance. This would improve
financial decision-making and increase confidence in the retirement system.

Page 27 of 57
Essay 5 – The need for a retirement system objective
Summary Without a clear objective for the retirement system, the role of the three pillars and their
component parts, is difficult to define and open to interpretation
This has an important flow down effect for sensitive policy areas, notably superannuation
guarantee (SG and voluntary contributions), age pension and treatment of the home
(principal residence)
There exists a strong interaction between retirement system components. We question
whether it is appropriate to consider changes in one component without considering
accompanying changes in the others
Lack of system objective The retirement income system does not have a stated objective. This is a recurring observation
throughout this submission. In Essay 9 we question whether it is misleading to name the system a
‘retirement income system’; perhaps the term ‘retirement system’ is more appropriate. In Essay 6
we query the role of housing, drawing attention to the fact that the primary role of housing,
accommodation is typically not incorporated into retirement system objectives globally. In Essay 1
we detail how retirement preferences, at a policy or individual level, can be converted into a
quantifiable objective.
The lack of a retirement system objective leaves us questioning the role of component parts. In
particular:
What is the role of the super?
What is the role of the age pension?
What is the role of the principal residence?
We note that there exists a stated purpose of the Age Pension, while the Financial System Inquiry
(2014) recommended the creation of a clear objective for superannuation2. However, we believe it
would be better, and more considered, to create an objective for the retirement system prior to
creating objectives for components of the system. Component objectives could then be informed by
the overarching system objective.
Roles and interactions We attempt to summarise the roles of superannuation (both SG and voluntary components), age
pension and housing in Table 1. When we look across features of Table 1, we observe that:
2 The proposed objective was: “to provide income in retirement to substitute or supplement the age pension”.
Page 28 of 57
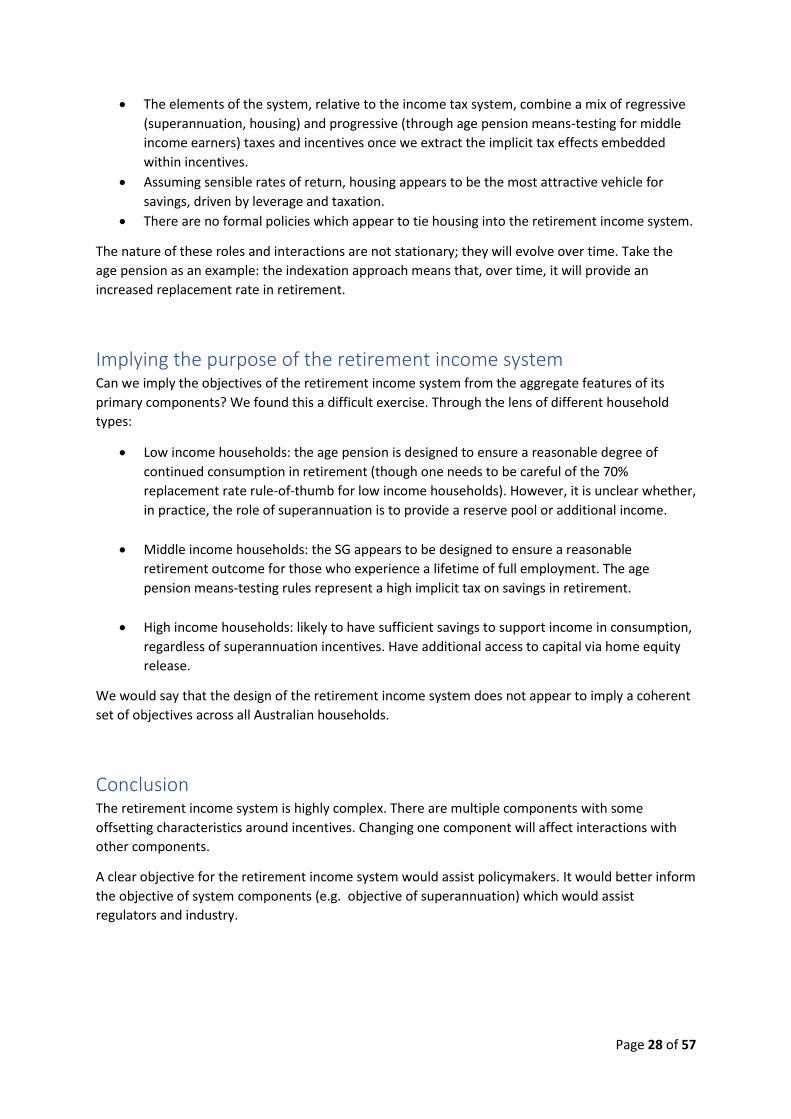
The elements of the system, relative to the income tax system, combine a mix of regressive
(superannuation, housing) and progressive (through age pension means-testing for middle
income earners) taxes and incentives once we extract the implicit tax effects embedded
within incentives.
Assuming sensible rates of return, housing appears to be the most attractive vehicle for
savings, driven by leverage and taxation.
There are no formal policies which appear to tie housing into the retirement income system.
The nature of these roles and interactions are not stationary; they will evolve over time. Take the
age pension as an example: the indexation approach means that, over time, it will provide an
increased replacement rate in retirement.
Implying the purpose of the retirement income system Can we imply the objectives of the retirement income system from the aggregate features of its
primary components? We found this a difficult exercise. Through the lens of different household
types:
Low income households: the age pension is designed to ensure a reasonable degree of
continued consumption in retirement (though one needs to be careful of the 70%
replacement rate rule-of-thumb for low income households). However, it is unclear whether,
in practice, the role of superannuation is to provide a reserve pool or additional income.
Middle income households: the SG appears to be designed to ensure a reasonable
retirement outcome for those who experience a lifetime of full employment. The age
pension means-testing rules represent a high implicit tax on savings in retirement.
High income households: likely to have sufficient savings to support income in consumption,
regardless of superannuation incentives. Have additional access to capital via home equity
release.
We would say that the design of the retirement income system does not appear to imply a coherent
set of objectives across all Australian households.
Conclusion The retirement income system is highly complex. There are multiple components with some
offsetting characteristics around incentives. Changing one component will affect interactions with
other components.
A clear objective for the retirement income system would assist policymakers. It would better inform
the objective of system components (e.g. objective of superannuation) which would assist
regulators and industry.
Page 29 of 57
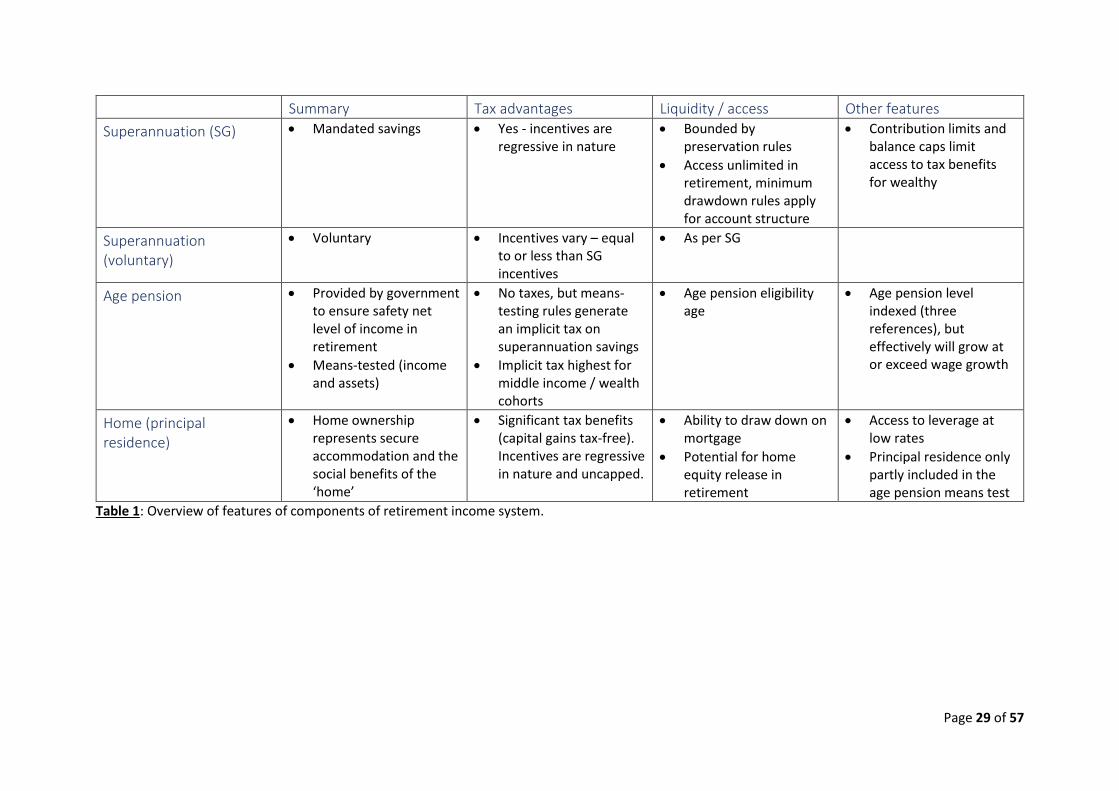
Summary Tax advantages Liquidity / access Other features
Superannuation (SG) Mandated savings Yes - incentives are regressive in nature
Bounded by preservation rules
Access unlimited in retirement, minimum drawdown rules apply for account structure
Contribution limits and balance caps limit access to tax benefits for wealthy
Superannuation (voluntary)
Voluntary Incentives vary – equal to or less than SG incentives
As per SG
Age pension Provided by government to ensure safety net level of income in retirement
Means-tested (income and assets)
No taxes, but means-testing rules generate an implicit tax on superannuation savings
Implicit tax highest for middle income / wealth cohorts
Age pension eligibility age
Age pension level indexed (three references), but effectively will grow at or exceed wage growth
Home (principal residence)
Home ownership represents secure accommodation and the social benefits of the ‘home’
Significant tax benefits (capital gains tax-free). Incentives are regressive in nature and uncapped.
Ability to draw down on mortgage
Potential for home equity release in retirement
Access to leverage at low rates
Principal residence only partly included in the age pension means test
Table 1: Overview of features of components of retirement income system.

Page 30 of 57
Essay 6 – The incoherent role of housing in the retirement income system
Summary Housing is recognised by the Retirement Income Review as a component of the third pillar of
the retirement income system
Yet housing performs an incoherent role in retirement. The role performed by housing
differs across cohorts of the population
We also believe it important to consider the scenario of ongoing challenged housing
affordability
Introduction Housing is recognised by the Retirement Income Review as a component of the third pillar of the
retirement income system (illustrated in Figure 1).
Figure 1: Components of Australia’s retirement income system (reproduced from Retirement
Income Review Consultation Paper).
However, the role of housing in the retirement income system is undefined and unclear; ultimately,
it performs an incoherent role. This is the theme of this essay.
Further we note the potential for a prolonged period of reduced housing affordability. While the role
of housing in retirement is incoherent, we believe reduced housing affordability will impact all of the
principles which the Review are focused on: adequacy, equity, sustainability, and cohesion. We
detail the issue; it may be one which the Review chooses to explore further.
Page 31 of 57
The incoherent role of housing in retirement There is no objective for the retirement income system (the topic of Essay 5). The role of housing in
retirement is not formalised and generally unclear.
We consider the role of housing through the ‘traditional’ lens of the lifecycle, summarised in Table 1.
Through this traditional lens we make the following observations:
Home ownership provides secure accommodation (rental is not secure) and provides social
benefits of ‘home’ versus ‘house’.
The tax advantages of home ownership can be significant and accrue to those with higher
income (greater benefit of tax-free gains) and greater wealth (generally a larger principal
residence).
It is implicitly means-tested in a crude manner by the age pension. This fails to account for
geographic location.
It appears to be an informal bequest strategy. Research by CEPAR (CEPAR (2019)) suggests
that property made up 70% of assets of those dying aged 65-84.
There is no requirement to draw down on home equity in retirement unlike other forms of
tax-advantaged savings.
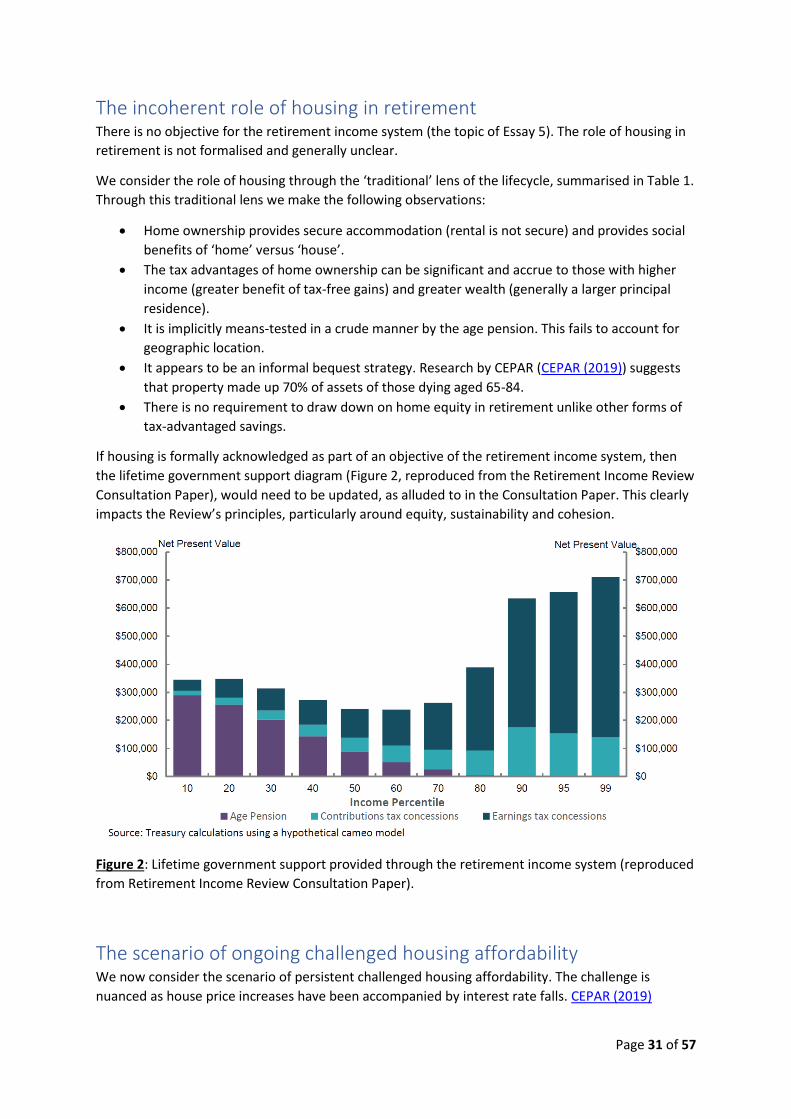
If housing is formally acknowledged as part of an objective of the retirement income system, then
the lifetime government support diagram (Figure 2, reproduced from the Retirement Income Review
Consultation Paper), would need to be updated, as alluded to in the Consultation Paper. This clearly
impacts the Review’s principles, particularly around equity, sustainability and cohesion.
Figure 2: Lifetime government support provided through the retirement income system (reproduced
from Retirement Income Review Consultation Paper).
The scenario of ongoing challenged housing affordability We now consider the scenario of persistent challenged housing affordability. The challenge is
nuanced as house price increases have been accompanied by interest rate falls. CEPAR (2019)

Page 32 of 57
research shows that over the last two decades for some households the time to save for a
hypothetical deposit has increased from 4 years to 6 years, but repayments are lower (36% of
income, down from 44%).
Anecdotally it appears that saving for a deposit is the primary barrier to home ownership. This has
raised concerns regarding family-sponsored home deposits and the inequalities this generates. This
impacts the Review through its focus on the principles of equity and cohesion.
This may be a scenario that the Review chooses to explore in further detail.
Conclusion Creating a clear objective for the retirement income system would assist policymakers assess the
role of housing in retirement. Without a clear objective, the role of housing in retirement appears
incoherent.
The potential for an elongated period of challenged house price affordability is a scenario the Review
may wish to explore further.

Page 33 of 57
Lifestage Early career Mature working life Retired
Activity Renting
Saving for deposit
First home
Home improvements
Upsizing
Stable home
Conversion to age-friendly
Downsizing considerations
Age care considerations
Accommodation source
Rental accommodation (insecure)
Own home Own home
Age care
Financial considerations
Saving for deposit Paying off / drawing down on mortgage debt
Home ownership provides access to a substantial amount of low-cost leverage
Reduced age pension payment for home owners (where eligible)
Likely debt-free
Access to home equity release
No obligation or policy to
Informal bequest strategy
Tax, incentives Rent is after-tax
Returns on savings are taxed
Some incentives to assist with deposit
Capital gains are tax-free
Paying down debt effectively earns mortgage rate after-tax
Capital gains are tax-free
Table 1: Traditional lifecycle housing-related activity.

Page 34 of 57
Essay 7 – Does the term ‘retirement income’ mislead?
The Conexus Institute would like to acknowledge Annabelle Tian and thank her for co-
authoring this essay. Annabelle has tutored superannuation-related subjects at UNSW,
and will soon begin her career at IAG.
Summary The term ‘retirement income’ may potentially mislead or mis-frame people to think of their
retirement savings primarily as an income generator, rather than a savings pool which they
draw down on to fund consumption in retirement.
It appears that individuals draw down at rates which do not maximise retirement outcomes
(relative to ‘deterministically optimal’ levels).
This could be rational behaviour (reserving to manage the risks faced by individuals) or
behavioural (e.g. similar to implied endorsement through minimum drawdown rules).
This leads us to conclude that ‘retirement income’ is not the most accurate name for the
system, and perhaps it should be tested to see whether this creates framing issues for
consumers and industry participants.
The framework of consumption, savings and investment Retirement systems globally reflect unique applied versions of the lifecycle model of consumption,
savings and investment. Explored and extended by academics for many decades, the framework
distinguishes between three stages of the lifecycle: childhood, working life and retirement. Of these
three stages, the latter two are when individuals are economically productive and have the financial
means to exercise decisions (consumption, savings and investment) that will directly affect their
living standards (see for instance Milevsky (2006) and Milevsky (2012))3. One important aspect of the
framework is saving during working years to fund consumption in retired years: retirement
smoothing.
We utilise deterministic modelling to illustrate the framework. We note the shortcomings of
deterministic modelling (a deterministic model only considers expected outcomes and not the range
of outcomes); indeed, the existence of a range of outcomes is a rational explanation for some of the
practices we observe. Stochastic modelling is explored in detail in Essay 2.
We model an individual who earns constant income through their working life, saves and then draws
down on these savings in retirement, which starts at age 67. We assume the individual lives for
exactly 25 years in retirement.
3 Milevsky (2006) takes a future value and present value approach to modelling the value of savings and consumptions over the lifecycle. Furthermore as explained by Milevsky (2012), during childhood the individual is developing their human capital which then translates to wage income in working life.

Page 35 of 57
Figure 1: Basic lifecycle model. An individual earns constant income (AWOTE) throughout their
unbroken working life. They constantly save (in this case 9.5% of their wage) and then draw down on
these savings in retirement (which begins at 67). The individual is modelled to live for exactly 25
years in retirement. Inflation is assumed to be a constant 2.5%.
We can see that Figure 1 leaves out many important facets. We extend the model (Figure 1) to
account for wage growth, investment returns and the age pension. Further extensions would include
taxes, though that is not necessary for this essay.
We observe that the level of available consumption in retirement is much higher than in Figure 1. In
comparison to Figure 1, in Figure 2 the savings balance profile takes on a familiar ‘shark fin’ shape.
This is due to the compounding effect of investment returns and wage growth (in accumulation).
Figure 2: Extended lifecycle model incorporating all the assumptions in Figure 1 and also wage
growth, investment returns (1% real and 3% real, respectively), and the age pension (means-tested
for a single homeowner).

Page 36 of 57
Analysing sources of ‘retirement income’ In the previous section we outlined the lifecycle theory of consumption, savings and investment. We
make three observations:
1. In the absence of social security programs, consumption in retirement is funded by savings
(which grows through working life as a combination of contributions and investment
returns).
2. Retirement consumption from savings could be thought of as having two components:
income on the savings pool and a drawdown on saved capital.
3. The age pension is an additional source of income in retirement.
In this section we seek to explore the contribution of each component to consumption in retirement.
It appears that some consumers and industry participants frame retirement spending as the income
sourced from their savings pool and age pension, but do not account for spending down their
savings. This framing manifests itself in media articles on topics such as age pension rule changes
(see ‘retirement trap’ or ‘pension changes’) and the Labor party’s proposed franking credit policy
(for example, ‘17% worse off’). One article which does describe the situation better is ‘$1 million is
never less than $500k’.
Page 37 of 57
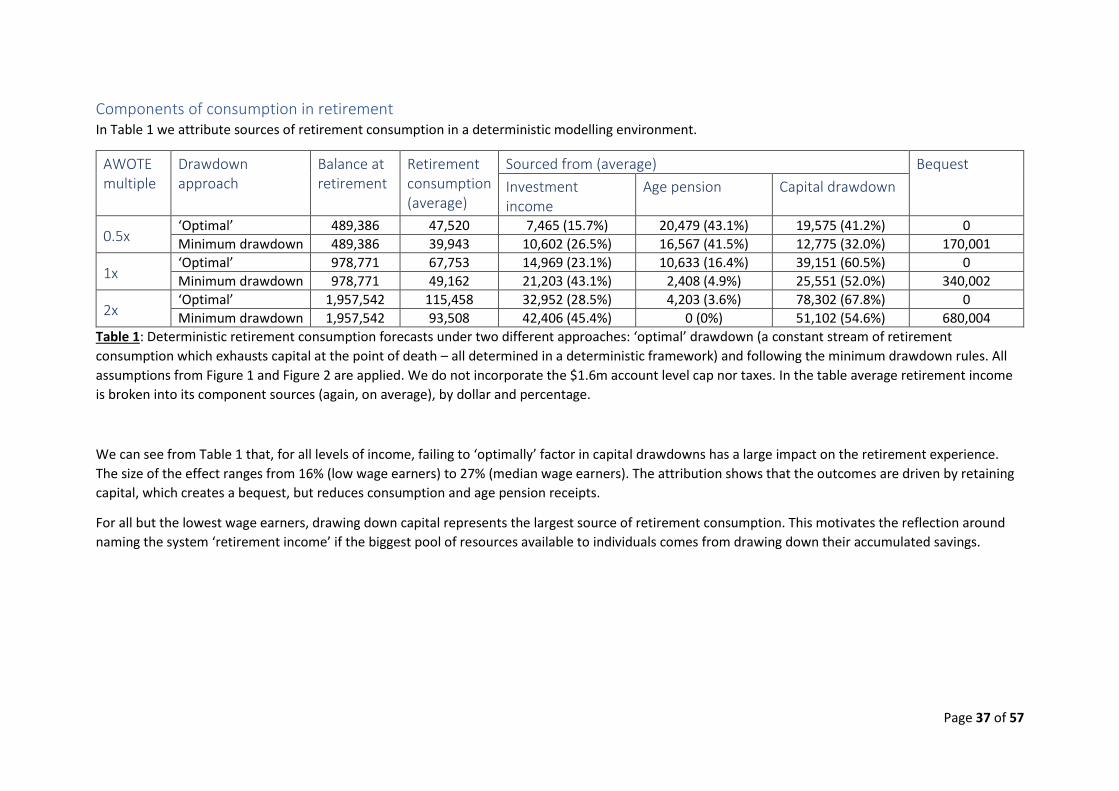
Components of consumption in retirement In Table 1 we attribute sources of retirement consumption in a deterministic modelling environment.
AWOTE multiple
Drawdown approach
Balance at retirement
Retirement consumption (average)
Sourced from (average) Bequest
Investment income
Age pension Capital drawdown
0.5x ‘Optimal’ 489,386 47,520 7,465 (15.7%) 20,479 (43.1%) 19,575 (41.2%) 0
Minimum drawdown 489,386 39,943 10,602 (26.5%) 16,567 (41.5%) 12,775 (32.0%) 170,001
1x ‘Optimal’ 978,771 67,753 14,969 (23.1%) 10,633 (16.4%) 39,151 (60.5%) 0
Minimum drawdown 978,771 49,162 21,203 (43.1%) 2,408 (4.9%) 25,551 (52.0%) 340,002
2x ‘Optimal’ 1,957,542 115,458 32,952 (28.5%) 4,203 (3.6%) 78,302 (67.8%) 0
Minimum drawdown 1,957,542 93,508 42,406 (45.4%) 0 (0%) 51,102 (54.6%) 680,004
Table 1: Deterministic retirement consumption forecasts under two different approaches: ‘optimal’ drawdown (a constant stream of retirement
consumption which exhausts capital at the point of death – all determined in a deterministic framework) and following the minimum drawdown rules. All
assumptions from Figure 1 and Figure 2 are applied. We do not incorporate the $1.6m account level cap nor taxes. In the table average retirement income
is broken into its component sources (again, on average), by dollar and percentage.
We can see from Table 1 that, for all levels of income, failing to ‘optimally’ factor in capital drawdowns has a large impact on the retirement experience.
The size of the effect ranges from 16% (low wage earners) to 27% (median wage earners). The attribution shows that the outcomes are driven by retaining
capital, which creates a bequest, but reduces consumption and age pension receipts.
For all but the lowest wage earners, drawing down capital represents the largest source of retirement consumption. This motivates the reflection around
naming the system ‘retirement income’ if the biggest pool of resources available to individuals comes from drawing down their accumulated savings.

Page 38 of 57
Motivating behaviours There is strong evidence of low drawdown rates of capital in practice which do not conform to the
basic lifecycle model4 . There are rational and behavioural explanations which may explain this
observation.
First, in any stochastic framework (a more advanced model which accounts for variability in factors
such as investment returns and mortality outcomes), it would be sub-optimal to plan to spend down
savings using the approach we have described as ‘optimal’ in our case study. In any utility-based
framework where people are risk averse, the possible experience of unfavourable outcomes (where
either or both of investment and mortality outcomes have been unfavourable) would more than
exceed the experience of favourable outcomes. This was explored in Essay 2, demonstrating that to
be sure of achieving a certain level of retirement consumption, an individual would need to choose a
reduced level. The concept of utility is explained in Essay 1.
There are also a range of possible explanations including bequest motives and precautionary savings
motives. Dynan et al (2002) argue that these motives overlap. De Nardi et al (2010) identify
heterogenous medical costs as a precautionary savings motive.
From a behavioural perspective, Bateman et al (2017) suggest the low drawdown rates of capital in
retirement may be attributed to implied endorsement. In the experimental study both government
advice and peer effects were key drivers of spending behaviour, with 30% of Australian participants
matching their consumption with the policy-based minimum withdrawal rates (MWRs). This suggests
that the MWRs are viewed as endorsed by government and interpreted as advice.
Is ‘retirement income’ a misleading name? There is a strong case that ‘retirement income system’ is a misleading name for the system.
Provision of consumption in retirement comes from income on savings, drawing down savings and
social security. Media articles suggest that this is not always well understood, with a focus on the
two sources of income.
In our model retirement consumption is funded by income on assets, the age pension, and drawing
down on saved capital. In practice there are other candidate funding sources such as other financial
assets and housing5. Either way, in much of the adequacy analysis a sizable part of retirement
consumption is funded by drawing down on accumulated savings.
There is a strong case to draw down cautiously (relative to the deterministically optimal level) and
account for possible environments which aren’t captured in a deterministic environment (explored
in Essay 2). Exhibiting motives for precautionary savings (for unexpected costs) or a bequest motive
may also be appropriate behaviours for a household.
4 See for instance Balnozan et al (2018) study on drawdown behaviours, of the pensioners surveyed 48% followed the minimum drawdown rates and 28% followed a level dollar amount drawdown. 5 As an example, Grattan (2018) assumes a full drawdown of superannuation assets and other financial assets but does not assume the use of home equity release products.

Page 39 of 57
These rational reasons for drawing down less than the deterministically optimal level make it
difficult to attribute if any of the behaviour can be attributed to behavioural effects such as implied
advice of a mis-named system.
Ultimately a significant part of retirement consumption is spending down capital saved for
retirement (from a savings pool which generally benefitted from tax incentives). The name
‘retirement income system’ does not align well with this concept. Though untested (to our
knowledge), perhaps it creates some framing issues for consumers, media and industry participants.

Page 40 of 57
Essay 8 – ‘Lottery effects’ in the superannuation system
Summary The Productivity Commission identified implementation performance as a ‘lottery effect’
which could result in significant differences in outcomes between like individuals
Unfortunately, implementation performance is not the only ‘lottery effect’ in the system -
we identify and explore four additional effects
PC identify a ‘lottery effect’ – implementation / fees The Productivity Commission (2019) identified default fund placement as a ‘lottery effect’ which
could result in significant differences in outcomes between like individuals. The lottery effect
terminology looks beyond the natural variation in outcomes between super funds, to situations
where the expected outcomes across funds differ and are likely to persist. The consumer’s lottery
outcome is the difference in expected outcome based on the fund they are defaulted into. The
specific lottery effect identified by the PC, related to the identification of large, persistent dispersion
between the implementation performance of super funds on a net-of-fees basis.
However, we believe dispersion in implementation performance is not the only lottery effect in the
system. We outline and detail a range of other impacts which may have a similar size of impact.
We consider the ramifications of a system with multiple lottery effects.
A suite of lottery effects In this section we briefly detail four other lottery effects that we believe could possibly have a similar
impact as implementation performance. It is not possible to assess and rank the impact of each
lottery effect without a clear objective, which accounts for the distribution of outcomes (i.e. a utility
function, explored in Essay 1). Nonetheless, this would be an interesting area that the Review may
want to further explore.
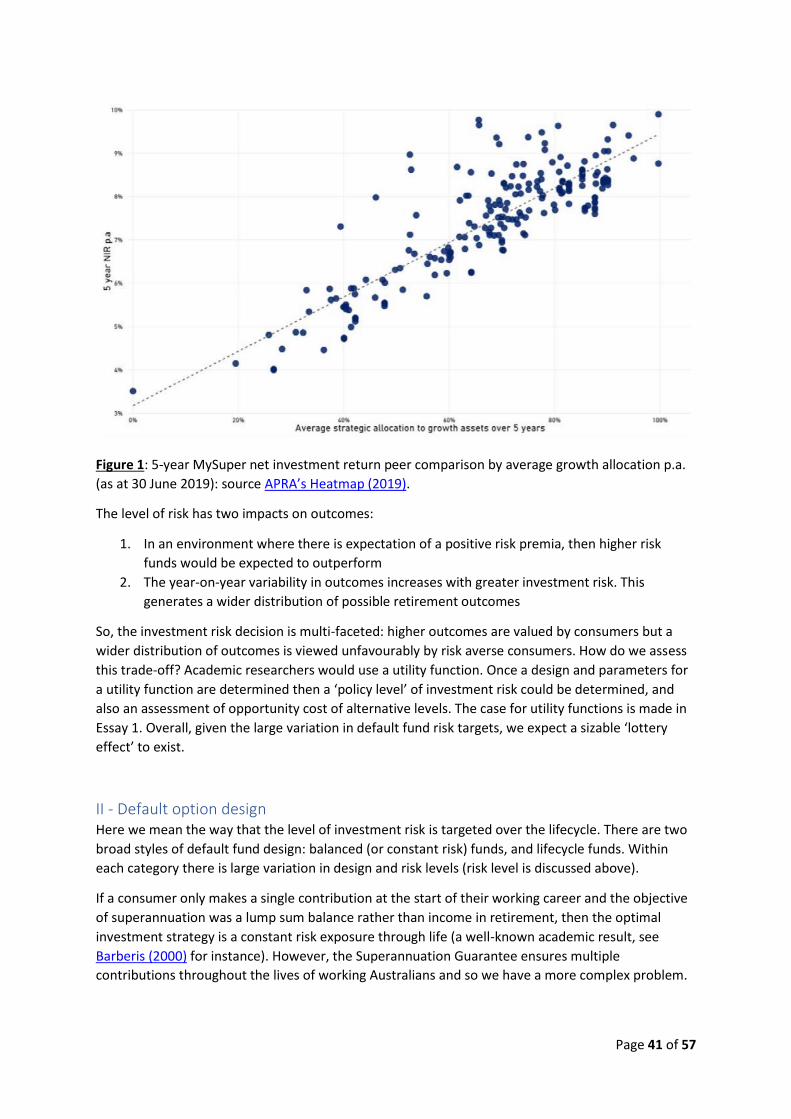
I - Level of investment risk Super funds differ significantly in the level of investment risk targeted in their default options, as
identified by APRA’s Heatmap (2019) (see Figure 1 below which reproduces the relevant APRA
chart). The BP (benchmark portfolio) analysis technique used by the Productivity Commission, while
a creditable approach for assessing implementation performance, ignores the impact of the overall
investment risk decision (this is a direct feature of the BP approach).
Page 41 of 57
Figure 1: 5-year MySuper net investment return peer comparison by average growth allocation p.a.
(as at 30 June 2019): source APRA’s Heatmap (2019).
The level of risk has two impacts on outcomes:
1. In an environment where there is expectation of a positive risk premia, then higher risk
funds would be expected to outperform
2. The year-on-year variability in outcomes increases with greater investment risk. This
generates a wider distribution of possible retirement outcomes
So, the investment risk decision is multi-faceted: higher outcomes are valued by consumers but a
wider distribution of outcomes is viewed unfavourably by risk averse consumers. How do we assess
this trade-off? Academic researchers would use a utility function. Once a design and parameters for
a utility function are determined then a ‘policy level’ of investment risk could be determined, and
also an assessment of opportunity cost of alternative levels. The case for utility functions is made in
Essay 1. Overall, given the large variation in default fund risk targets, we expect a sizable ‘lottery
effect’ to exist.
II - Default option design Here we mean the way that the level of investment risk is targeted over the lifecycle. There are two
broad styles of default fund design: balanced (or constant risk) funds, and lifecycle funds. Within
each category there is large variation in design and risk levels (risk level is discussed above).
If a consumer only makes a single contribution at the start of their working career and the objective
of superannuation was a lump sum balance rather than income in retirement, then the optimal
investment strategy is a constant risk exposure through life (a well-known academic result, see
Barberis (2000) for instance). However, the Superannuation Guarantee ensures multiple
contributions throughout the lives of working Australians and so we have a more complex problem.

Page 42 of 57
To add some perspective to this problem, consider the case of an individual who works without a
break through their career: the super fund performance in the final year of work will likely have 50
times greater impact on their retirement outcome than the performance in the first year. This may
generate two reflections:
1. Perhaps a young member may be able to target much higher risk
2. An older member may be wary of taking a large amount of investment risk just prior to
retirement
These reflections motivate the case for lifecycle strategies, whereby the broad aim is to maintain a
constant unit investment risk across time i.e. to spread the units (i.e. dollars) of investment risk as
evenly as possible across each time period.
In practice there are many additional elements which further complicate analysis including uncertain
work patterns, post-retirement, and the role of the age pension.
Appendix 1 contains a case study illustrating how a “well-designed” lifecycle strategy with poor
investment implementation performance could provide greater expected utility than a well-
managed balanced fund approach. This is a truncated version of David Bell’s SPS 515 submission to
APRA (Bell – SPS515 (2019)).
In summary, the ‘lottery effect’ is that some funds may have superior fund designs, and the
expected benefits of superior fund design are persevering.
III - Post-retirement solutions Super funds in general do not provide advanced default post-retirement solutions which provide
longevity protection or advanced dynamic strategies to re-optimise the consumption and
investment decisions over time. Standalone product solutions are available but these are generally
distributed through advice models. As discussed in Essay 10, financial planners are not always
trained or equipped with the tools to make such complex decisions.
The lack of default retirement solutions which contain longevity protection was addressed in the
Financial System Inquiry (FSI (2014)) which recommended the creation of CIPRs. A proposed policy
framework for CIPRs was developed by Treasury (CIPR (2016)).
While we are not confident that a CIPR itself will add value to the broader population (see for
instance Mine (2017), we have greater confidence that a well-designed default retirement solution
could deliver welfare benefits (Liu and Bell (2018)).
The lottery effect is a potentially large dispersion in the future quality of retirement solutions,
consumers take product provision and defaults as guidance, and like consumers in different funds
experience a large difference in retirement outcomes.
Guidance provided by super funds (in absence of financial advice) The issue of inadequate quantity and quality of financial advice and guidance available to fund
members is explored in Essay 10. Beyond the system-level shortcomings, there is also the likelihood
of a large difference in the quantity and quality of guidance provided and made available to
members by their super funds.

Page 43 of 57
According to super industry researcher SuperRatings, only 42% of super funds now provide
retirement projections in their member statements. Rice Warner observe that one third of super
funds don’t have a superannuation projection calculator on their public website. Rice Warner
identify many calculators as being very simple – only accommodating an individual (rather than
couples), ignoring the age pension, or being deterministic without showing the range of outcomes of
a stochastic model.
If consumers weigh their decisions and take guidance as well-considered, then there is potentially a
large opportunity cost from taking an incorrect course of action. The lottery effect is the potentially
large dispersion in the quality of guidance provided amongst super funds.
We haven’t estimated the potential cost but, at request, could construct a few case studies to
illustrate.
Implications of multiple lottery effects Multiple lottery effects exist in the superannuation system. We identify four (level of investment
risk, default option design, post-retirement solutions, and member guidance) in addition to the one
(implementation performance) identified by the Productivity Commission.
It is appropriate to attempt to remove lottery effects. This would support some of the principles of
the Review, notable adequacy, equity and cohesion. However, the existence of multiple lottery
effects makes policy more difficult to formulate. For instance, a policy to address one lottery effect
may leave others unaddressed.
To remove lottery effects most likely requires a suite of policies, regulations and nudges.

Page 44 of 57
Appendix 1 – Assessment of fund design
Introduction to a Basic Lifecycle Outcomes Model For the purposes of this discussion paper, modelling on a “to” basis is sufficient to provide case
studies on key issues. We consider the case of an individual who experiences an uninterrupted
working career, always earning AWOTE6.
An example of the output used to address some case studies is included in Figure A1.
Figure A1: Summary analysis from basic lifecycle model (accumulation balance at retirement).
The table contains some self-explanatory summary statistics, while the chart provides a distribution
chart of outcomes.
To compare the distributions of alternative product strategies, we form a basic quantifiable
objective. For this case study we focus on accumulation balance and not income in retirement. Other
features:
Assumes constant relative risk aversion (known as CRRA), specifically people take risk in
proportion to their assets, and not a dollar amount of risk. This is an assumption the whole
default industry is based on.
The formula appears as follows:
𝑈(𝑊𝑇) = 𝑊𝑇
1−𝐴𝑅
1 − 𝐴𝑅
Where:
WT is accumulation balance (wealth) at the time of retirement (T)
6 The model used is quite basic and has the following characteristics:
An individual is assumed to earn an amount similar to AWOTE for their entire career
Earnings growth slightly exceeds inflation (1% real)
9.5% Superannuation Guarantee
Taxes ignored (but should be included)
Investment returns defined on a case-by-case basis
Investment returns are assumed to be normally distributed
1,000 simulations to generate the range of possible outcomes
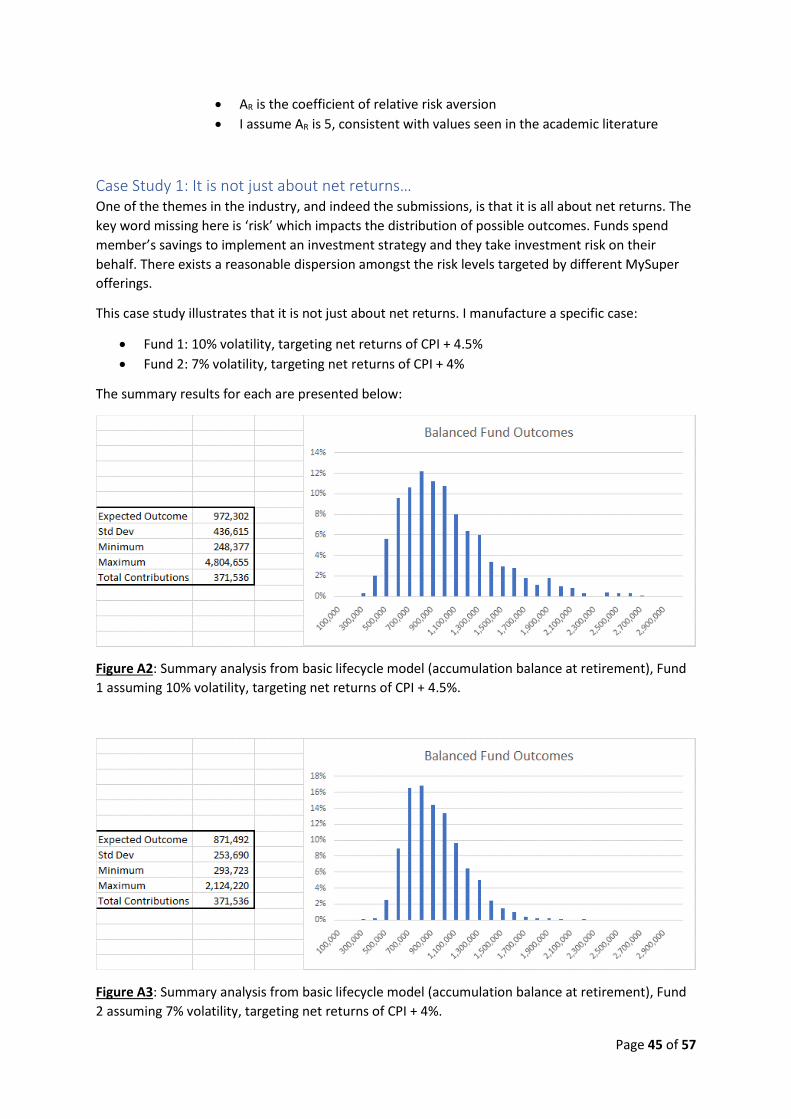
Page 45 of 57
AR is the coefficient of relative risk aversion
I assume AR is 5, consistent with values seen in the academic literature
Case Study 1: It is not just about net returns… One of the themes in the industry, and indeed the submissions, is that it is all about net returns. The
key word missing here is ‘risk’ which impacts the distribution of possible outcomes. Funds spend
member’s savings to implement an investment strategy and they take investment risk on their
behalf. There exists a reasonable dispersion amongst the risk levels targeted by different MySuper
offerings.
This case study illustrates that it is not just about net returns. I manufacture a specific case:
Fund 1: 10% volatility, targeting net returns of CPI + 4.5%
Fund 2: 7% volatility, targeting net returns of CPI + 4%
The summary results for each are presented below:
Figure A2: Summary analysis from basic lifecycle model (accumulation balance at retirement), Fund
1 assuming 10% volatility, targeting net returns of CPI + 4.5%.
Figure A3: Summary analysis from basic lifecycle model (accumulation balance at retirement), Fund
2 assuming 7% volatility, targeting net returns of CPI + 4%.

Page 46 of 57
Comparing Figure 2 against Figure 3 reveals some interesting observations:
Fund 1 has a higher expected balance at retirement ($972,302) compared with Fund 2
($871,492).
This appears driven by a long tail of very high outcomes. The maximum simulated outcome
for Fund 1 was $4,804,655, compared with $2,124,220 for Fund 2.
However, Fund 2 delivers a narrower range of outcomes, as evident from the diagrams, and
statistically by the lower standard deviation ($253,690 for Fund 2 versus $436,615 Fund 1).
The worst-case outcome for Fund 2 ($293,723) is also higher than for Fund 1 ($248,377).
How does a policymaker, regulator or trustee choose between such strategies, as they are obliged
to? How do policymakers, reviewers and regulators compare two strategies (which could readily
represent MySuper defaults)?
A basic utility function considers all possible outcomes and considers. In this case Fund 2 is
considered to provide a better balance of outcomes for members (the worse cases in Fund 1 are
penalised more heavily than the very high outcomes).
This example demonstrates that it is not all about net returns. Where trustees have the
responsibility to determine an appropriate risk target, it is all about acknowledging the range of
possible returns associated with a strategy. Only once a risk target is determined (whether legislated
(e.g. all MySuper defaults must target 7% standard deviation) or determined by trustees), can the
focus switch solely to net returns.
From this example observe that:
This represents a case study where, arguably, Fund 2, delivering lower net returns, is a
better strategy
Without accounting for risk, there exists the potential for strategies targeting high risk,
underperforming in terms of converting risk into returns, may still delivering high net
returns, to be viewed favourably by a net-return focused industry.
Case Study 2: Comparing lifecycle against balanced strategies There remains an ongoing debate in the industry around whether lifecycle strategies or balanced
strategies represent more appropriate default strategies. We believe a lifecycle outcomes model
complemented with an outcomes-based objective helps provide clarity and objectivity. I now
provide an illustration comparing a lifecycle and a balanced default strategy.
Lifecycle Strategy:
First 20 years: 10% volatility, targeting net returns of CPI + 5%
Next 10 years: 8% volatility, targeting net returns of CPI + 4%
Final 10 years: 6% volatility, targeting net returns of CPI + 3%
Balanced Strategy: 8% volatility, targeting net returns of CPI + 4%
The summary results for each are presented below:

Page 47 of 57
Figure A4: Summary analysis from basic lifecycle model (accumulation balance at retirement),
Lifecycle Strategy.
Figure A5: Summary analysis from basic lifecycle model (accumulation balance at retirement),
Balanced Strategy.
The analysis seems to suggest these two strategies are expected to produce a similar range of
outcomes for their respective members. The Lifecycle strategy delivers a narrower range of
outcomes and the worst-case outcomes are improved, but the Balanced strategy has a higher
average outcome. Weighting the range of outcomes using our utility function, the utility scores are
nearly identical!
From here we could enhance our Lifecycle strategy, by targeting higher investment risk across all
stages while maintaining a better spread of unit risk exposure through life. This would enhance
returns and would be expected to outperform the Balanced strategy.

Page 48 of 57
Essay 9 – Market failure in retirement solutions?
Summary Is there market failure in the provision of retirement solutions?
What are the reasons that super funds are not providing advanced retirement solutions
which effectively incorporate longevity protection?
Do trustees need to be defaulted themselves – via provision of a nationwide default
solution?
Introduction A story to provide background to this essay. Last year I attended a conference on retirement risk
management. One of the attractions of attending was to see a leading super fund CEO (who I regard
highly) present on their developments in the area of retirement solutions. The CEO outlined what
could be created, and the capabilities they have internally to develop such solutions. It was exciting
to hear of the potential better outcomes for member. The CEO then reflected on the unclear
regulatory environment, and observed that the commercial benefits of being first to market are
difficult to estimate, especially in a profit-for-member environment. Overall, the CEO suggested that
a ‘fast follower’ approach represented a better risk-adjusted strategic approach than taking
innovation risk to be a ‘market leader’.
Beyond relatively simple ‘bucket’ strategies (e.g. Australian Catholic Super) there has been little
development of retirement solutions by superannuation funds, particularly solutions which manage
longevity risk. One notable example is Mercer Lifetime Plus, which represents a form of group self-
annuitisation (GSA) and used as part of Mercer’s superannuation fund. Notable third party solutions
include Challenger (lifetime annuities and deferred lifetime annuities) and Allianz Retire+ (cap and
floor market participatory note).
This essay explores whether there is market failure in terms of retirement solutions. To do this we
first need to define market failure.
Defining the ‘market’ and ‘market failure’ For the purpose of this essay we consider the ‘market’ to be quality financial solutions which are
cognisant of the key sources of variability. In this case we consider two solutions:
1. A single product solution which accounts for retirement risks (e.g. a GSA or an annuity)
2. A plan-based solution which incorporates financial guidance and possibly a collection of
underlying products
A definition of market failure, as described in Wikipedia:

Page 49 of 57
“In economics, market failure is a situation in which the allocation of goods and services by a free
market is not efficient, often leading to a net social welfare loss. Market failures can be viewed as
scenarios where individuals’ pursuit of pure self-interest leads to results that are not efficient–that
can be improved upon from the societal point of view.”
Through this lens the market for retirement solutions could be described by Figure 1.
Figure 1: Overview of the Australian market for retirement solutions.
Some interesting features are detailed in Figure 1. The most notable feature is the potential role of
intermediaries in household decision-making. While some households may make an active decision
to select (or not select) a specific retirement solution, often households will adopt default solutions
provided by super funds or seek professional advice.
Impact of age pension The age pension represents a longevity solution which is free to individuals on a means tested basis.
It provides conditional protection for all Australians. The full age pension provides a level of income
designed to avoid poverty. It is provided for life and the payment is indexed (effectively by wage
growth).
The Grattan Institute (2018) project that nearly 40% of present retirees will receive more than half of
their retirement income from the age pension, and that nearly all households will receive some form
of age pension payment during their retired lives.
So efficiently integrating the age pension with an ABP will provide effective solutions for retirees. For
instance, Mine Super (2017) identified that a solution of this nature may provide a superior
outcomes to a CIPR.
The existence of the age pension distorts the market for retirement solutions. A large portion of the
population may already have all the longevity protection they require, though it is unlikely that it is
being integrated into an effective retirement solution package. Additional components would be a
personalised consumption and investment plan which is updated regularly.
In Figure 2 we have updated our framework to incorporate some of these reflections.

Page 50 of 57
Figure 2: More detailed overview of the Australian market for retirement solutions.
Figure 2 differs from Figure 1 in two important ways:
1. It acknowledges the age pension as a product
2. It splits retirement solutions into a combination of ongoing guidance and products
We now look deeper through the lenses of product and guidance.
Product lens Presently the marketplace for non-government retirement product solutions appears small. Reasons
for this include:
Government age pension has dominant ‘market share’
Modest size of adviser channel
No access to default market (super funds are not creating integrated default solutions)
The outlook for new entrants appears unattractive, due to:
Modest market size – impacts ability to diversify liability book
Large establishment costs: education of planning channels and marketing
Guidance lens Here we break our assessment into the three categories of defaults, financial advice and personal
choice.
Defaults – there are few funds who provide retirement defaults which integrate longevity
products (whether the age pension and/or external product). Possible reasons include:
o ‘Rational’ argument, detailed at the start of this essay, where the operational risk-
reward payoff is greatest for the fast follower approach
o Uncertain regulatory environment around retirement solutions
o Operational capital limitations combined with a regulatory / industry focus on fees.
This links in with the concept of operational peer group risk

Page 51 of 57
o Capability gap – historically super fund business models have focused on account
administration of relatively simple products, investment and insurance. The design
of complex retirement solutions may require new skills at the trustee and executive
level
Financial advice – should naturally have strong capability in the development of plans which
incorporate solutions. And a number of advice groups do use the product solutions detailed
in Figure 2. However:
o Not all advice clients want risk management. Higher net wealth clients may be more
focused on wealth creation, and possibly view longevity risk as something which will
only impact the size of the bequest
o The tools used by advisers may struggle to display the true benefits of longevity
product solutions. For instance, many advice tools are based on deterministic
(returns are assumed certain and age of death is assumed to be known) rather than
stochastic analysis
o The concepts of stochastic assessment and risk management are complex and not all
advisers may be confident in their understanding and ability to explain to their
clients
Personal choice – this market is likely small and people face a complex set of problems, the
same as those which some financial planners find difficult to address. Additionally:
o Many individuals have low levels of financial literacy (see Agnew et al (2013)),
though we are less clear around whether the people who make personal choices
have higher financial literacy
o Additionally, they are not well served in terms of guidance tools. The guidance tools
provided by super funds generally have limited capabilities (see Essay 10 for further
discussion)
Overall, our assessment is that the range of solutions available appears adequate, especially if you
include the age pension. Guidance is the biggest issue, in essence the market failure, particularly
with respect to default design.
Causes of market failure An assessment of traditional causes of market failure:
Positive externalities7: advanced retirement solutions are likely to reduce the demands on
the age pension, and increase the confidence of retirees to consume.
Negative externalities: the development of products by individual super funds will incur
development costs which would need to be shared across the fund (for profit-for-member
funds) or be recovered other ways (for-profit funds).
7 An externality is an effect on a third party that is caused by the consumption or production of a good or service.

Page 52 of 57
Lack of public goods8: there is no direct public goods problem. But there is a problem which
motivates similar free rider challenges: the high development costs and risks associated with
developing a complex retirement solution. The uncertain regulatory environment adds
further risk. Public goods issues may arise through the inability to protect intellectual
property rights. This aligns with the “fast follower” industry case study described previously.
Underproduction of merit goods9: quality retirement solutions could be considered a merit
good with societal benefits.
Overprovision of demerit goods10: further choice options when we have 40,000 could be
considered overprovision of demerit goods. The case for integrated retirement solutions
being a de-merit good is tied to ‘choice overload’ when applied to consumers with low
financial literacy. However, if the main channel for intermediation of retirement solutions is
through defaults then choice overload is less of an issue.
Abuse of monopoly power: no clear case for abuse of monopoly power, as the market
structure of superannuation is not strictly a monopoly.
In summary the causes of the market failure could be viewed as: a failure to recognise positive
externalities and an agent-based ownership of negative externalities (a free-rider position created
via a “fast follower” approach).
Solutions to the guidance challenge Two solutions have been explored by Treasury:
1. Comprehensive Product for Retirement (CIPR (2016)): this considered the mandatory
development by super funds of a default-style opt-in retirement solution. We assess the
proposal would have only little benefit in practice due to the prescriptive nature of the
design requirements and the opt-in nature of the product (see Bell (2017) for further
critique). If it allowed the age pension to be recognised as the longevity solution outcomes
would be improved.
2. The Retirement Income Covenant (RIC (2018)): details the proposed introduction of a
retirement income covenant in the Superannuation Industry (Supervision) Act 1993 which
would require trustees to develop a retirement income strategy for their members.
A more extreme solution would be a national default retirement scheme. The issue with an idea of
this nature (for example Bell (2017)) is that it would not interact well with the existing age pension,
meaning that some people would likely be over-insured for longevity risk.
8 Public goods are goods where the total cost of production does not increase with the number of consumers. As an example of a public good, a lighthouse has a fixed cost of production that is the same, whether one ship or one hundred ships use its light. Public goods can be underproduced; there is little incentive, from a private standpoint, to provide a lighthouse because one can wait for someone else to provide it, and then use its light without incurring a cost. 9 A merit good is a private good that society believes is under consumed, often with positive externalities. For example, education, healthcare, and sports centres are considered merit goods. 10 A demerit good is a private good that society believes is over consumed, often with negative externalities.

Page 53 of 57
A fund-led solution would permit greater tailoring to individual member requirements but also
potentially generate a large dispersion in the quality of solutions across super funds, hence a ‘lottery
effect’ (explored in further detail in Essay 8). This could be partly mitigated by minimum standards
prescribed through policy, a clear objective, and ongoing assessment by APRA and research ratings
groups.
Finally, greater provision of retirement guidance tools may have some impact, but likely limited.
Many people choose not to engage and have low financial literacy, so even a well-designed
educative tool may have only limited take-up.
Conclusion There is a strong case that market failure exists in retirement solutions. Retirees are not being
provided the best solutions. This isn’t necessarily a component product failure since the age pension
provides a significant foundation. Rather guidance, specifically in the area of defaults which
aggregate longevity solutions, account-based pensions, and provide periodic updates on the
appropriate consumption and investment strategy. In aggregate the superannuation industry is
failing to acknowledge the positive externalities that arise from well-designed retirement default
solutions. The ‘rational’ view seems to be to adopt a ‘fast follower’ approach. If all funds adopt this
same line of thinking we end up with market failure.
We view the proposed Retirement Income Covenant as having greater potential impact than the
proposed CIPR framework. We think there are a range of other industry pressures relating to
regulatory oversight and research ratings assessment which could also have a positive impact.
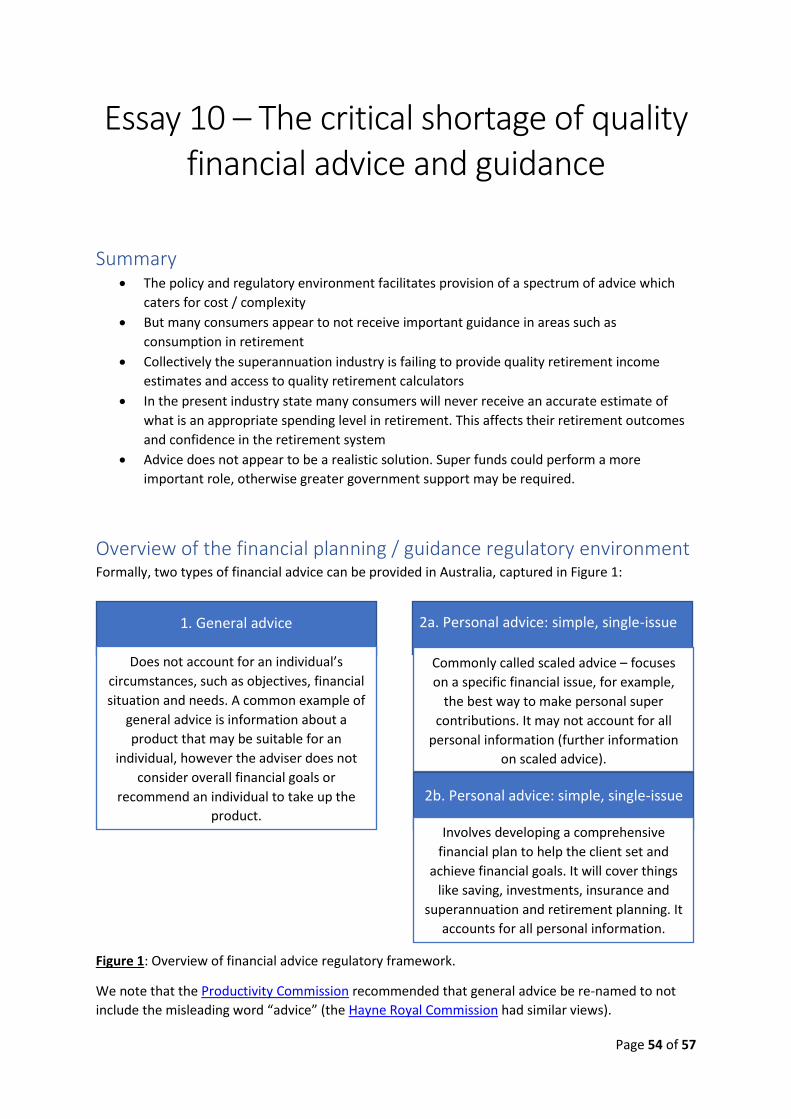
Page 54 of 57
Essay 10 – The critical shortage of quality financial advice and guidance
Summary The policy and regulatory environment facilitates provision of a spectrum of advice which
caters for cost / complexity
But many consumers appear to not receive important guidance in areas such as
consumption in retirement
Collectively the superannuation industry is failing to provide quality retirement income
estimates and access to quality retirement calculators
In the present industry state many consumers will never receive an accurate estimate of
what is an appropriate spending level in retirement. This affects their retirement outcomes
and confidence in the retirement system
Advice does not appear to be a realistic solution. Super funds could perform a more
important role, otherwise greater government support may be required.
Overview of the financial planning / guidance regulatory environment Formally, two types of financial advice can be provided in Australia, captured in Figure 1:
Figure 1: Overview of financial advice regulatory framework.
We note that the Productivity Commission recommended that general advice be re-named to not
include the misleading word “advice” (the Hayne Royal Commission had similar views).
1. General advice 2a. Personal advice: simple, single-issue
Does not account for an individual’s
circumstances, such as objectives, financial
situation and needs. A common example of
general advice is information about a
product that may be suitable for an
individual, however the adviser does not
consider overall financial goals or
recommend an individual to take up the
product.
Commonly called scaled advice – focuses
on a specific financial issue, for example,
the best way to make personal super
contributions. It may not account for all
personal information (further information
on scaled advice).
2b. Personal advice: simple, single-issue
Involves developing a comprehensive
financial plan to help the client set and
achieve financial goals. It will cover things
like saving, investments, insurance and
superannuation and retirement planning. It
accounts for all personal information.

Page 55 of 57
Additionally, various pieces of guidance are often available to consumers regarding their projected
consumption in retirement. These include:
1. Retirement projections:
a. A projection of retirement balance at retirement
b. A retirement income estimate
Both can be provided on a super fund member’s annual statement or in the form of
calculators. This information can be provided based on Class Order [CO 11/1227] Relief
for providers of retirement.
2. Various forms of calculators which allow for user input around assumptions. Exemption from
licensing requirements and conditions by ASIC Corporations (Generic
Calculators) Instrument 2016/207.
ASIC’s research suggests the terms “general” and “personal” advice are industry jargon and not well
understood by consumers.
In the absence of financial advice or guidance, consumers with low financial literacy tend to take
implicit guidance from account-based pension minimum drawdown rules (Alonso-Garcia et al
(2018)) and default options (Bateman et al (2017)).
Provision of advice and guidance in practice The number of advisers has fallen and is projected to fall in the short to medium term (forecasts by
Adviser Ratings suggest from 21,500 in 2018 to 15,000 in 2024), due to increased education
standards, repeal of grandfathered commissions (based on recommendations of Hayne Royal
Commission), and challenges to vertically integrated business models. According to ASIC only 27% of
Australians have received personal financial advice, 12% in the last 12 months, while only 1% had
used digital advice (84% of survey participants hadn’t heard of digital advice). The main barrier to
greater advice take-up appears to be cost: 35% of those surveyed considered advice to be too
expensive, while 29% considered their own financial circumstances too limited for it to be worth
getting financial advice. Overall the survey suggested mixed confidence in financial advisers (11% a
great deal, 39% a moderate amount). Retirement income planning was the second most prominent
area of advice, behind advice on investments.
According to super industry researcher SuperRatings, 42% of super funds now provide retirement
projections in their member statements, up from only 34% in 2017.
Rice Warner observe that a third of super funds don’t have a superannuation projection calculator
on their public website. Of the funds that do, about one fifth of those redirect the member to ASIC’s
MoneySmart calculator instead, losing the opportunity to engage their members. Rice Warner
identify many calculators as being very simple – only accommodating an individual (rather than
couples), ignoring the age pension, or being deterministic without showing the range of outcomes of
a stochastic model.

Page 56 of 57
Limitations of retirement income estimates Though they have some engagement value (as identified by CEPAR), standard retirement income
estimates could be quite misleading due to modelling techniques and assumptions.
First, the models are deterministic; they provide a point estimate and do not explain to consumers
the range of possible outcomes. This can frame expectations and motivate decision-making without
awareness of the risk involved (e.g. if we assume, for simplicity, a normal distribution of outcomes,
then drawing down at recommended rates would statistically result in a high chance (approximately
50%) of outliving retirement savings).
Second, there are many substantial assumptions incorporated into the forecasts, including:
1. Investment returns – fixed at 3% regardless of provider or investment option
2. Inflation rate – fixed at 2.5%
3. Retirement age - 67
4. Constant superannuation contributions
5. Default placement into an account-based pension
6. Personal situation:
a. You have a partner
b. You and your partner own your house
c. You and your partner have no assets outside of super
d. Your partner is the same age
e. Your partner has an identical superannuation balance
Many calculators provided by super funds are basic and provide limited flexibility. An anecdotal
review identifies ASIC’s MoneySmart Retirement Planner as one of the more detailed calculators. It
addresses many of the issues detailed above. However, it remains a deterministic calculator, it
cannot account for the return assumptions of lifecycle strategies, has limited ability to account for a
varying contribution plan (only via career break functionality), and doesn’t allow for a broader range
of retirement solutions. It also does not allow for spending down non-super financial assets – an
important assumption in Grattan’s analysis; in effect consumers are not receiving guidance in a
consistent manner with how a leading policy advice is undertaking adequacy calculations.
There are also more complex issues which apply at a household level that are not considered, such
as joint mortality modelling and home equity release products.
The differences between a more considered retirement income estimate and ones available from
statements and calculators could significant, based on:
1. Inaccurate, assumption-based information about the member and their household (could
contribute to understatement or overstatement)
2. Modelling for deterministic outcomes which provides no safety buffer (via precautionary
savings), and hence would be an inappropriate course of action for any rational risk averse
person (this would contribute to overstatement)
Future challenges will also emerge, especially in the form of a large array of retirement solutions,
especially if CIPRs in current proposed form become reality (whereby financial planning software
may be required to model out a range of CIPRs, which may be complex combinations of underlying
building blocks).

Page 57 of 57
The permanently misinformed consumer In the present setting many Australians are will never receive appropriate guidance with respect to
an appropriate consumption level in retirement. Worse, they are likely to be misinformed and
provided consumption forecasts which in many cases will be overstated.
This has two important impacts:
1. If members take the calculations as guidance, many will overspend and exhaust their
retirement savings (this could be partly mitigated by receiving updated forecasts
periodically, assuming conditional mortality forecasting techniques are applied).
2. Loss of confidence in, and general frustration with, the retirement system. This may take the
form of overly conservative spending in retirement.
Additional challenges Additional challenges include, raised but not addressed in this essay:
The impact of cognitive decline on financial decision making (see for example Earl et al
(2013)) represents a challenge which may require human and trust-based guidance rather
than a digital solution
Possible solutions Possible solutions include:
More financial advisers – but advice is viewed by many as too expensive, and there is a
supply provision issue as well
Measures to improve the provision of guidance. Examples include:
o Through policy, such as making it a requirement for MySuper licensees to provide a
RIE
o Through regulatory encouragement. For example, the quality of guidance could be
included as part of APRA’s outcomes assessment and heatmap reviews
o Through industry competition, with active assessment by superannuation research
houses
A national solution which:
o Continues to build on the success of ASIC’s MoneySmart Retirement Planner and
continued development of a more detailed calculator
o Consideration of a government sponsored financial planning service, particularly in
the areas of scaled advice